|
|
|
|
|
|
Looking for trading ideas in US equities
|
|
|
For today's note I am going to be looking for some trading ideas in US equities. Don't get me wrong, I don't believe we have seen THE bottom and risks are incredibly high with pressure on the Fed to pause or hint they might and the G20 meeting this weekend where the best we can hope for is a friendly commitment to working out trade disputes with no details. My bigger concern is that the US is slowing and fast into late in the cycle. The S&P is flat on the year into the end of the
11th month despite the benefits from the new tax laws, repatriation, solid earnings growth, and massive buybacks. If the market can't show anything for those positive catalysts, then how will the markets react in 2019 when the comps get harder, the tax benefits fade, earnings growth slows? Corporate buybacks can't be relied upon to save the markets as many major companies have nothing to show but underwater average prices for the buybacks they did in the last 4 quarters.
December is a tough month to be negative and after the recent 10% pullback, the 2% average gain typically seen in December should be pretty easy. All bets are off with the S&P breaking 2625 (10 points lower than TDST green dotted line). And my view is this is either wave 2 of 5 on a 5 wave down move or wave 4 of 5 on a 5 wave down move depending on the market or stock. Wave 2 and 4 are short lived corrective up waves which should make another lower high followed by lower lows.
Let's get right into it as I made a bunch of changes to the Trade Ideas Sheet.
And if you are still having any issues logging on to the site, please let us know ASAP
|
|
|
|
|
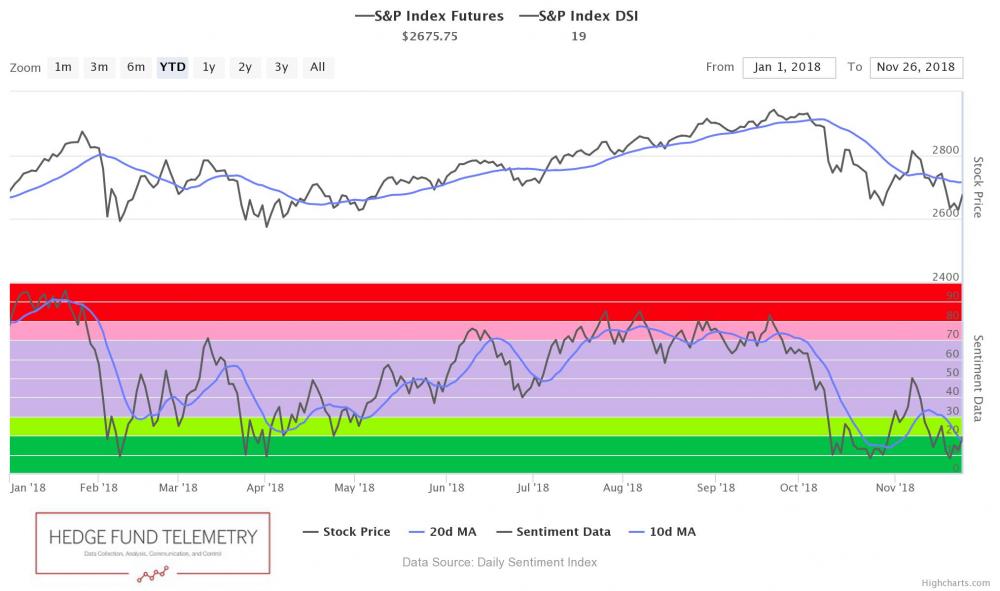
SPX bullish sentiment is at 19% off recent lows of 8%
|
|
|
|
|
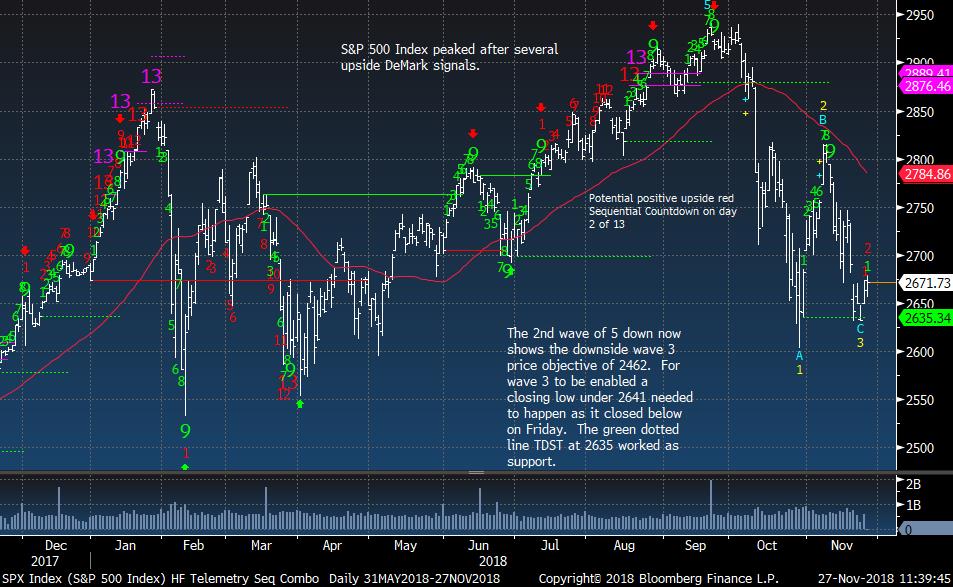
SPX daily with red Sequential upside Countdown. Use 2625 as a STOP
|
|
|
|
|
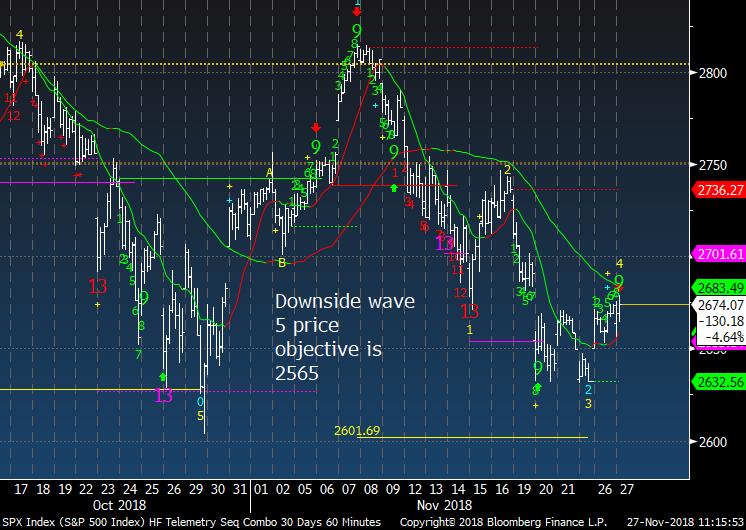
SPX 60 minute tactical time frame gives me conflicted pattern with a downside wave 5 lower
|
|
|
|
|
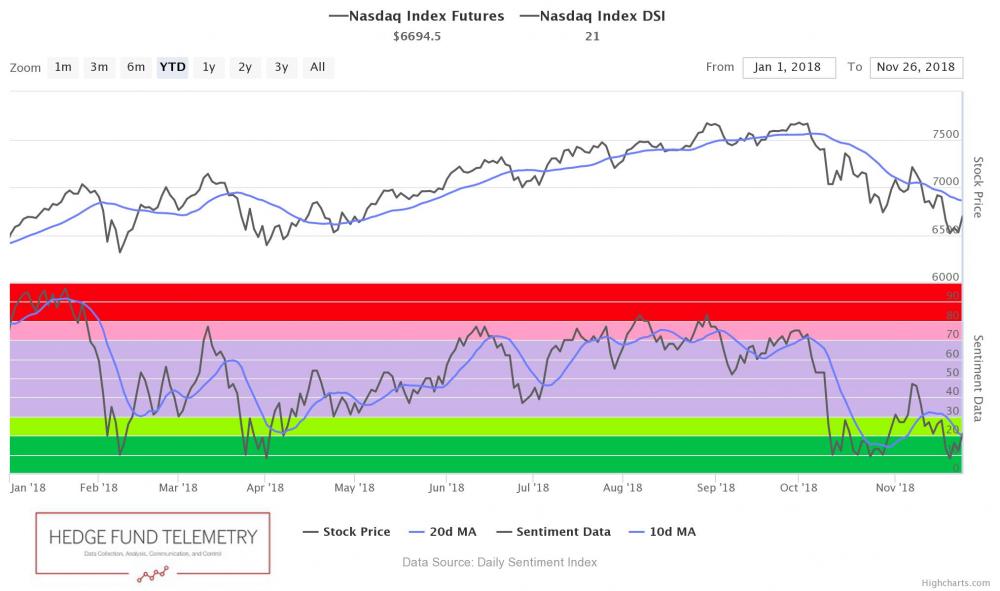
Nasdaq bullish sentiment is at 21%
|
|
|
|
|
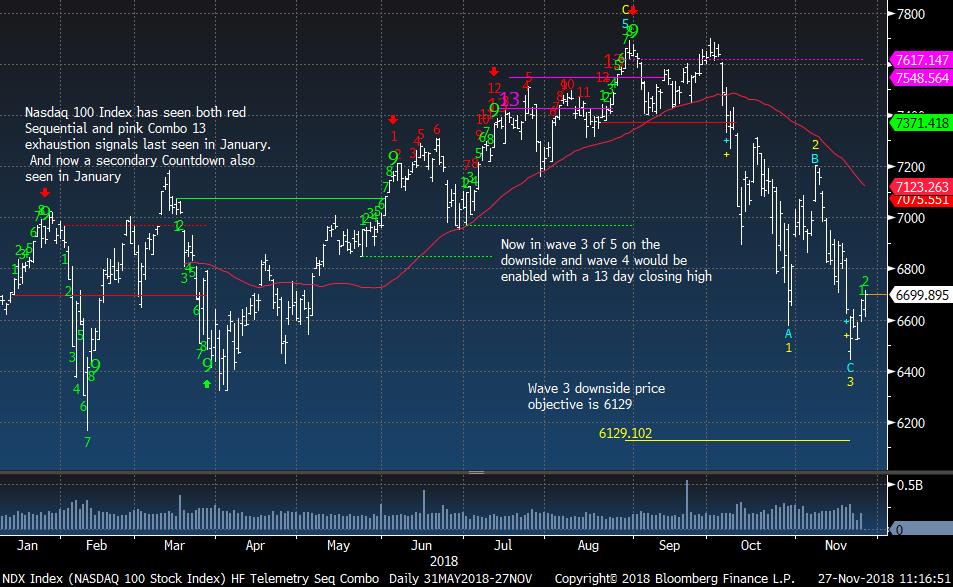
NDX Index daily does not have the red Sequential because it has to follow a green Setup
|
|
|
|
|
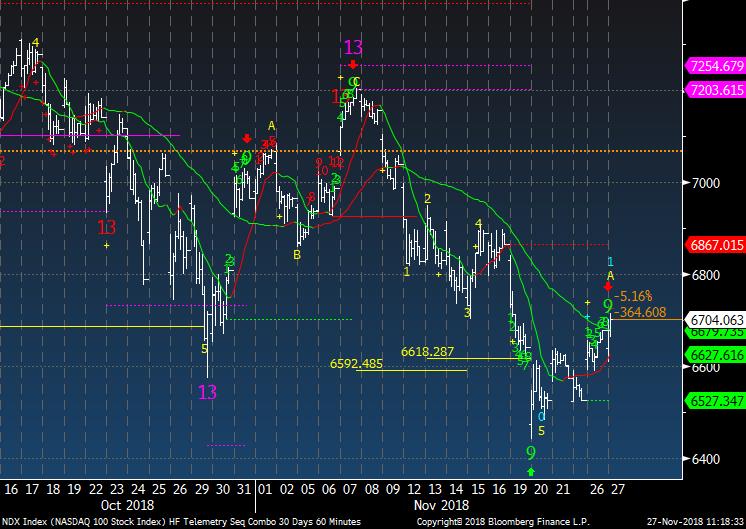
NDX 60 minute tactical time frame did get into wave 5 and this could be the 1st of 5 upside waves
|
|
|
|
|
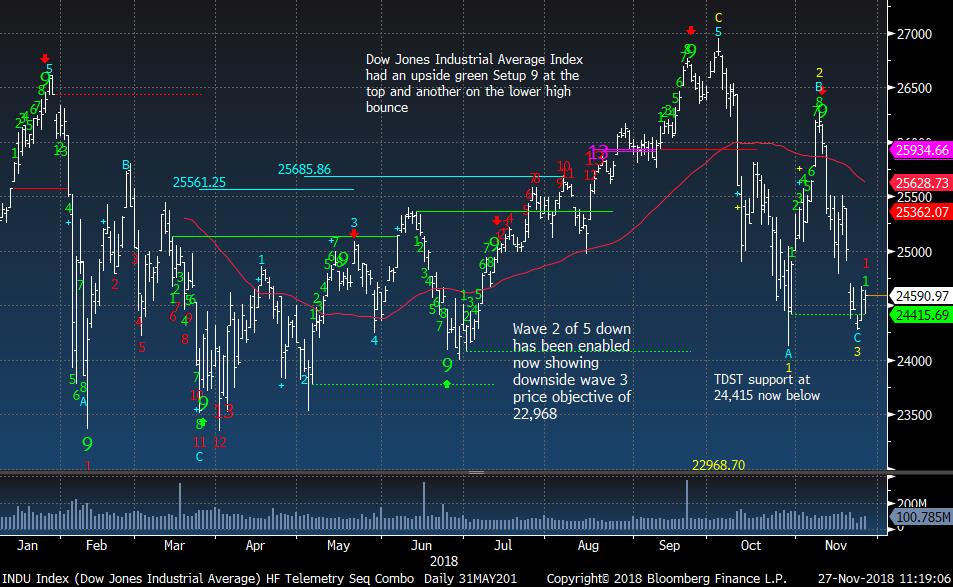
Dow Jones Industrial Average like the SPX has a red Sequential countdown. Use 24,300 as a STOP
|
|
|
|
|
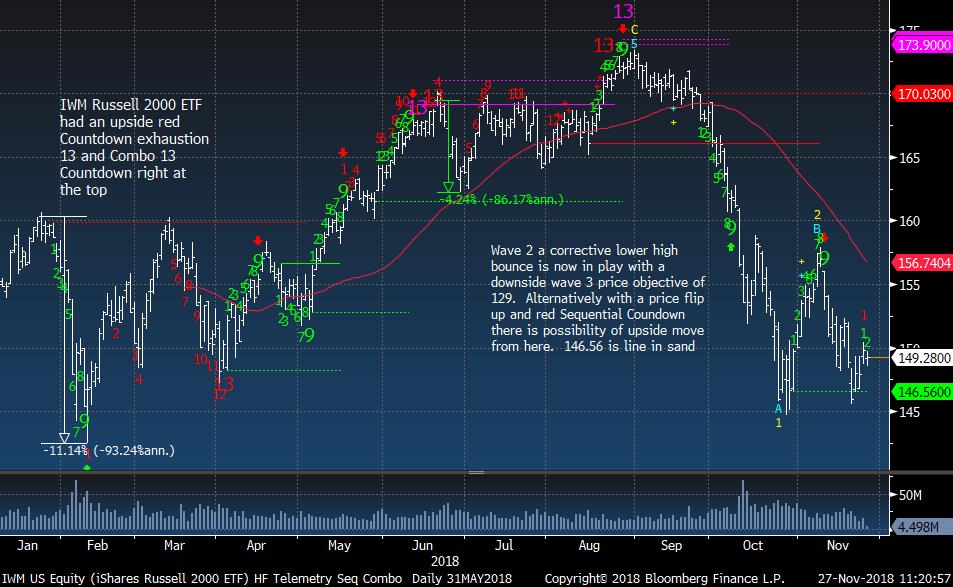
IWM Russell 2000 also has a red Sequential only on day 1 and use 146.50 as a stop if long
|
|
|
|
|
|
|
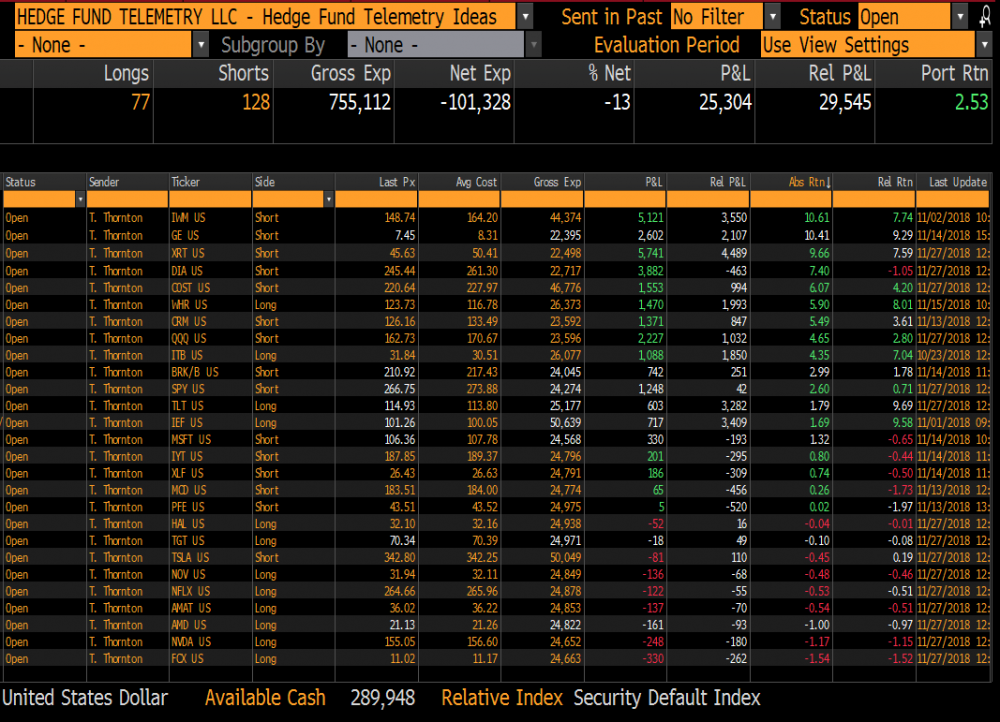
Hedge Fund Telemetry Trade Ideas
|
|
|
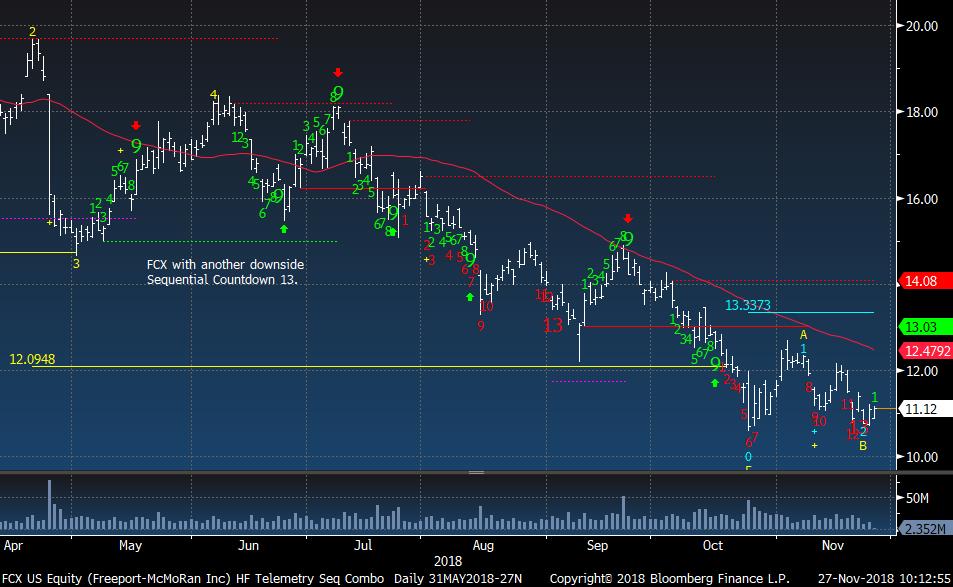
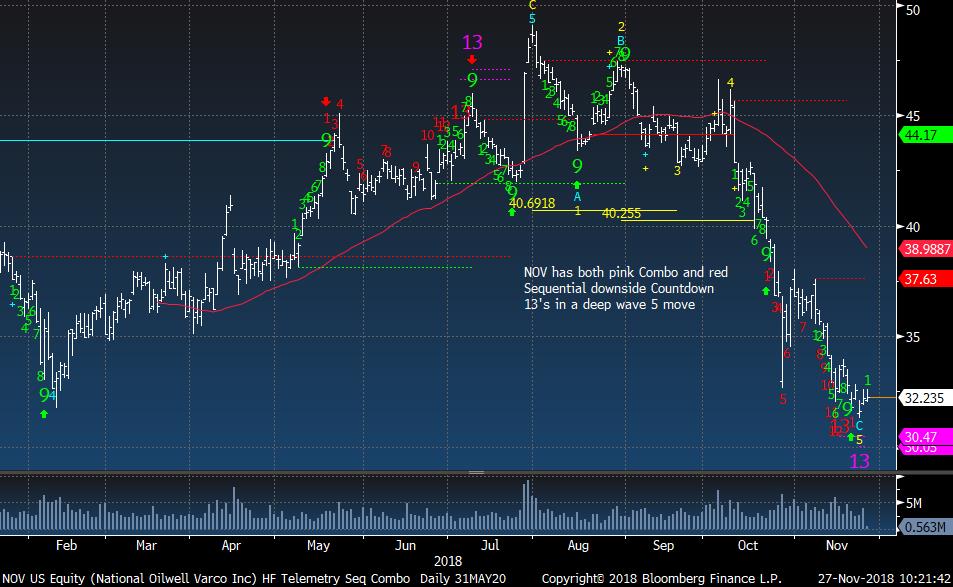
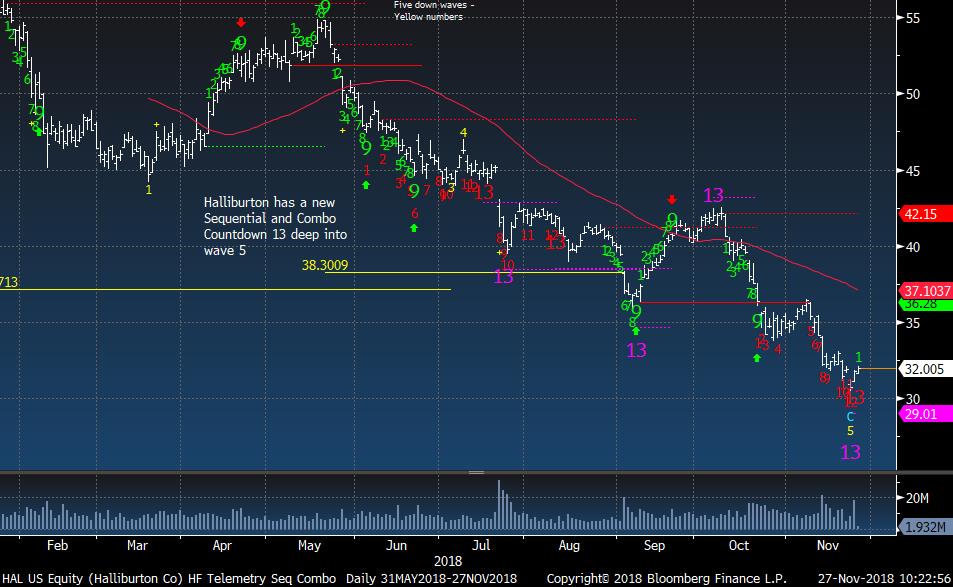
Trade Ideas Sheet - ADDING 2.5% ON ALL NEW LONGS WITH 5% STOP LOSS LEVEL FROM INCEPTION: TGT, AMAT, FCX, HAL, NFLX, AMD, NOV, NVDA (COVERED +22% AND GOING LONG)
DOUBLING SHORT POSITIONS TO 5%: COST, TSLA
CLOSING SHORT: AMZN +4%
REDUCING SHORT TO 2.5% FROM 5%: XRT +9.7%, DIA +7.5%, QQQ +4.75%, TLT +1.8%, SPY +2.75%
|
|
|
|
|
|
|
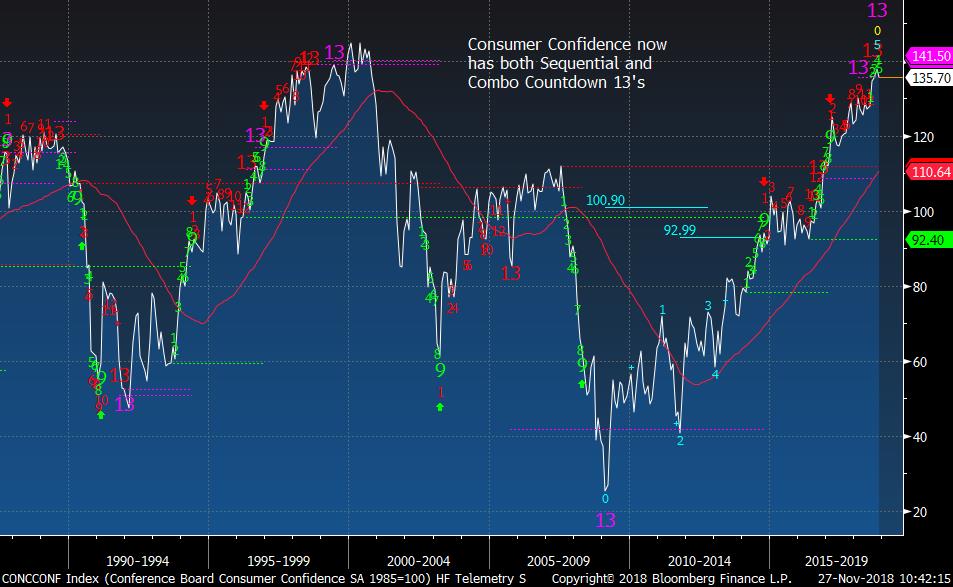
A top in Consumer Confidence
|
|
|
Consumer Confidence came out today at 135.7 down from the previous month of 137.9. This is the monthly with upside Sequential and Combo upside exhaustion signals
|
|
|
|
|
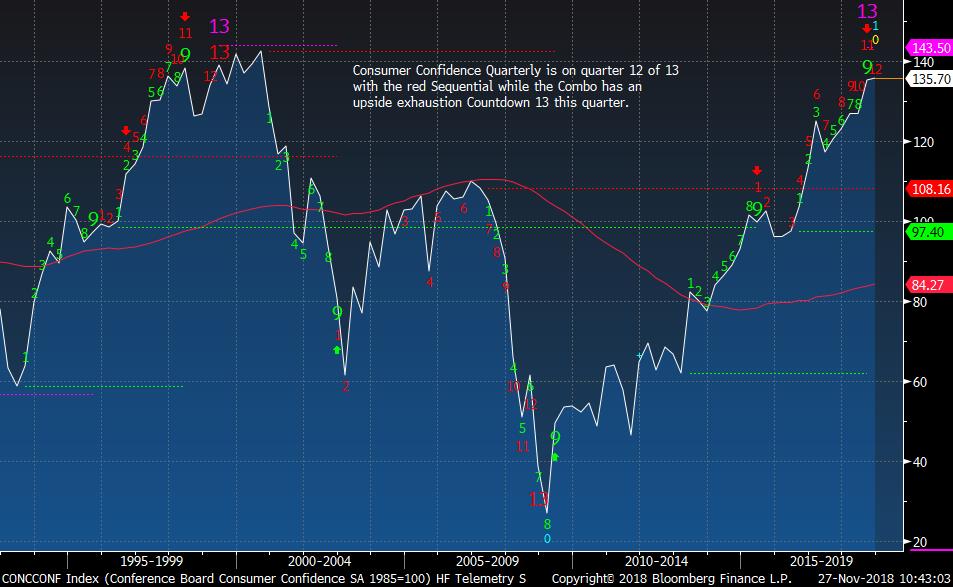
Quarterly has the Combo and will get the Sequential in January
|
|
|
|
|
|
|
Stocks I'm looking at in random order
|
|
|
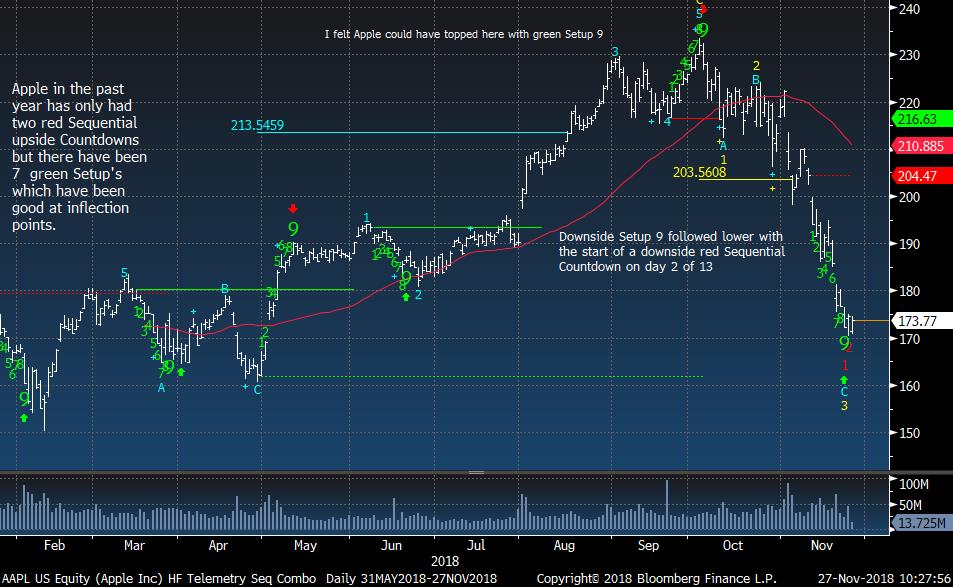
Apple should bounce but I'm not ready to buy it and when it does bounce it will be in a wave 4 of 5 thus a new lower low will likely happen
|
|
|
|
|
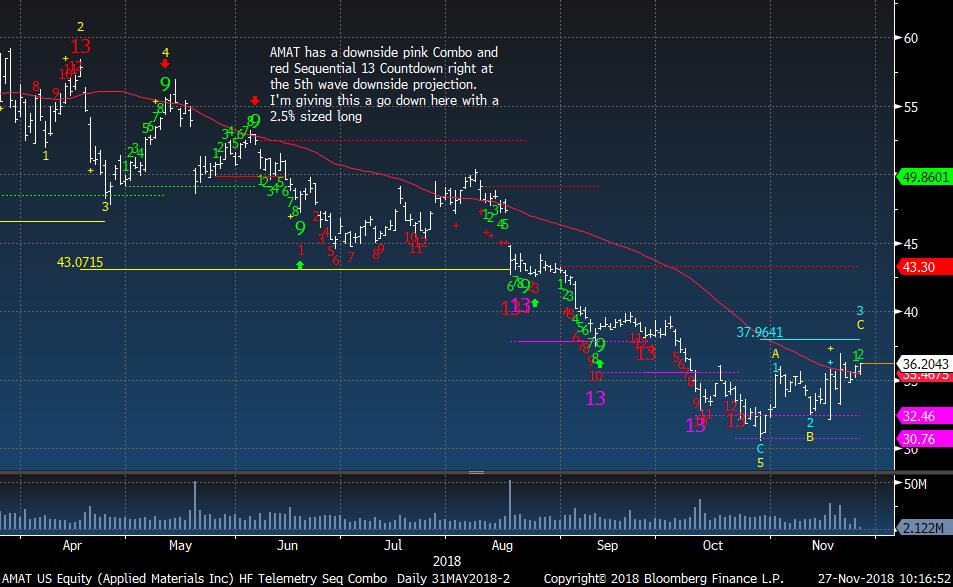
AMAT is the largest semiconductor capital equipment maker and has been blown up. Buying it as I like the base with a lot of bad news.
|
|
|
|
|
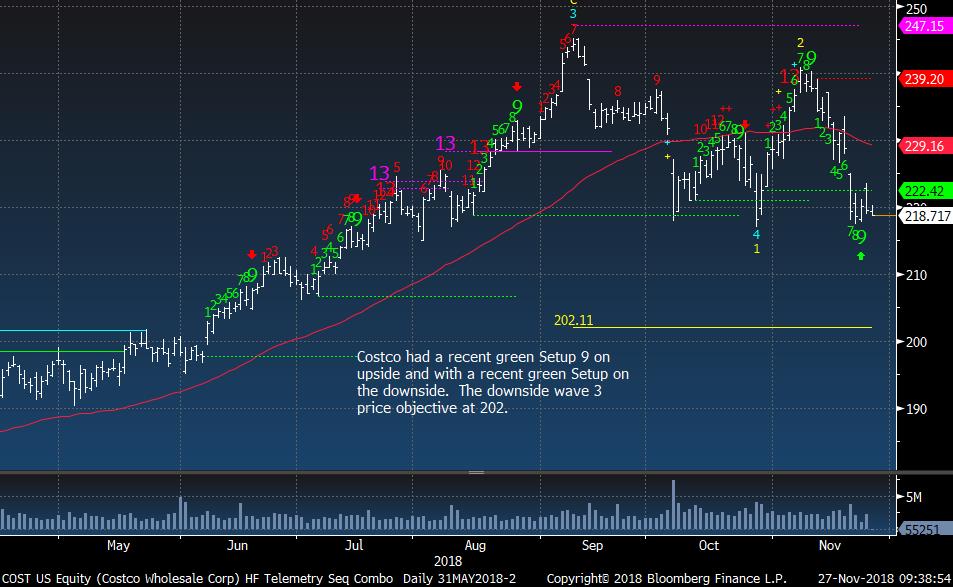
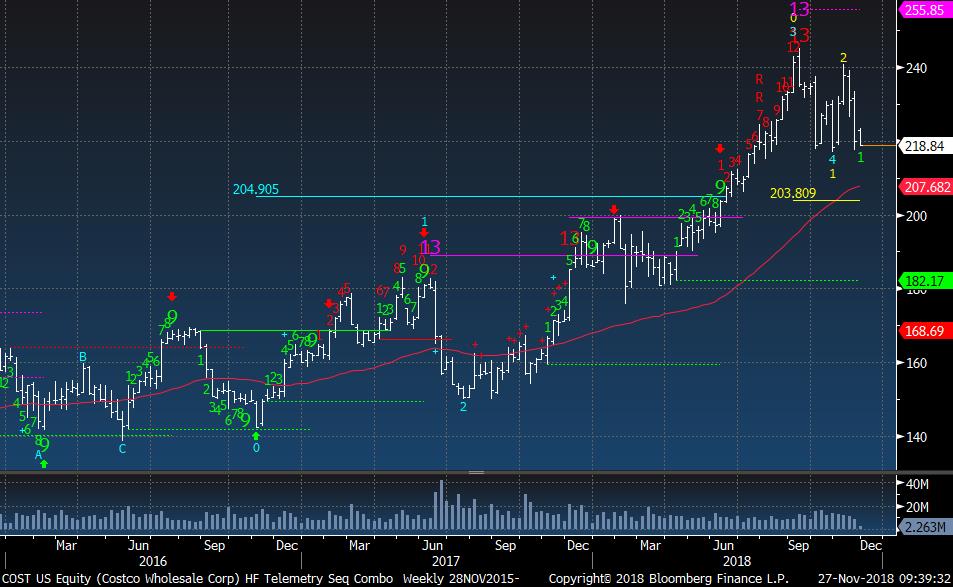
COST looks dangerous and I am doubling my short. I bet this breaks support
|
|
|
|
|
|
|
|
|
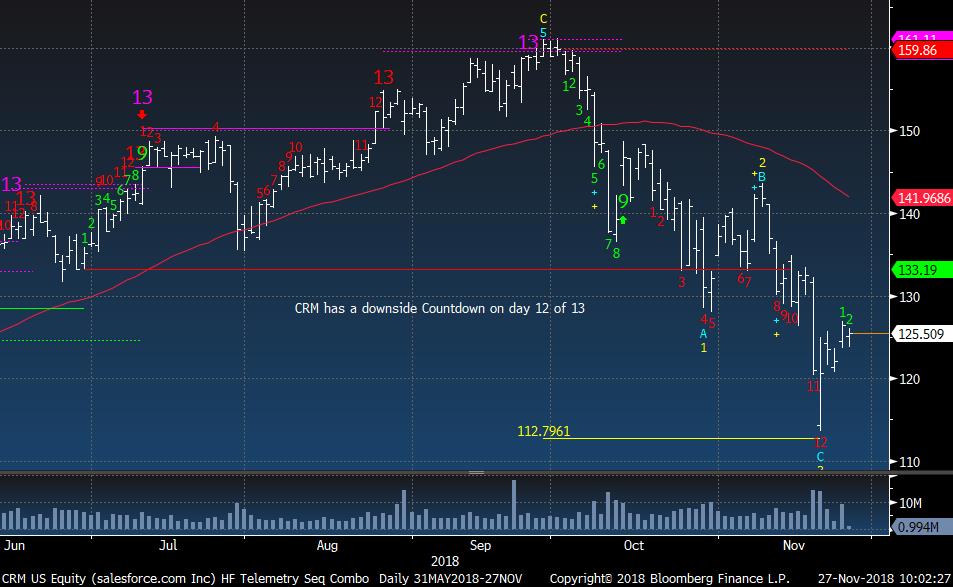
CRM reports this week and I'm staying short.
|
|
|
|
|
|
|
|
|
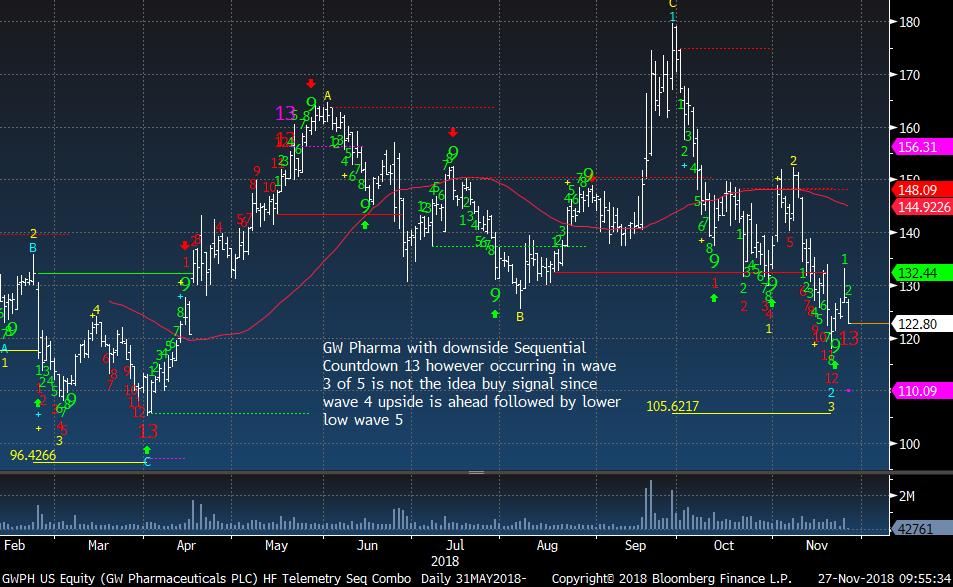
GW Pharma has a Countdown 13 in a wave 3 of 5 down moves. Doing nothing but this could bounce but stall below 150
|
|
|
|
|
NOV buying with this oversold duel 13's
|
|
|
|
|
|
|
|
|
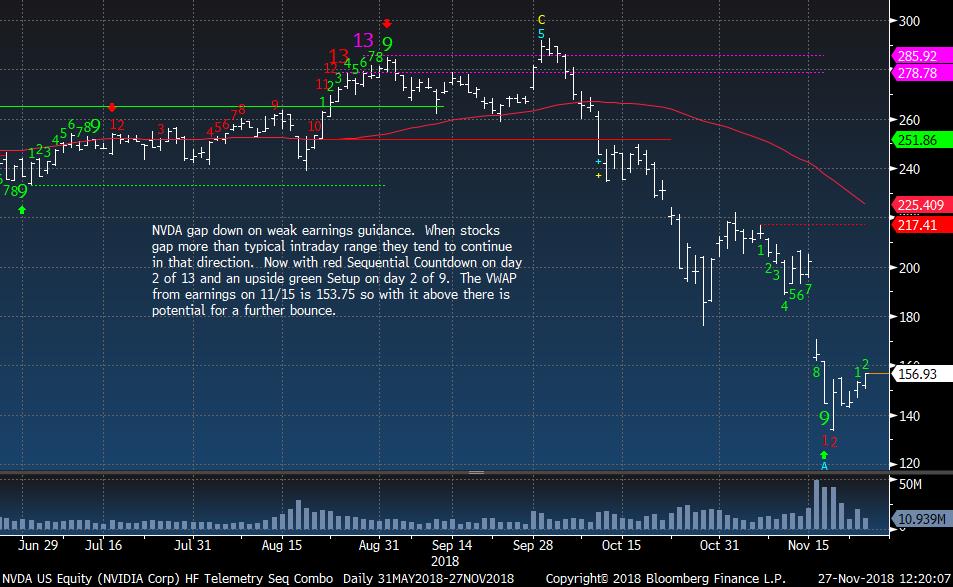
NVDA covering +22% and going long.
|
|
|
|
|
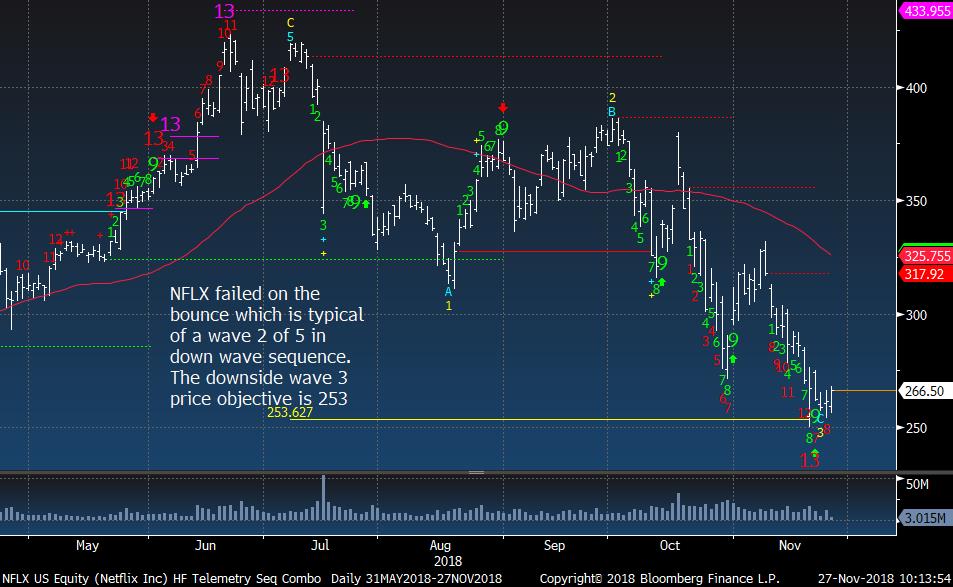
NFLX reached the downside wave 3 price objective I showed when it was near 400. Holding my nose and buying for a little short term trade
|
|
|
|
|
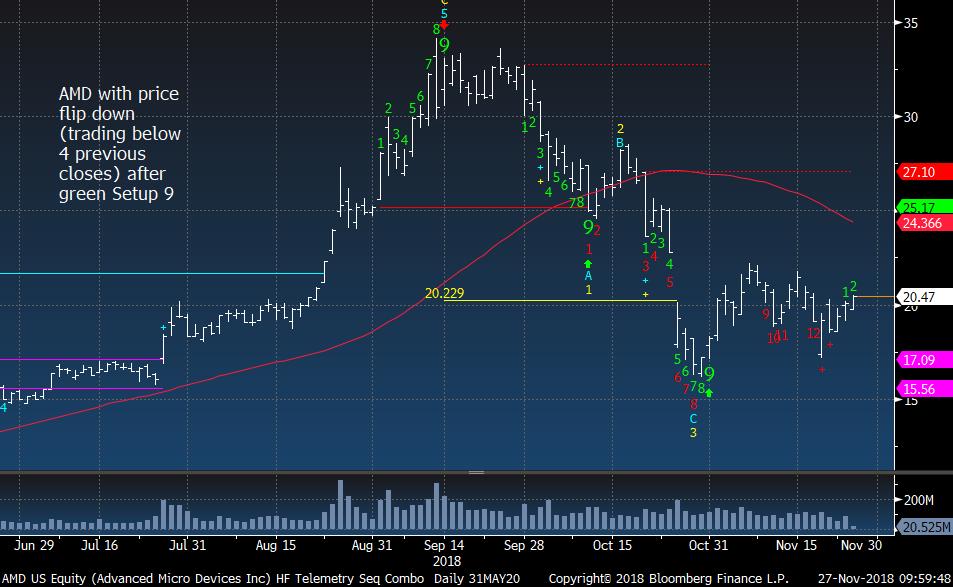
AMD didn't get the 13 but I'm buying it as it could move with this base. It will be a lower high wave 4 so it's unlilkely this will last long
|
|
|
|
|
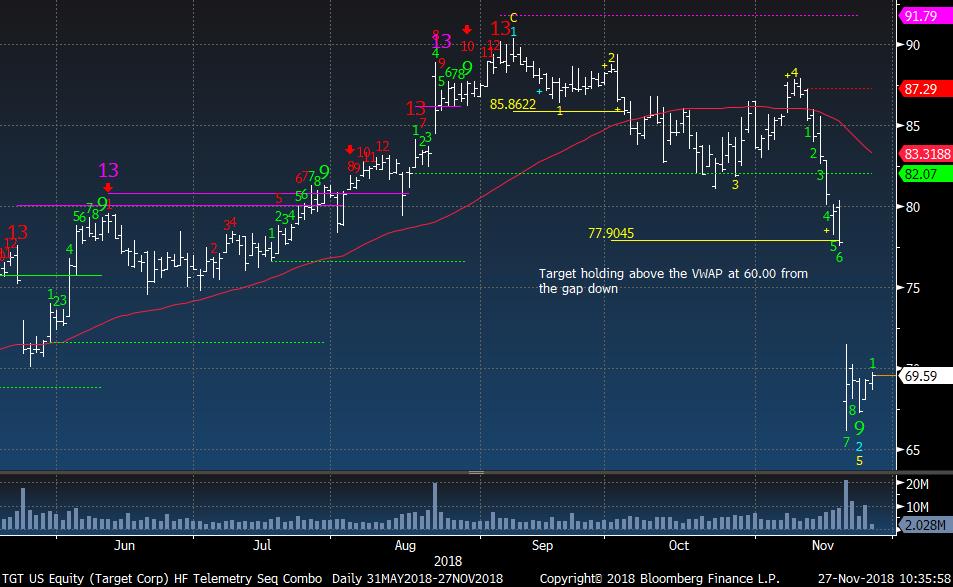
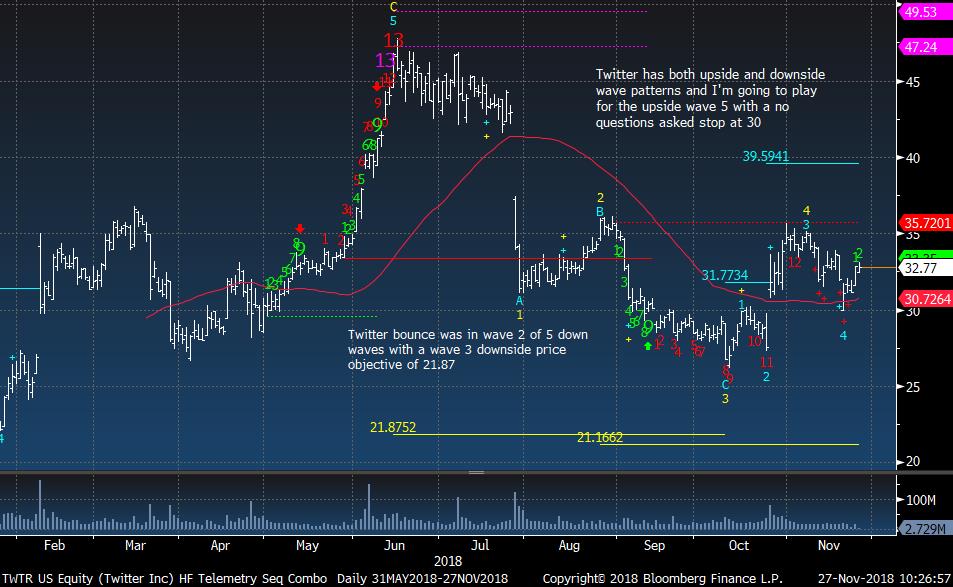
TGT holding over vwap from drop. Buying a little
|
|
|
|
|
|
|
|
|
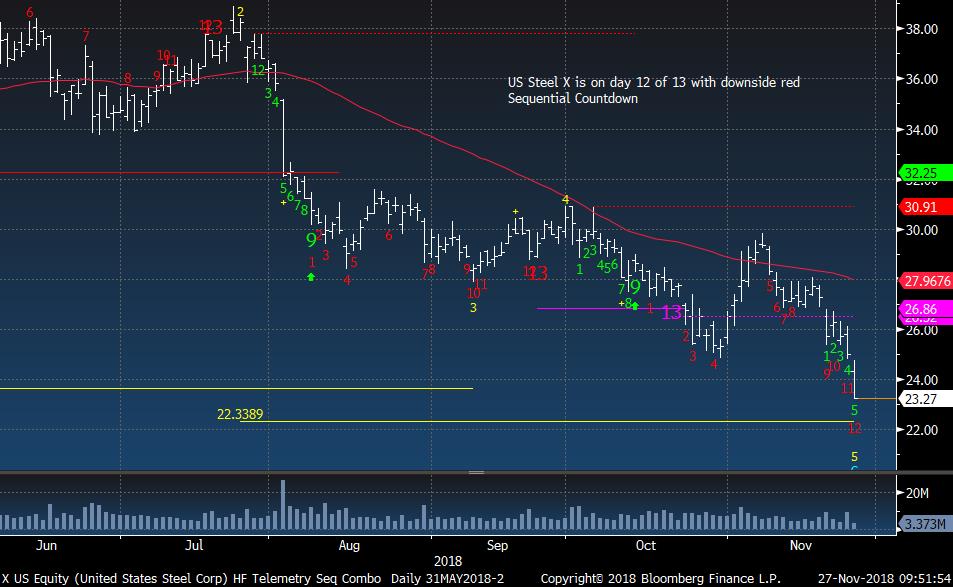
US Steel buying a little AND it could be down again tomorrow and it will get the 13 Countdown
|
|
|
|
|
|
|
PPO Monitor - Percentage Price Oscillator
|
|
|
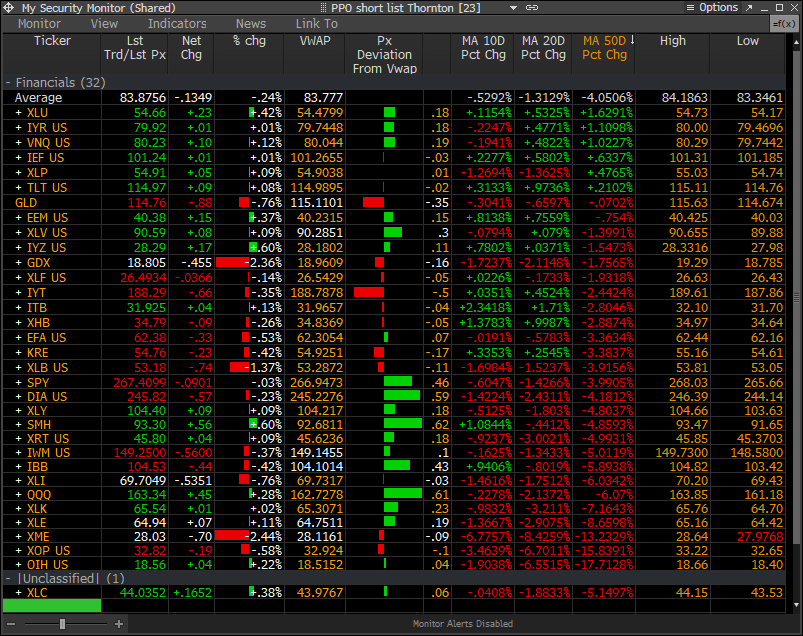
The PPO Monitor is a proprietary monitor developed to force rank Indexes, Sectors, and Stocks. It ranks top down by strongest to weakest by percentage above/below the 50 day moving average. Shorter term signals can be seen when the 10 and 20 day moving averages turn up (green) or down (red) which often are followed by the 50 day moving average. This is useful to watch for historically overbought/oversold percentage above/below the 50 day moving
average. It is non correlated with the DeMark Indicators however we have found upside/downside exhaustion signals often occur when something rises to the top or drifts to the bottom of the monitor - increasing the timing aspect. We share this monitor with clients with Bloomberg Terminals. An added feature is that each market/ETF can be expanded with each component force ranked in the same way. A couple other features include price deviation from intraday VWAP (useful for intraday reversals) and new 20 day highs/lows on right side. Please inquire if you would like to be permissioned to use the PPO Monitor.
Today's highlights: Different from yesterday as a lot of sectors are down but over vwaps
|
|
|
|
|
|
|
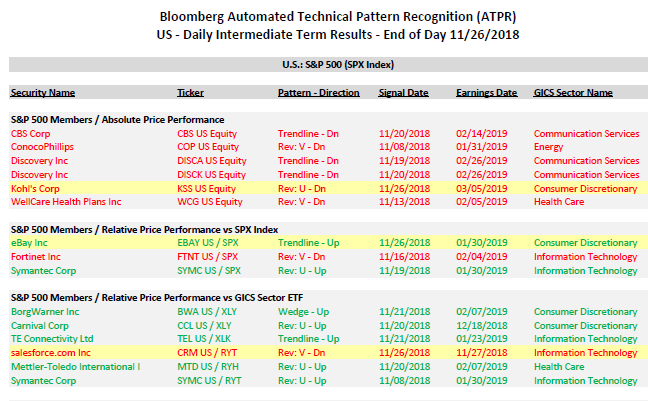
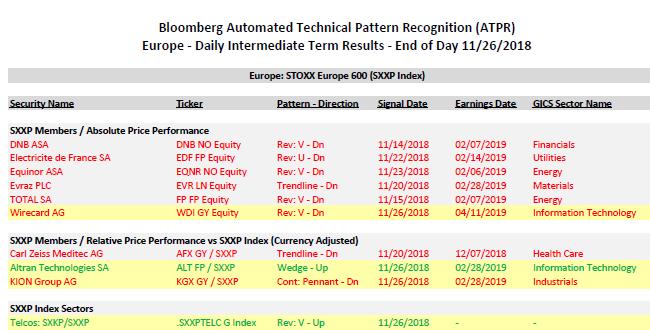
Bloomberg Automated Technical Pattern Recognition Screens
|
|
|
S&P 500 Members/Absolute Price Performance and Relative Price Performance vs S&P 500 and Sector ETF's. ETF's vs Index Sectors. Pair Trades. Long side is first symbol, short side is second symbol. If you would like a PDF from Bloomberg with full details of how this is formulated, please email.
|
|
|
|
|
|
|
|
|
|
|
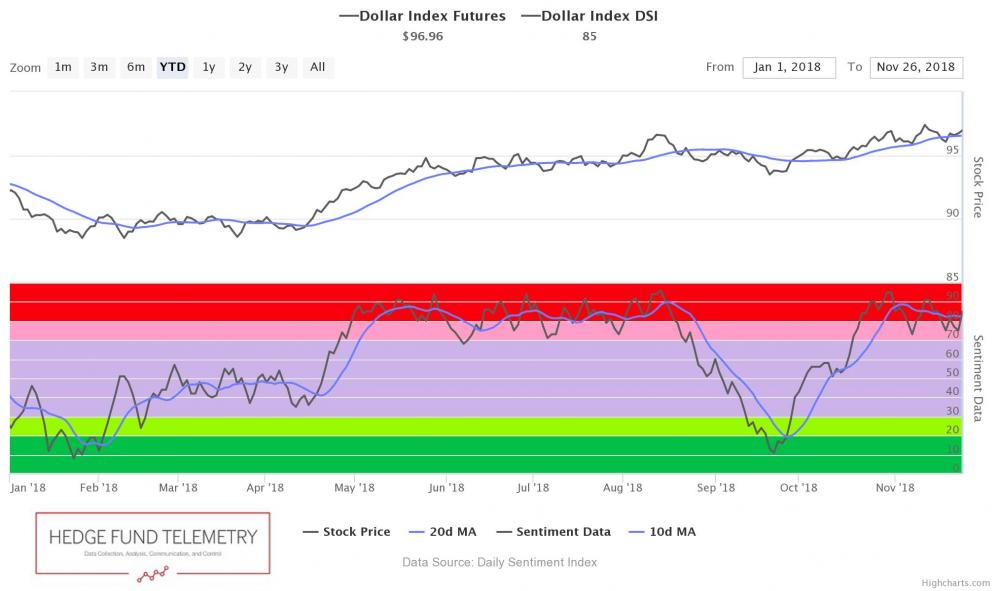
US Dollar bullish sentiment is at 85% and remains extreme
|
|
|
|
|
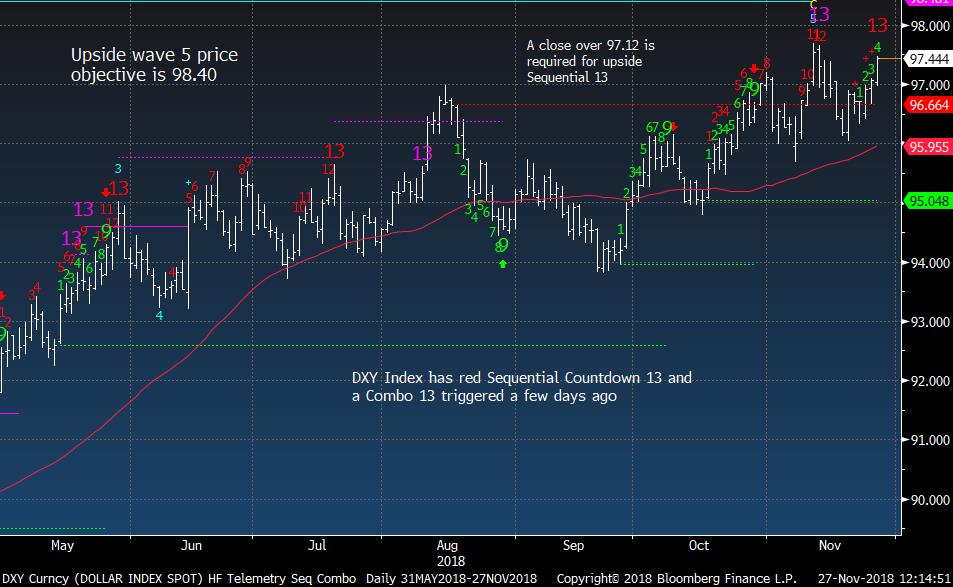
US Dollar Index with upside DeMark Sequential Countdown 13
|
|
|
|
|
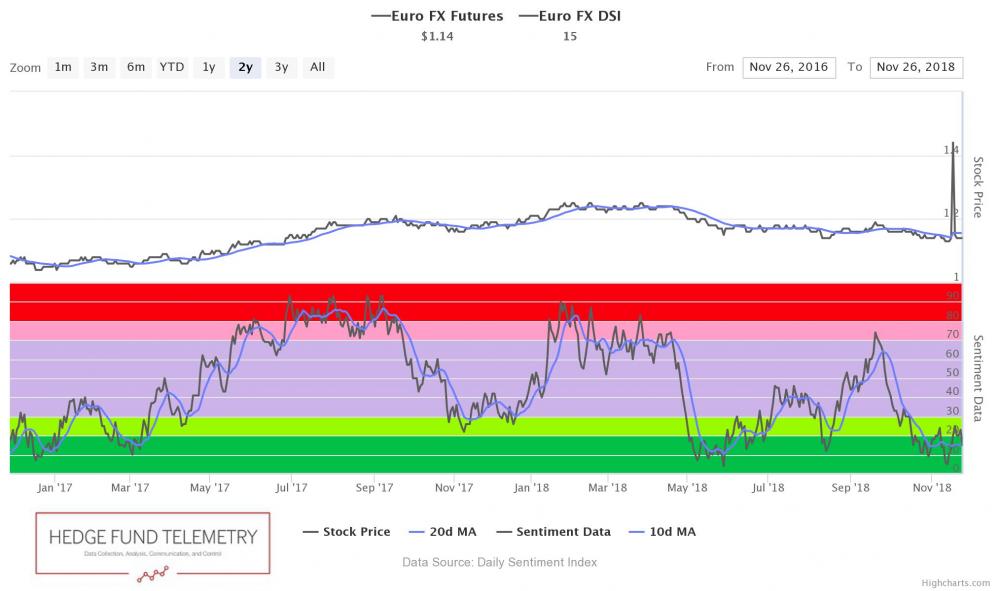
Euro bullish sentiment is at 15%
|
|
|
|
|
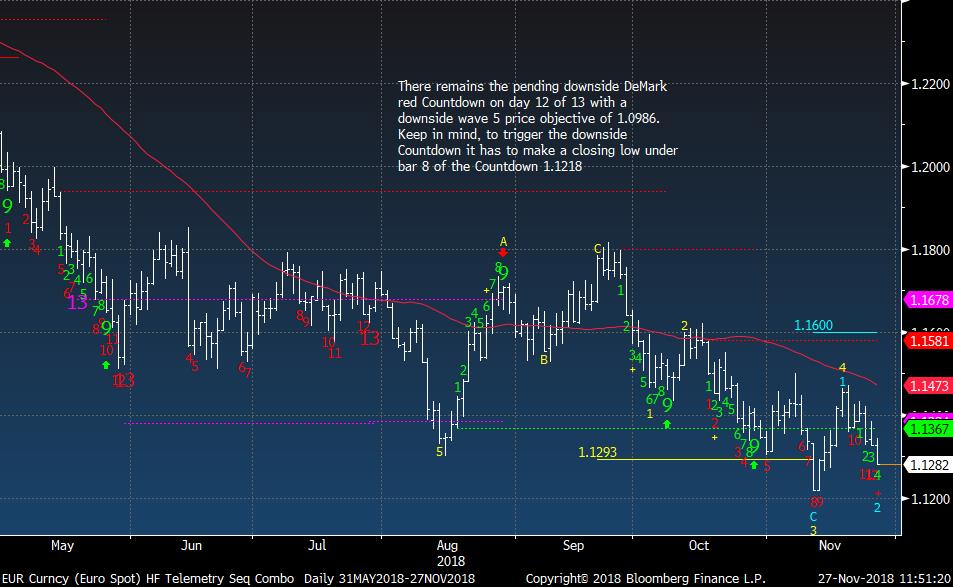
Euro Spot still needs a little lower for the Countdown 13
|
|
|
|
|
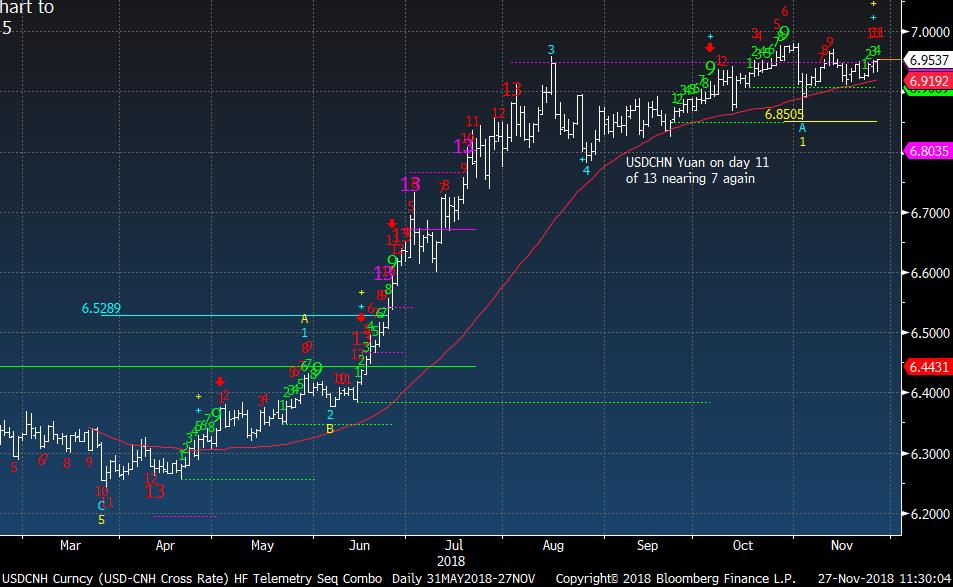
Yuan sneaking towards 7 again
|
|
|
|
|
|
|
|
|
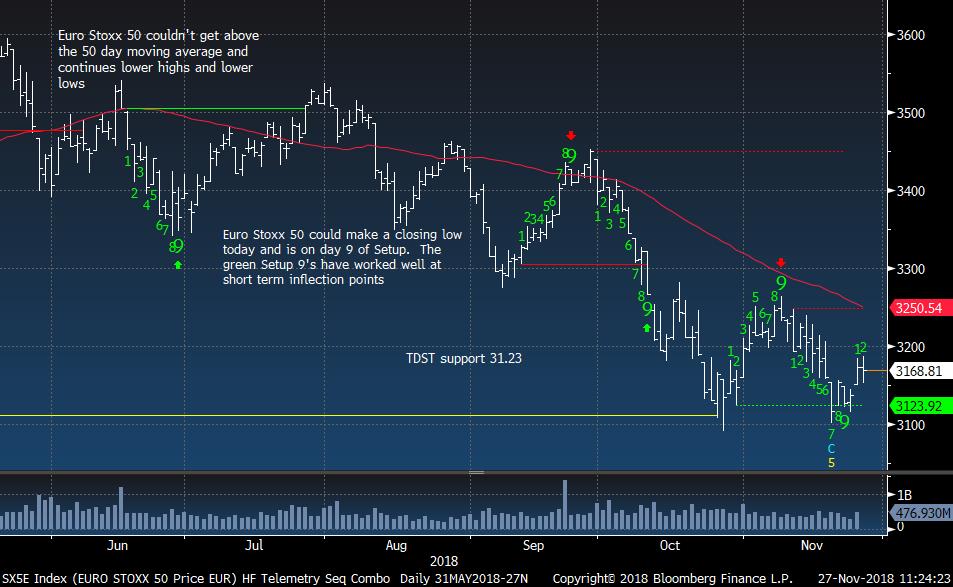
Euro Stoxx 50 sideways still.
|
|
|
|
|
|
|
|
|
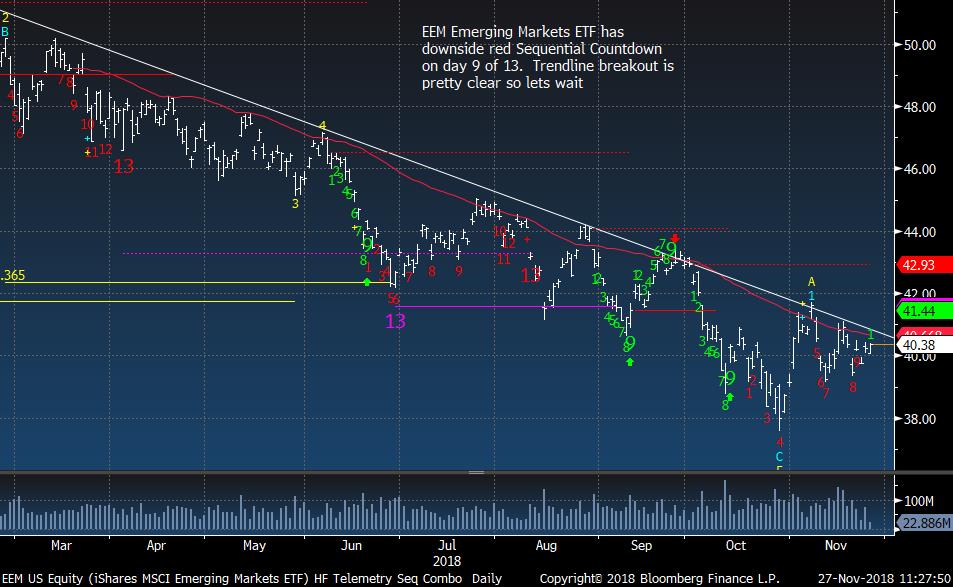
EEM Emerging Markets ETF still choppy sideways below trend line
|
|
|
|
|
|
|
|
|
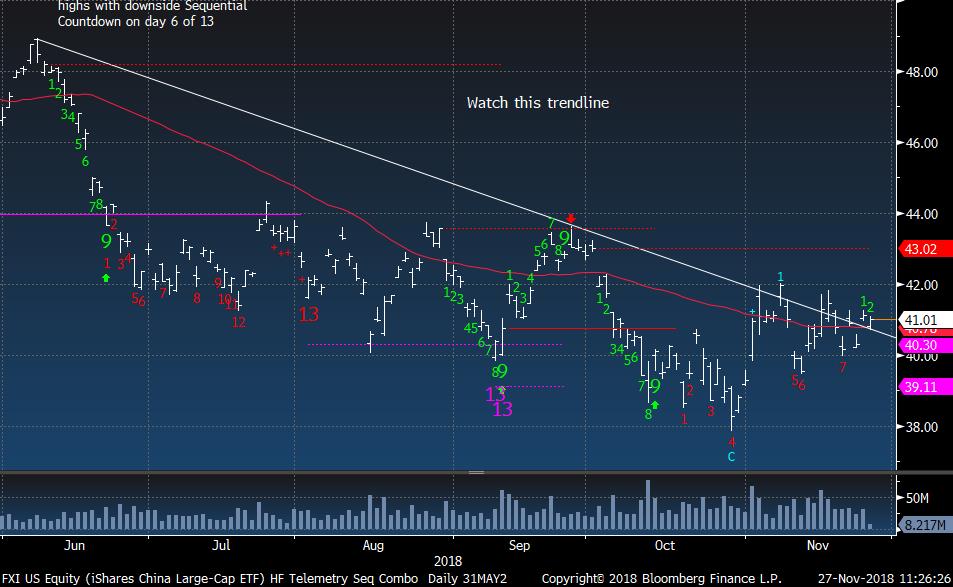
FXI slightly above trend line but not downside exhaustion yet
|
|
|
|
|
|
|
|
|
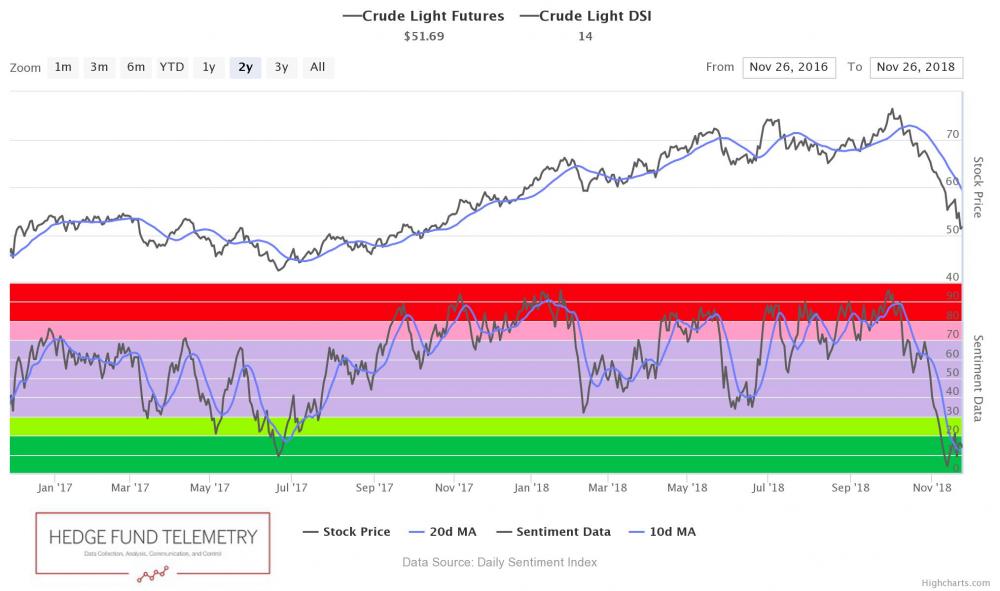
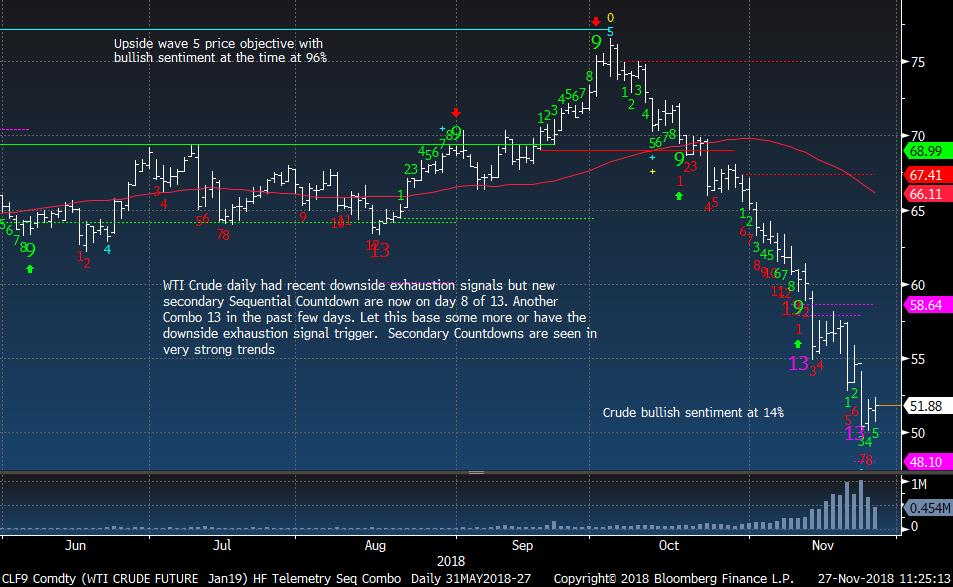
Crude bullish sentiment is at 14%
|
|
|
|
|
WTI Crude Futures still sideways
|
|
|
|
|
|
|
|
|
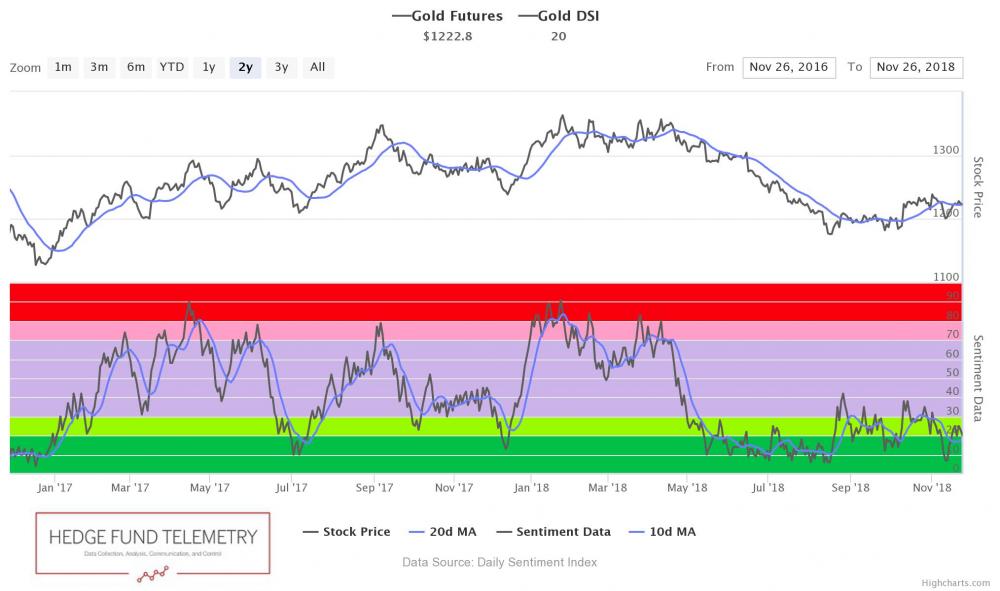
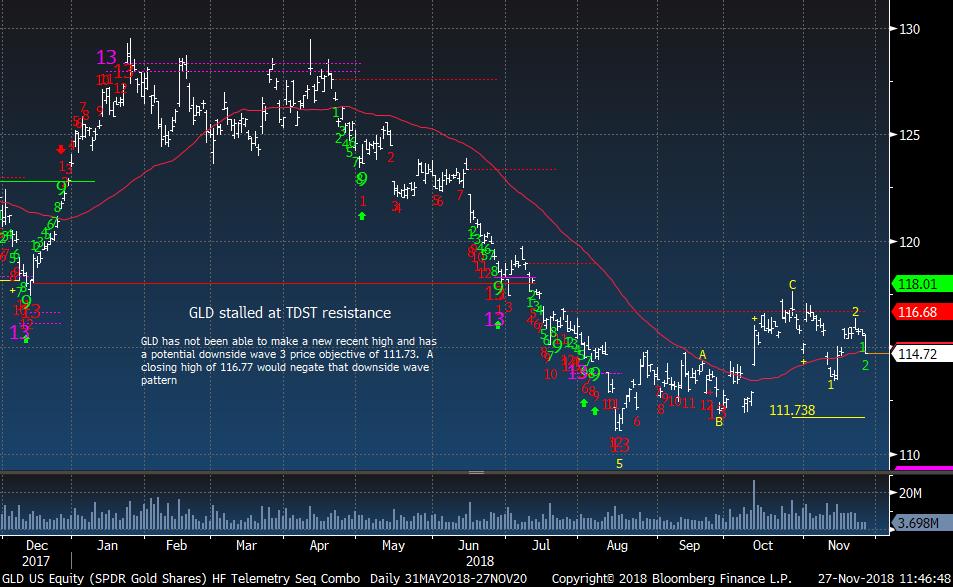
Gold bullish sentiment is at 20% and remains in this low range
|
|
|
|
|
|
|
|
|
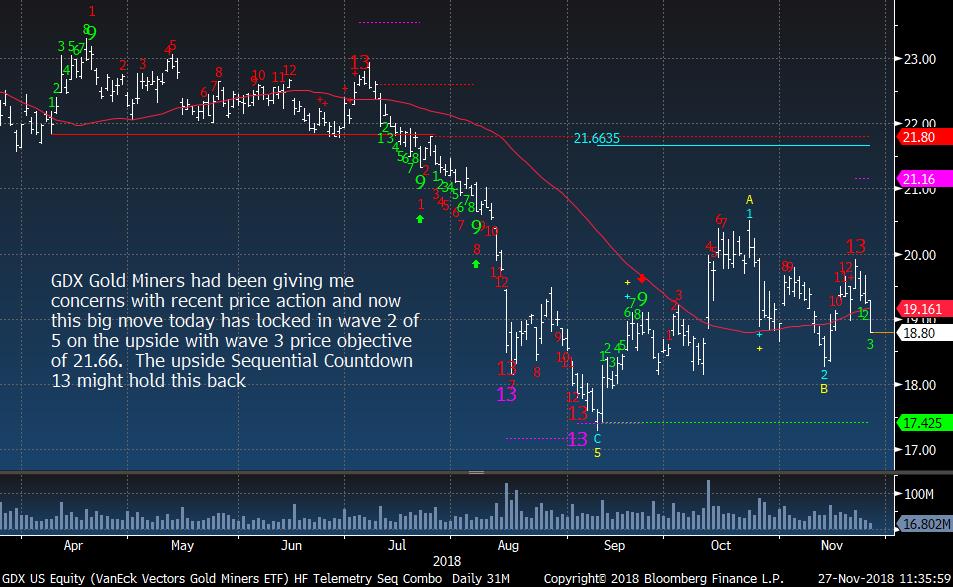
Gold Miners GDX ETF recently sold the long with the upside Countdown 13
|
|
|
|
|
|
|
|
|
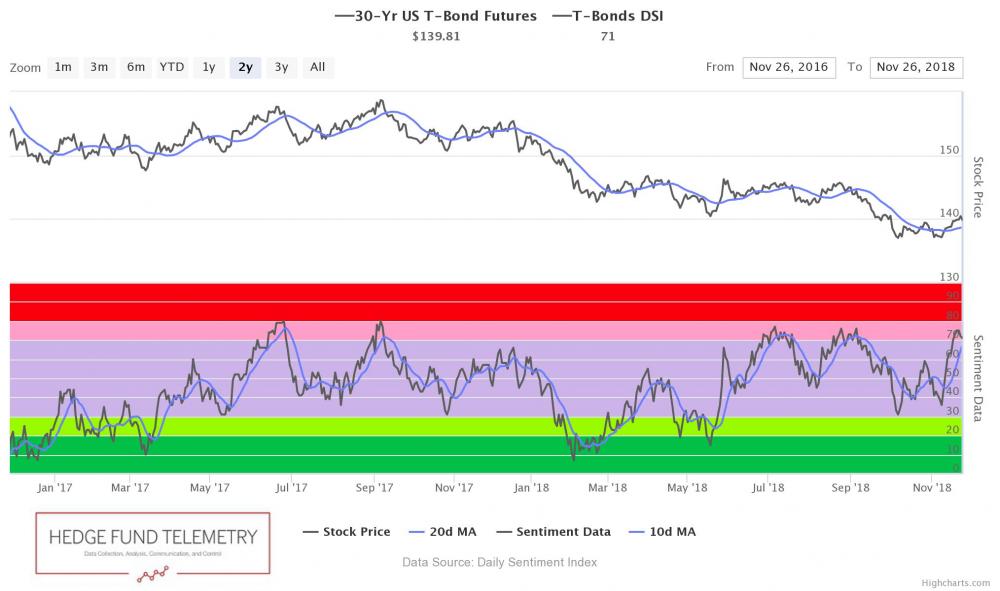
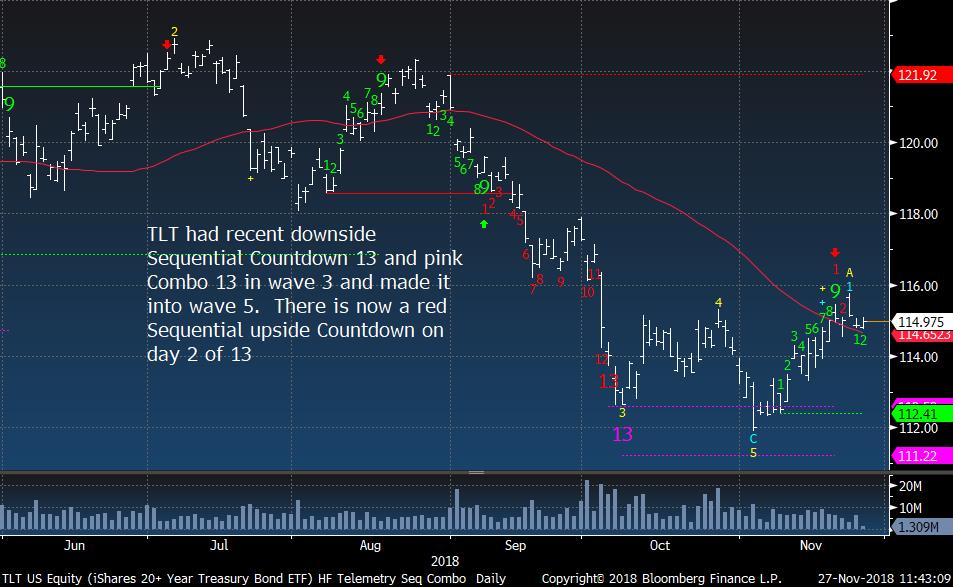
Bond bullish sentiment is at 71% and remains elevated.
|
|
|
|
|
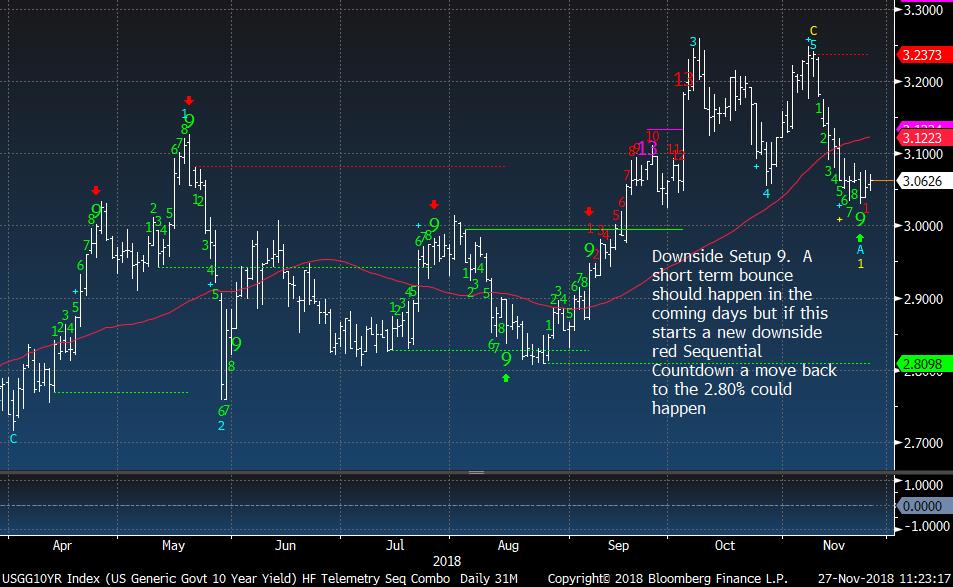
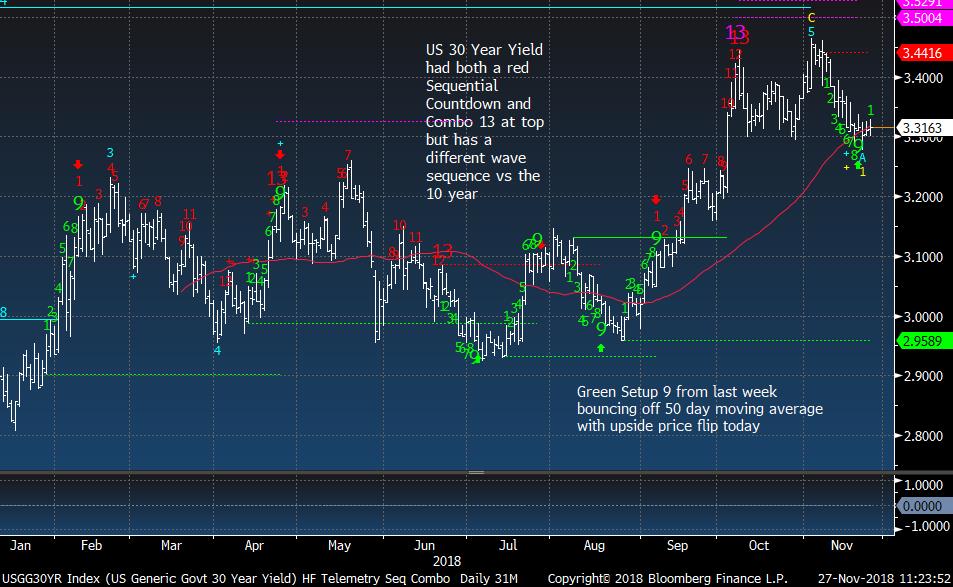
US 10 Year Yield has a slightly different pattern than the 30 year
|
|
|
|
|
|
|
|
|
|
|
|
|
|
|
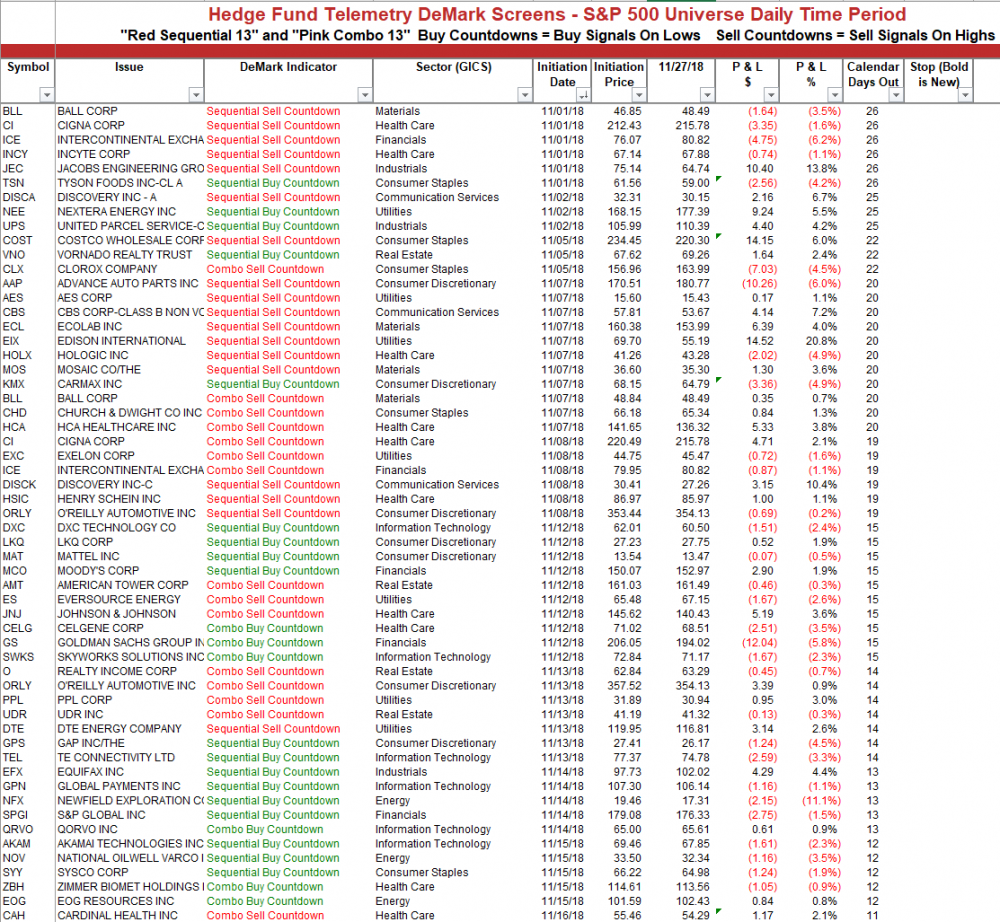
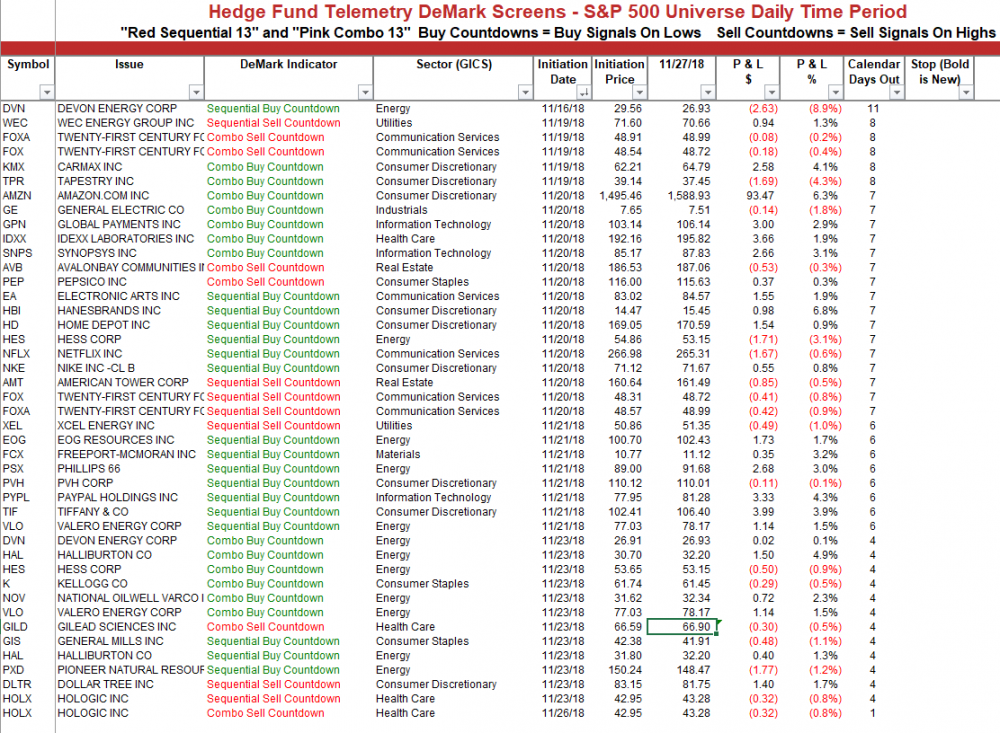
DEMARK SCREENS - Daily Upside/Downside Exhaustion Signals for November within SPX
|
|
|
Daily/Weekly DeMark upside/downside exhaustion signals (Sequential and Combo) updated daily
|
|
|
|
|
|
|
Unsubscribe me from Hedge Fund Telemetry
Hedge Fund Telemetry LLC, P.O. Box 4675, Greenwich, CT 06861, United States
CONFIDENTIALITY NOTE and DISCLAIMER: This message is for the named person's use only. It may contain confidential, proprietary or legally privileged material. No confidentiality or privilege is waived by any accidental or unintentional transmission. If you receive this message in error, please immediately delete it and all copies of it from your system, destroy any hard copies and notify the sender. You must not, directly or indirectly, use, disclose,
distribute, print or copy any part of this message if you are not the intended recipient. Hedge Fund Telemetry LLC. cannot guarantee the confidentiality of the material transmitted; therefore, information of a sensitive or confidential nature should not be transmitted. There is risk in trading markets. Hedge Fund Telemetry LLC reports are based on information gathered from various sources and believed to be reliable, but are not guaranteed as to accuracy and completeness. The information is subject to change without notice and Hedge Fund Telemetry LLC has no obligation to provide any updates or changes. Hedge Fund Telemetry LLC is providing this data for informational and educational purposes and does not believe that it is sufficient to base an investment decision on. This information should not be regarded as a solicitation or recommendation of any particular security or to engage in any trading strategy. One should always check with your licensed financial
advisor to determine suitability of any investments.
|
|
|
|
|