|
|
|
|
|
|
|
|
Having a Plan B is essential when investing or running a website. Regarding the website, it's been driving me nuts and I'm happy to report that we upgraded our servers (again) and everything is mostly working with just a few log on issues with new clients. I'm going with Plan B for the Daily Note today using the old format and should be live with the new format tomorrow. When the unexpected happens have your plan B.
Plan B can also apply to the markets as I've had an
open mind and have been looking at potential bullish scenarios. Perhaps for a strong bounce or even a true low. The evidence of my work still suggests this will take time into 2019 to finish a 5 wave down sequence but what if we have to switch to Plan B? People have high hopes for the Fed to come out with the slightest notion of pausing this week as well any positives out of the G20 this Friday and Saturday will see a risk on market. It's clear people want to buy and make some money heading into the year end as well to take advantage of the 10% pullback in the past two months. Sentiment has dropped to ultra low levels yet as we know it can stay that way for a while and the DeMark Countdowns on the downside really have not started to clear the way for a true downside exhaustion. There are more downside signals on
individual stocks including many in the energy sector from last week but not yet on the main ETF's. The DeMark wave pattern for the markets could have two scenarios as either the downside wave pattern just getting into wave 3 on the downside (a reversal pattern) or the down move from the highs could be an A-B-C pattern (a correction pattern). If this is an A-B-C pattern it must hold the current lows and follow through to the upside immediately. My friend and fellow DeMark expert Jason Perl suggested this on his note today that this was corrective vs a reversal. I continue to lean more on the wave 5 reversal thesis but will have an open mind in the coming days and weeks.
Thanks again for being patient as we upgrade our systems. It's been a lot more work and complication than I expected and once complete, we will be posting more and earlier.
|
|
|
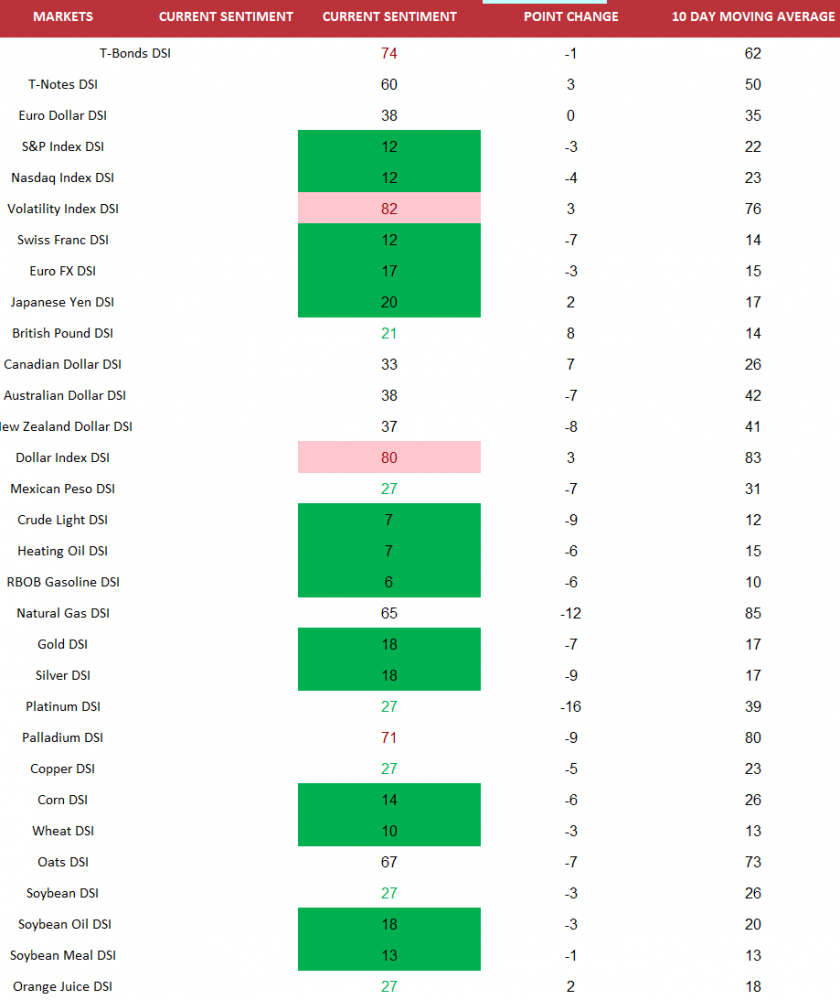
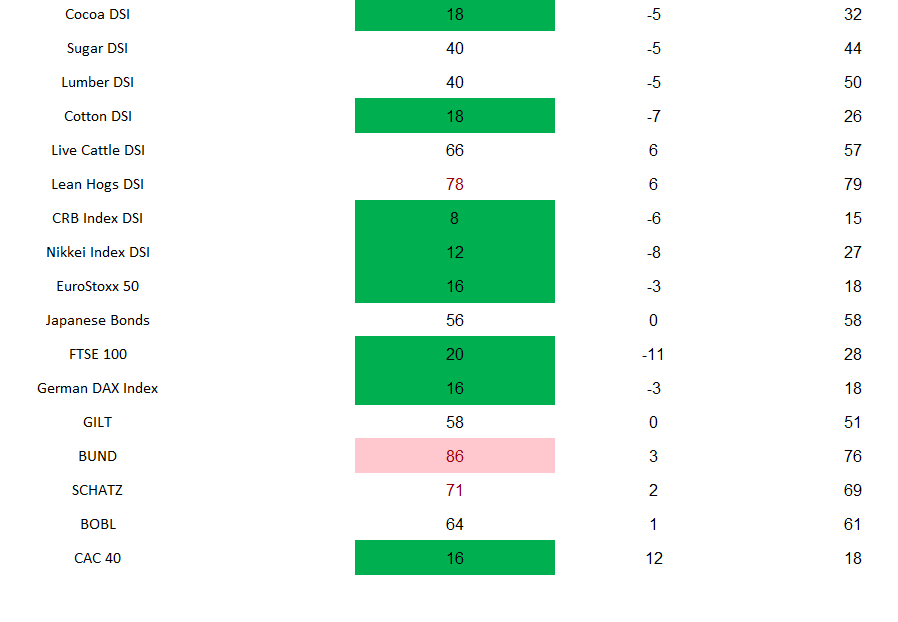
Current Global Market Sentiment
|
|
|
|
|
|
|
|
|
|
|
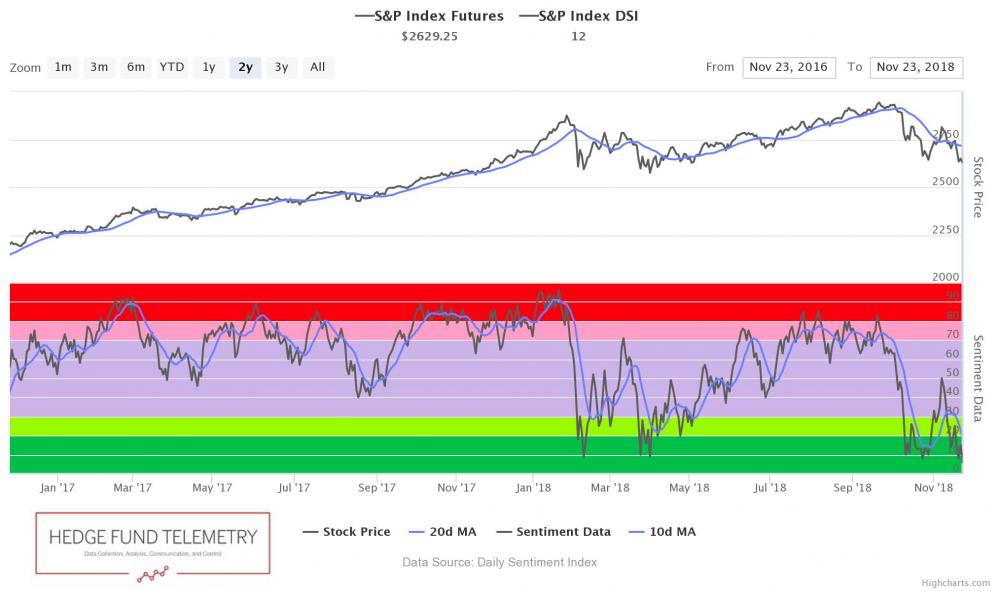
S&P bullish sentiment is at 12%
|
|
|
|
|
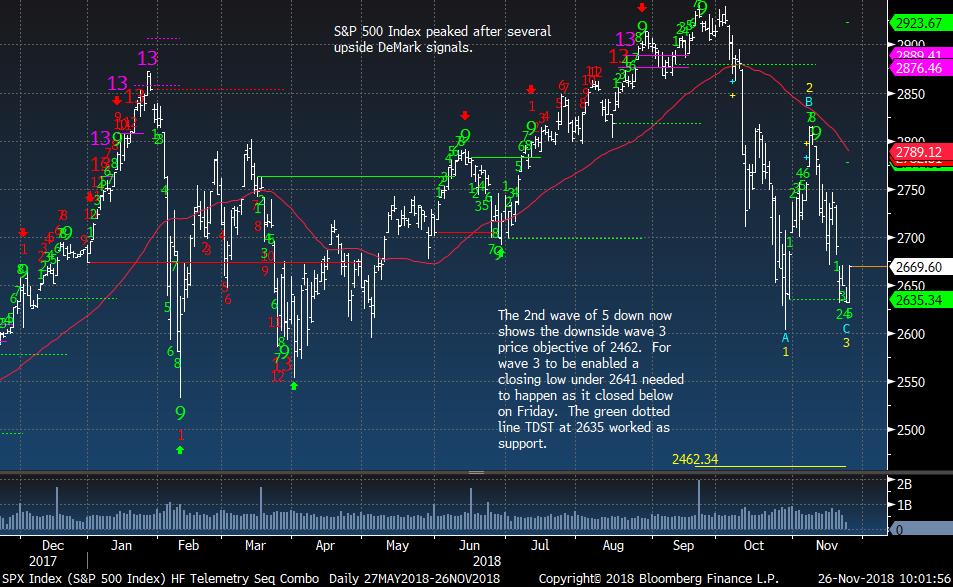
SPX daily shows both the yellow down waves and the blue A-B-C pattern. A break below 2600 would increase the probability of my 5 wave retracement vs this just being a corrective move
|
|
|
|
|
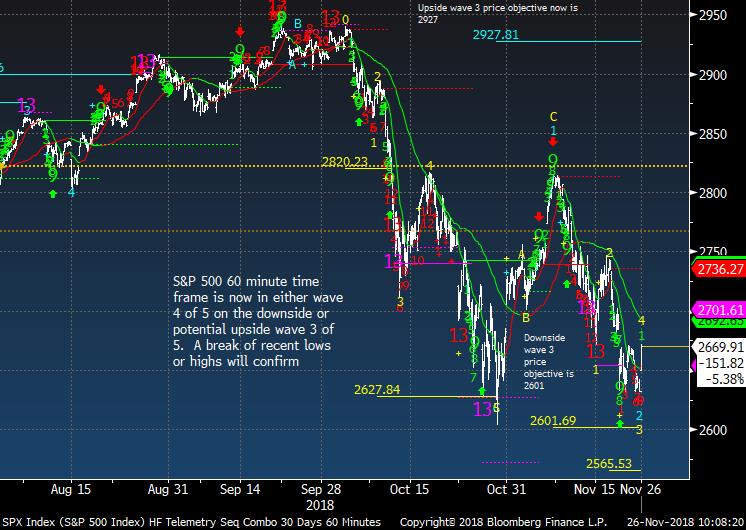
SPX 60 minute tactical time frame has held the recent lows but there is now a wave 5 downside price objective of 2565.
|
|
|
|
|
Nasdaq bullish sentiment is at 12% also
|
|
|
|
|
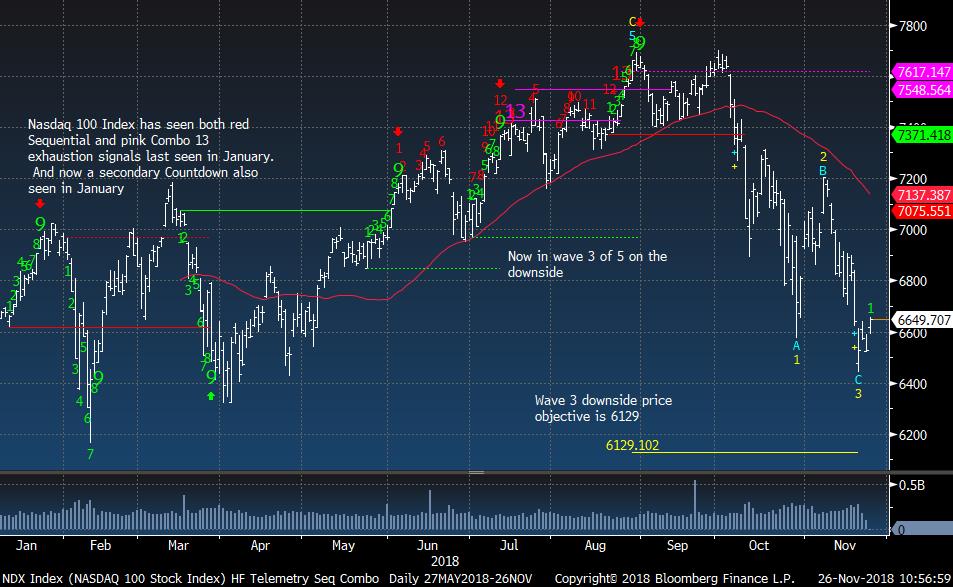
NDX Index similar story with the wave pattern
|
|
|
|
|
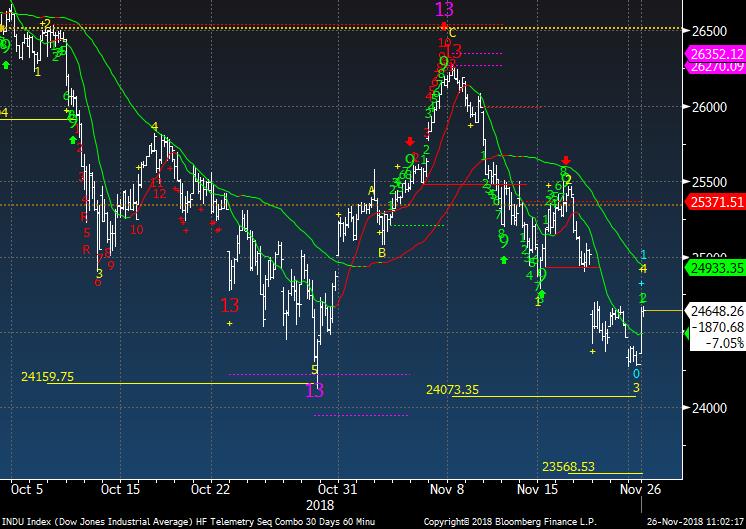
Dow Jones Industrial Average 60 minute time frame also has a wave 5 price objective lower. 2000 points lower
|
|
|
|
|
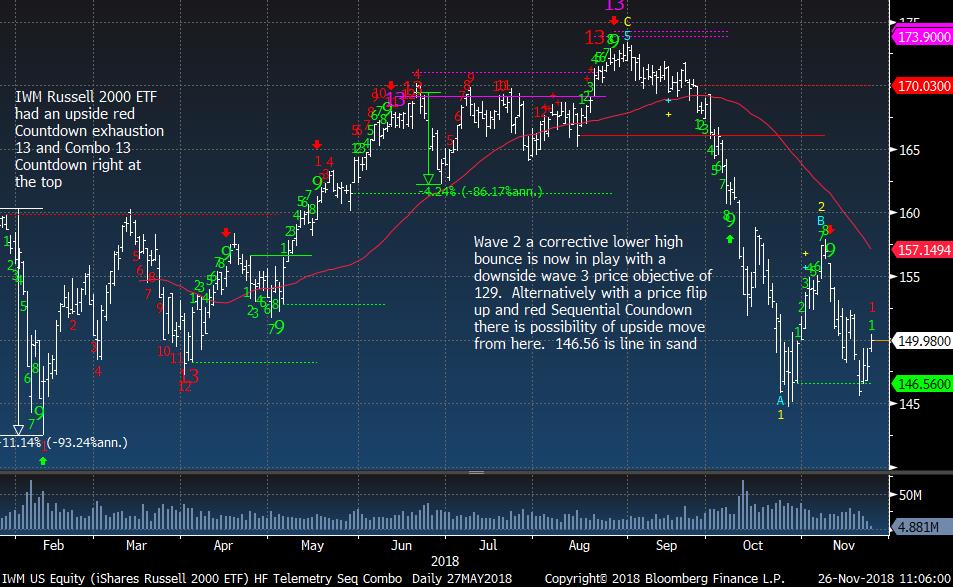
IWM Russell 2000 does not have the A-B-C as it did not close under the October lows
|
|
|
|
|
|
|
Hedge Fund Telemetry Trade Ideas
|
|
|
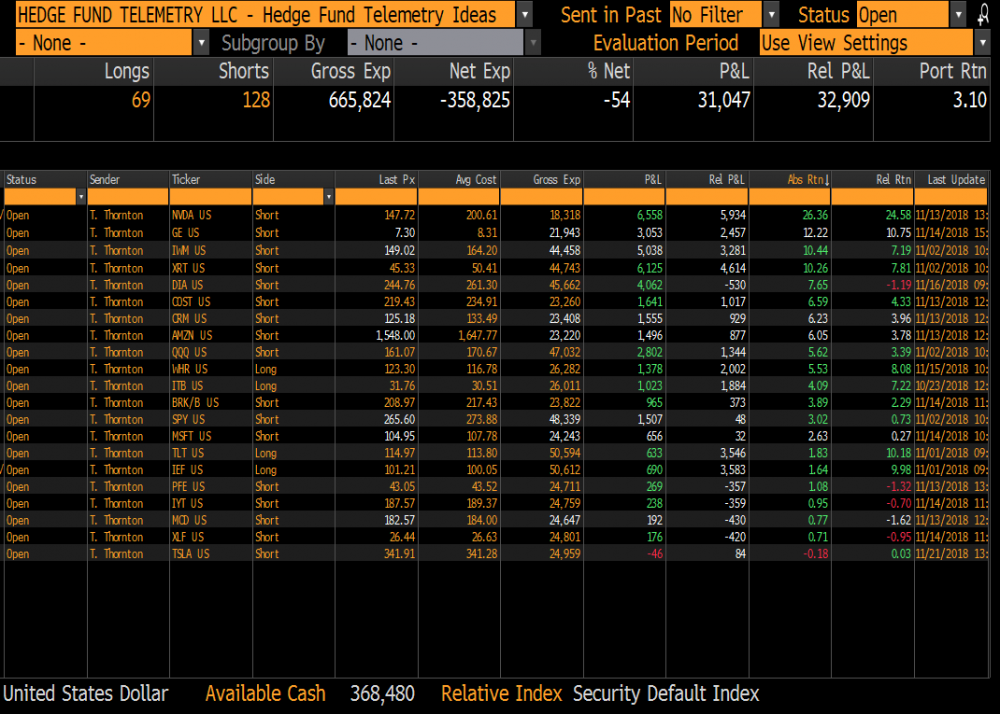
Trade Ideas Sheet - Long and short US equity ideas including ETF's. We will be overhauling the Trade Ideas Sheets for long only, short only, ETF's when the new website rolls out soon. There will also be a clearer email distribution with changes.
Trade Ideas Changes:
Stops on everything. TSLA 320, GDX 17.35 , FEYE 16.00, NVDA 235, QQQ 179, XLK 75, SPY 285, XLY 113, XRT 50,
IWM 163, NSC 173, DIA 260, XLI 77 IBB 116, AMZN 1860 DXJ 56 , GLD 111, IEF 98 TLT 112 , BA 370, IBM 140, NFLX 345 (RECENTLY ADJUSTED STOPS) GOOGL 1000, ITB 28
|
|
|
|
|
|
|
|
|
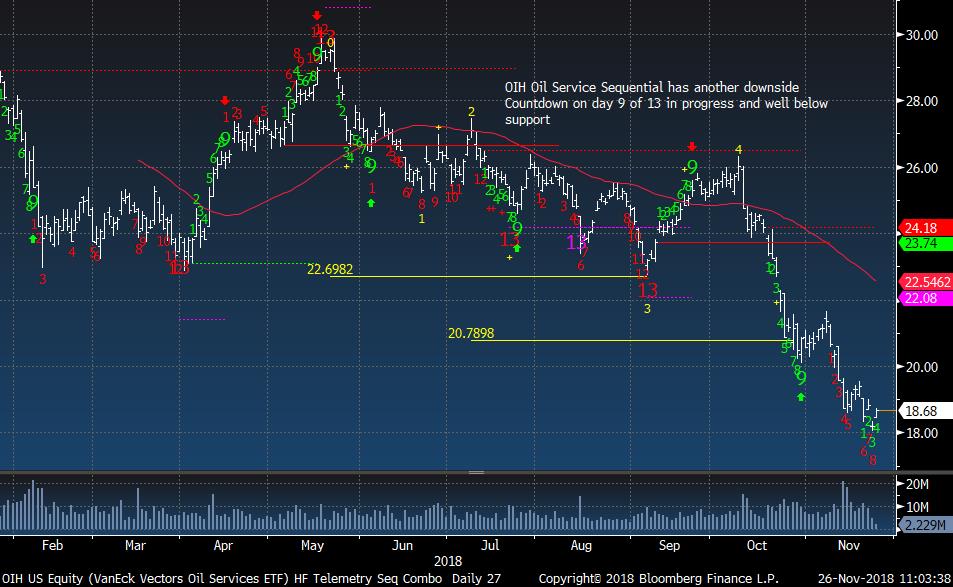
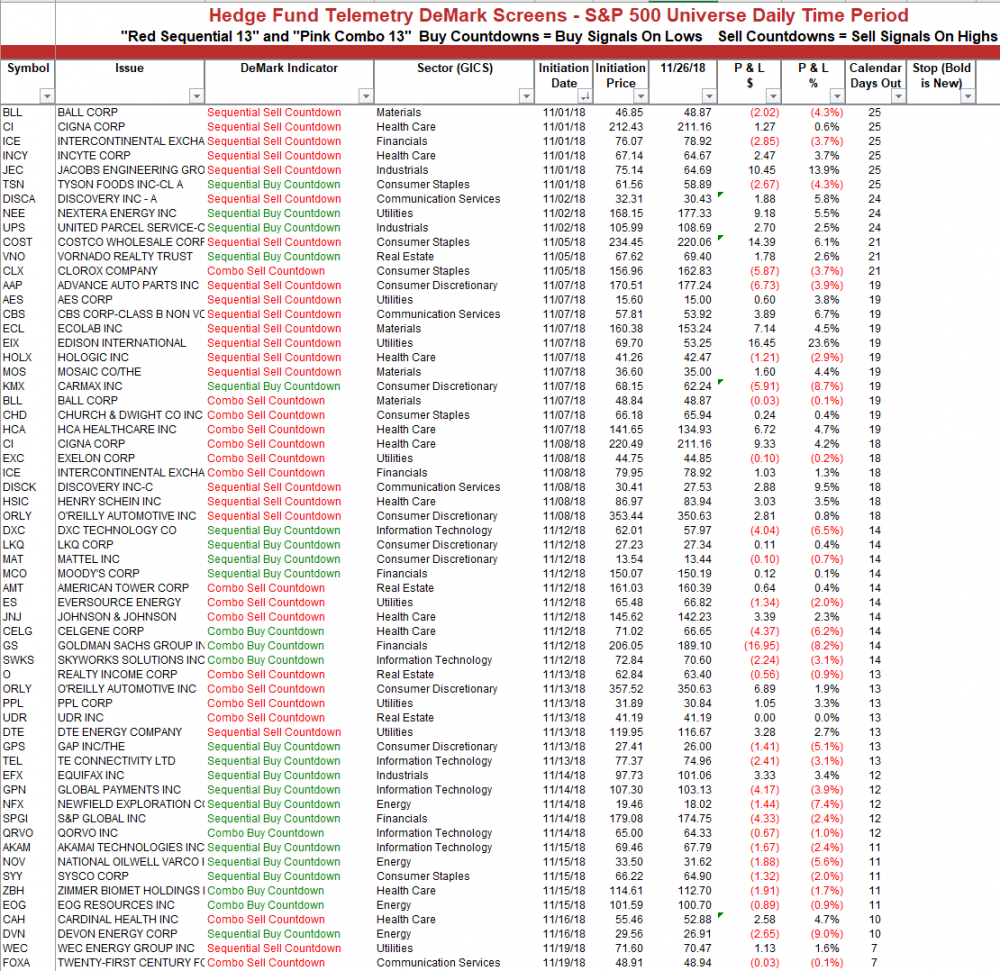
OIH Oil Service ETF has not reached the 13 yet. But below you'll see some stocks that did get the downside exhaustion signals (also seen below on the DeMark Screens)
|
|
|
|
|
|
|
|
|
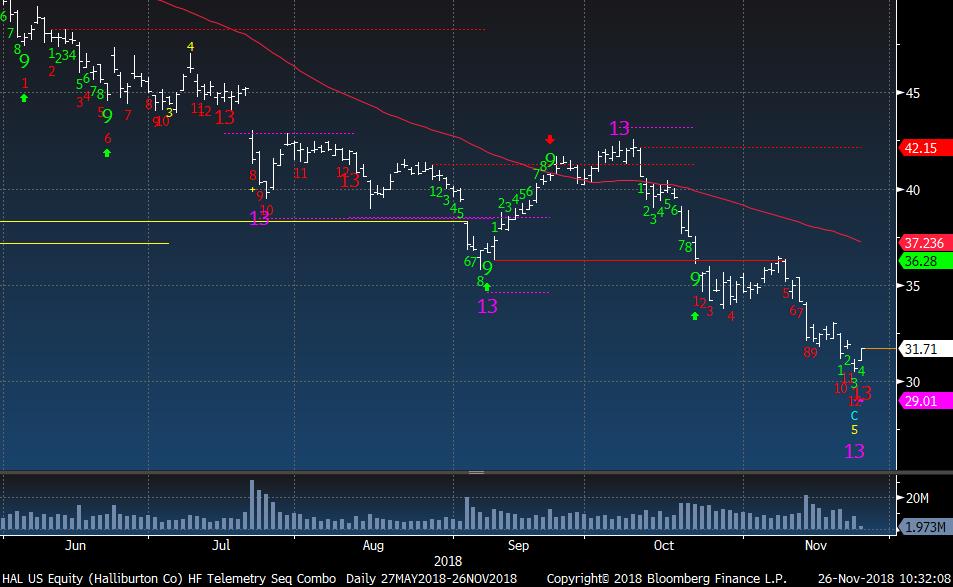
HAL did get both the red Sequential and pink Combo 13. They haven't been very good for much gain if any so I'm waiting on the sector to turn
|
|
|
|
|
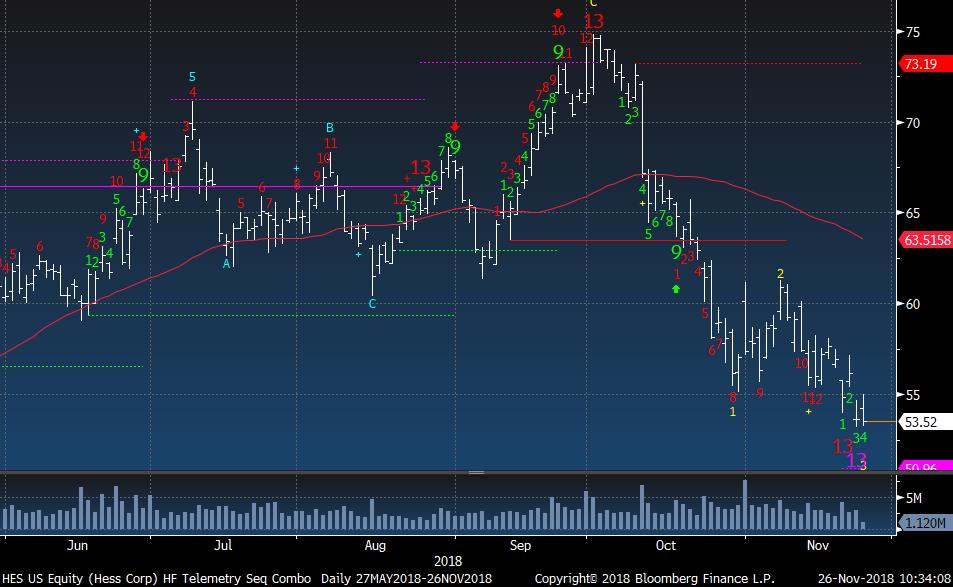
HES also had both the Sequential and Combo.
|
|
|
|
|
|
|
|
|
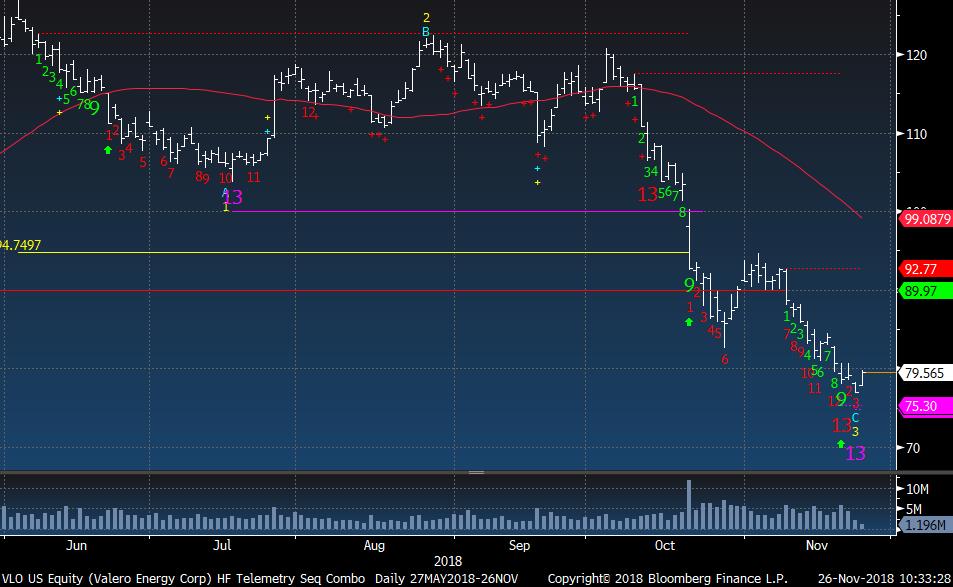
VLO had both the Sequential and Combo
|
|
|
|
|
|
|
|
|
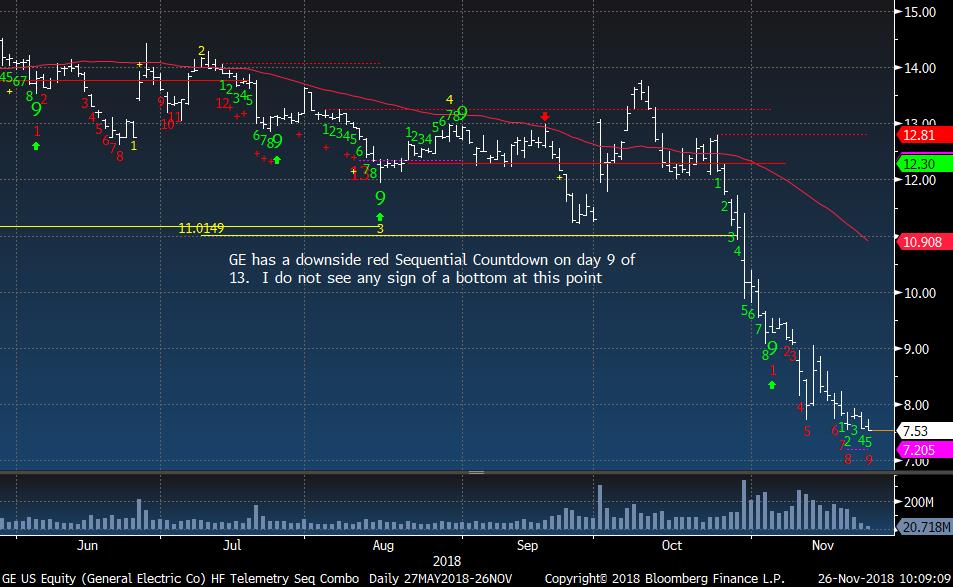
GE continues lower and I would expect it's continued year end tax loss selling weighing on this
|
|
|
|
|
|
|
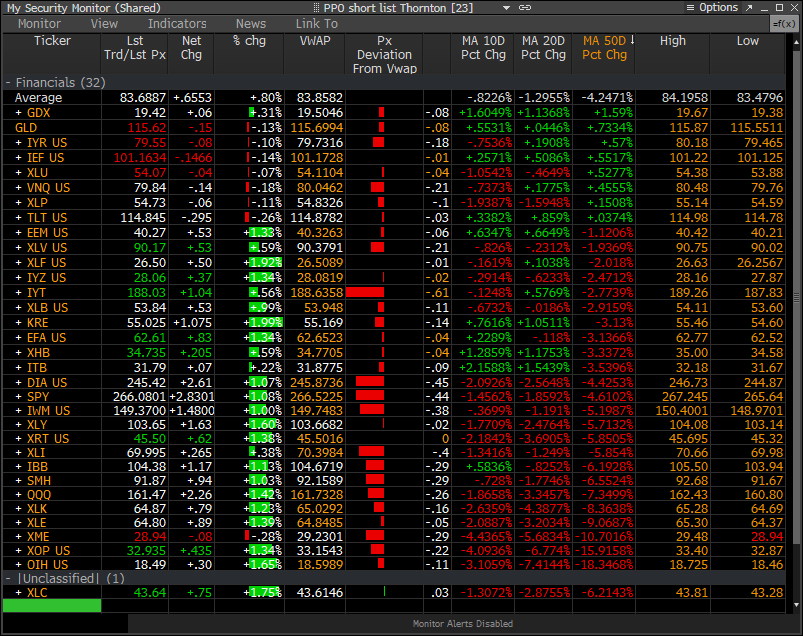
PPO Monitor - Percentage Price Oscillator
|
|
|
The PPO Monitor is a proprietary monitor developed to force rank Indexes, Sectors, and Stocks. It ranks top down by strongest to weakest by percentage above/below the 50 day moving average. Shorter term signals can be seen when the 10 and 20 day moving averages turn up (green) or down (red) which often are followed by the 50 day moving average. This is useful to watch for historically overbought/oversold percentage above/below the 50 day moving
average. It is non correlated with the DeMark Indicators however we have found upside/downside exhaustion signals often occur when something rises to the top or drifts to the bottom of the monitor - increasing the timing aspect. We share this monitor with clients with Bloomberg Terminals. An added feature is that each market/ETF can be expanded with each component force ranked in the same way. A couple other features include price deviation from intraday VWAP (useful for intraday reversals) and new 20 day highs/lows on right side. Please inquire if you would like to be permissioned to use the PPO Monitor.
Today's highlights: As you see many of the sectors are green on the day but they also are under the VWAP for today too. A sign of supply coming into the market after the early highs. Never a good sign
|
|
|
|
|
|
|
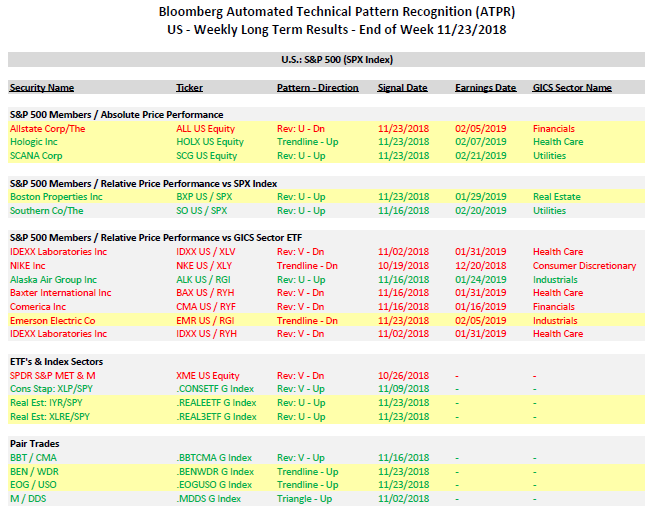
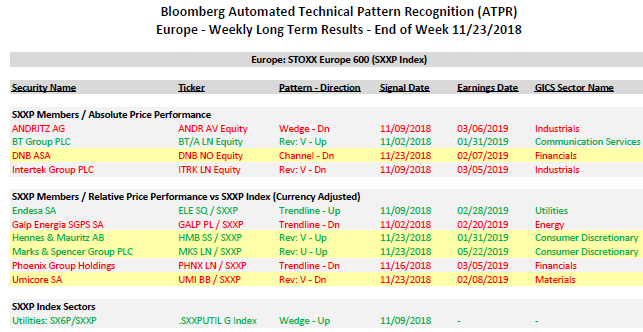
Bloomberg Automated Technical Pattern Recognition Screens
|
|
|
S&P 500 Members/Absolute Price Performance and Relative Price Performance vs S&P 500 and Sector ETF's. ETF's vs Index Sectors. Pair Trades. Long side is first symbol, short side is second symbol. If you would like a PDF from Bloomberg with full details of how this is formulated, please email.
|
|
|
|
|
|
|
|
|
|
|
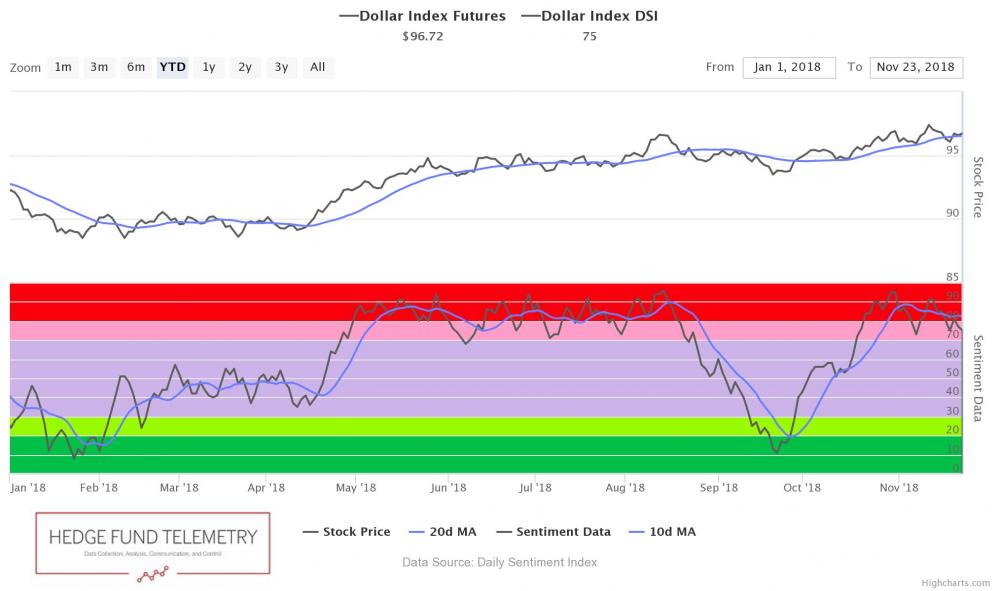
US Dollar bullish sentiment is at 75%
|
|
|
|
|
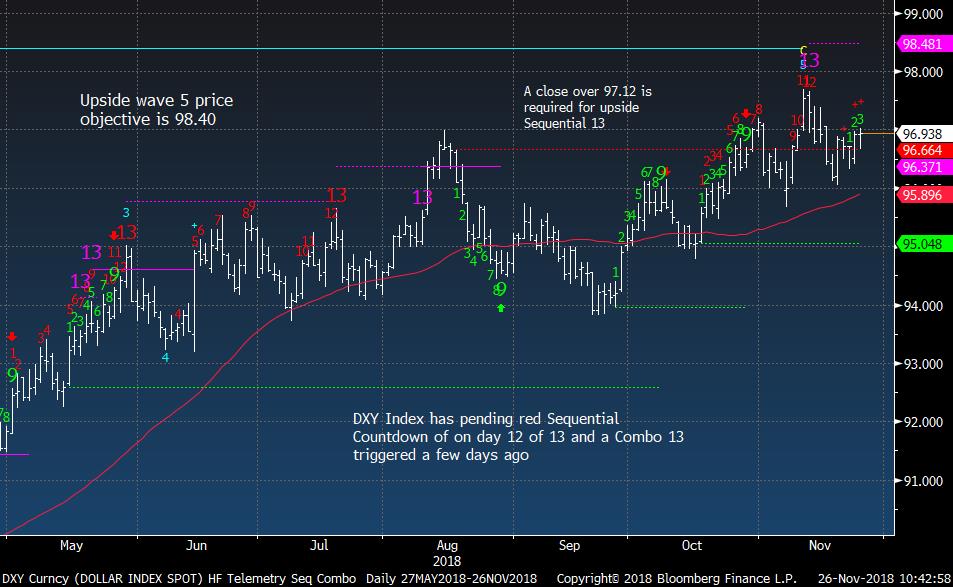
US Dollar Index slightly up today but still needs a little more for the 13
|
|
|
|
|
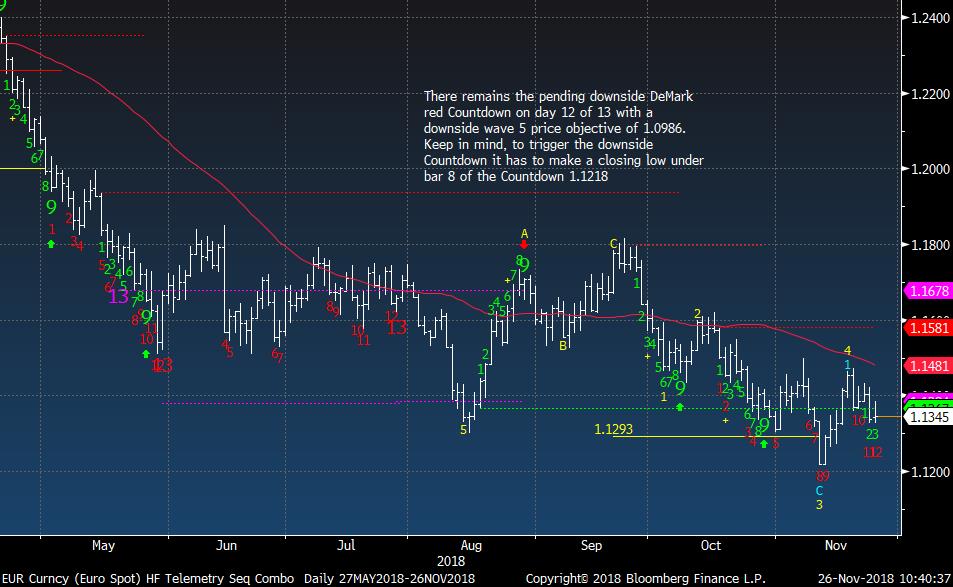
Euro Spot needs a move lower below the low close to get the 13
|
|
|
|
|
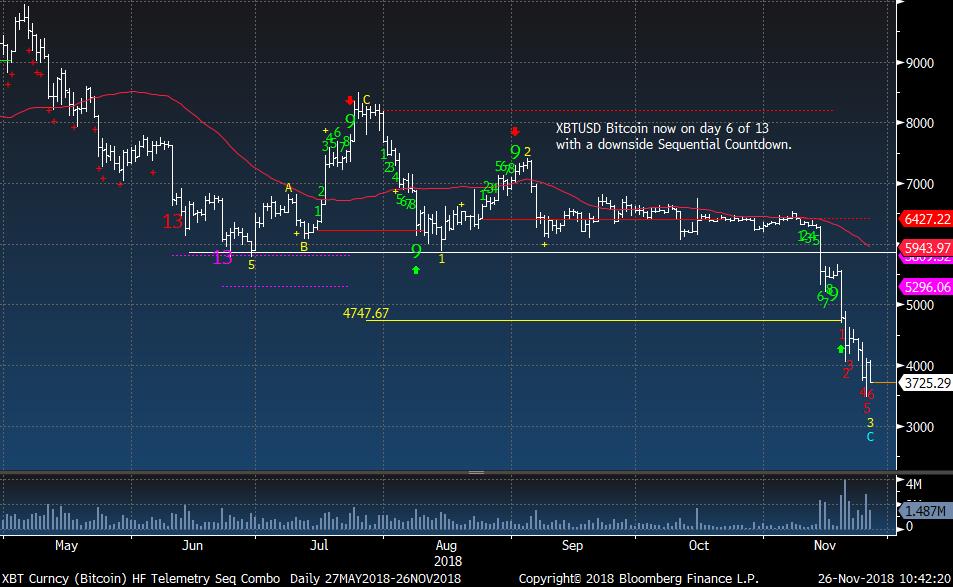
Bitcoin continues lower with a downside red Sequential Countdown in progress
|
|
|
|
|
|
|
|
|
Euro Stoxx 50 actually this looks a little bullish with the price flip but we've seen this bounce and fail all too often this year. I'm keeping an open mind
|
|
|
|
|
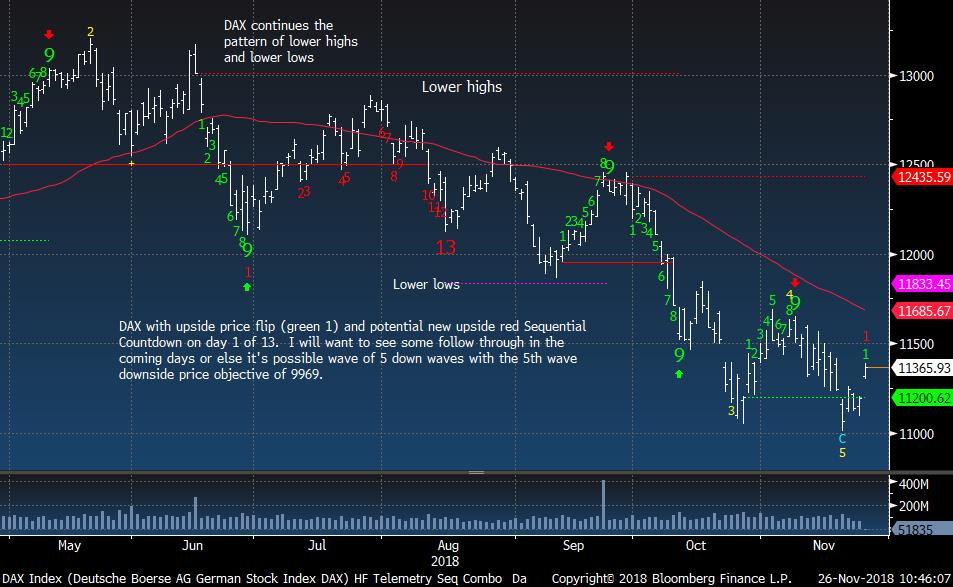
German DAX also could be trying to turn.
|
|
|
|
|
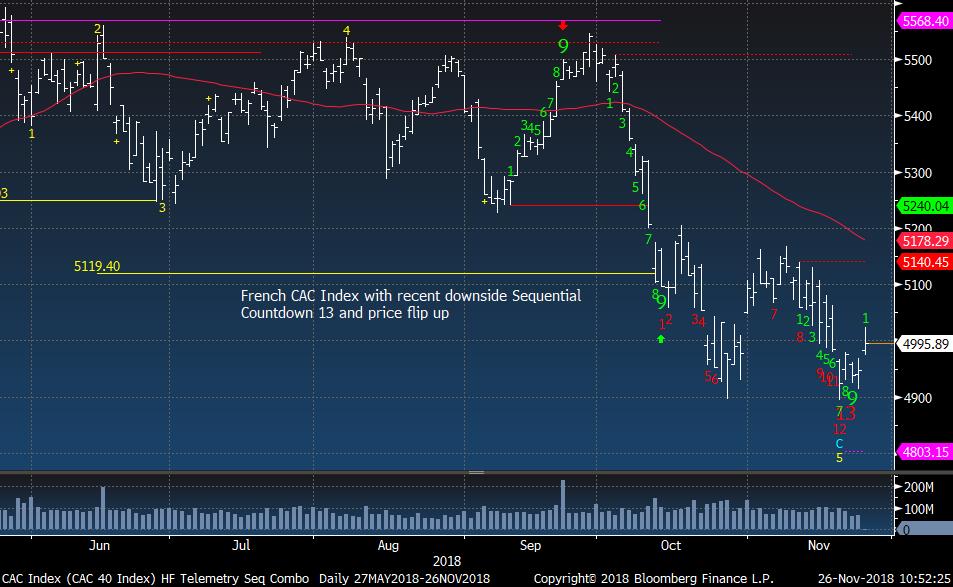
French CAC bouncing after recent downside Sequential 13 Countdown
|
|
|
|
|
|
|
MEGA CAP TECH AND CONSUMER STOCKS
|
|
|
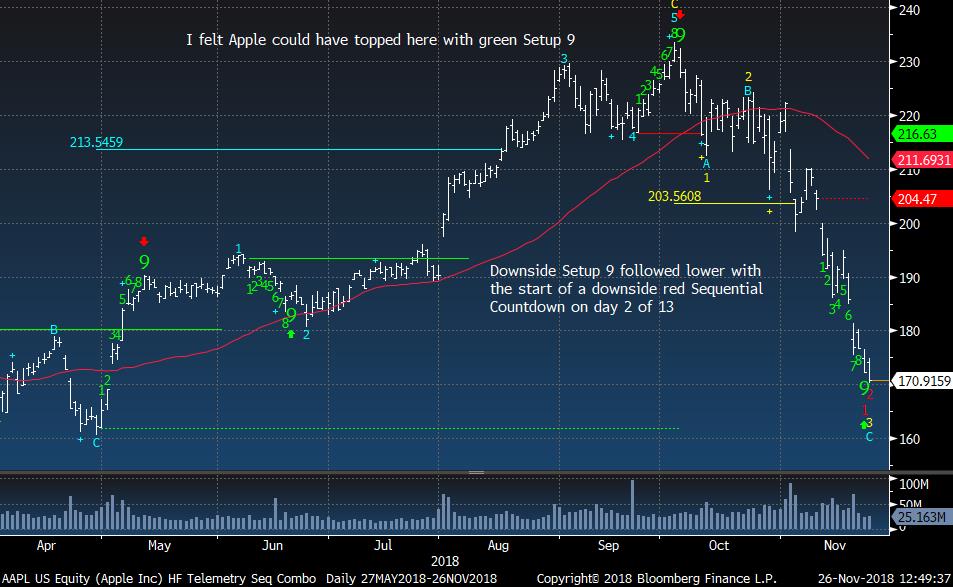
Apple now has a downside red Countdown on day 2 of 13.
|
|
|
|
|
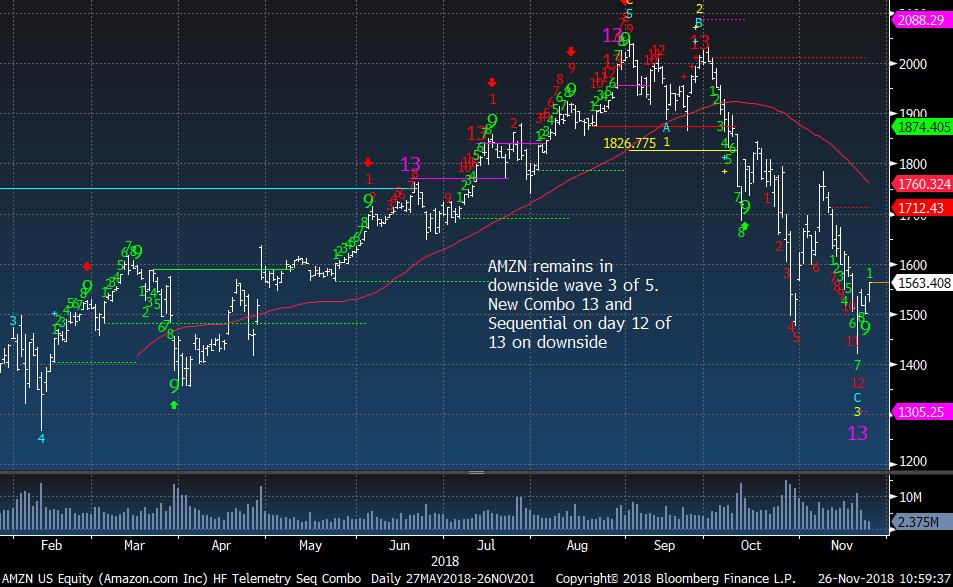
Amazon bouncing off the 1500 level again. I might be covering this and taking a profit soon
|
|
|
|
|
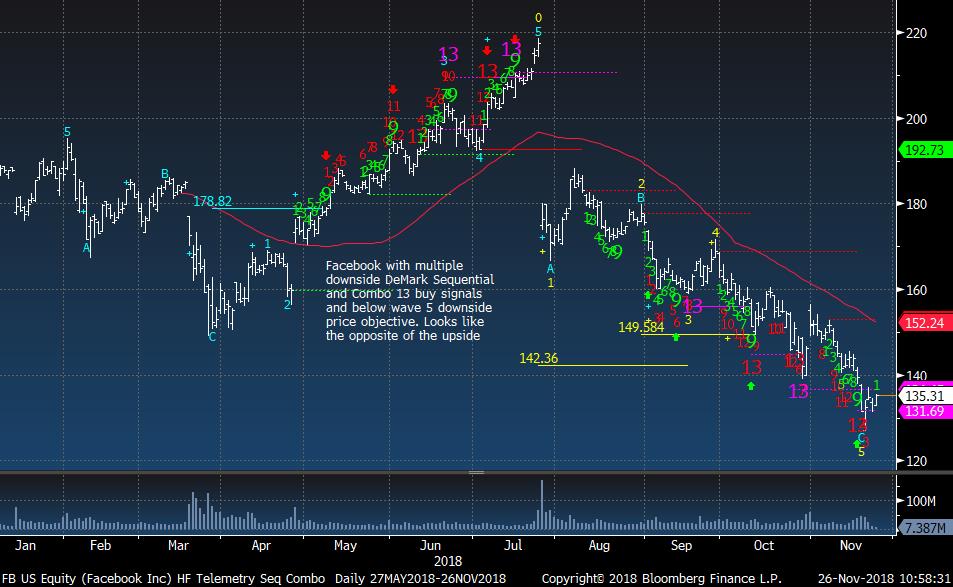
Facebook had several downside exhaustion signals but no turn yet
|
|
|
|
|
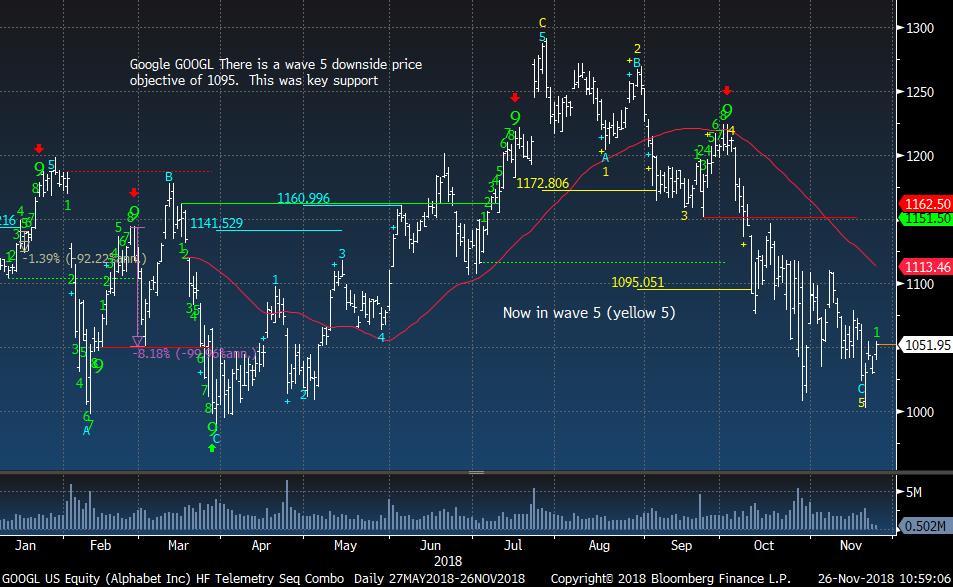
Alphabet chopping around between 1000-1100
|
|
|
|
|
|
|
CHINA AND HONG KONG MARKETS
|
|
|
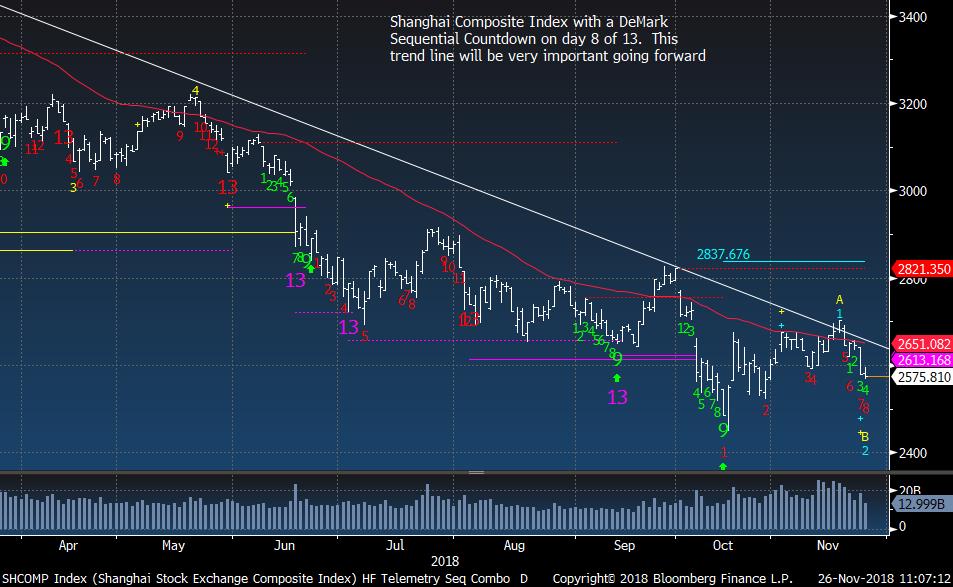
Shanghai still has a downside Countdown and hasn't been able to move above the trend line
|
|
|
|
|
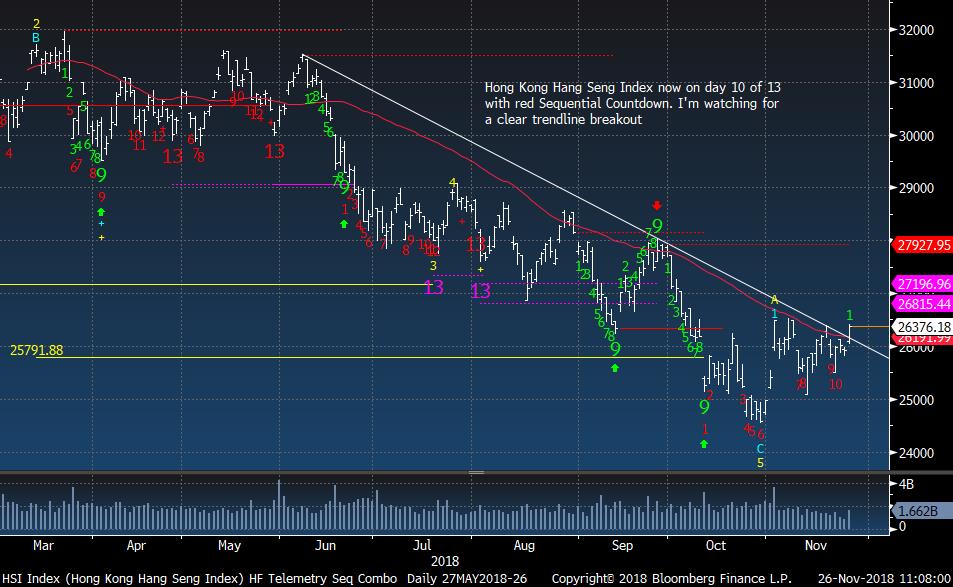
Hong Kong did move above the trend line yet it didn't get the downside exhaustion which is something I'd like to see
|
|
|
|
|
|
|
|
|
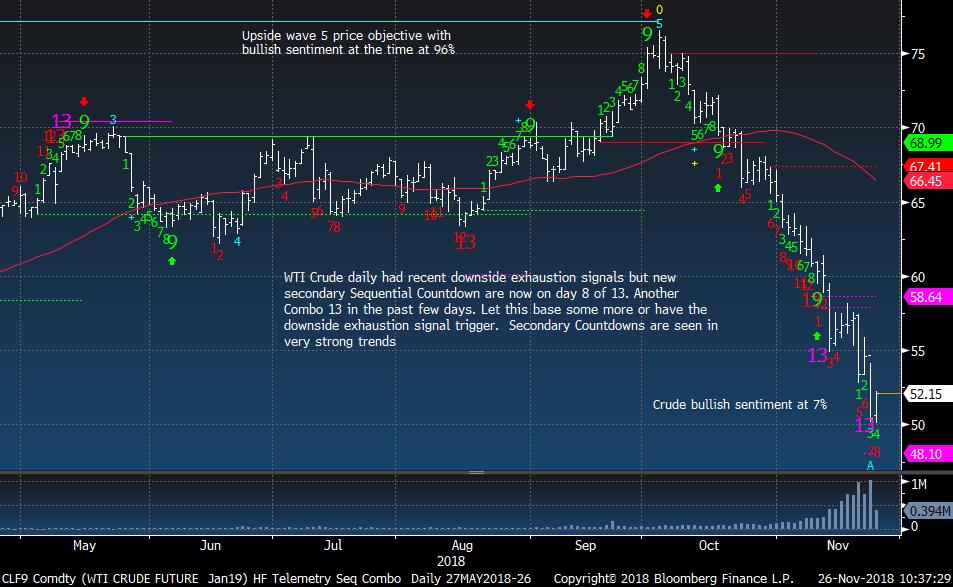
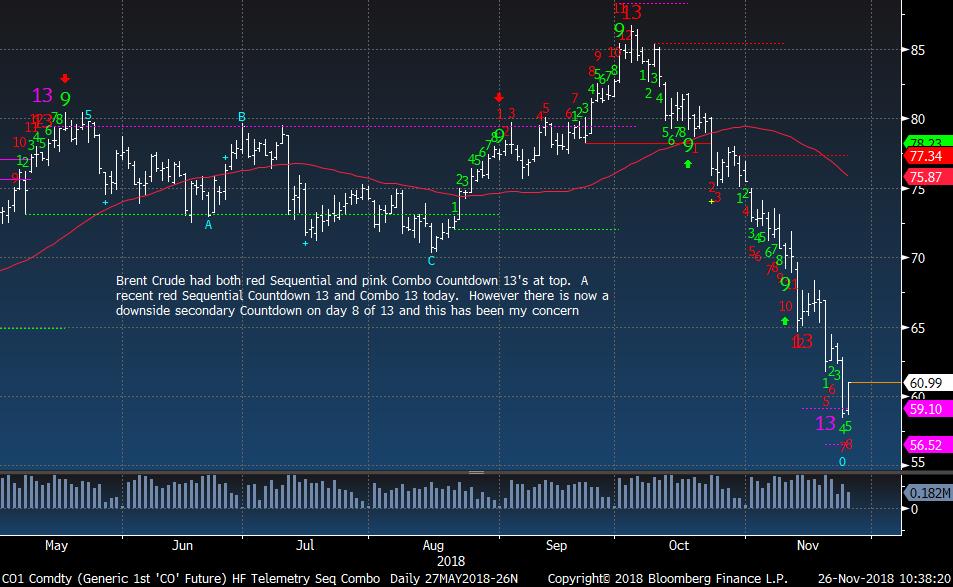
WTI Crude Futures although up still risk lower
|
|
|
|
|
|
|
|
|
|
|
|
|
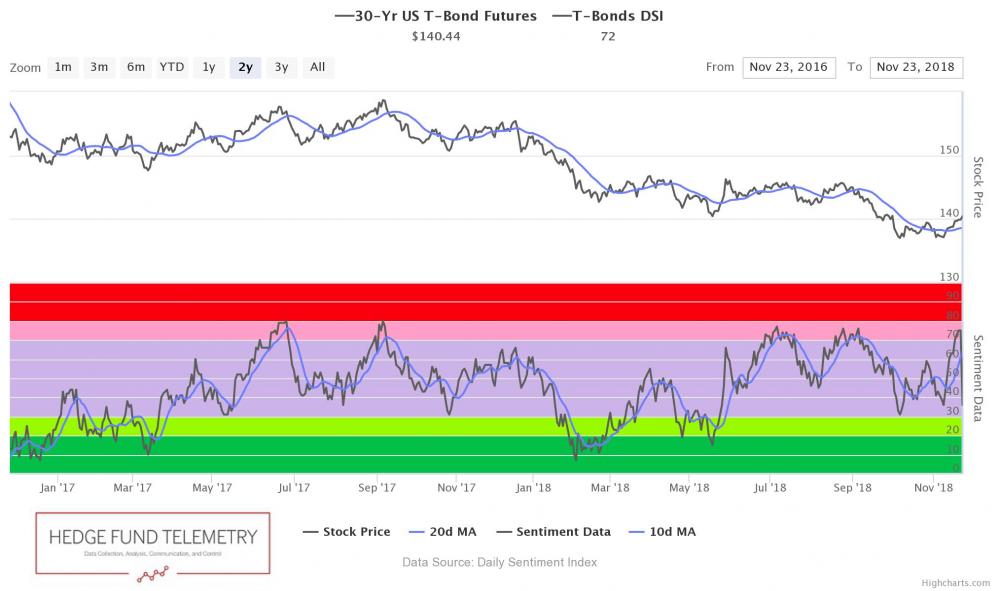
Bond bullish sentiment is at 72% and is in elevated zone
|
|
|
|
|
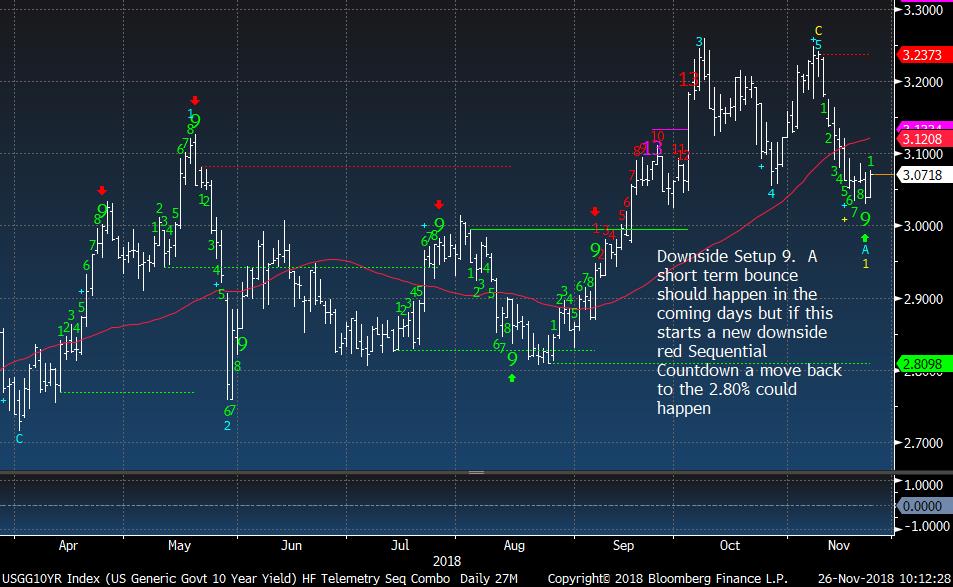
US 10 Year Yield with recent green Setup 9 bouncing as expected
|
|
|
|
|
|
|
|
|
|
|
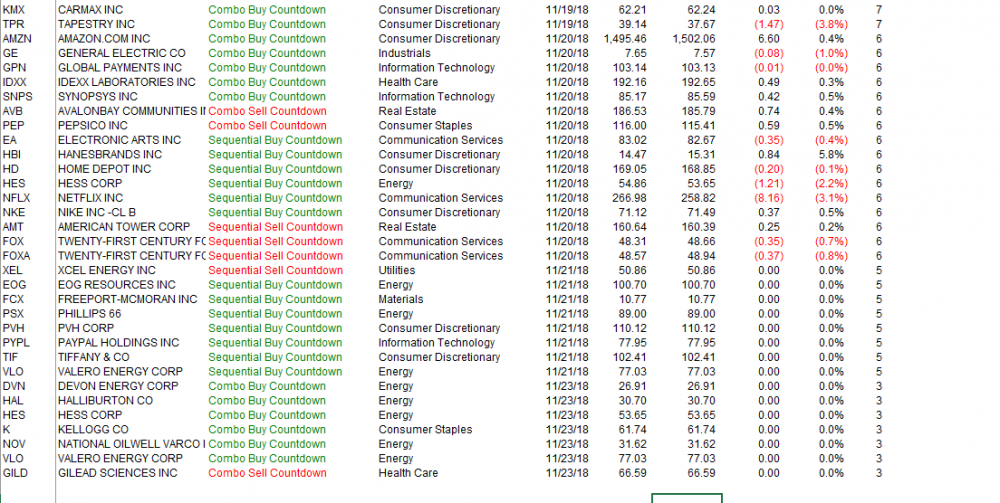
DEMARK SCREENS - Daily Upside/Downside Exhaustion Signals for November
|
|
|
|
|
|
|
Unsubscribe me from Hedge Fund Telemetry
Hedge Fund Telemetry LLC, P.O. Box 4675, Greenwich, CT 06861, United States
CONFIDENTIALITY NOTE and DISCLAIMER: This message is for the named person's use only. It may contain confidential, proprietary or legally privileged material. No confidentiality or privilege is waived by any accidental or unintentional transmission. If you receive this message in error, please immediately delete it and all copies of it from your system, destroy any hard copies and notify the sender. You must not, directly or indirectly, use, disclose,
distribute, print or copy any part of this message if you are not the intended recipient. Hedge Fund Telemetry LLC. cannot guarantee the confidentiality of the material transmitted; therefore, information of a sensitive or confidential nature should not be transmitted. There is risk in trading markets. Hedge Fund Telemetry LLC reports are based on information gathered from various sources and believed to be reliable, but are not guaranteed as to accuracy and completeness. The information is subject to change without notice and Hedge Fund Telemetry LLC has no obligation to provide any updates or changes. Hedge Fund Telemetry LLC is providing this data for informational and educational purposes and does not believe that it is sufficient to base an investment decision on. This information should not be regarded as a solicitation or recommendation of any particular security or to engage in any trading strategy. One should always check with your licensed financial
advisor to determine suitability of any investments.
|
|
|
|
|