|
|
|
|
|
|
|
|
If you have been a client of Hedge Fund Telemetry and a frequent reader of the Daily Note, you see that I post and comment on a lot of different types of assets daily. Some people have suggested I just to focus each day on one market but my view is that having many markets is similar to watching ESPN Sports Center. Sports Center is a recap of many sports and they skip around with football, baseball, golf, motor racing and a few random sports. I love it because I get to a better view
of all sports and I'd rather know a little about a lot rather than a lot about a little. It's the same way with the Daily Note but even more relevant as there is so much that is connected to movements from currencies, commodities, bonds and stocks.
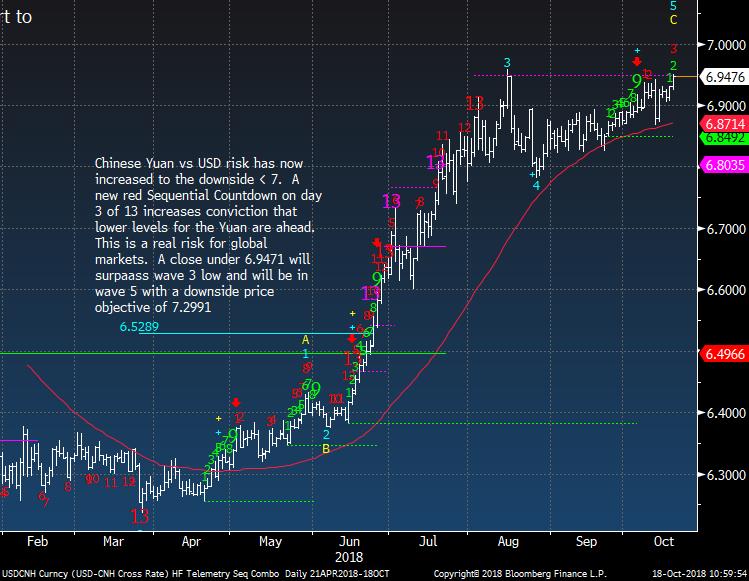
One of the big concerns I've been watching closely is the weakening Chinese Yuan. It moved lower vs the USD then stalled. This has global implications on many markets. A higher USD will cause collateral damage to US multinational earnings, Emerging Markets equity and debt. Yesterday I showed the USD with an upside DeMark Sequential Countdown on day 1 of 13 and said there is potential for a higher leg in USD. The Chinese Yuan dropped to a new cycle low and on the daily chart also has a DeMark Countdown with a wave 5 downside price objective of 7.299. That level would leave a mark. The media will soon pick up on the Yuan dropping below the 7 level. The Shanghai Composite lost 3% last night on
margin call liquidations. With many European and other Asian markets at or near year lows when will liquidations happen there too? The US markets are not immune to these risks as the US has been the safe haven all year. I believe we are at that point break. Tighten stops, have hedges in place, and keep a larger than normal percentage of cash on the sidelines has been and continues to be my call.
I speak often with derivative traders around the street as I have always believed they know where there is the true risk in the market or where the bodies are buried. Marko Kolonovic the strategist from JPMorgan was out today saying there is a Gamma $42b imbalance into Friday's option expiry. 33% of this rolls off Friday (October expiration). That matters because he expects the choppy market to continue for the next few sessions. He claims 80+% of the CTA (Commodity Trading Advisor) selling is done. I've heard only 43% is done. The next level he
cares about is 2550 (to the downside). I've heard 2675 was a level to watch for CTA's too. JPM said Thursday was the worst single day for CTA performance in 15 years. What this means is that market participants believe investors are mostly hedged thru October expiry, a large portion of the hedges roll off on Friday. This could lead to near term volatility as sell side firms are forced to gamma hedge (protect the downside). After the hedges roll off, assuming investors do not roll, the market could become more susceptible to a sharper move lower as investors are left without their hedges on. I've watched in the past few days a relatively high put call even into the bounces which it likely explains some November rolls. FYI As a follow up I will be
closing 3 open option trades for tomorrow's October OPEX VIX 15/20 call spread 3x max win, SPY 285/270 put spread, QQQ 180/165 both in the money but will hold until tomorrow to see if I can get a little more gain.
A reminder, I will not be publishing a Daily Note Friday as I am traveling. If anything crazy happens, I'll put out a brief note as soon as possible.
- US Markets - Sentiment is low and can stay low. Watch the 60 min tactical charts for lower levels
- Hedge Fund Telemetry Trade Ideas - Doubled up AAPL, BA shorts
- US Total
Market and World Market Ex US - Update
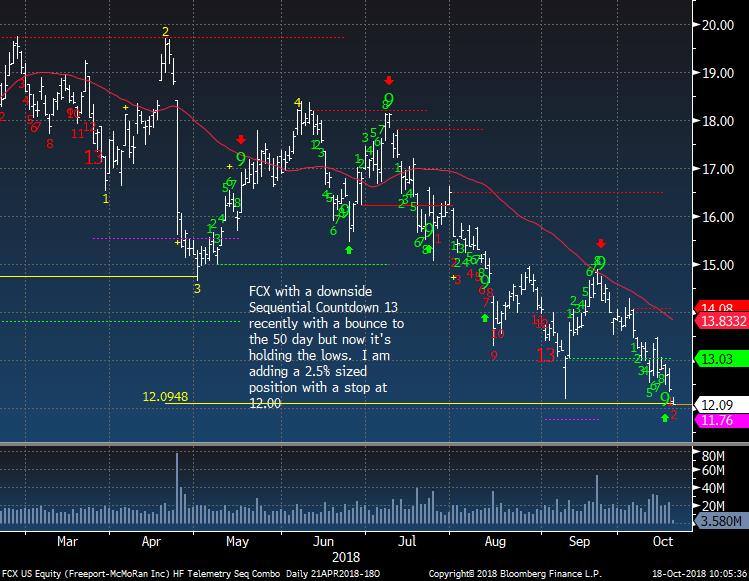
- FCX - Update - watch 12 as a stop
- US Sector Update - Cannabis - A potential high
- PPO Monitor - Percentage Price Oscillator Force Ranked Sector Rotation
- Bloomberg Technical Pattern Recognition Screen - Nothing but short patterns are being found
- Currency Update - EXPECT THE USD TO INCREASE AND EURO AND YUAN TO DECLINE - VERY IMPORTANT
- European Market Update - Can't hold gains intraday says a lot
- Global Market Update - Bloomberg World is at risk for new lows
- Asian Market Update - Real risk for more liquidation
- Crude Update - At a critical level now
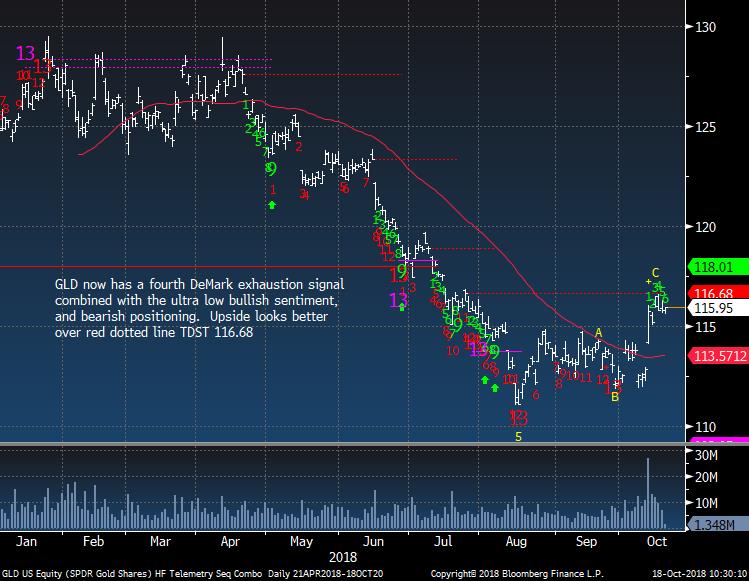
- Gold Update - Holding in there and working
- Bond Update - Still expect lower yields with a risk off move - staying long TLT and IEF
- DeMark Screens - Daily, Weekly, Monthly upside/downside exhaustion signals within the S&P 500 and Euro Stoxx 600
|
|
|
|
|
Here's a link to the Hedge Fund Telemetry market sentiment page with 40 charts of sentiment including equities, bonds, currencies, and commodities updated each day. When the new website launches we will be adding new charts and historical sentiment data for Euro Stoxx 50, UK FTSE 100, German DAX, French Cac 40. We will be adding Japanese Bonds, German Bunds, and a few more.
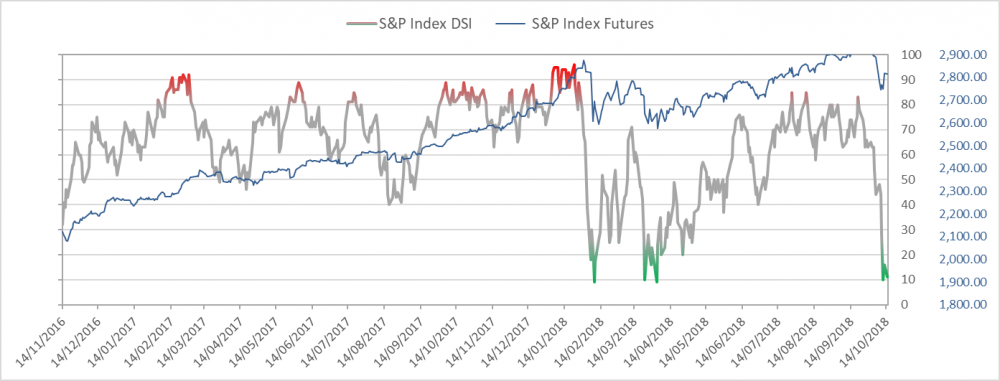
SPX bullish sentiment is at 23% and should chop around down here for a while
|
|
|
|
|
|
|
|
|
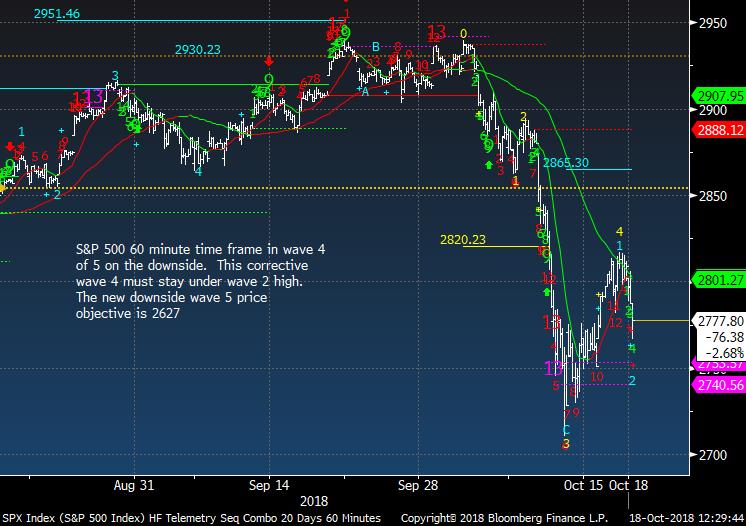
SPX 60 minute tactical time frame - a break of recent low locks in wave 5 on the downside
|
|
|
|
|
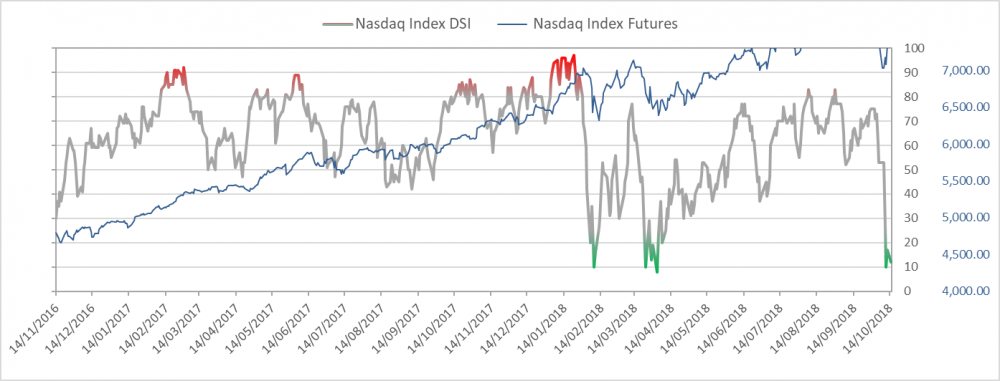
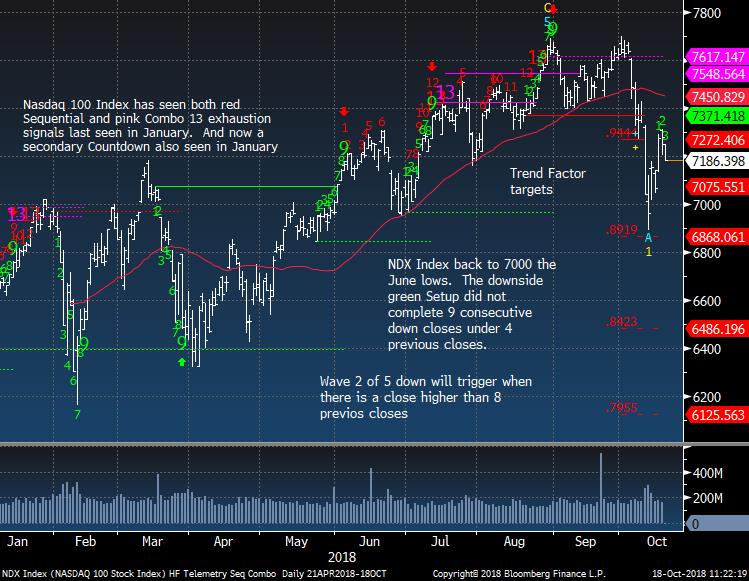
Nasdaq bullish sentiment is at 22%
|
|
|
|
|
|
|
|
|
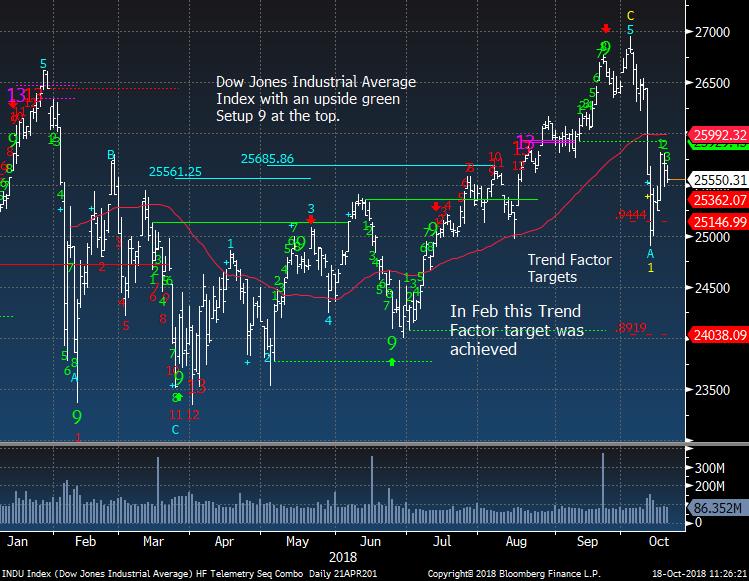
Dow Jones Industrial Average daily
|
|
|
|
|
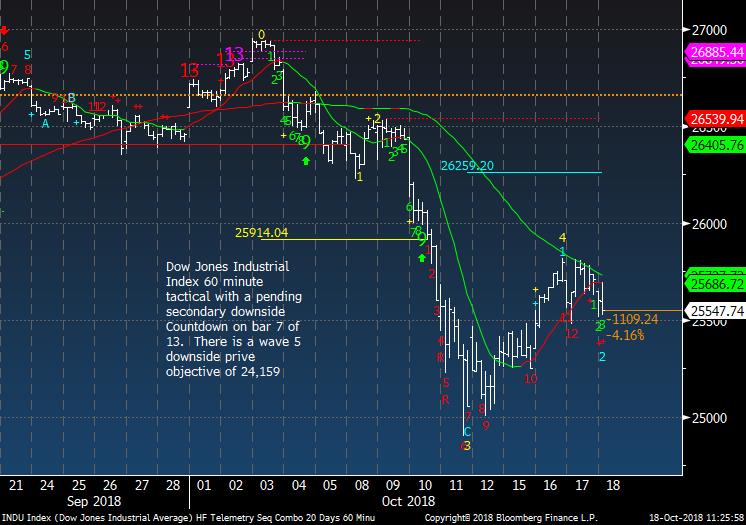
Dow Jones Industrial Average 60 minute tactical time frame - watch the break of 25,000
|
|
|
|
|
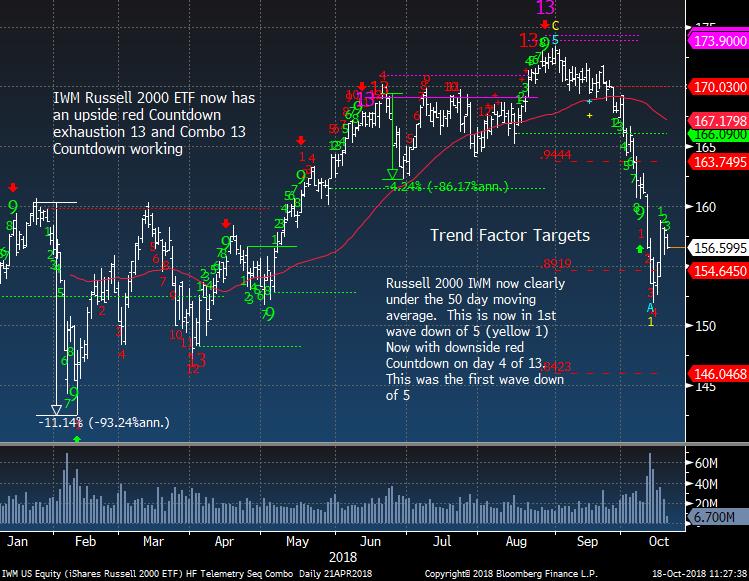
IWM Russell 2000 still one of the weakest indexes in the US
|
|
|
|
|
|
|
Hedge Fund Telemetry Trade Ideas
|
|
|
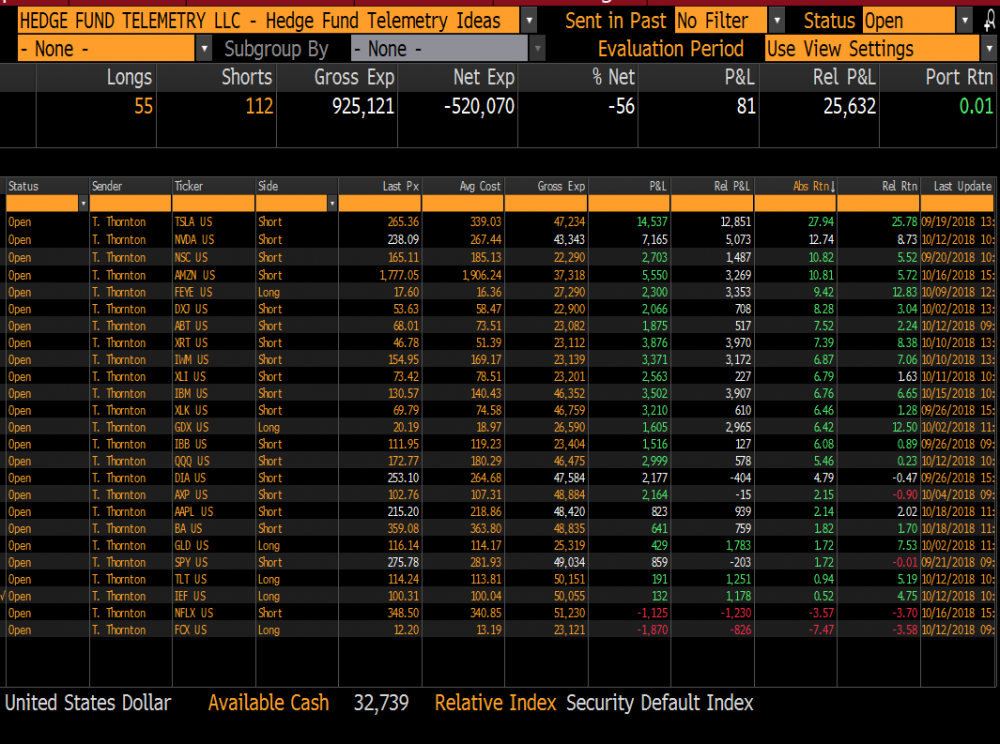
Trade Ideas Sheet - Long and short US equity ideas
including ETF's. We will be overhauling the Trade Ideas Sheets for long only, short only, ETF's when the new website rolls out soon. There will also be a clearer email distribution with changes.
Trade Ideas Changes: DOUBLED UP AAPL, BA - largest weights in NDX and Dow just adding exposure as I'm expecting a break down with indexes.
Stops on everything. FCX 12 (WATCH) TSLA 285, GDX 17.35 , FEYE 16.00, NVDA 255, QQQ 179, XLK 75, SPY 285, XLY 113, AXP 109, XRT 50, IWM 163, NSC 173, DIA 260, XLI 77 IBB 116, ABT 75, AMZN 1860 DXJ 56 , GLD 111, IEF 98 TLT 112 , AAPL 225, BA 370, IBM 140, NFLX 375 (RECENTLY ADJUSTED STOPS)
|
|
|
|
|
|
|
US Total Market and World Market Ex US ETF's
|
|
|
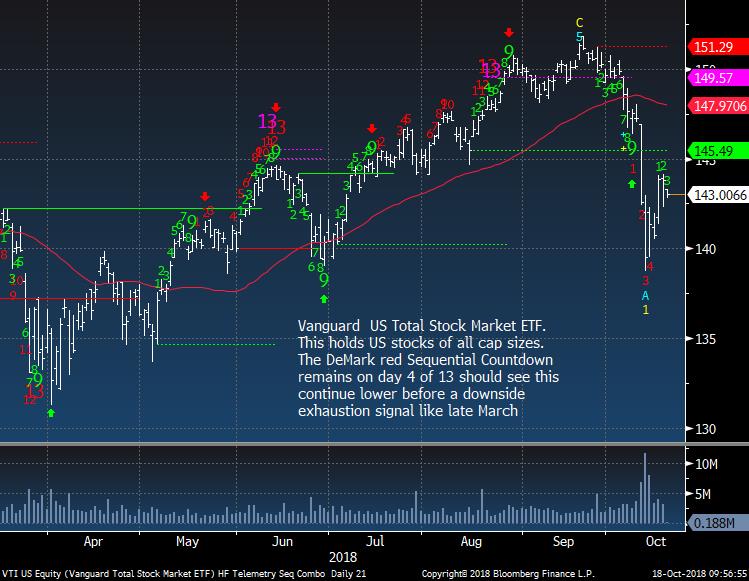
VTI US Total Stock Market ETF is a risk for lower levels and that will hurt global stocks too
|
|
|
|
|
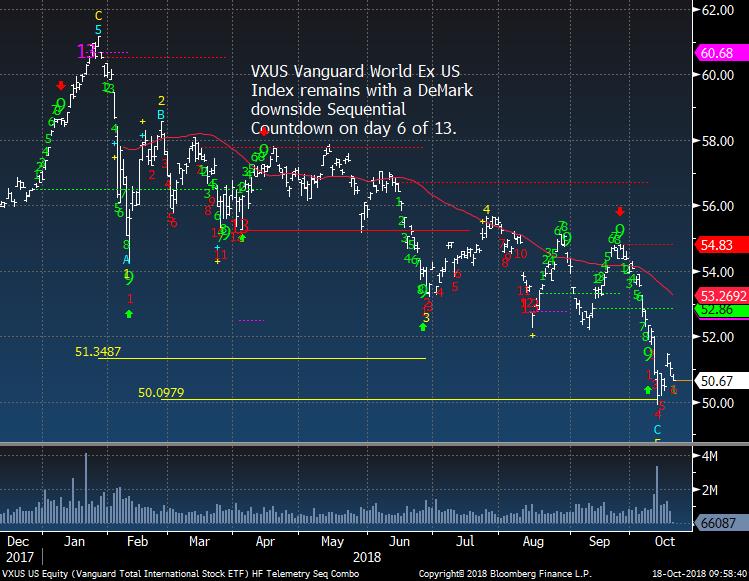
VXUS - World Ex US still looks risky to the downside - Note I misquoted this yesterday as VTUS
|
|
|
|
|
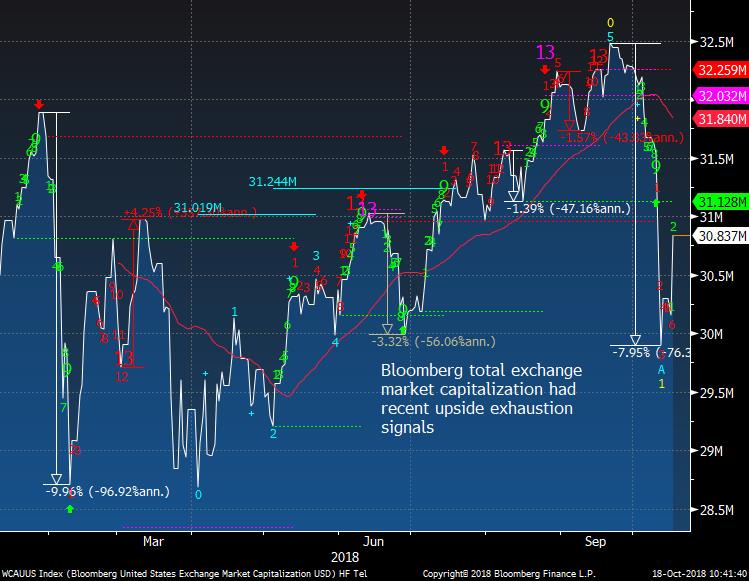
Bloomberg US Total Market Cap also had upside exhaustion signals
|
|
|
|
|
|
|
|
|
FCX is a small long and could be stopped out at 12. It's going to be voted off Alpha Island with this action soon
|
|
|
|
|
|
|
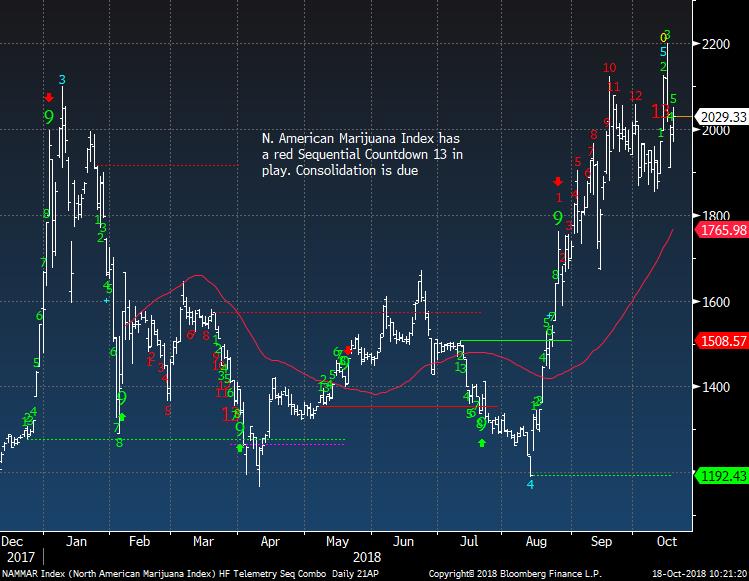
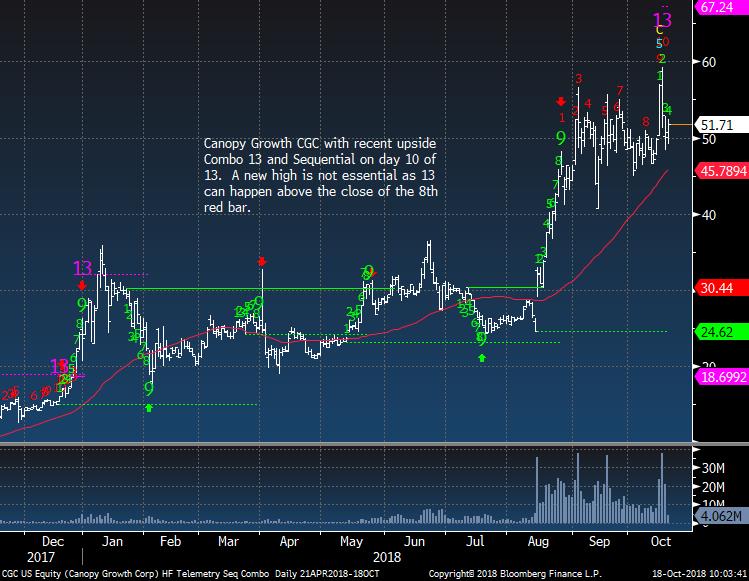
US Sector Focus - Cannabis a potential high
|
|
|
North American Marijuana Index topping.
|
|
|
|
|
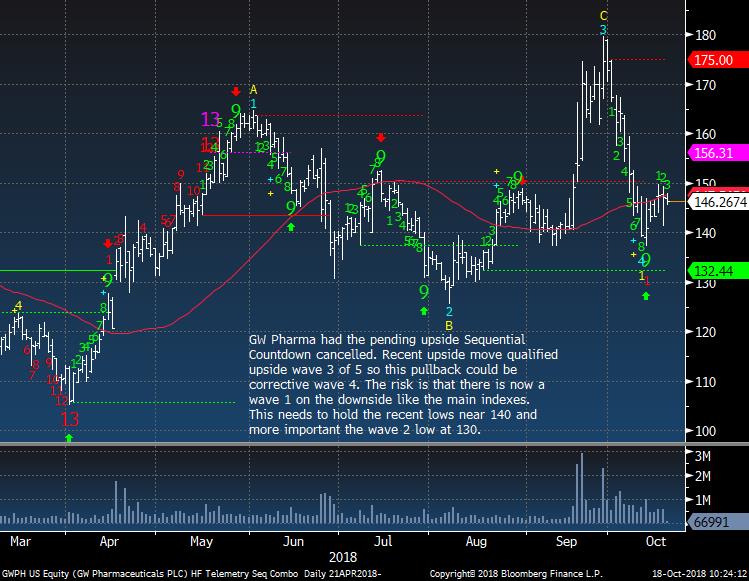
GW Pharma needs to hold some key levels
|
|
|
|
|
|
|
|
|
|
|
|
|
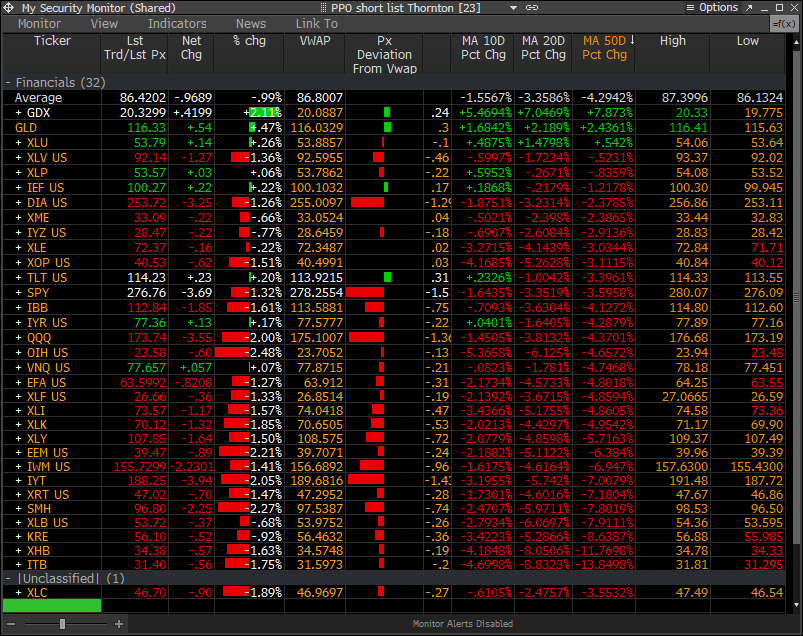
PPO Monitor - Percentage Price Oscillator
|
|
|
The PPO Monitor is a proprietary monitor developed to force rank Indexes, Sectors, and Stocks. It ranks top down by strongest to weakest by percentage above/below the 50 day moving average. Shorter term signals can be seen when the 10 and 20 day moving averages turn up (green) or down (red) which often are followed by the 50 day moving average. This is useful to watch for historically overbought/oversold percentage above/below the 50 day moving average. It is
non correlated with the DeMark Indicators however we have found upside/downside exhaustion signals often occur when something rises to the top or drifts to the bottom of the monitor - increasing the timing aspect. We share this monitor with clients with Bloomberg Terminals. An added feature is that each market/ETF can be expanded with each component force ranked in the same way. A couple other features include price deviation from intraday VWAP (useful for intraday reversals) and new 20 day highs/lows on right side. Please inquire if you would like to be permissioned to use the PPO Monitor.
Today's highlights: The hunt or red October is back. Notice Gold ETF's on top - risk off
|
|
|
|
|
|
|
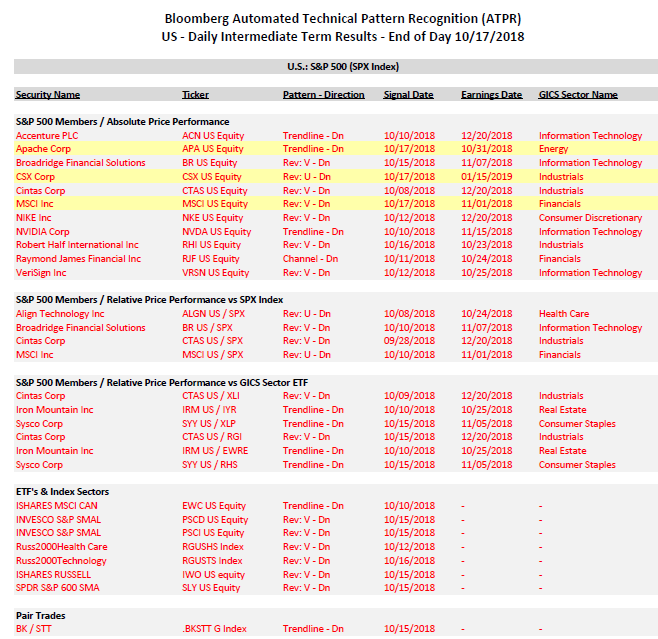
Bloomberg Automated Technical Pattern Recognition Screens
|
|
|
S&P 500 Members/Absolute Price Performance and Relative Price Performance vs S&P 500 and Sector ETF's. ETF's vs Index Sectors. Pair Trades. Long side is first symbol, short side is second symbol. If you would like a PDF from Bloomberg with full details of how this is formulated, please email. We will be doing a webinar in the coming weeks specifically on this system. The screening is finding only short patterns.
|
|
|
|
|
|
|
|
|
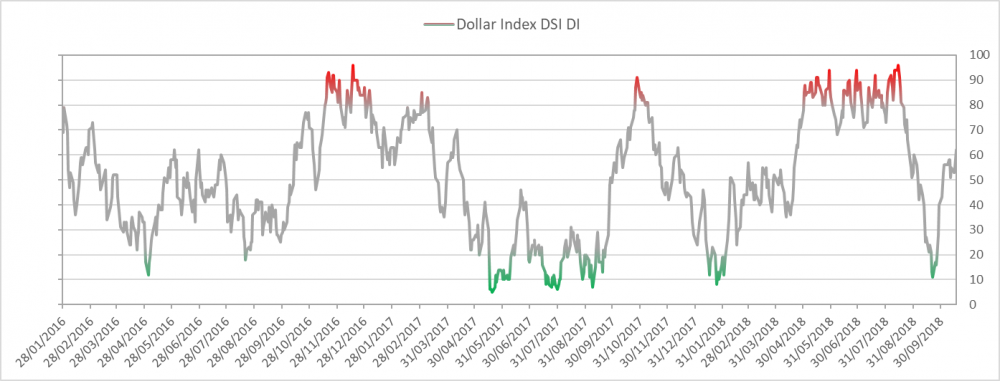
US Dollar bullish sentiment is at 62% and increasing
|
|
|
|
|
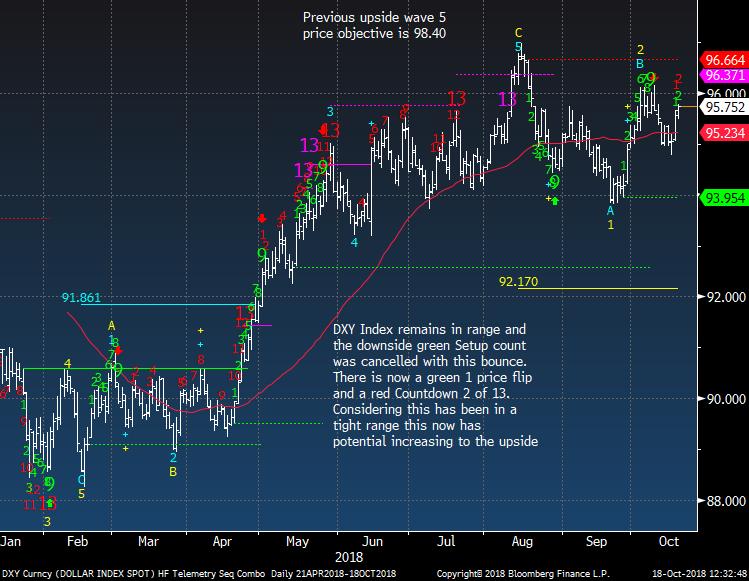
US Dollar Index has an upside Countdown only on day 2 of 13. This should work higher
|
|
|
|
|
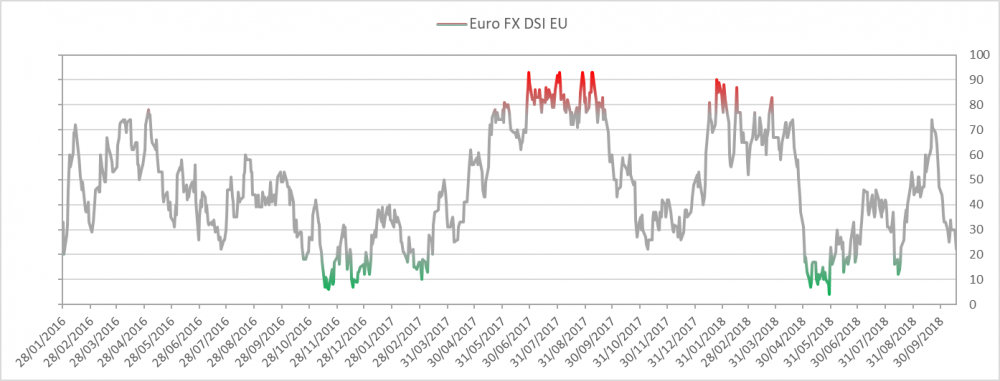
Euro bullish sentiment is at 22%
|
|
|
|
|
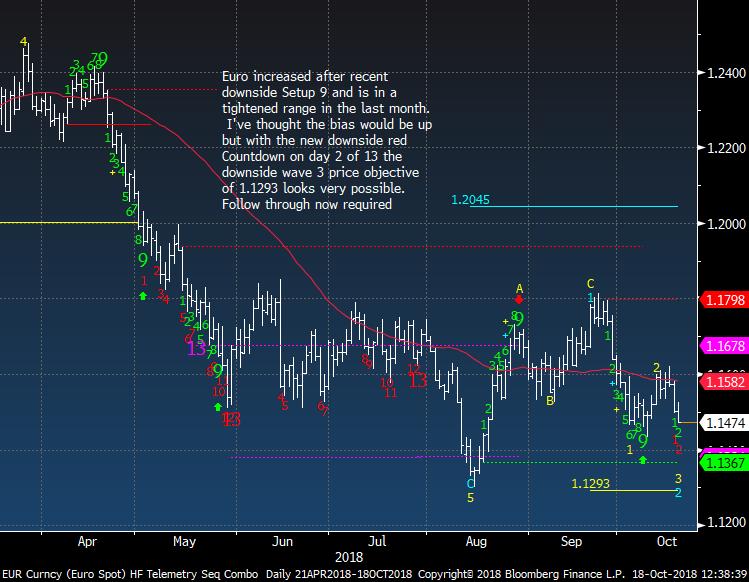
Euro spot on day 2 of 13. This should work lower
|
|
|
|
|
Yuan daily making a new low (closing I am assuming it stays here) and now in wave 5
|
|
|
|
|
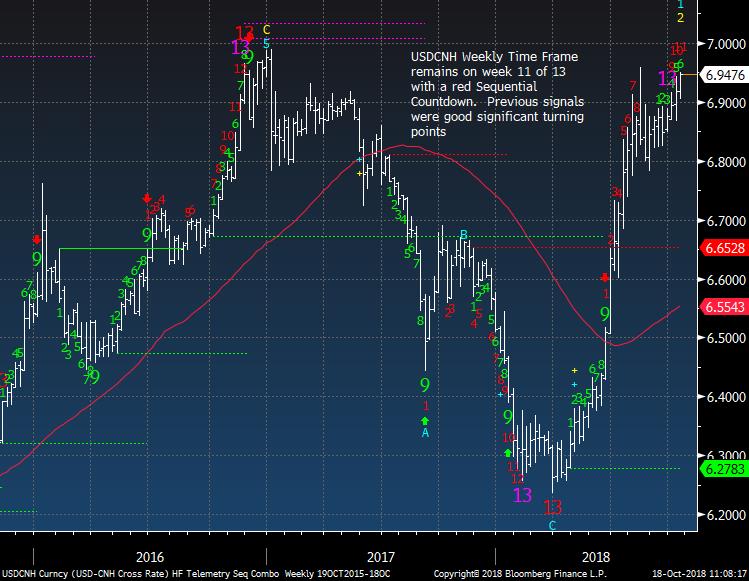
Yuan weekly on week 11 of 13 with red Sequential. The next few weeks could be explosive
|
|
|
|
|
|
|
|
|
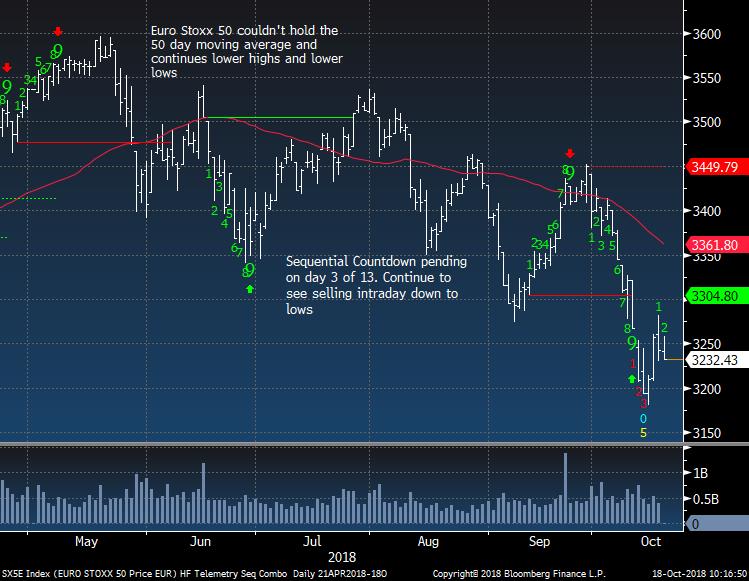
Euro Stoxx 50 can't hold intraday gains
|
|
|
|
|
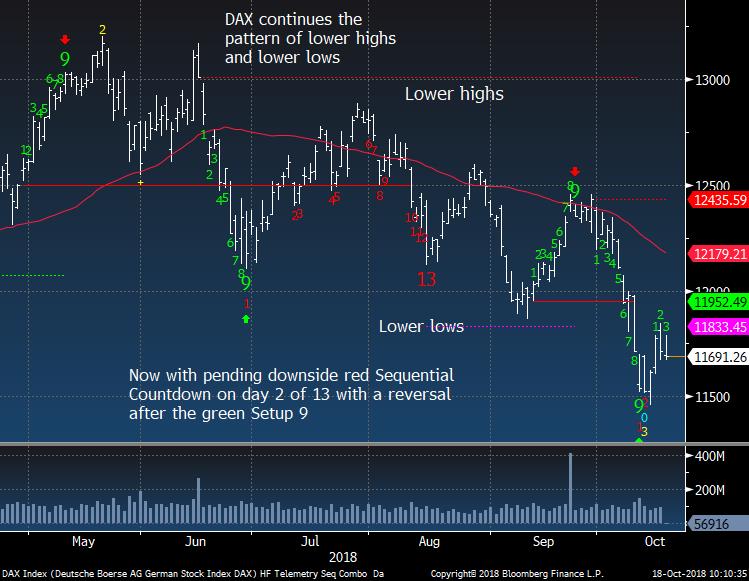
German DAX can't hold intraday gains
|
|
|
|
|
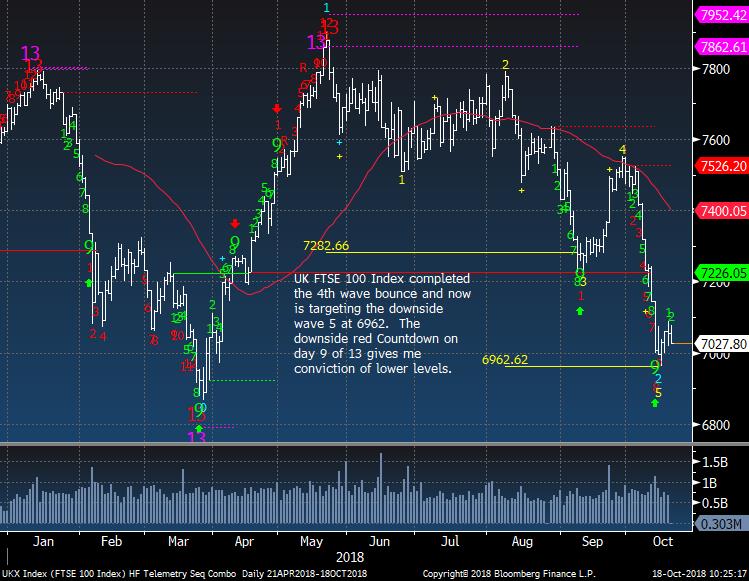
UK at wave 5 support but has a few more days before downside exhaustion signal
|
|
|
|
|
|
|
|
|
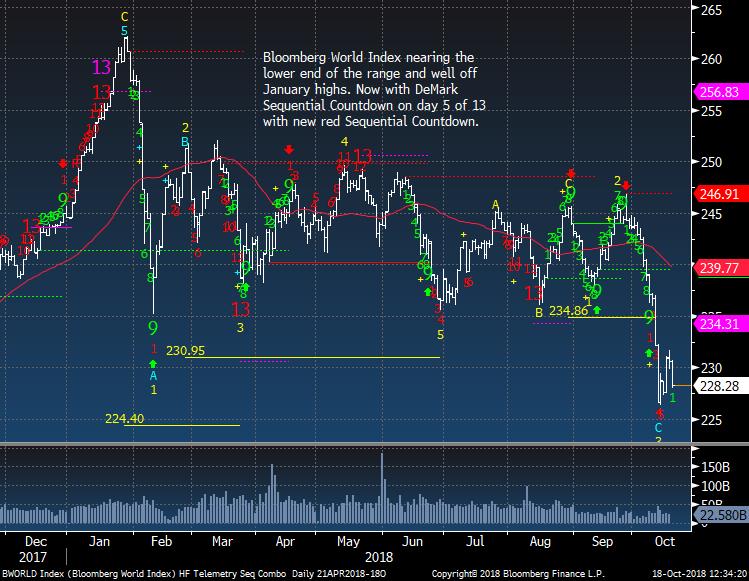
Bloomberg World Index still looks risky lower
|
|
|
|
|
|
|
|
|
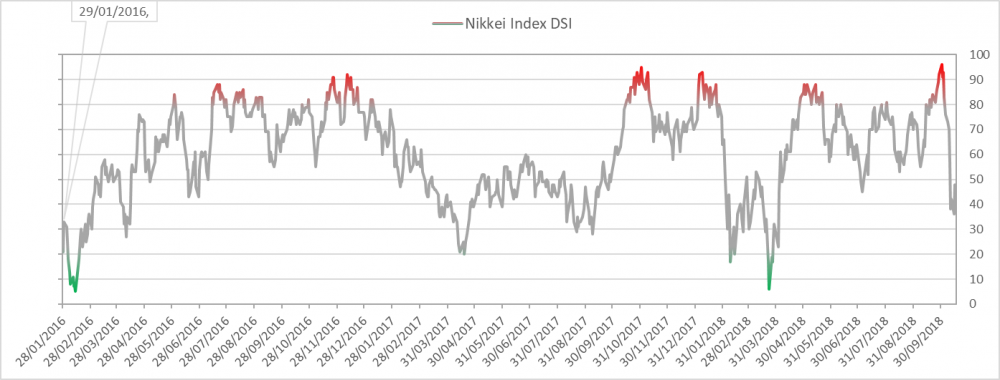
Nikkei bullish sentiment is at 44% after hitting 96% a couple weeks ago
|
|
|
|
|
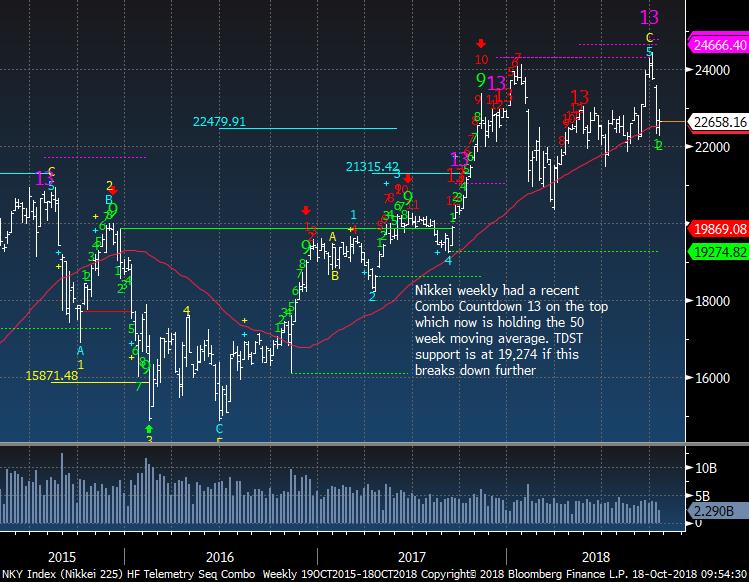
Nikkei Weekly at 50 week moving average support
|
|
|
|
|
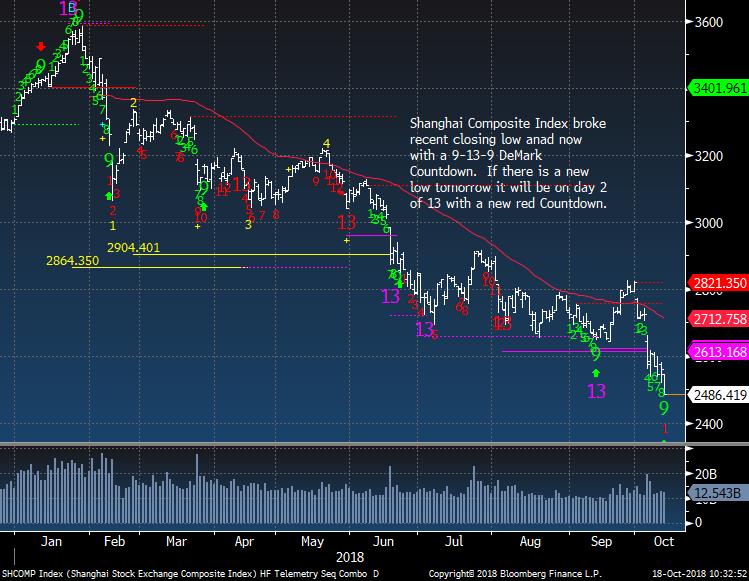
Shanghai with a 9-13-9 DeMark pattern but if this can't turn up in the next few days that pattern won't matter
|
|
|
|
|
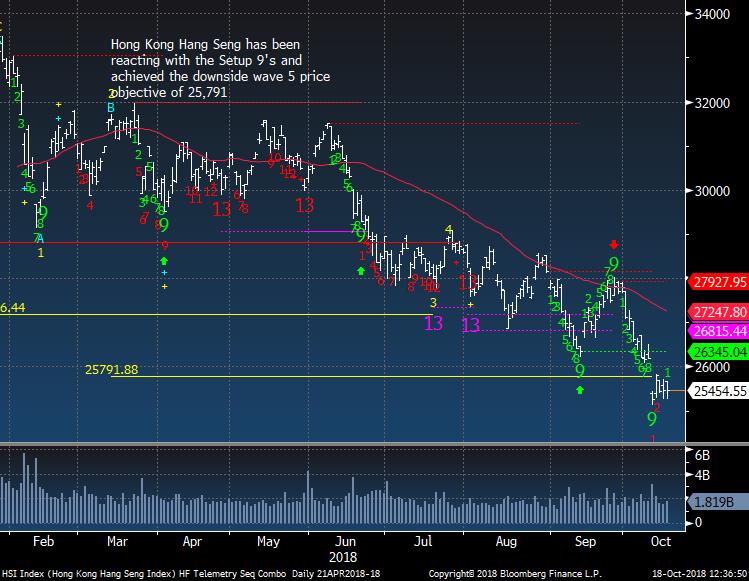
Hong Kong is at risk for lower but let's see how tomorrow trades because if a new low happens then liquidation should accelerate
|
|
|
|
|
|
|
|
|
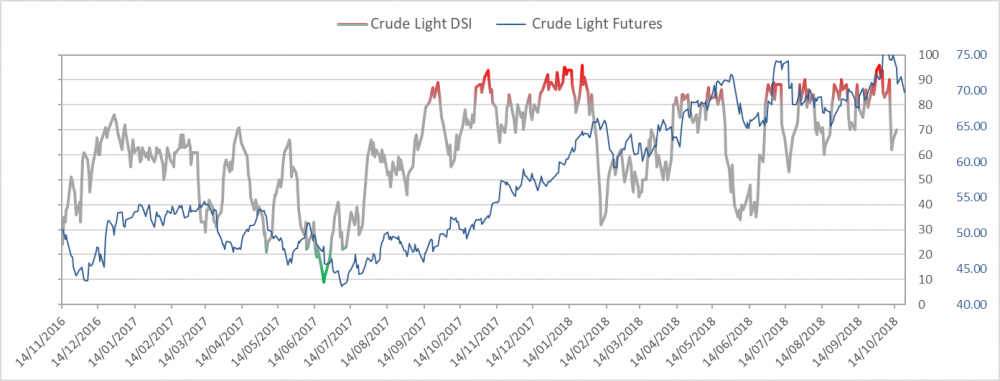
Crude bullish sentiment is at 60% after hitting 96% recently
|
|
|
|
|
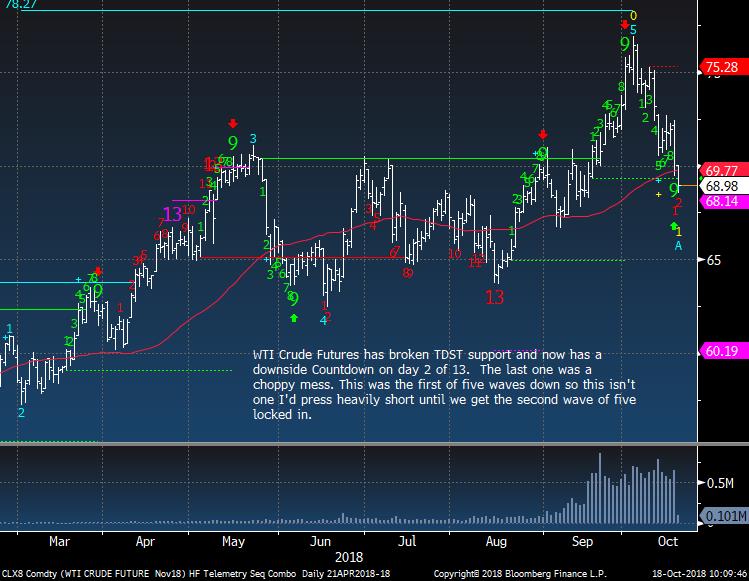
WTI Crude Futures has broken TDST and has potential for a further downside OR another choppy downside red Sequential Countdown
|
|
|
|
|
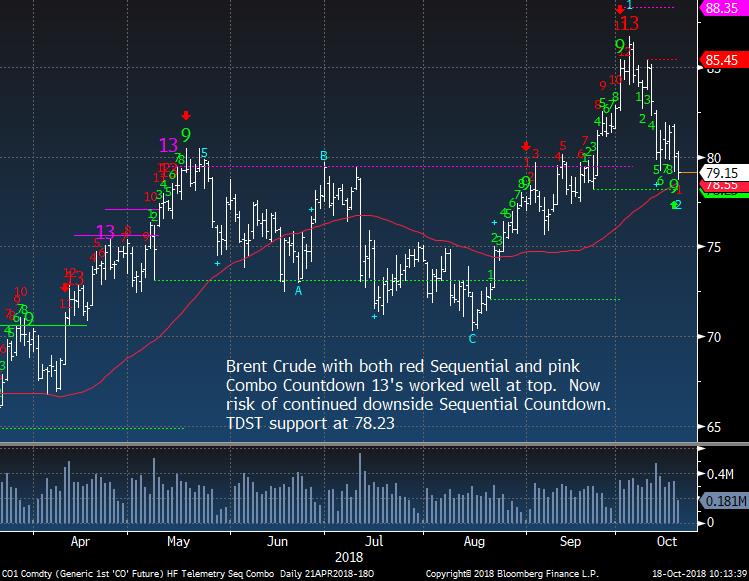
Brent Crude at an important level
|
|
|
|
|
|
|
|
|
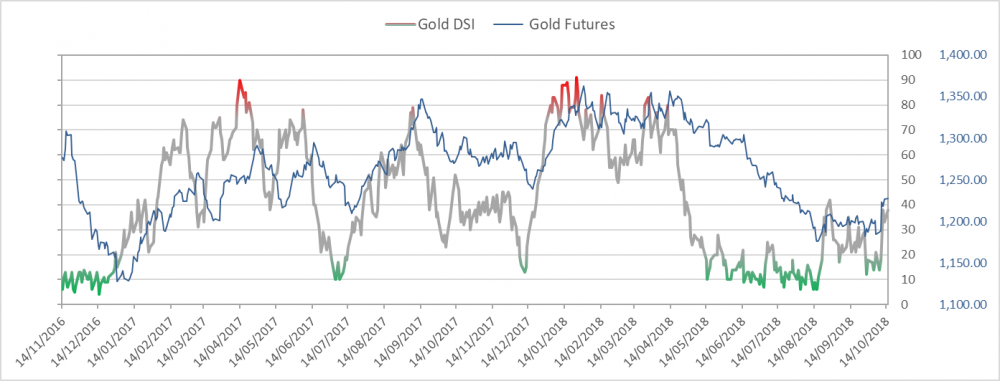
Gold bullish sentiment is at 27%
|
|
|
|
|
Gold still needs some mojo
|
|
|
|
|
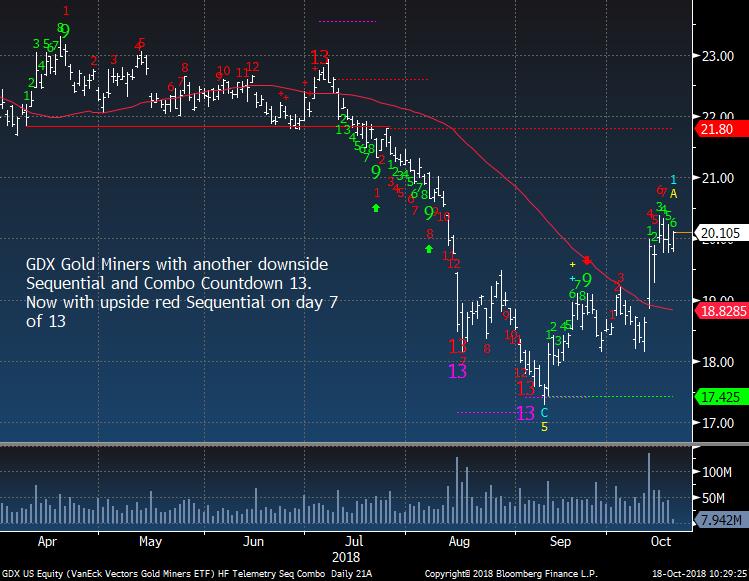
Gold Miners GDX ETF up nicely today in a weak overall market
|
|
|
|
|
|
|
|
|
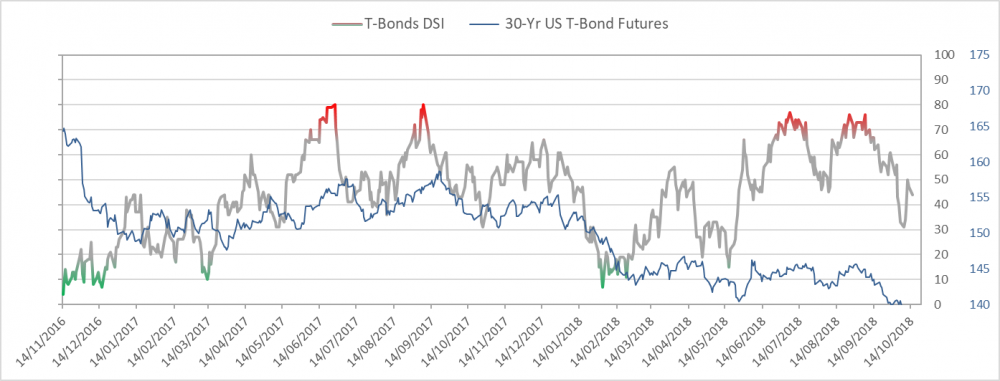
Bond bullish sentiment is at 39%
|
|
|
|
|
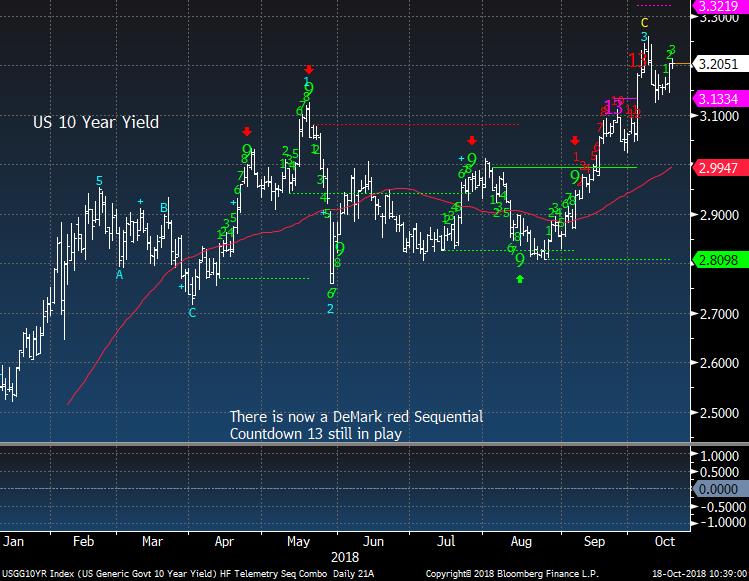
US 10 Year Yield down a little after I grabbed this shot
|
|
|
|
|
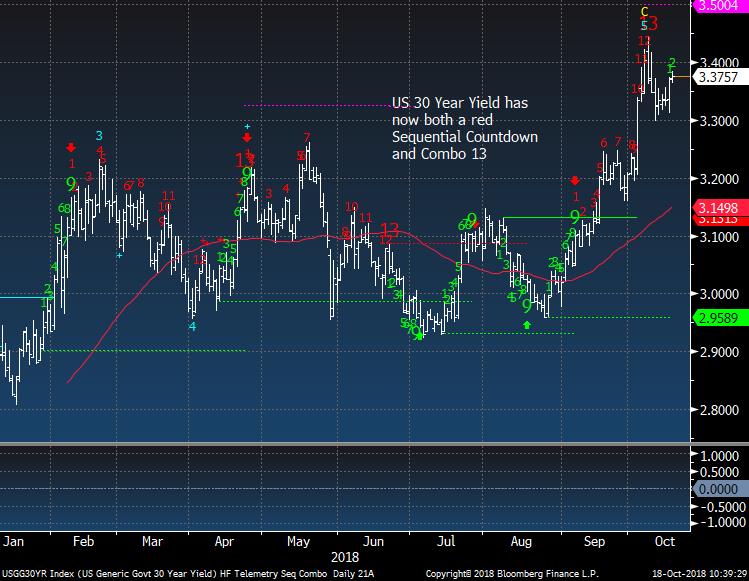
US 30 Year Yield down a little after I grabbed this shot
|
|
|
|
|
|
|
|
|
|
|
DEMARK SCREENS - Daily, Weekly, Monthly Upside/Downside Exhaustion Signals
|
|
|
Daily/Weekly DeMark upside/downside exhaustion signals (Sequential) updated daily, Weekly signals on Monday's and monthly on the first day of the new month. Price flips occur when a stock closes higher/lower than four previous closes and increases conviction of a price turn.
The upside 13's are sell signals and downside 13's are buy signals. Price flip's are confirmation signals that increases potential for a price trend change. For example, if you are long a stock and there is an upside 13, you will want to take cautious action by selling down or out of a position. If initiating a short sale with the upside 13's, we tend to start with a 1/2 size and add with the downside price flip. The opposite is true for when there are downside 13's. Take a 1/2 size position
and add with the upside price flip. The DeMark Indicators are designed to assist the user with buying into weakness and selling into strength to anticipate trend exhaustion. Selling into a rally and buying into a decline often afford the opportunity to exit a trade without too serious a loss if wrong.
S&P 500 Universe:
DAILY UPSIDE 13: BSX, CTL
DAILY DOWNSIDE 13: LYB, MLM
DAILY UPSIDE WITH PRICE FLIP REVERSAL DOWN: NONE
DAILY DOWNSIDE WITH PRICE FLIP REVERSAL UP: AMG, COF,
FBHS, MAC, SLG, SRCL, WMB
Updated: 10/15/18
WEEKLY UPSIDE 13: NONE
WEEKLY DOWNSIDE 13: IVZ, SYMC, WHR
Updated: 10/1/18
MONTHLY UPSIDE
13: ADSK, ALL, CCI, CME, DE, DLR, DTE, ETN, GLW, HPQ, INTU, PH, TPR, TXT, UPS, XLNX
MONTHLY DOWNSIDE 13: NONE
Euro Stoxx 600 Universe:
DAILY UPSIDE
13: NONE
DAILY DOWNSIDE 13: NXT LN, SBRY LN, VOLVB SS
DAILY UPSIDE WITH PRICE FLIP REVERSAL DOWN: NONE
DAILY DOWNSIDE WITH PRICE FLIP REVERSAL UP: ACKB BB, BPSO IM, GJF NO, GLB ID, ICAD FP, ISP IM, JYSK DC, PFG LN
Updated: 10/15/18
WEEKLY UPSIDE 13: MUV2 GR
WEEKLY DOWNSIDE 13: BAS GR, FHZN SW, FRA GR, IMB LN, JMT PL, ONTEX BB, OSR GR
Updated: 10/1/18
MONTHLY UPSIDE 13: BNZL LN, EXPN LN, FPE3 GR, SBMO NA, SECUB SS, SWEDA SS
MONTHLY DOWNSIDE 13: BAYN GR, HMB SS, TEF SM
|
|
|
Unsubscribe me from Hedge Fund Telemetry
Hedge Fund Telemetry LLC, P.O. Box 4675, Greenwich, CT 06861, United States
CONFIDENTIALITY NOTE and DISCLAIMER: This message is for the named person's use only. It may contain confidential, proprietary or legally privileged material. No confidentiality or privilege is waived by any accidental or unintentional transmission. If you receive this message in error, please immediately delete it and all copies of it from your system, destroy any hard copies and notify the sender. You must not, directly or indirectly, use, disclose,
distribute, print or copy any part of this message if you are not the intended recipient. Hedge Fund Telemetry LLC. cannot guarantee the confidentiality of the material transmitted; therefore, information of a sensitive or confidential nature should not be transmitted. There is risk in trading markets. Hedge Fund Telemetry LLC reports are based on information gathered from various sources and believed to be reliable, but are not guaranteed as to accuracy and completeness. The information is subject to change without notice and Hedge Fund Telemetry LLC has no obligation to provide any updates or changes. Hedge Fund Telemetry LLC is providing this data for informational and educational purposes and does not believe that it is sufficient to base an investment decision on. This information should not be regarded as a solicitation or recommendation of any particular security or to engage in any trading strategy. One should always check with your licensed financial
advisor to determine suitability of any investments.
|
|
|
|
|