|
|
|
|
|
|
As good as it gets for consumer confidence?
|
|
|
Yesterday after the Consumer Confidence numbers were released President Trump highlighted consumer confidence is as high as November 2000. With consumer confidence hitting previous highs and the unemployment rate at historically low levels, am asking if this is as good as it gets? I ran some charts with the DeMark Indicators on the Consumer Confidence numbers and the results might surprise you.
The equity market indexes continues to rip higher and as someone who has had a
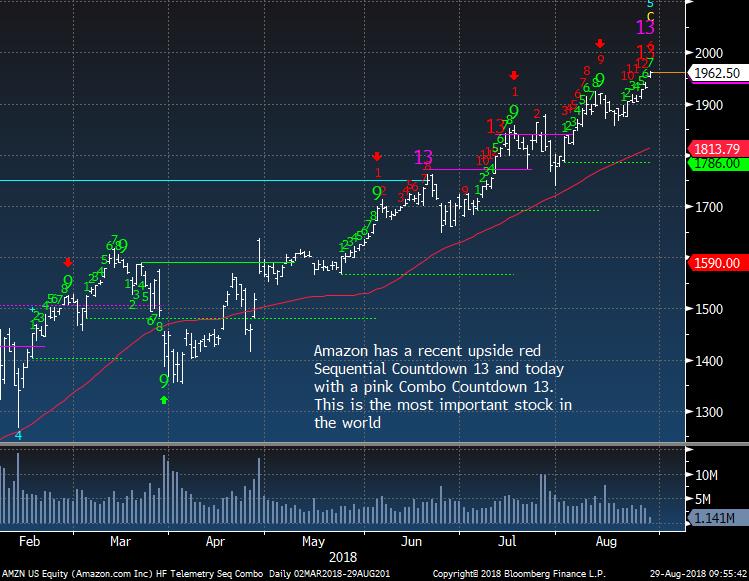
cautious to bearish bias, it doesn't feel good. The one regret I have had is that I have not embraced the mega cap tech stocks - notably Amazon. I was right on Facebook and Netflix but wrong on Amazon. Earlier today Morgan Stanley upped their price target to $2500. When the stock opened at 1950 I was stopped out of my short. (all stocks have a 10% stop loss level at inception). Amazon also has both the DeMark Sequential and Combo upside exhaustion signals in the past couple days. One of my old PM's would often would say that the stop levels were probably the best place to be initiating a trade. I will find a place to reengage but a few days off from this one seems healthy.
I've had a few people ask why there isn't a down turn after the recent upside exhaustion signals seen in the past week on all of the major indexes. Rule of thumb is that after an exhaustion signal a price reversal is expected within 10-12 days. Back in January, there
were upside exhaustion signals and price lifted higher for a few days before a price reversal of 10%. With lack of downside liquidity, extreme sentiment readings, lack of short interest, and narrow attribution of the mega big caps doing the heavy lifting, there is a real risk ahead.
Housekeeping note: We are launching our second version of our website and Daily Note in the coming week. Subscribers will be getting a change of password email so they will be able to access the site and Daily Note. As some of you have distributed the Daily Note, your friends and clients who will want to read the note will also have to be a subscriber. For those who want to become a subscriber click here.
- US Markets - Sentiment extreme, Upside exhaustion signals but potential scenario for SPX to go higher
- Hedge Fund Telemetry Trade Ideas - AMZN
stopped
- Consumer Confidence - As good as it gets?
- Erlanger Type 4's are still powering the market higher
- Fire Eye Update
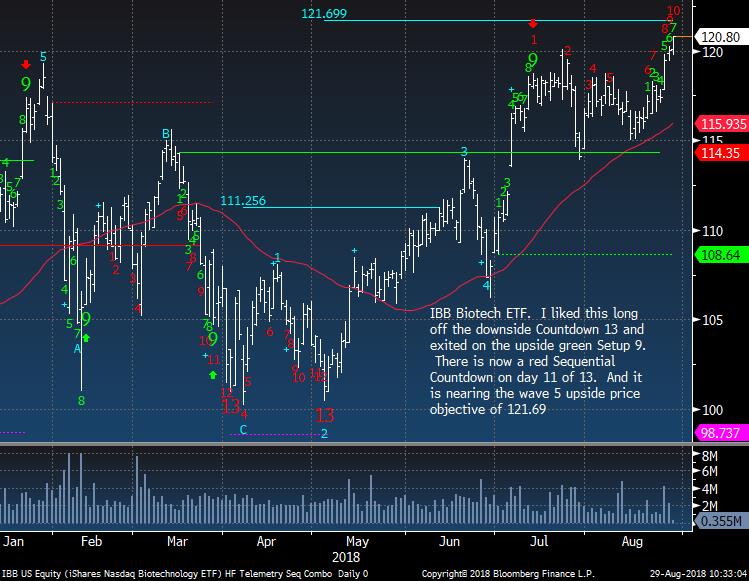
- IBB Biotech Update
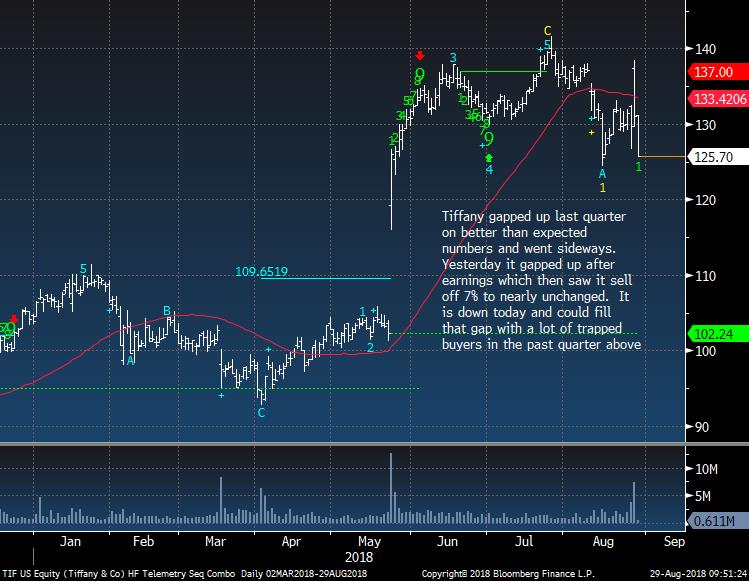
- Tiffany and Costco Update
- Amazon and Google Update
- Currency Update - Watch the Yuan as it dropped last night
- European Market Update - Still like Euro Stoxx 50 long
- Global Market Update - Added Australia and Canada
- Asian Market Update - Nikkei upside exhaustion
today
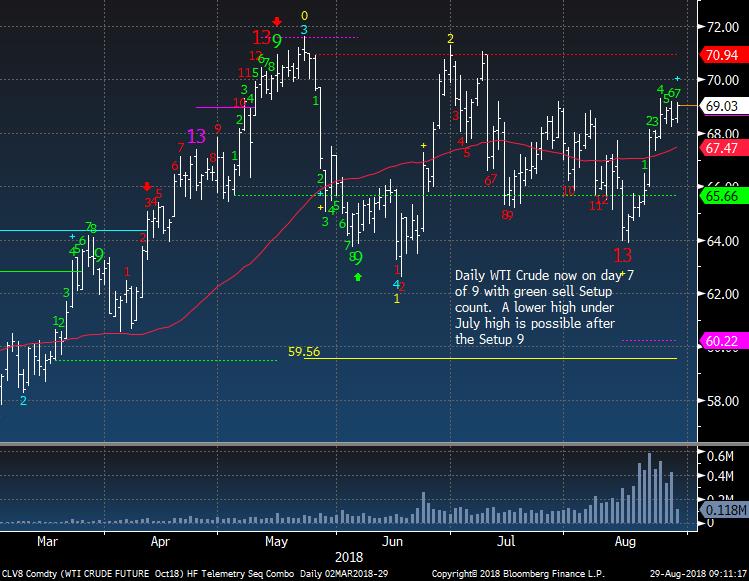
- Crude Update - Extreme sentiment but crude remains bid
- Gold Update - No thrust yet
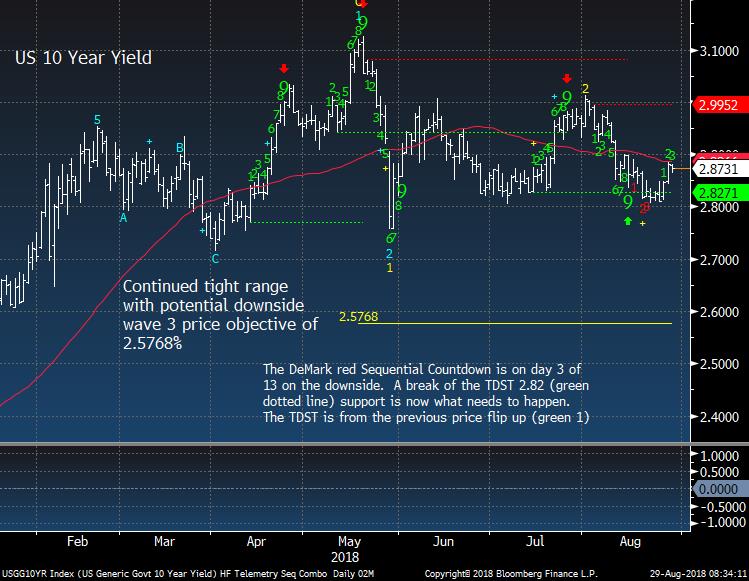
- Bond Update - 10 year still in tight range
- DeMark Screens - Daily, Weekly, Monthly upside/downside exhaustion signals within the S&P 1500 and Euro Stoxx 600
|
|
|
|
|
Here's a link to the Hedge Fund Telemetry market sentiment page with 40 charts of sentiment including equities, bonds, currencies, and commodities updated each day.
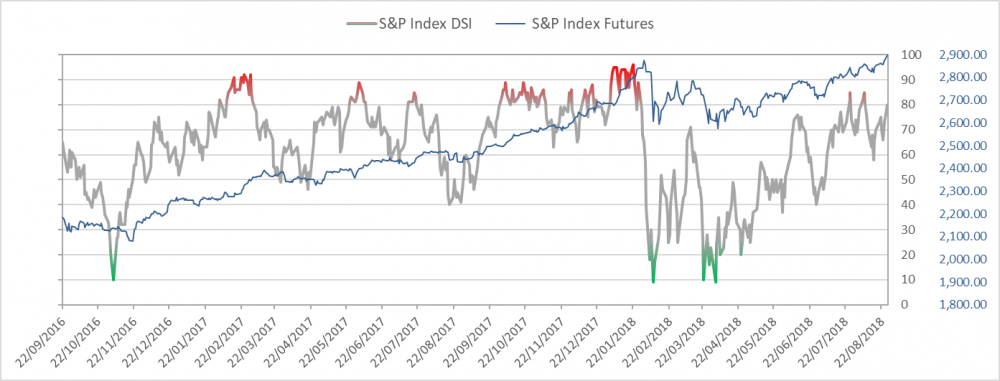
SPX bullish sentiment is at 75%
|
|
|
|
|
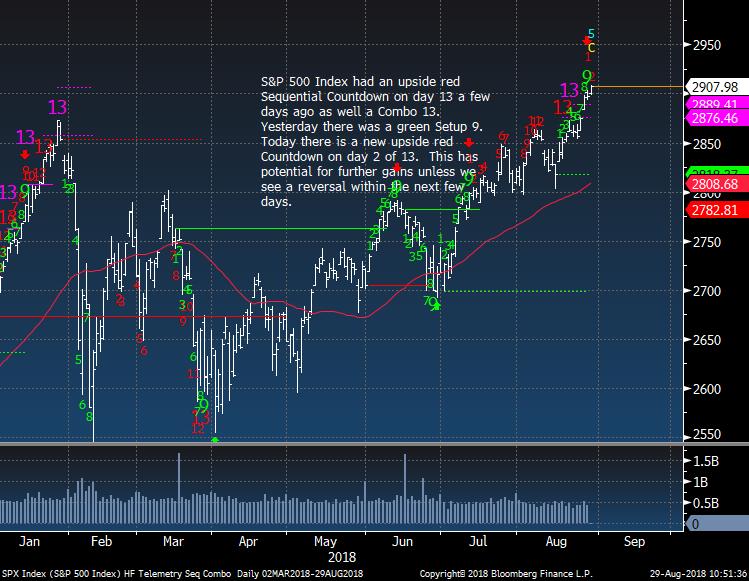
SPX daily now has some possibility of a continuation with a new secondary upside red Countdown. A reversal down in the coming days has to happen or else we could see this continue to 13. We saw secondary upside exhaustion Countdowns in January too.
|
|
|
|
|
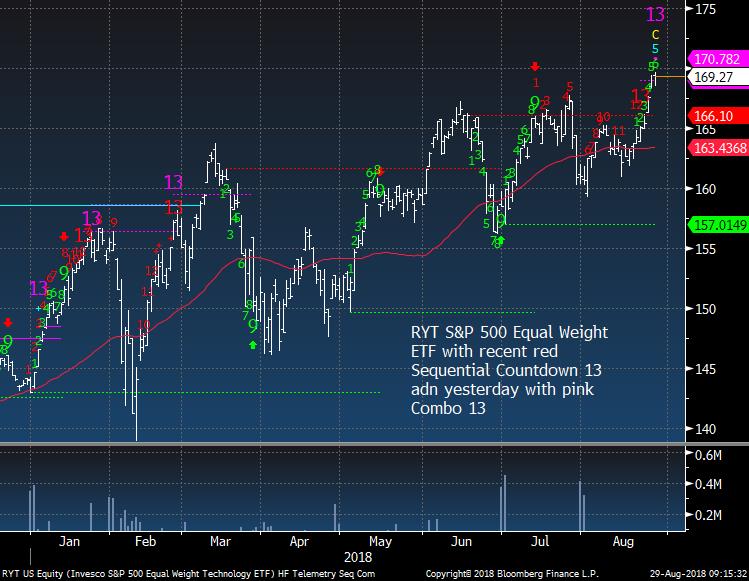
Equal Weight S&P ETF with Combo 13
|
|
|
|
|
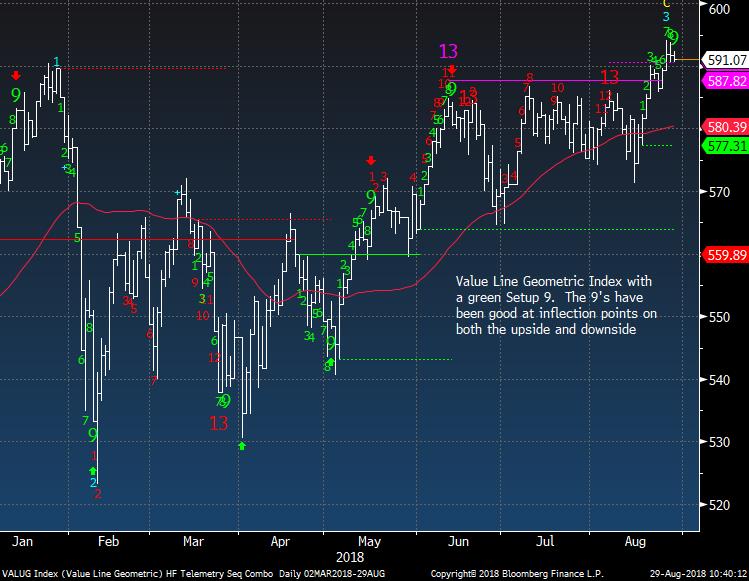
Value Line has a green Setup 9.
|
|
|
|
|
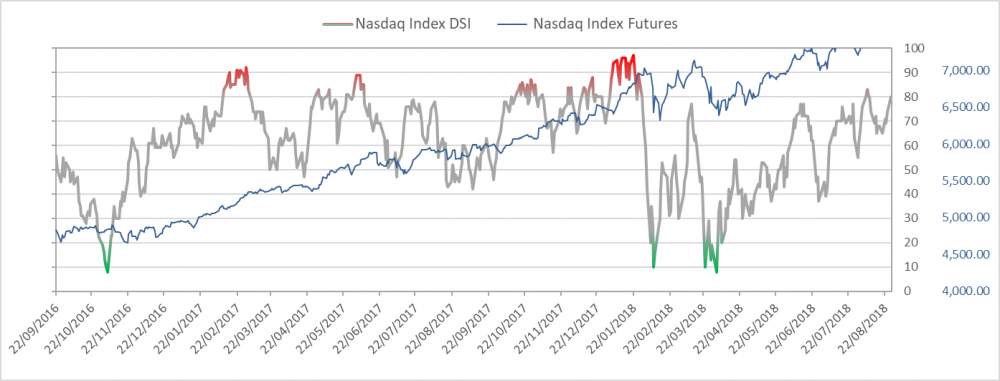
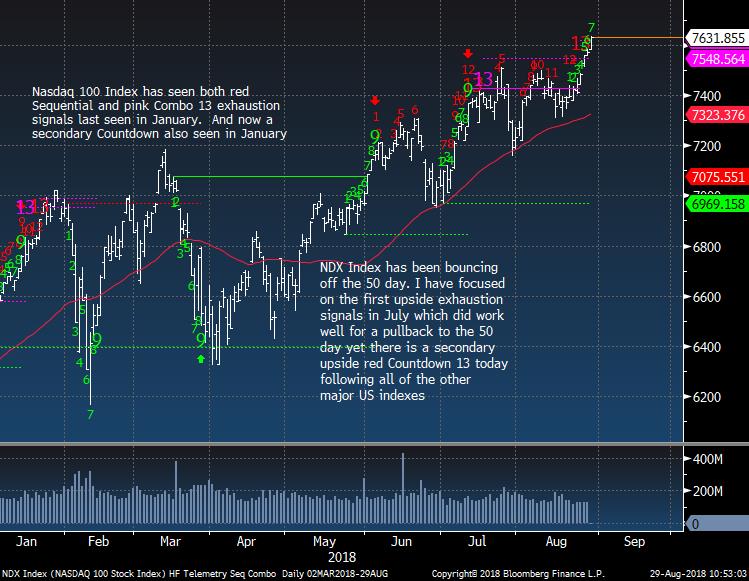
Nasdaq bullish sentiment is at 77%. Pardon the formatting issue with price. Our new charts coming out next week will be much better
|
|
|
|
|
|
|
|
|
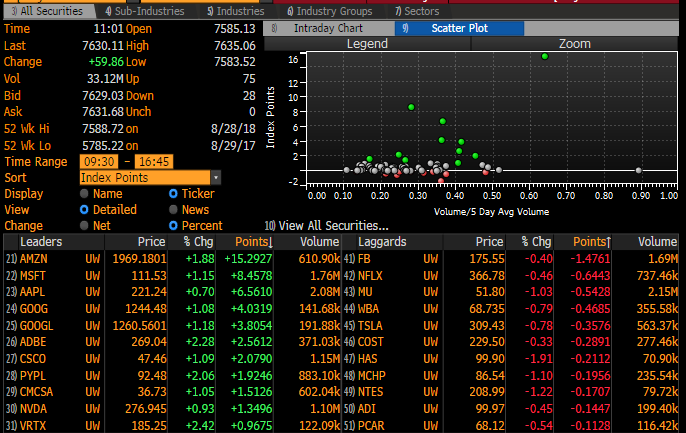
NDX Attribution today shows AMZN, MSFT, AAPL, GOOGL attributing more than have the gains. When these go down the narrow attribution will happen and that will be felt.
|
|
|
|
|
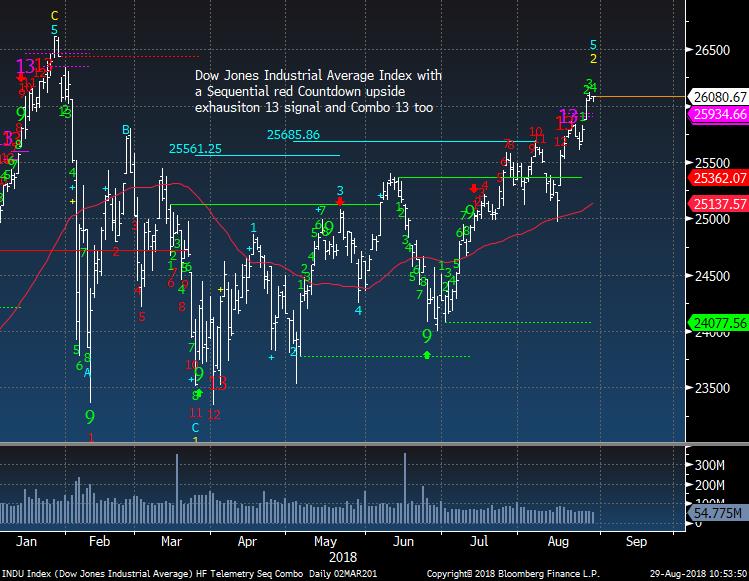
Dow Jones Industrial Average a bit of an overthrow similar to January
|
|
|
|
|
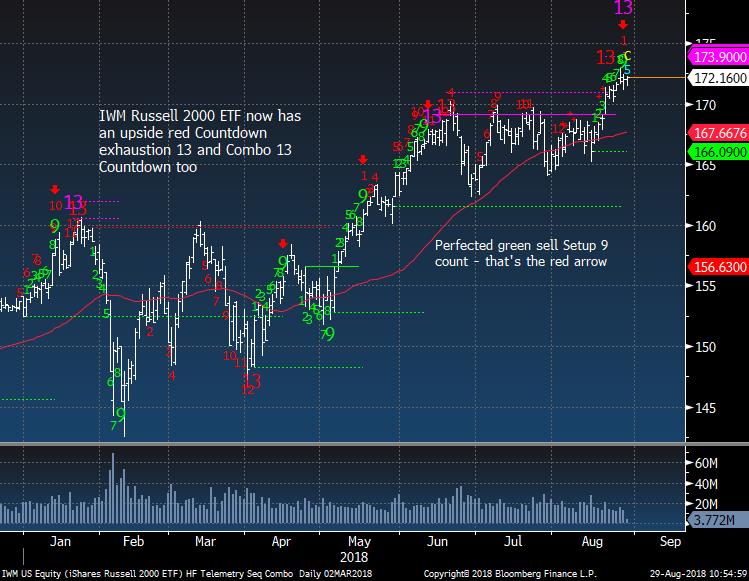
IWM Russell 2000 with a Combo 13 today
|
|
|
|
|
|
|
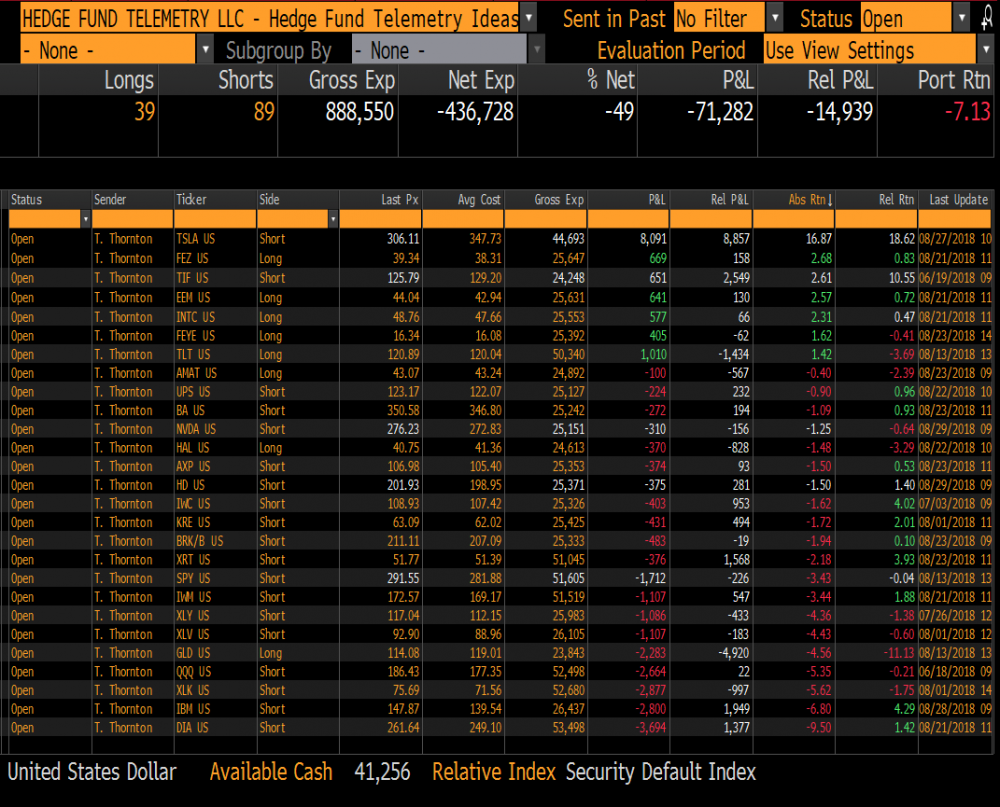
Hedge Fund Telemetry Trade Ideas
|
|
|
Trade Ideas - stopped on AMZN. No other changes.
|
|
|
|
|
|
|
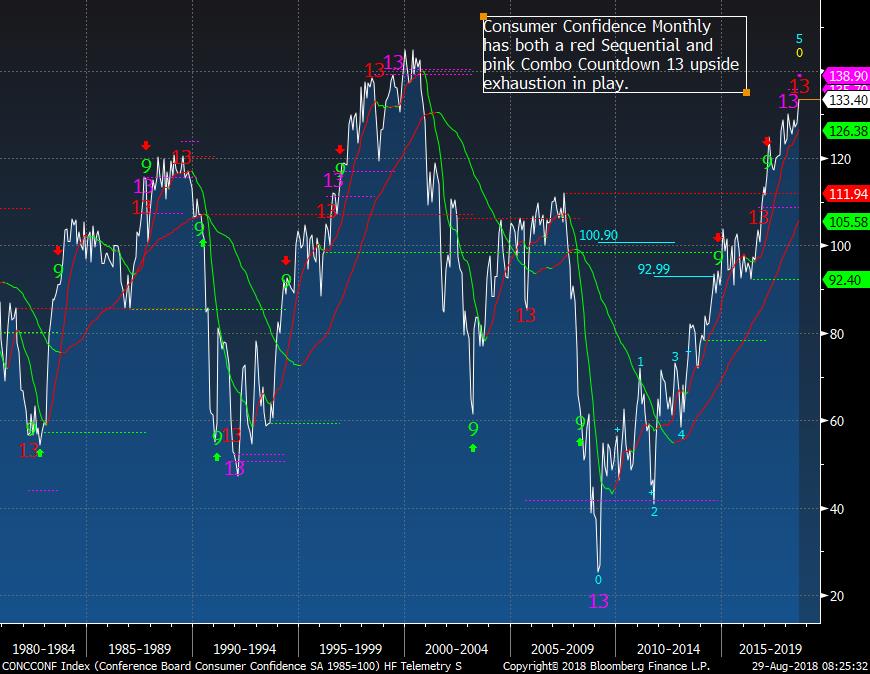
Consumer Confidence - As good as it gets?
|
|
|
Monthly Consumer Confidence has some upside Countdown 13's as seen near tops.
|
|
|
|
|
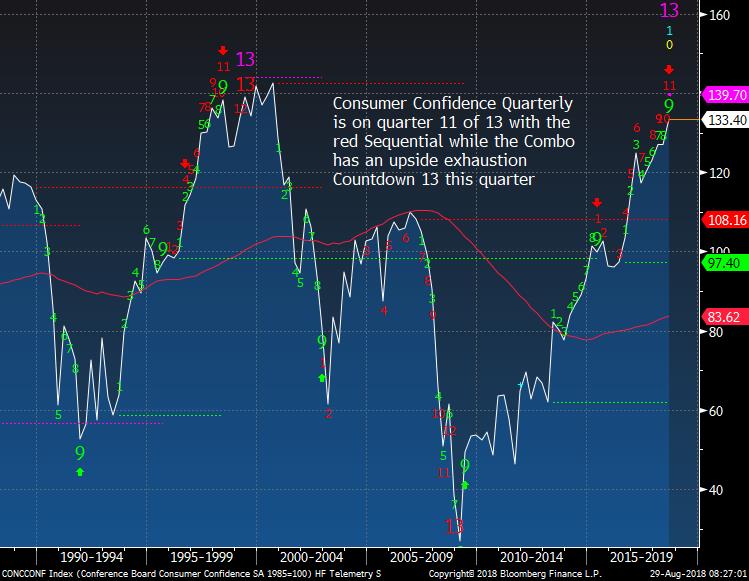
Quarterly has a pink Combo but on quarter 11 of 13 with red Sequential Countdown.
|
|
|
|
|
|
|
Erlanger Type 4's still powering the market higher
|
|
|
The purple highlighted sectors are Type 4's from Erlanger Research. These are stocks that have very little short interest. When there is little short interest the risk of a "long squeeze" is quite possible.
|
|
|
|
|
When Type 4's hit 10% the risk in the market is higher.
|
|
|
|
|
|
|
|
|
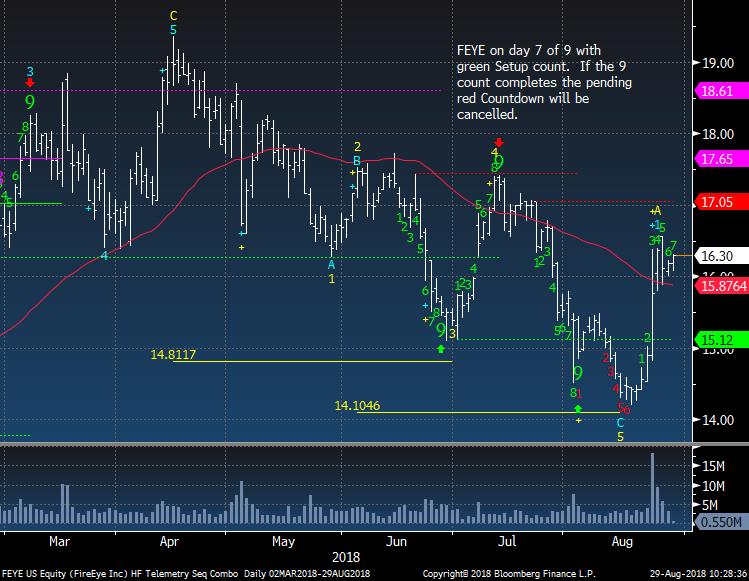
FEYE still looks good and I like this on the long side.
|
|
|
|
|
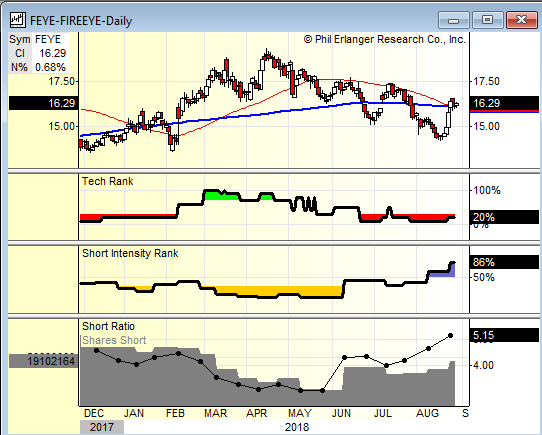
FEYE is now becoming a crowded short with short intensity at 86%. This is the opposite of the Type 4's as this is a Type 1 short squeeze candidate.
|
|
|
|
|
|
|
|
|
IBB nearing upside exhaustion.
|
|
|
|
|
|
|
Tiffany and Costco Update
|
|
|
Tiffany is now reversing down. I expect more retailers to start to come back to earth.
|
|
|
|
|
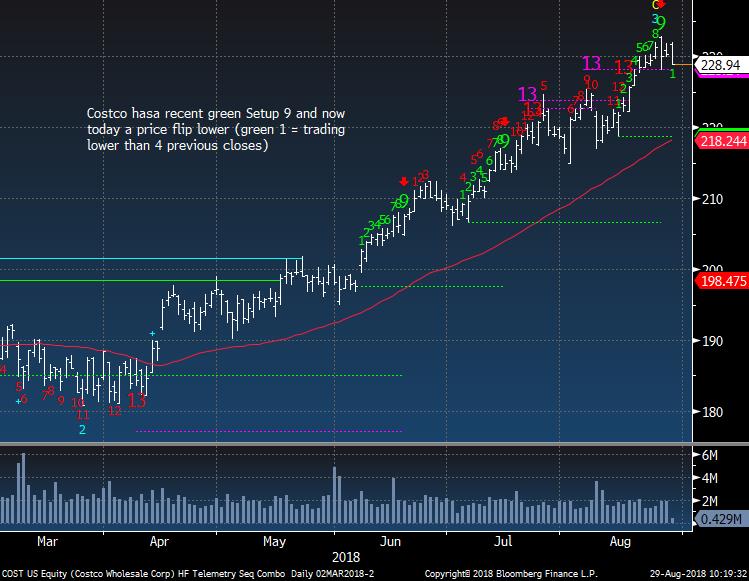
Costco went up after a not so great report and could start to come back down now
|
|
|
|
|
|
|
|
|
Just unreal how strong this stock has been and with both Sequential and Combo upside exhaustion signals in play, we should see a reversal soon. Also this is a perfect Type 4 stock with very very little short interest.
|
|
|
|
|
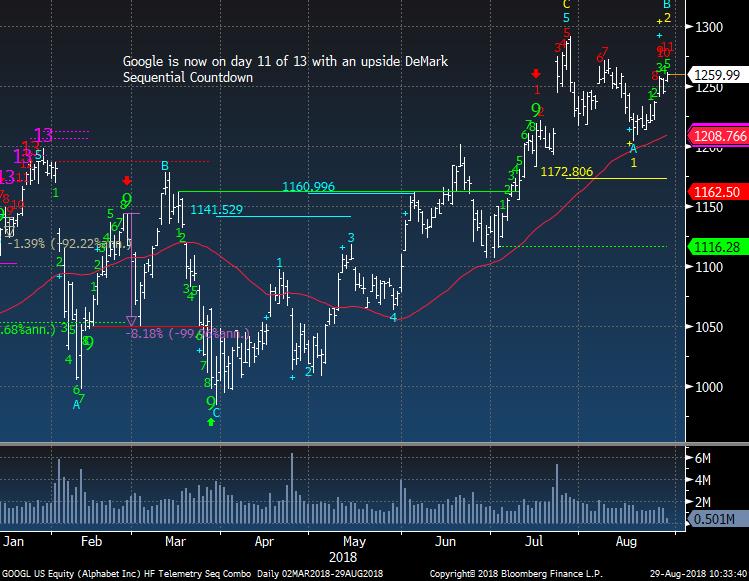
Google is getting close to upside exhaution
|
|
|
|
|
|
|
|
|
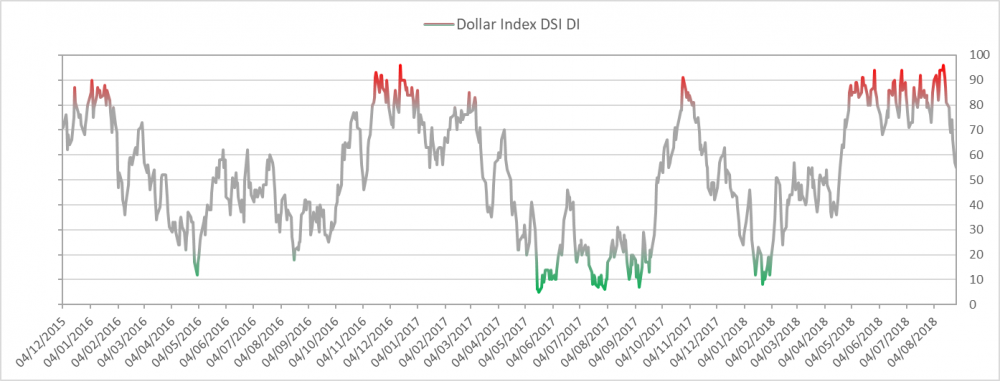
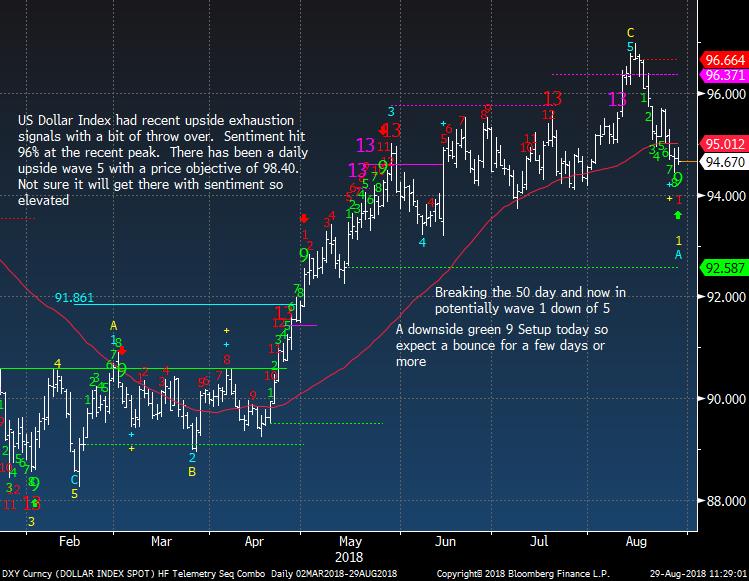
US Dollar bullish sentiment is at 55% and down from 96% recent peak
|
|
|
|
|
|
|
|
|
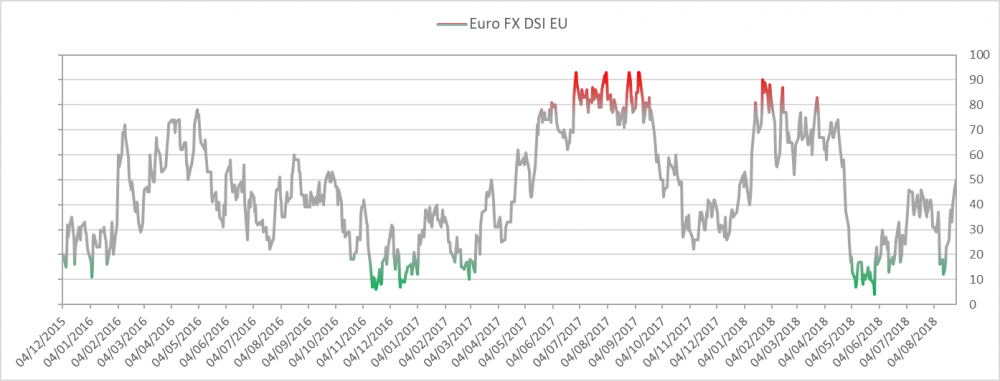
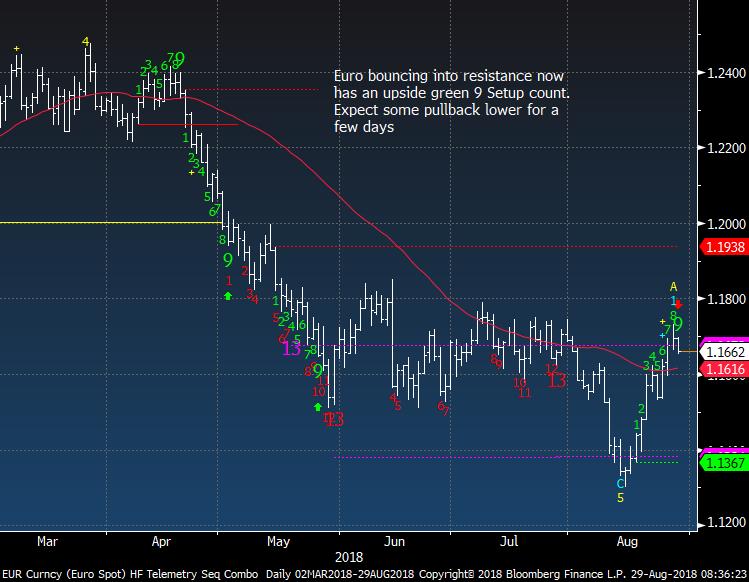
Euro bullish sentiment is at 50%
|
|
|
|
|
|
|
|
|
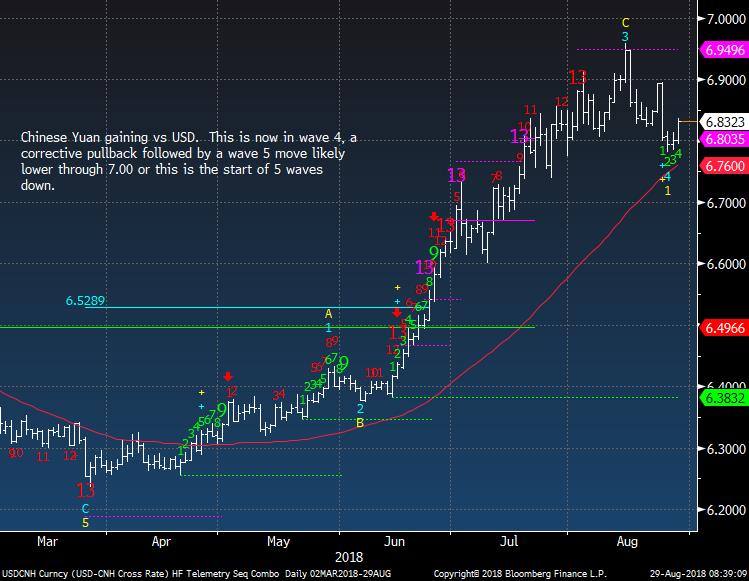
Yuan dropped last night and if this continues this could be a catalyst for selling around the world
|
|
|
|
|
|
|
|
|
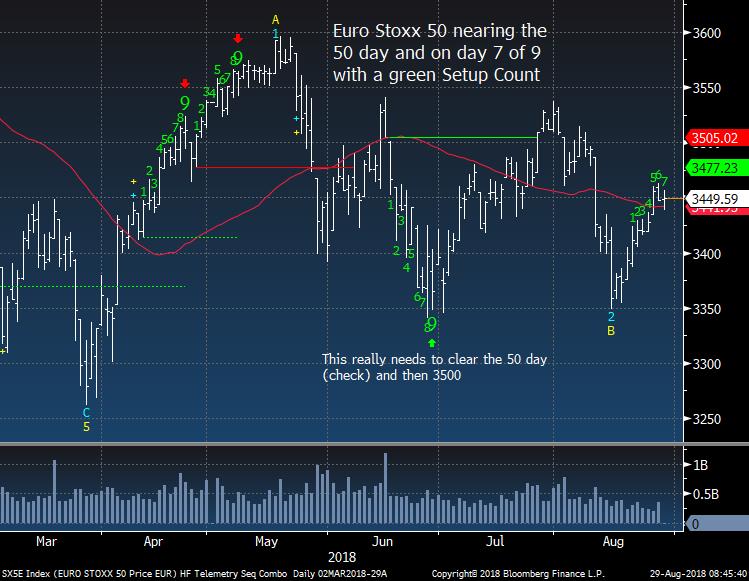
Euro Stoxx 50 still ok as a long
|
|
|
|
|
|
|
|
|
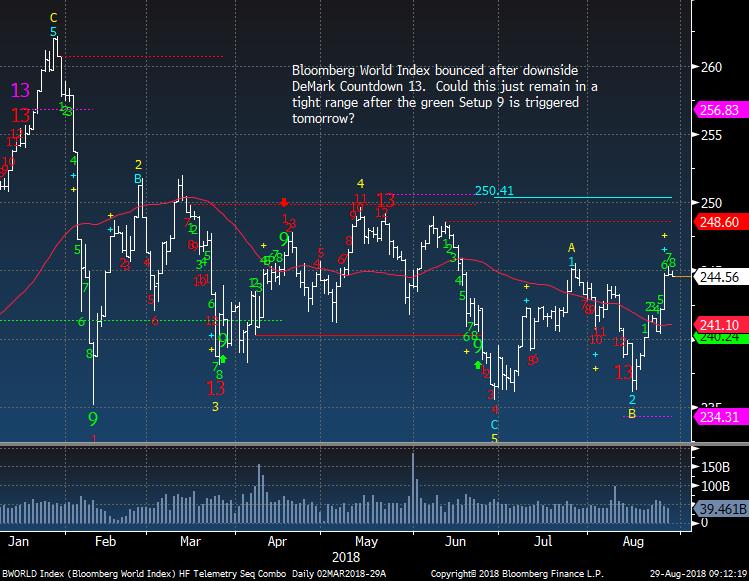
Bloomberg World Index still so far from January highs.
|
|
|
|
|
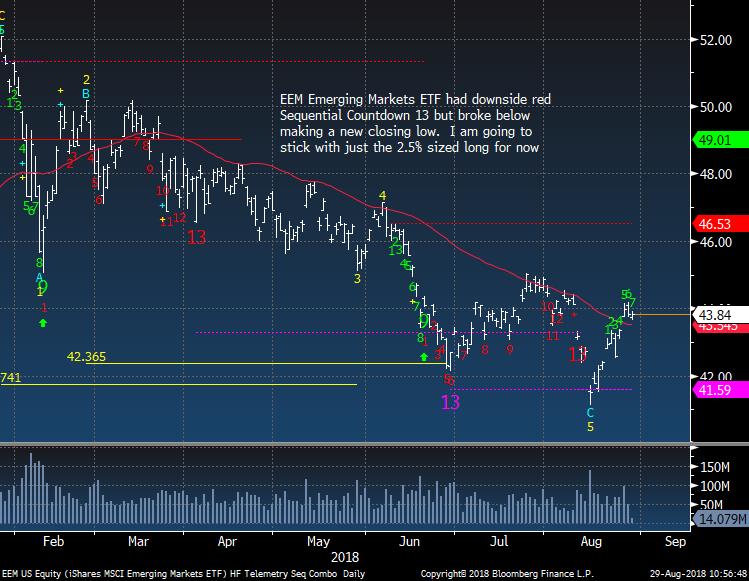
EEM Emerging Markets ETF holding the 50 day
|
|
|
|
|
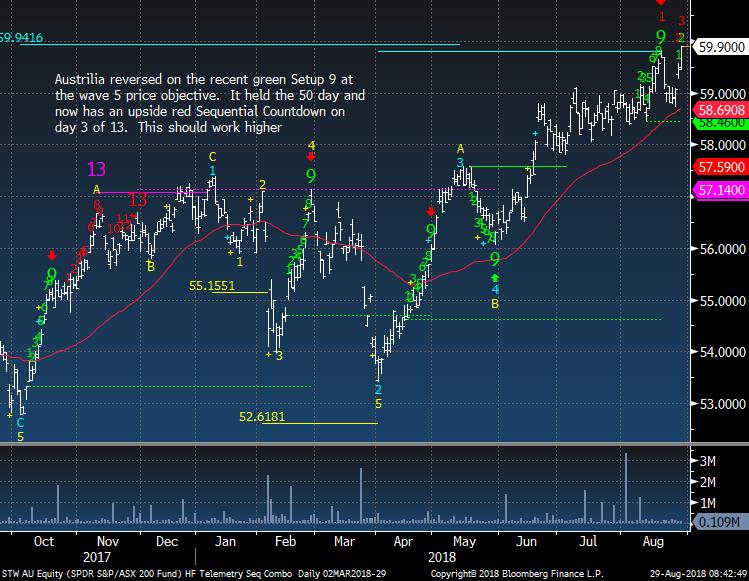
Australia ASX 200 looks higher
|
|
|
|
|
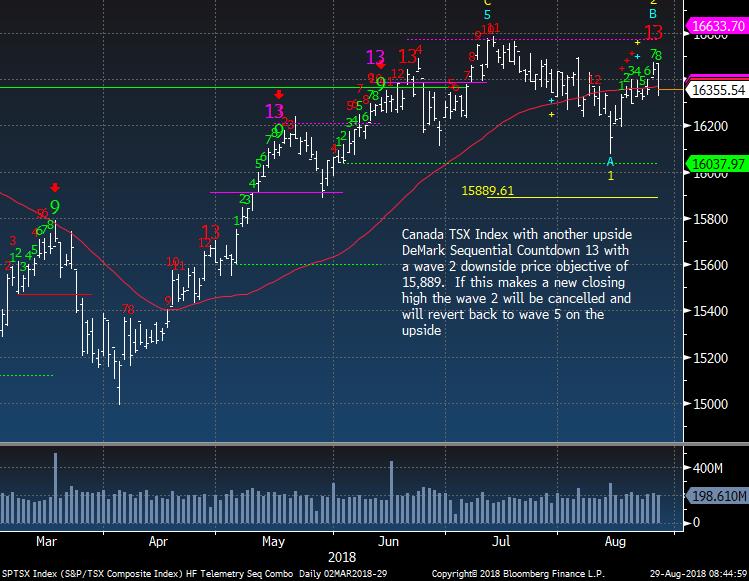
Canada TSX with a Sequential Countdown 13
|
|
|
|
|
|
|
|
|
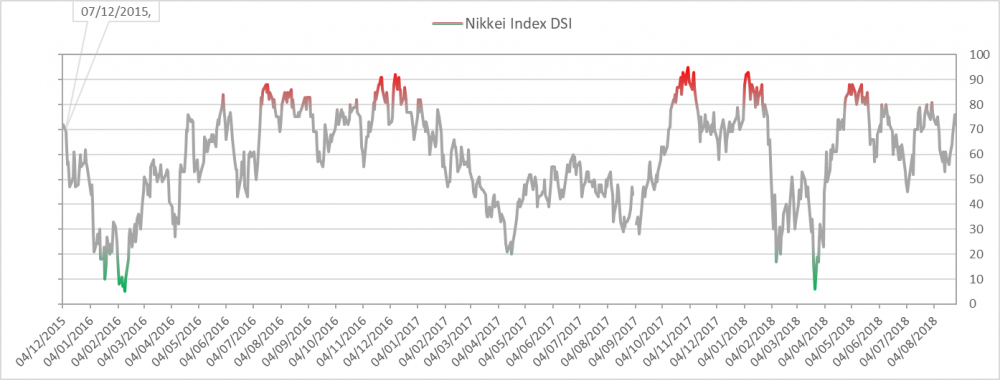
Nikkei bullish sentiment is at 72%
|
|
|
|
|
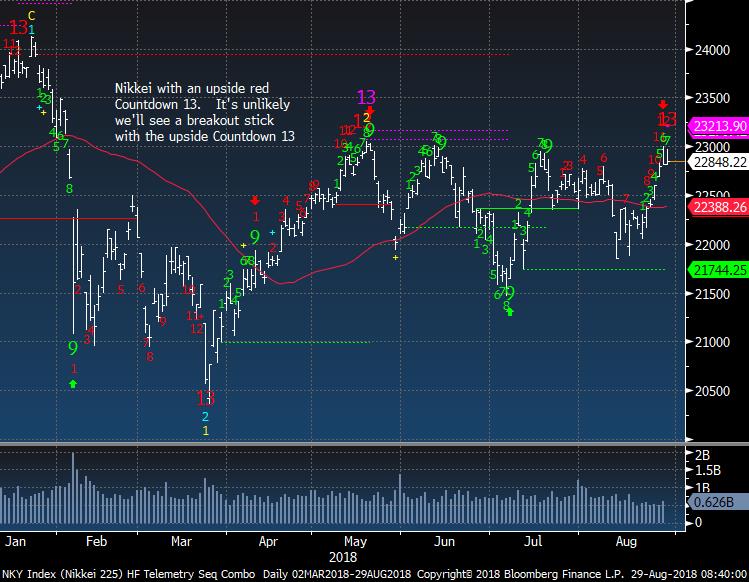
Nikkei upside exhaustion today
|
|
|
|
|
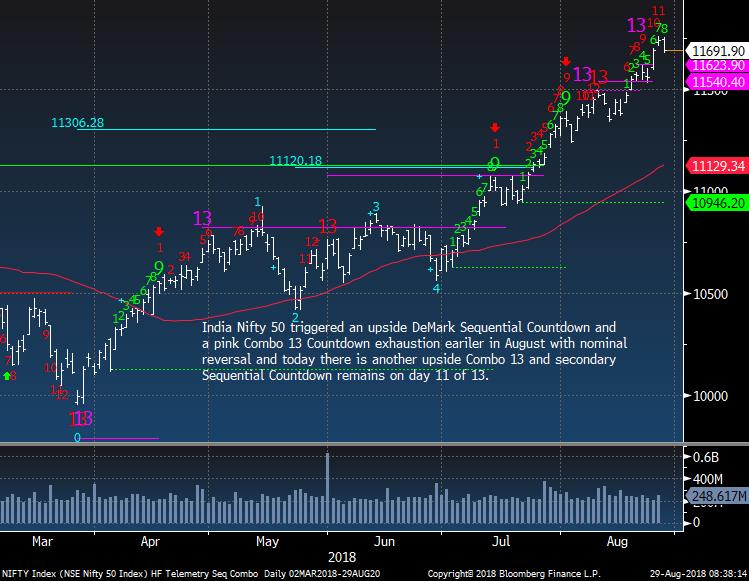
India Nifty 50 Index no changes
|
|
|
|
|
|
|
|
|
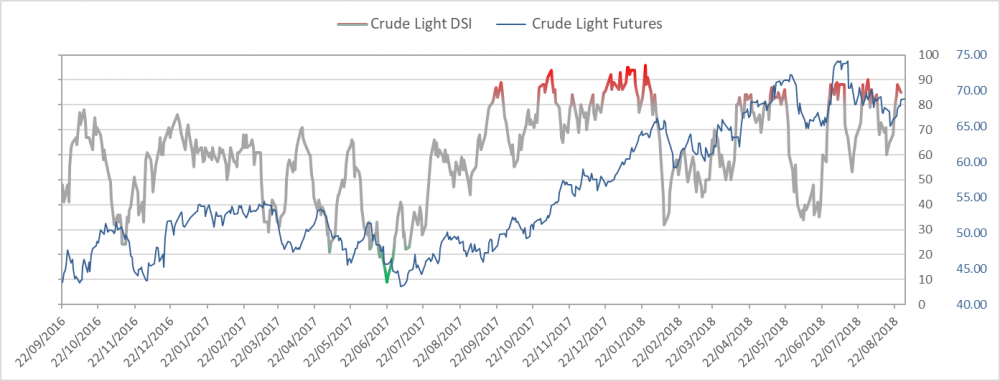
Crude bullish sentiment is at 82% and remains in the extreme zone
|
|
|
|
|
|
|
|
|
|
|
|
|
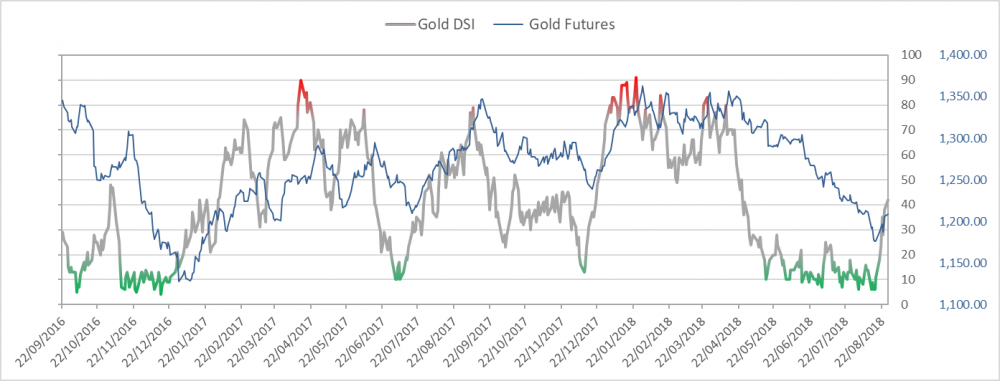
Gold bullish sentiment is at 36%
|
|
|
|
|
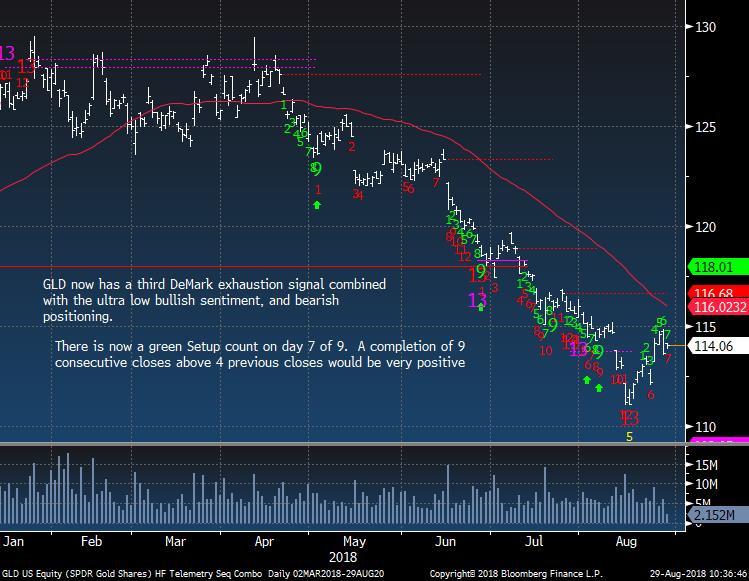
Gold still lacking thrust
|
|
|
|
|
|
|
|
|
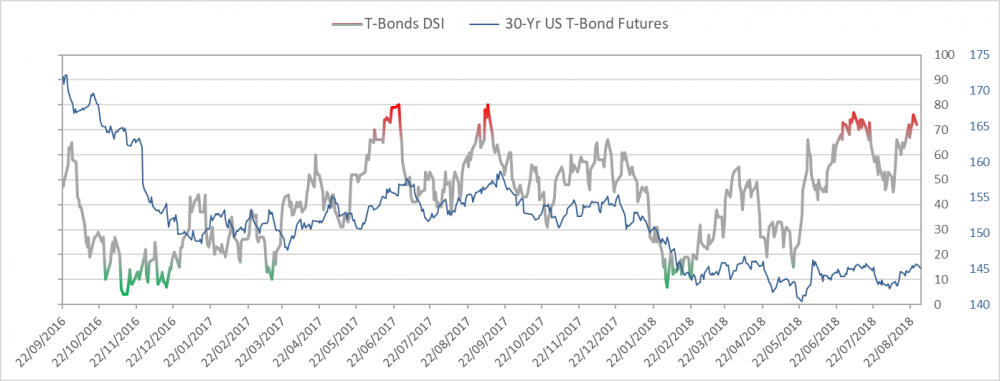
Bond bullish sentiment is at 67%
|
|
|
|
|
|
|
|
|
|
|
DEMARK SCREENS - Daily, Weekly, Monthly Upside/Downside Exhaustion Signals
|
|
|
Daily/Weekly DeMark upside/downside exhaustion signals (Sequential) weekly updated on Monday's and monthly on the first day of the new month. Price flips occur when a stock closes higher/lower than four previous closes and increases conviction of a price turn.
The upside 13's are sell signals and downside 13's are buy signals. Price flip's are confirmation signals that increases potential for a price trend change. For example, if you are long a stock and there is an upside 13, you will want to take cautious action by selling down or out of a position. If initiating a short sale with the upside 13's, we tend to start with a 1/2 size and add with the downside price flip. The opposite is true for when there are downside 13's. Take a 1/2 size position
and add with the upside price flip. The DeMark Indicators are designed to assist the user with buying into weakness and selling into strength to anticipate trend exhaustion. Selling into a rally and buying into a decline often afford the opportunity to exit a trade without too serious a loss if wrong.
S&P 1500 Universe:
DAILY UPSIDE 13: ACN, AMZN, COO, HBAN, HRS, MMC, R, REGN
DAILY DOWNSIDE 13: DF, RRGB, UCBI
DAILY UPSIDE WITH PRICE FLIP REVERSAL DOWN: BIG, FIS, FISV, GDOT, IPAR, ORCL, PAYX, STE, SWN, WFC
DAILY DOWNSIDE WITH PRICE FLIP REVERSAL UP: AMAT, LAD, TEL, UNM, WSO
Updated: 8/27/18
WEEKLY UPSIDE 13: AGYS, ANF, ARQL, CNC, DIN, DOV, ELY, EME, GCO, IT, MED, NSC, TMK, TUES, TYL, WSM, YUM
WEEKLY DOWNSIDE 13: PM
Updated: 8/1/18
MONTHLY UPSIDE 13: AIZ, ATR, BIO, CBU, CDNS, CMS, CSX, DGX, EE, FCN, FIX, GTY, HAE, HAS, IDXX, IEX, KSU, MA, NI, NPK, PTC, RLI, ROL, WEC
MONTHLY DOWNSIDE 13: CIR, HIBB
Euro Stoxx 600 Universe:
DAILY UPSIDE 13: AI FP, FGR FP, GJF NO, INDUA SS, NZYMB DC, PHIA NA
DAILY DOWNSIDE 13: TCH FP
DAILY UPSIDE WITH PRICE FLIP REVERSAL DOWN: NONE
DAILY DOWNSIDE WITH PRICE FLIP REVERSAL UP: ELUXB SS
Updated: 8/27/18
WEEKLY UPSIDE 13: HXS LN, UCB BB, IVS SM
WEEKLY DOWNSIDE 13: BAYN GR, DC/ LN, HUH1V FH, TKA GR
Updated: 8/1/18
MONTHLY UPSIDE 13: TEMN SW
MONTHLY DOWNSIDE 13: CO FP, GETIB SS, RXL FP, TALK LN
|
|
|
Unsubscribe me from Hedge Fund Telemetry
Hedge Fund Telemetry LLC, P.O. Box 4675, Greenwich, CT 06861, United States
CONFIDENTIALITY NOTE and DISCLAIMER: This message is for the named person's use only. It may contain confidential, proprietary or legally privileged material. No confidentiality or privilege is waived by any accidental or unintentional transmission. If you receive this message in error, please immediately delete it and all copies of it from your system, destroy any hard copies and notify the sender. You must not, directly or indirectly, use, disclose,
distribute, print or copy any part of this message if you are not the intended recipient. Hedge Fund Telemetry LLC. cannot guarantee the confidentiality of the material transmitted; therefore, information of a sensitive or confidential nature should not be transmitted. There is risk in trading markets. Hedge Fund Telemetry LLC reports are based on information gathered from various sources and believed to be reliable, but are not guaranteed as to accuracy and completeness. The information is subject to change without notice and Hedge Fund Telemetry LLC has no obligation to provide any updates or changes. Hedge Fund Telemetry LLC is providing this data for informational and educational purposes and does not believe that it is sufficient to base an investment decision on. This information should not be regarded as a solicitation or recommendation of any particular security or to engage in any trading strategy. One should always check with your licensed financial
advisor to determine suitability of any investments.
|
|
|
|
|