|
|
|
|
|
|
Two scenarios for the markets are ahead
|
|
|
There are two scenarios ahead for the equity markets. One narrative that the majority of people want and expect is that a breakout above S&P 2,800 will happen and news highs will be achieved this year. The Nasdaq 100 has made a new high today and that's all that matters to people. Breadth isn't so great considering the percentage move but again, people just look at price. Bank stocks start reporting tomorrow and people expect again good results and considering the financials have
lagged of late perhaps the pop and drop might be a pop and continuation. The big banks tomorrow have an implied move expected of 2-3%. In the past 8 quarters after the report JPM has been down 5/8, C down 6/8/ MS down 1/8, and WFC down 7/8. They bounced a few days ago and gave back some of the gains and today ahead of the numbers they are under performing the overall market. Sometimes the subdued trading ahead of reports is a positive.
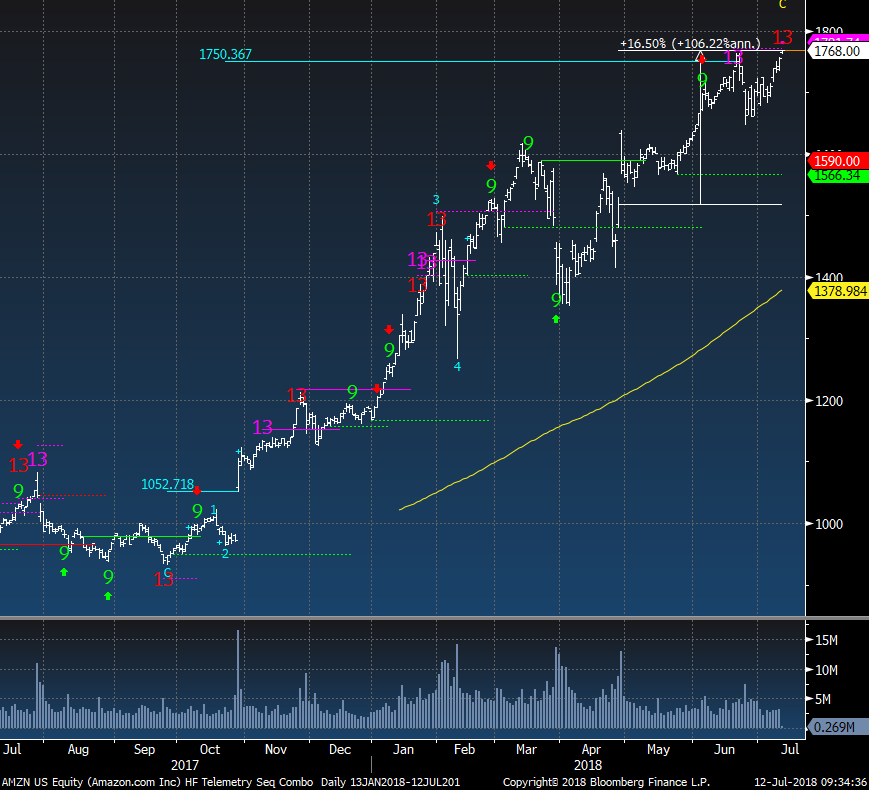
Another narrative going back to the Nasdaq 100 and the ever fun FANG stocks is that this breakout is going to be a false breakout. Back in January there were multiple upside DeMark exhaustion signals that triggered a few days ahead of the top in January. The current upside Countdown is on day 12 of 13. The leader of the FANG's is Amazon and it's trading up 1.7% today triggering a new upside DeMark exhaustion Sequential 13. Facebook had one last week and Netflix a few days ago. Netflix reports on Monday and
today UBS downgraded it to neutral. In typical Wall Street passive aggressive fashion he lowered his rating and upped his price target to $425. It's trading down 2% today. Recall ahead of last quarter earnings analysts were tripping over themselves to raise numbers and there were several upgrades. Netflix is up 117% YTD and up 33% since the last earnings report. Netflix short interest reported last night shows short interest by total shares down to 17 million shares down from a 1 year peak in October at 30 million shares. More importantly the short interest ratio is at 1.18 and the percentage of float is 4% short. Amazon has even fewer shorts involved with a short interest ratio of .92 and the percentage of the float that is short is 1.05%. Netflix and Amazon used to have Tesla like crowds that were short and short squeezes a few years ago were crazy. Tesla for the record has a short interest ratio of 3.88 with 27% of the float short. The risk to
the upside in Amazon and Netflix due to a short squeeze has never been lower. These are crowded longs and that implies risk to the downside for the Nasdaq 100 and the S&P. Tomorrow will likely get the upside exhaustion in the Nasdaq 100/QQQ and going into earnings on the highs with this signal concerns me.
Lastly, the tech names are ripping higher on the belief that China is softening its tone with tariffs and wants to start negotiations with the US. Call me skeptical as I believe China is floating a softening to boost its markets and to play more of a long game stretching out decisions with more time.
Notable:
- US Markets - Sentiment holding in above 60% but might diverge with new highs - Green Setup 9's and Nasdaq 100 on day 12 of 13.... this is important to watch
- Hedge Fund Telemetry Trade Ideas - Cut back on some financial exposure, added AMZN short
- European Markets - Both the DAX and Euro Stoxx 50 now have downside Countdowns - not good
- Currencies - A little less convinced of a breakout coming soon
- Gold Update
- Crude and Energy Update
- fANg - Amazon and Netflix upside exhaustion signals in play
- Disney - new long idea
- Visa - Upside exhaustion
- Bond Update - took off half my long bond exposure
- DeMark Screens - Daily, Weekly, Monthly upside/downside exhaustion signals within the S&P 1500 and Euro Stoxx 600
|
|
|
|
|
Here's a link to the Hedge Fund Telemetry market sentiment page with 40 charts of sentiment including equities, bonds, currencies, and commodities updated each day.
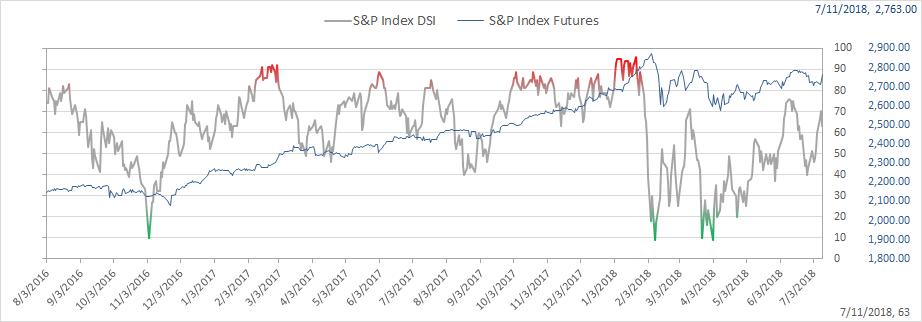
SPX bullish sentiment is at 63%
|
|
|
|
|
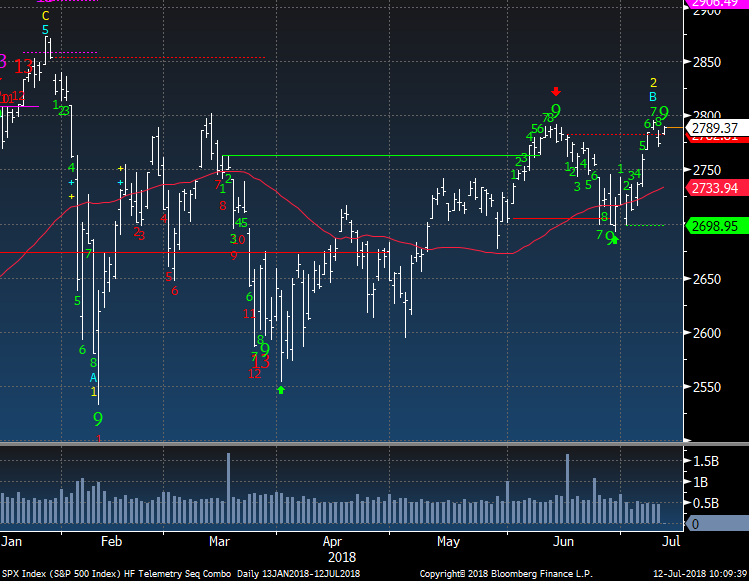
SPX has the green Setup 9 today. Its been very good at inflection points in the past 6 months on the upside and downside. The next few days will be the tell.
|
|
|
|
|
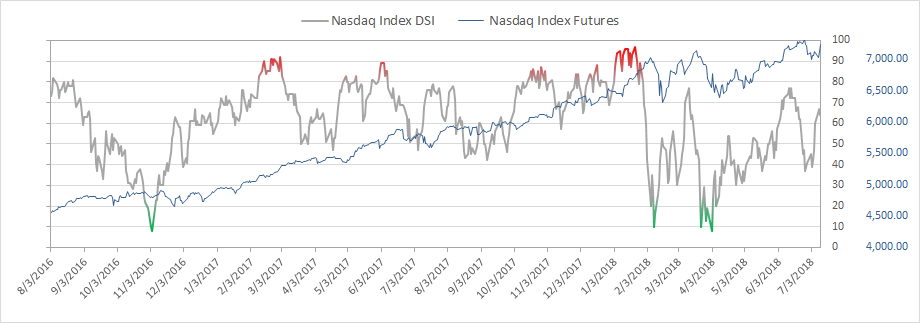
Nasdaq bullish sentiment is at 64%
|
|
|
|
|
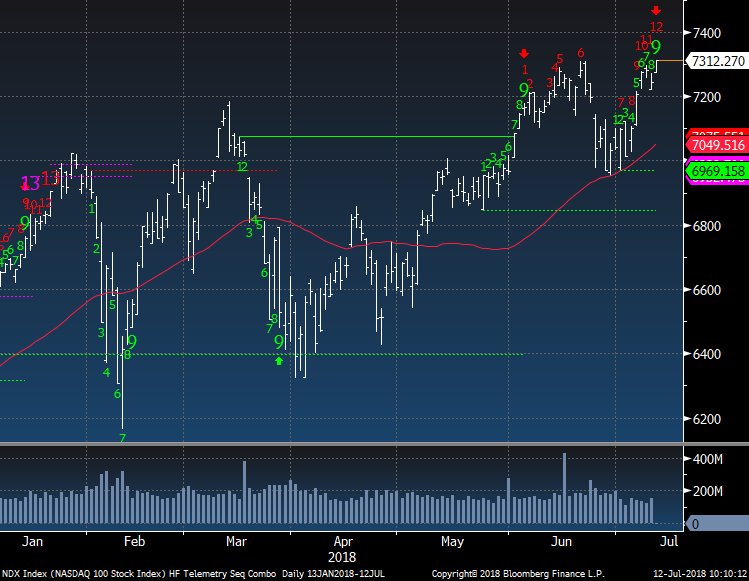
NDX and QQQ both are on day 12 of 13 with a red upside Countdown and there also is a green Setup 9 today too. A price reaction lower should start next week
|
|
|
|
|
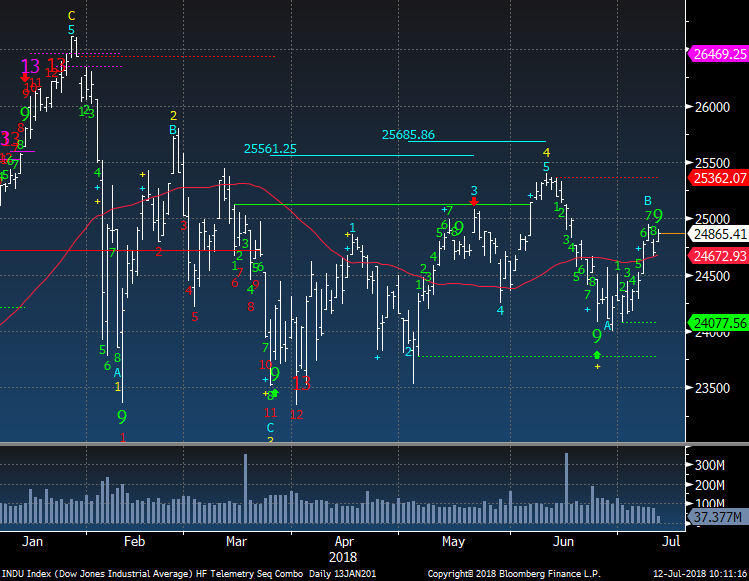
Dow Jones also has the green Setup 9.
|
|
|
|
|
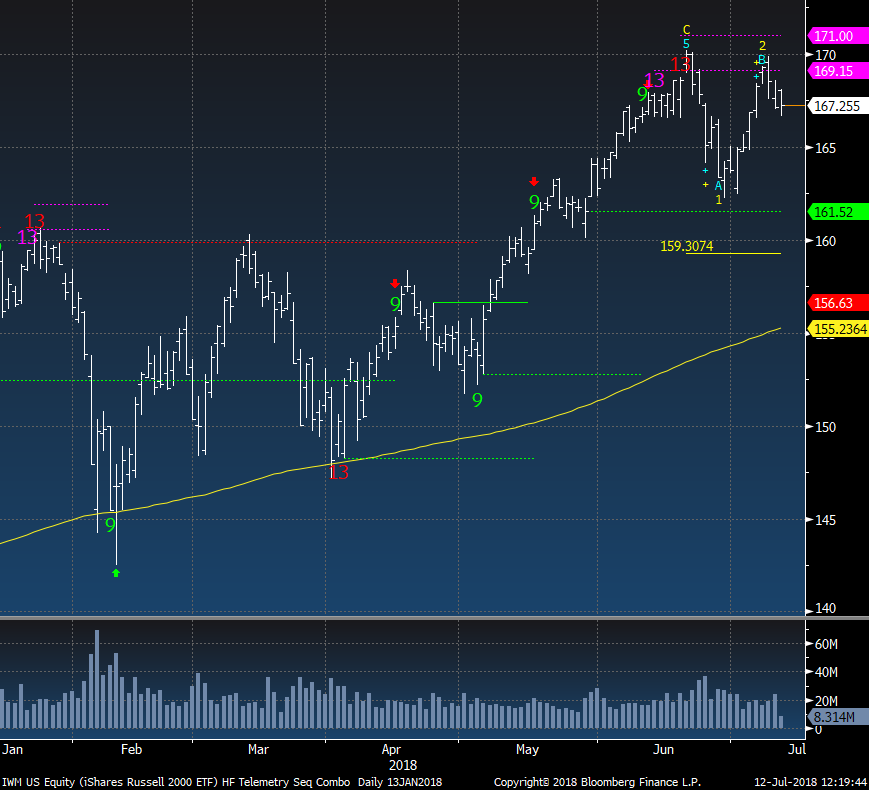
IWM Russell 2000 has been lagging in the past week
|
|
|
|
|
|
|
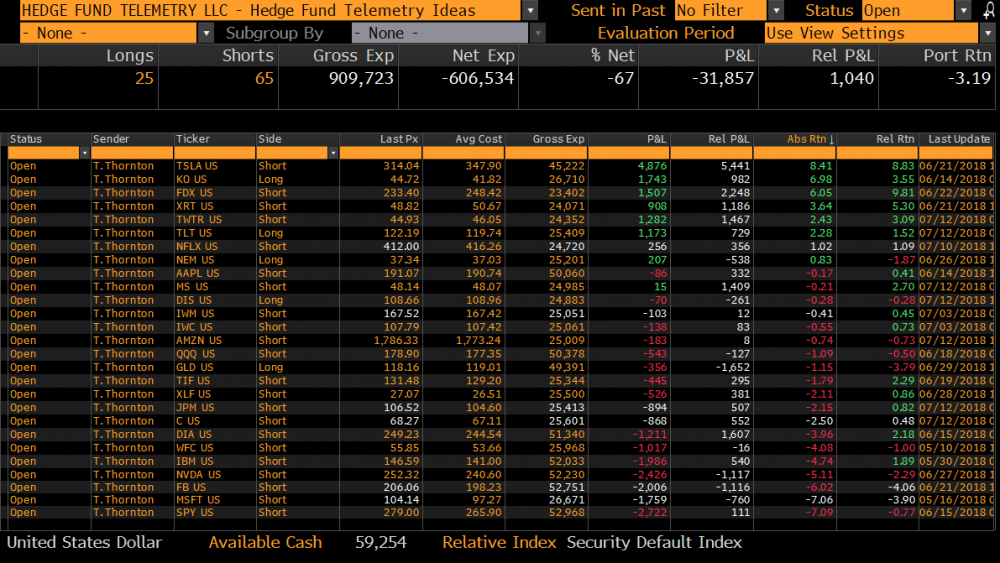
Hedge Fund Telemetry Trade Ideas
|
|
|
Trade Ideas - added new DIS long, AMZN short both 2.5% sized. reduced from 5% to 2.5% JPM, MS, C, TWTR shorts. Cut TLT long to 2.5%
|
|
|
|
|
|
|
|
|
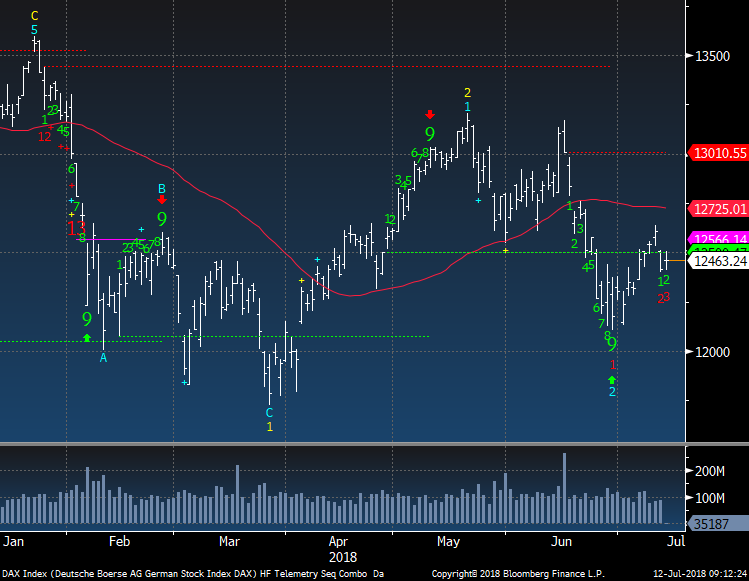
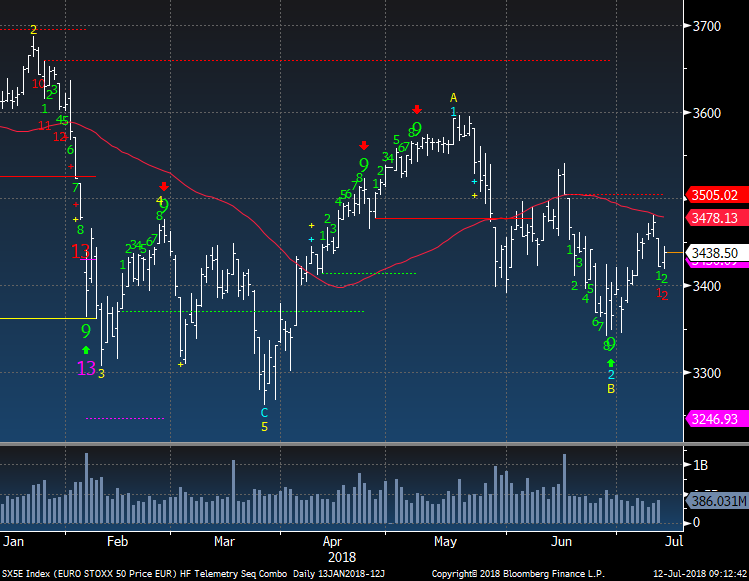
German DAX now has a downside red Countdown on day 2 of 13. This is a real potential negative
|
|
|
|
|
Euro Stoxx 50 same story with them both failing at the 50 day
|
|
|
|
|
|
|
|
|
US Dollar bullish sentiment is at 81% and might be a limiting factor in the continued rise in the USD
|
|
|
|
|
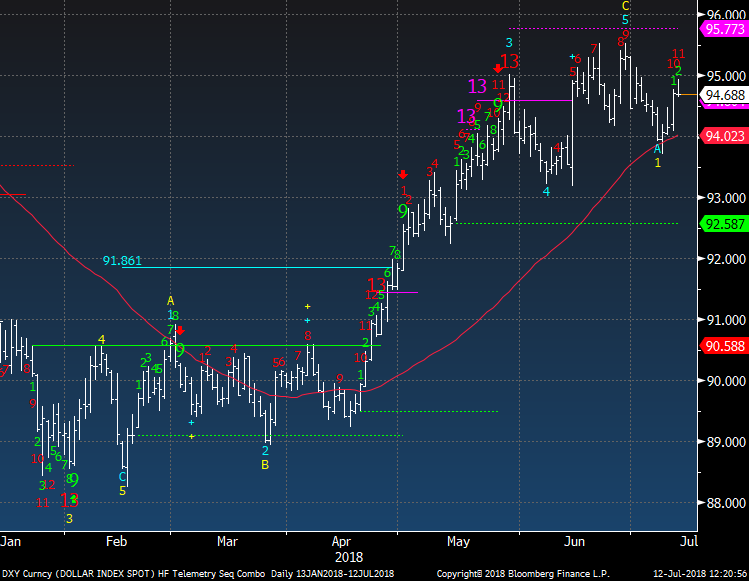
US Dollar Index is on day 11 of 13. I am starting to doubt this breaks out much higher.
|
|
|
|
|
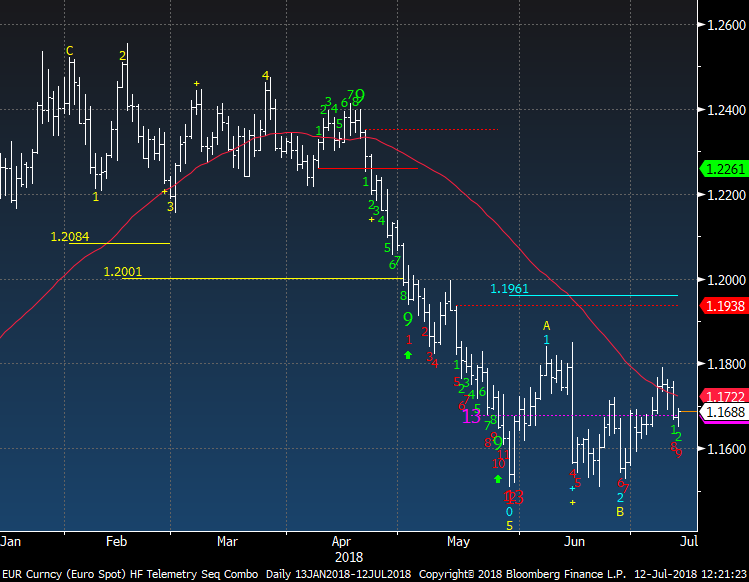
Euro bullish sentiment is at 38% and a move above 50% could change things to a more bullish stance
|
|
|
|
|
Euro spot is on day 9 of 13 and should see a downside exhaustion but it might take a little time and will be jagged. If this completely breaks down under 1.15 then the trend will resume
|
|
|
|
|
|
|
|
|
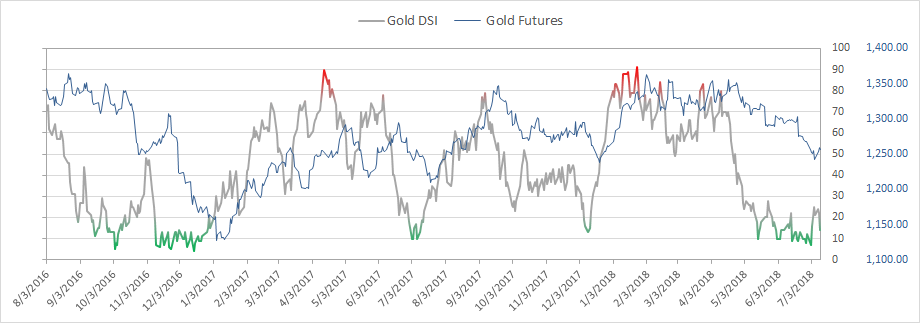
Gold bullish sentiment is at 14% and has given up the recent gains.
|
|
|
|
|
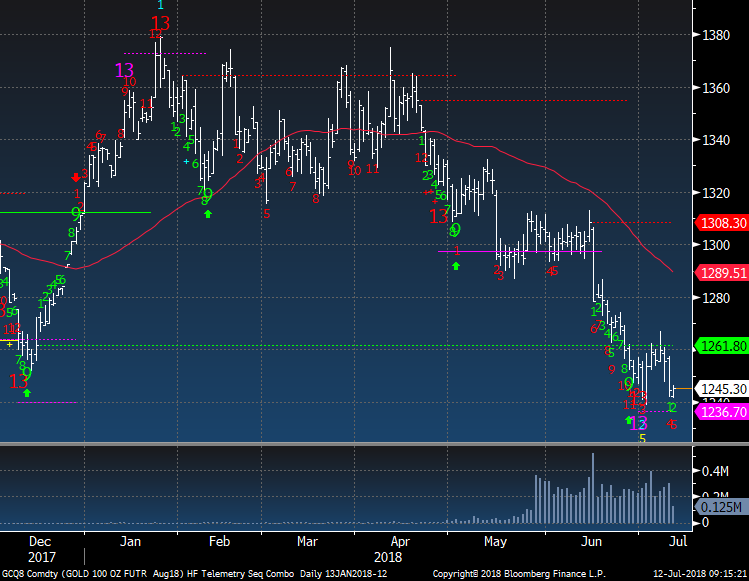
Gold Futures has a new secondary downside Countdown on day 5 of 13 and this is not what I want to see but I do know and expect positive seasonality to kick in soon
|
|
|
|
|
|
|
|
|
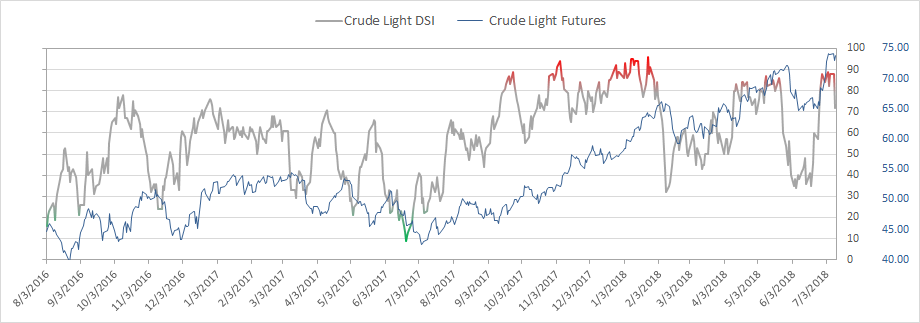
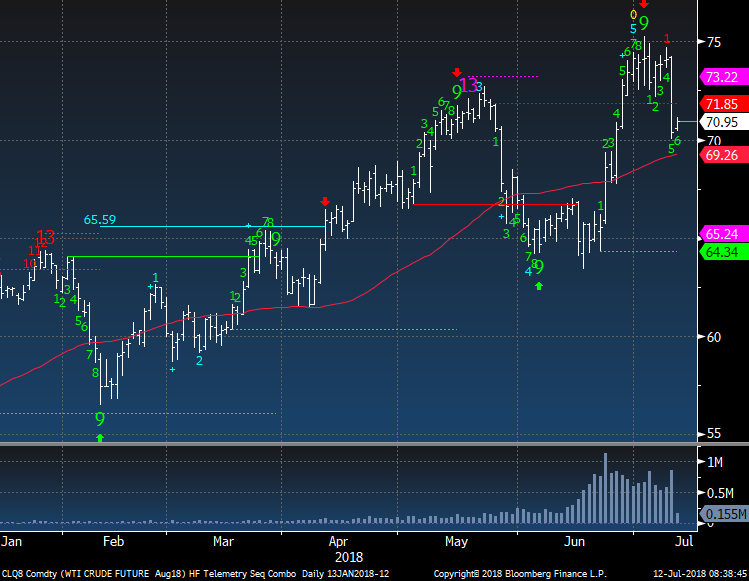
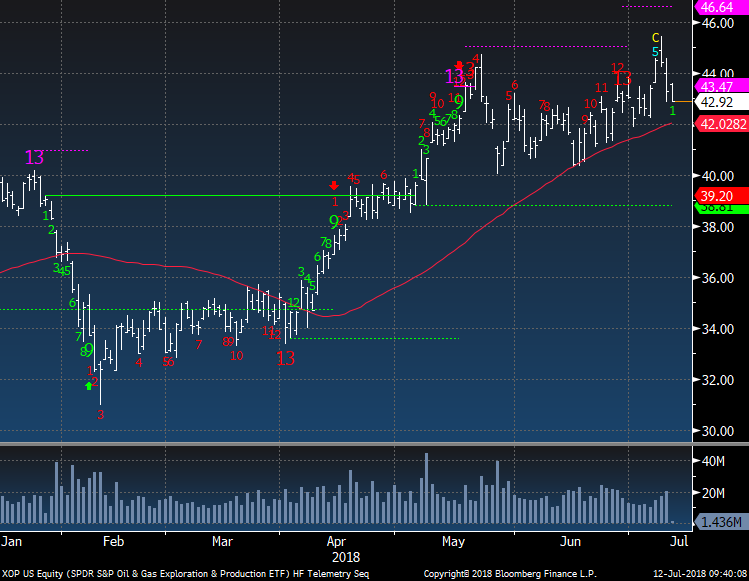
Crude bullish sentiment is at 72% dropping from a high extreme level of 88%
|
|
|
|
|
WTI Crude Futures had a recent upside green 9 and I was concerned when that happened that it could be another inflection point and now it is confirmed. I think there is potential more downside here
|
|
|
|
|
XOP Energy ETF has support at 42 and if this breaks expect a 5% or more drop.
|
|
|
|
|
|
|
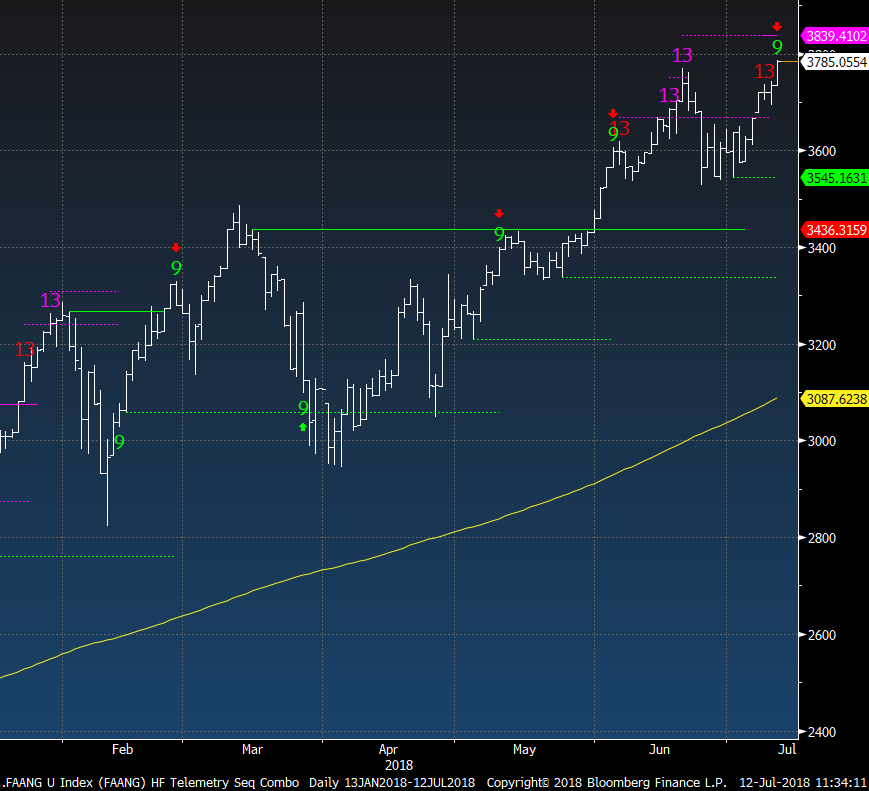
fANg - Amazon and Netflix
|
|
|
FAANG and FANG custom indexes have upside exhaustion signals in play.
|
|
|
|
|
AMZN has a red Sequential upside exhaustion today and just for the record it is up 16.50% from the last earnings report.
|
|
|
|
|
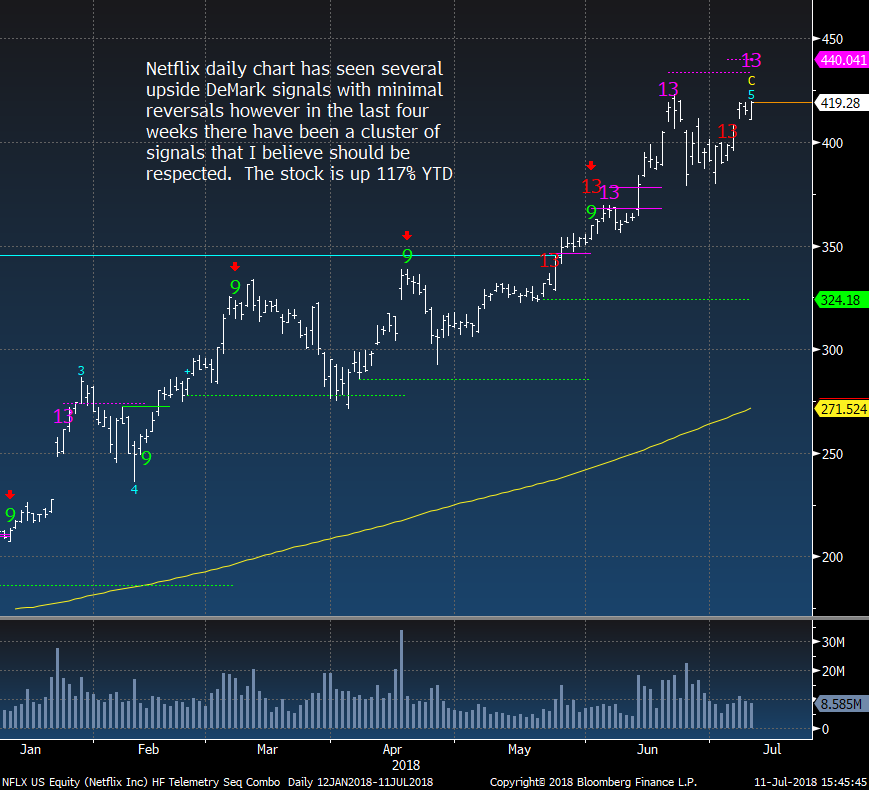
NFLX daily from a couple days ago
|
|
|
|
|
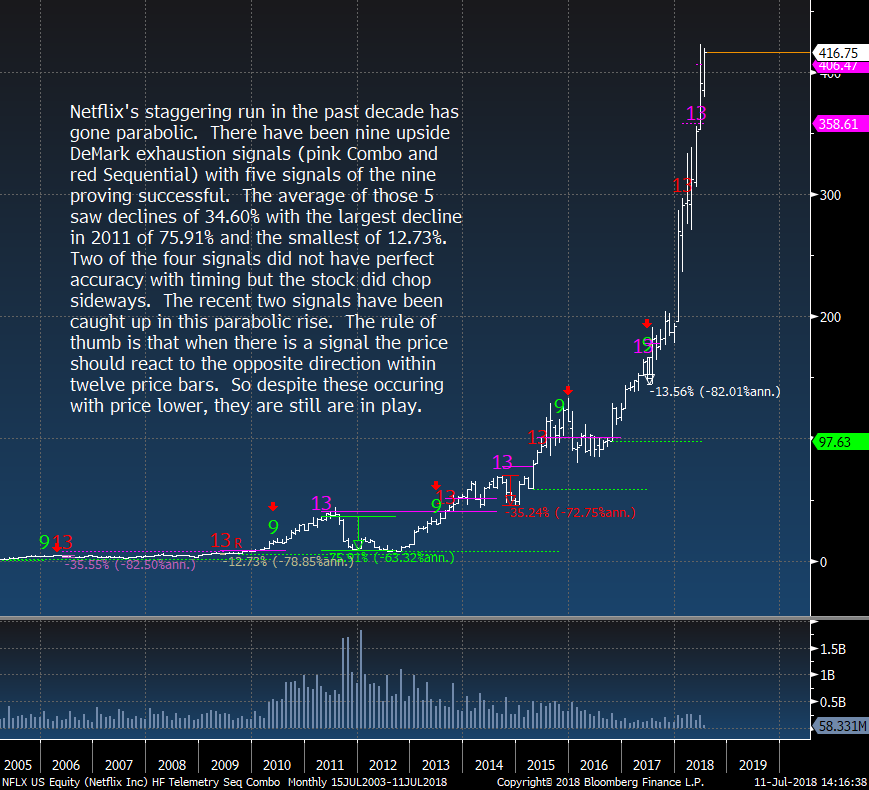
NFLX monthly... NO WORDS NEEDED
|
|
|
|
|
|
|
|
|
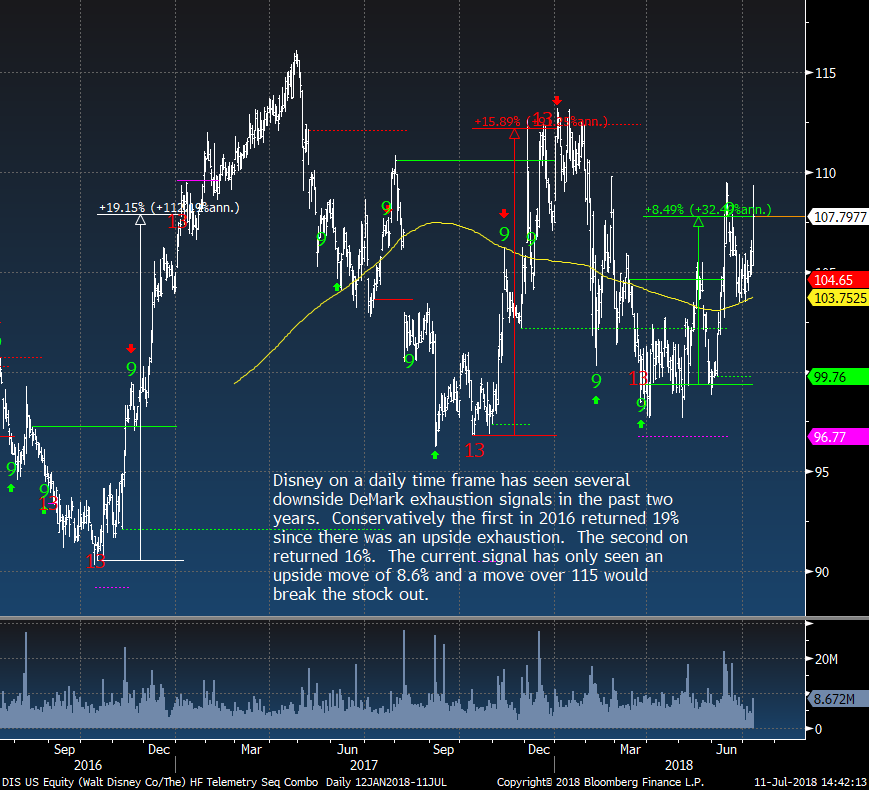
I just did a new report for Real Vision out Monday with a pair trade of long DIS and short NFLX. Although I wanted to buy DIS under 98 I didn't get the signal. Regardless I like some things beyond the chart that makes me start with a 2.5% sized long paired up with NFLX
|
|
|
|
|
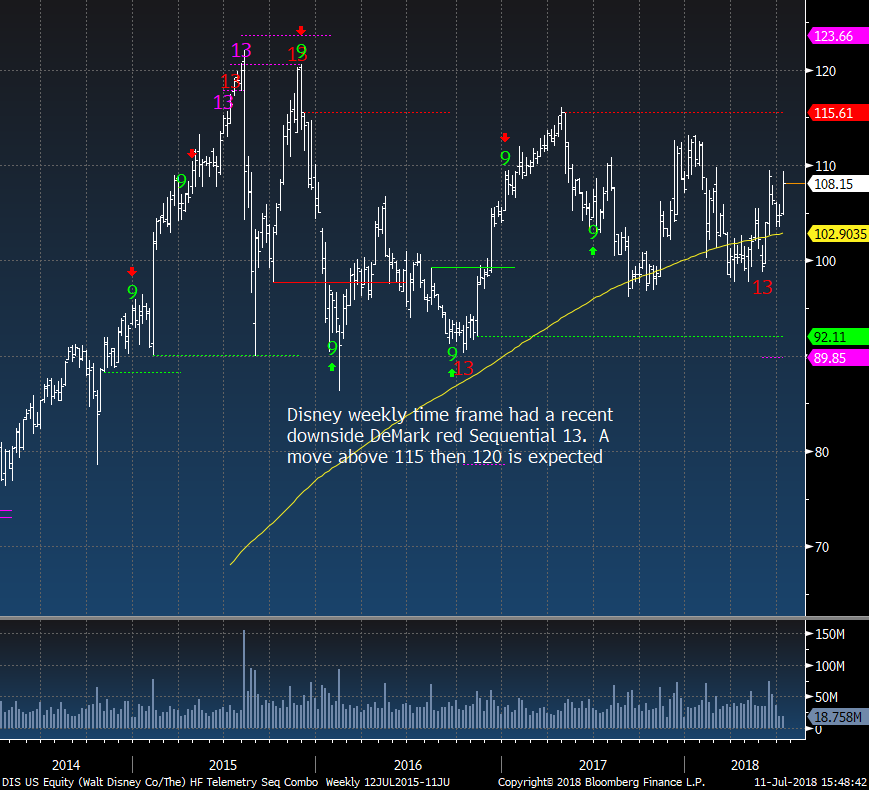
DIS weekly could break out above 115
|
|
|
|
|
|
|
|
|
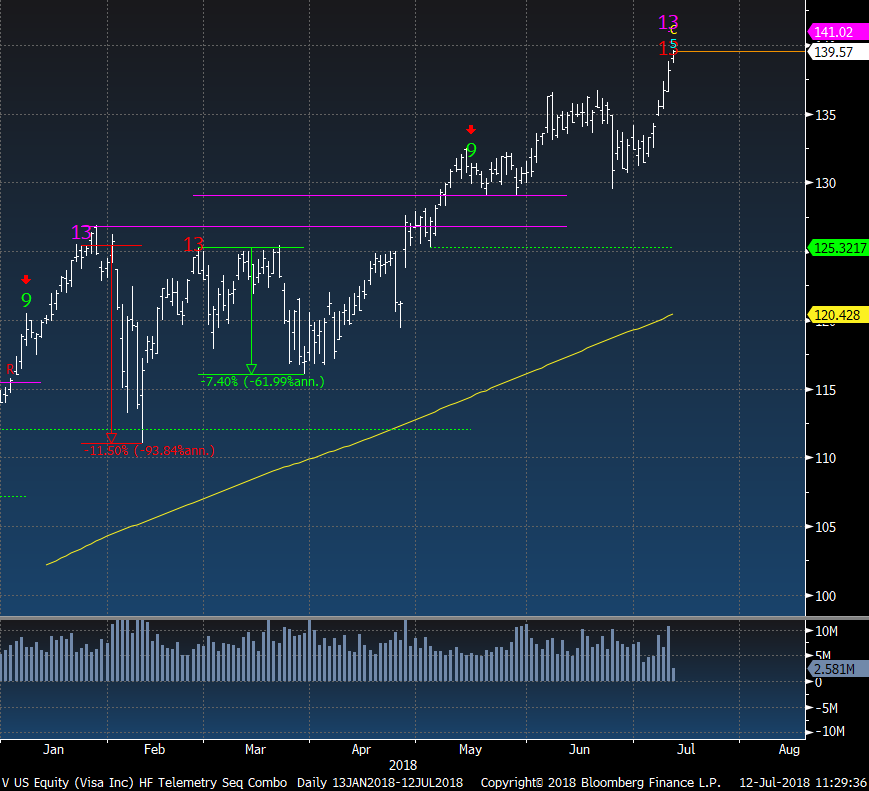
VIsa is on the DeMark Screens below with an upside exhaustion 13. It's worked in the past
|
|
|
|
|
|
|
|
|
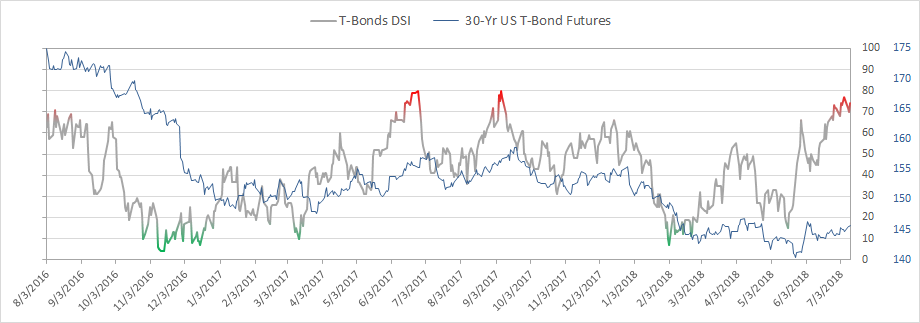
Bond bullish sentiment is at 74%
|
|
|
|
|
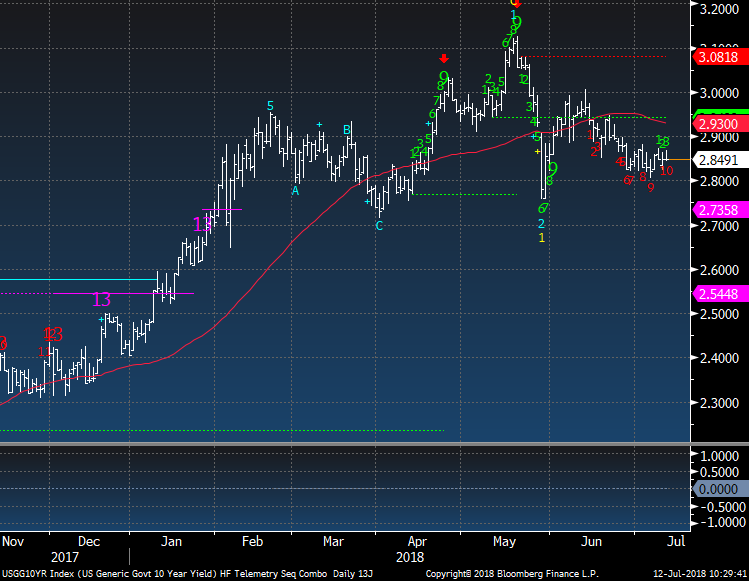
US 10 year yield is on day 10 of 13 and is not really making much progress lower
|
|
|
|
|
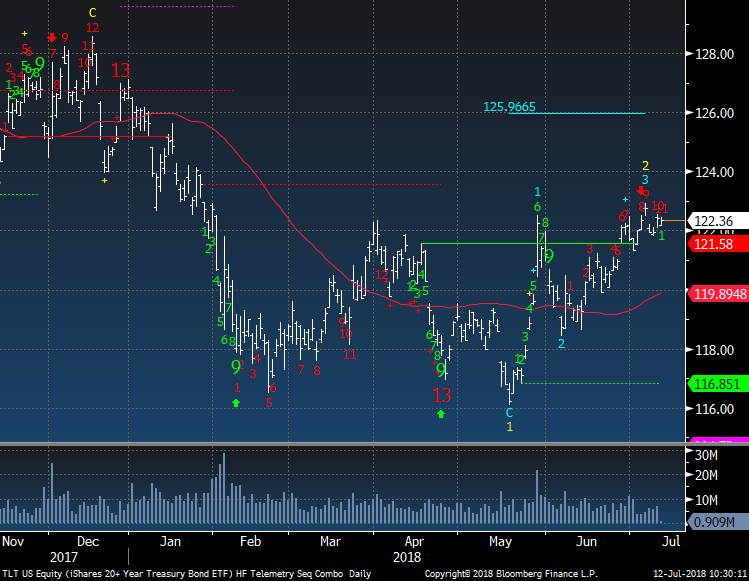
TLT bond ETF is on day 11 of 13 and I trimmed half for a successful trade.
|
|
|
|
|
|
|
DEMARK SCREENS - Daily, Weekly, Monthly Upside/Downside Exhaustion Signals
|
|
|
Daily/Weekly DeMark upside/downside exhaustion signals (Sequential) weekly updated on Monday's and monthly on the first day of the new month. Price flips occur when a stock closes higher/lower than four previous closes and increases conviction of a price turn.
The upside 13's are sell signals and downside 13's are buy signals. Price flip's are confirmation signals that increases potential for a price trend change. For example, if you are long a stock and there is an upside 13, you will want to take cautious action by selling down or out of a position. If initiating a short sale with the upside 13's, we tend to start with a 1/2 size and add with the downside price flip. The opposite is true for when there are downside 13's. Take a 1/2 size position
and add with the upside price flip. The DeMark Indicators are designed to assist the user with buying into weakness and selling into strength to anticipate trend exhaustion. Selling into a rally and buying into a decline often afford the opportunity to exit a trade without too serious a loss if wrong.
S&P 1500 Universe:
DAILY UPSIDE 13: AIZ, BLKB, LMNX, MRCY, NTGR, SPPI, STRA, V
DAILY DOWNSIDE 13: DLX, HI
DAILY UPSIDE WITH PRICE FLIP REVERSAL DOWN: AEGN, BCOR, BRKS, CRY, CSGS, DAR, ENR, GPOR, GTY, HBI, HIW, IPAR, JJSF, KIM, LNN, MATW, MINI, NTRN, NNN, OMCL, PLT, PLXS, QNST, SKT, STX, SVU, TAP, TER, VMI, VTR
DAILY DOWNSIDE WITH PRICE FLIP REVERSAL UP: NONE
Updated: 7/9/18
WEEKLY UPSIDE 13: AES, BBY, CACI, DPZ, EAT, MGLN, MUSA, WCG
WEEKLY DOWNSIDE 13: AYI, FTR
Updated: 7/1/18
MONTHLY UPSIDE 13: ADI, AEE, BAX, BCOR, ETFC, ICUI, ITG, MED, MOH, NEE, SMTC, THG, TTEK, TXN, VICR, VSH, WCN, WST
MONTHLY DOWNSIDE 13: TUES
Euro Stoxx 600 Universe:
DAILY UPSIDE 13: BEI GR, DRX LN, DSY FP, ESNT LN, OPAP GA, UCB BB
DAILY DOWNSIDE 13: ATL IM, BBVA SM, CBK GR, MB IM, SK FP, VIV FP
DAILY UPSIDE WITH PRICE FLIP REVERSAL DOWN: FP FP, REE SM, RWE GR, SRCG SW
DAILY DOWNSIDE WITH PRICE FLIP REVERSAL UP: PNDORA DC, TW/ LN
Updated: 7/9/18
WEEKLY UPSIDE 13: D1 GR, GALP PL
WEEKLY DOWNSIDE 13: ELUXB SS, JM SS, NCCB SS, WRT1V FH
Updated: 7/1/18
MONTHLY UPSIDE 13: BLND LN, CDI FP, CRH ID, DCC LN, DOM LN, RACE IM, REL LN, RMS FP, SXS LN, WKL NA, ZAL GR
MONTHLY DOWNSIDE 13: BMPS IM
|
|
|
Unsubscribe me from Hedge Fund Telemetry
Hedge Fund Telemetry LLC, P.O. Box 4675, Greenwich, CT 06861, United States
CONFIDENTIALITY NOTE and DISCLAIMER: This message is for the named person's use only. It may contain confidential, proprietary or legally privileged material. No confidentiality or privilege is waived by any accidental or unintentional transmission. If you receive this message in error, please immediately delete it and all copies of it from your system, destroy any hard copies and notify the sender. You must not, directly or indirectly, use, disclose,
distribute, print or copy any part of this message if you are not the intended recipient. Hedge Fund Telemetry LLC. cannot guarantee the confidentiality of the material transmitted; therefore, information of a sensitive or confidential nature should not be transmitted. There is risk in trading markets. Hedge Fund Telemetry LLC reports are based on information gathered from various sources and believed to be reliable, but are not guaranteed as to accuracy and completeness. The information is subject to change without notice and Hedge Fund Telemetry LLC has no obligation to provide any updates or changes. Hedge Fund Telemetry LLC is providing this data for informational and educational purposes and does not believe that it is sufficient to base an investment decision on. This information should not be regarded as a solicitation or recommendation of any particular security or to engage in any trading strategy. One should always check with your licensed financial
advisor to determine suitability of any investments.
|
|
|
|
|
|
|