|
|
|
|
|
|
The other side of "Everything is breaking out"
|
|
|
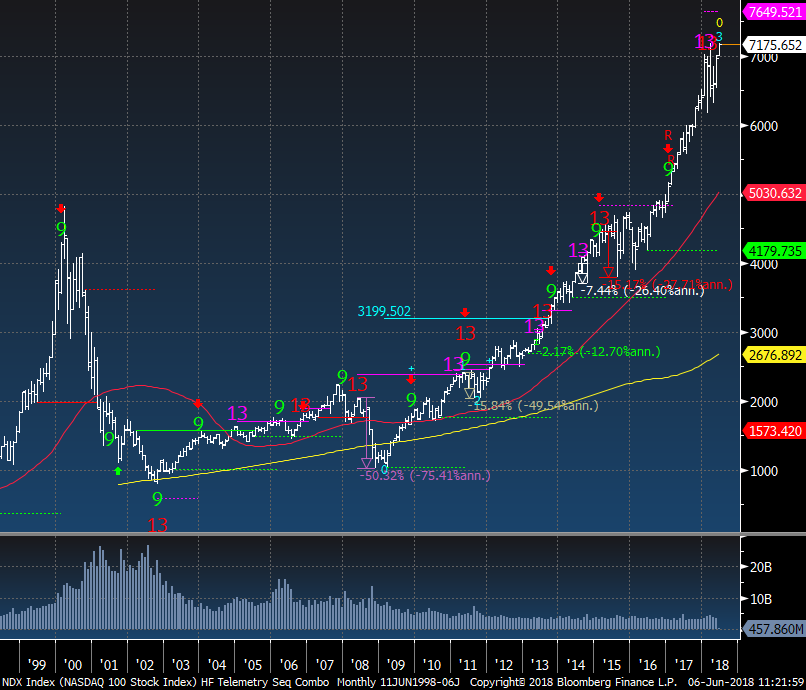
Today I look at longer term time charts that shows some perspective on how parabolic some sectors have become as well I dig into the absurd NDX attribution. I've seen a lot of pieces on "breakouts" and I caution you to get sucked into the euphoria. There remains a little upside potential as I have discussed lately with some indexes and with the recent short term top with the US Dollar with the upside exhaustion signals combined with the extreme sentiment, people are getting
more comfortable owning stocks. I'll be sending the weekly Currency Focus tomorrow. There is a lot of good stuff on today's note and I'll let you get at it.
Notable:
- US Markets - Sentiment is still increasing and there are some remaining upside daily Countdowns. A little more potential but the monthly upside exhaustion signals are still in play
- Hedge Fund Telemetry Trade Ideas - Stopped out of BA, Added CMCSA long, Sold AMGN long
- Tech Stock Popularity and NDX attribution
- Apple and Amazon the two most important stocks in the world
- Asian Markets - FXI still look OK on the long
side
- Some Key US Sectors on a monthly time frame
- More Tech
- Trade Ideas - Charts of CMCSA, AMGN
- Once again we see 18 year old hedge fund managers - Look out Paul Tudor Jones!
- Bond Update - Neutral on 10 year for now. Potential for upside soon in Investment Grade
- DeMark Screens - Daily, Weekly, Monthly upside/downside exhaustion signals within the S&P 1500 and Euro Stoxx 600
|
|
|
|
|
Here's a link to the Hedge Fund Telemetry market sentiment page with 40 charts of sentiment including equities, bonds, currencies, and commodities updated each day.
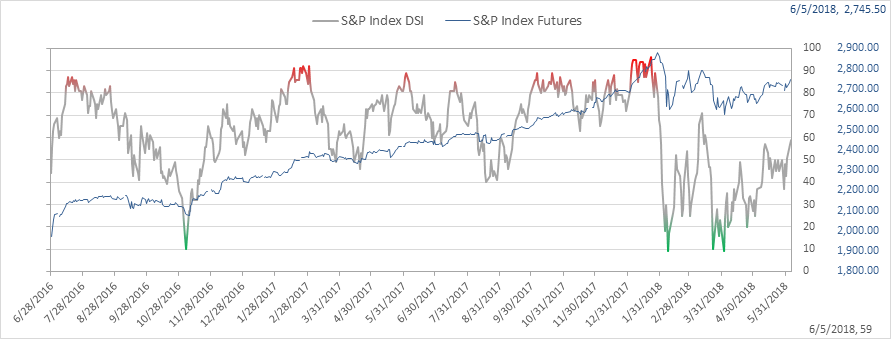
SPX bullish sentiment is at 59% and has the potential for a little more upside
|
|
|
|
|
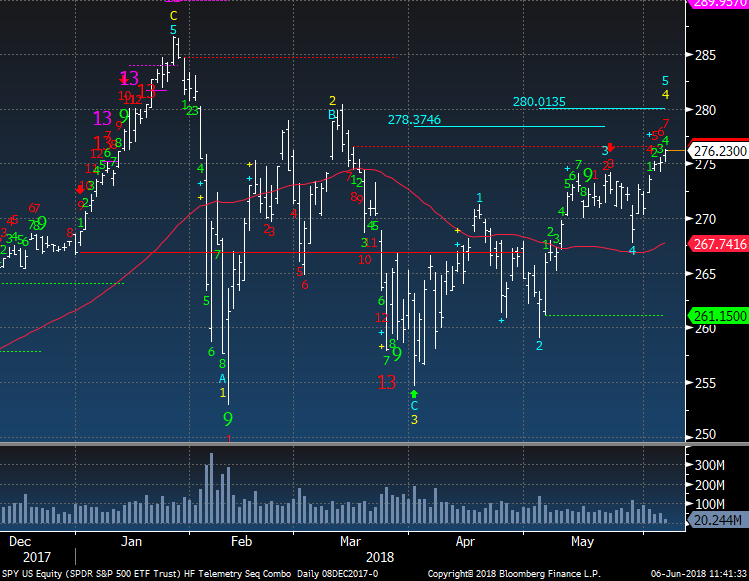
SPY is now on day 7 of 13 with the current upside Countdown. A little more upside perhaps to the wave 5 price objective of 280. I put more weight into the Countdowns by the way over the price objectives
|
|
|
|
|
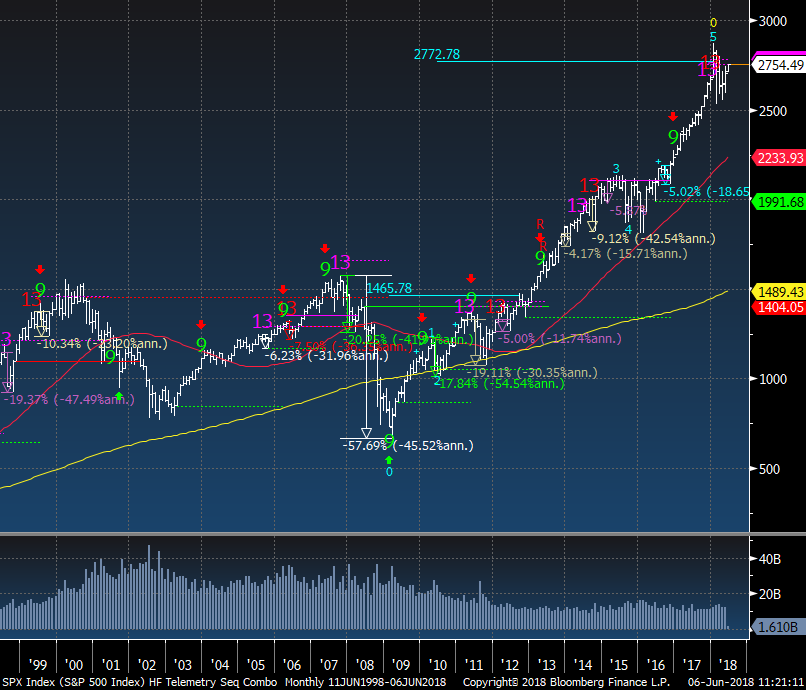
The monthly of the SPX has been my main chart to watch since Q4 last year. Upside exhaustion signals on a monthly time frame really put into perspective the risks from here. The larger downside moves occurred in the 5th upside wave (which we are in now) while the smaller downside pullbacks were in the middle waves. I have some more monthly charts below
|
|
|
|
|
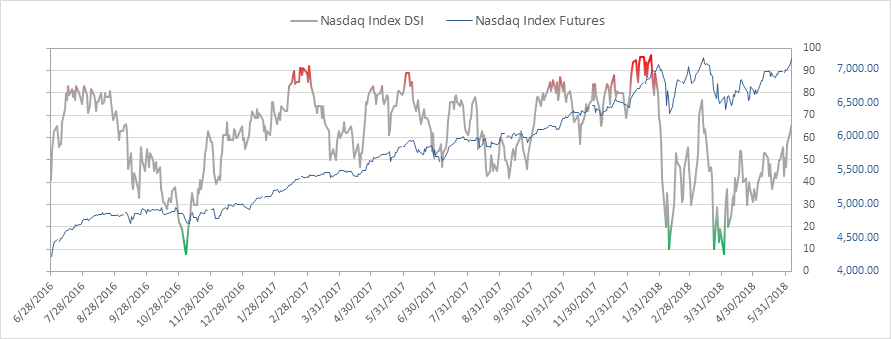
Nasdaq bullish sentiment is at 65% and should continue more
|
|
|
|
|
The monthly chart of QQQ illustrates the wild upside move. The recent pink Combo and Red Sequential upside exhaustion signals saw a pullback of 10% yet the signal is still in play. The weekly just triggered in the past couple weeks and the daily had an upside green Setup 9
|
|
|
|
|
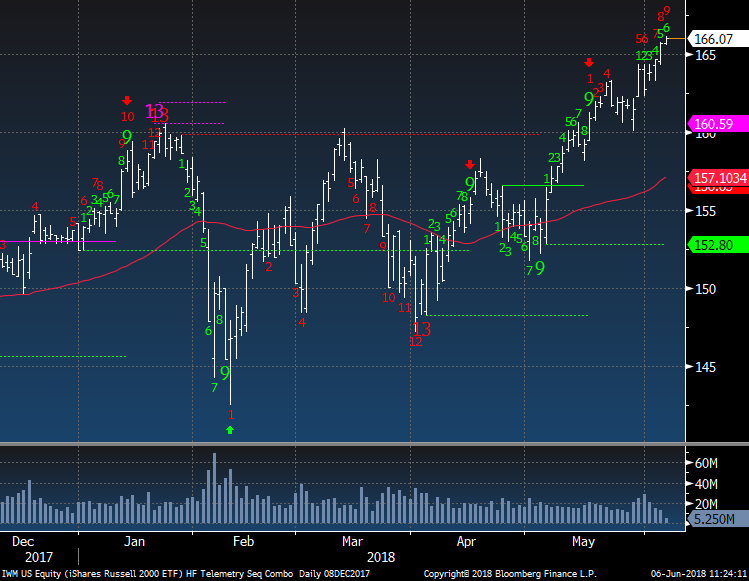
Another one that we have been watching is the Russell 2000 IWM on day 9 of 13. I remain in the belief that a little more upside before we get the exhaustion. There are many tourist like investors that have moved into this in the later stages. Absolutely do not buy this and if long start to lighten up or get out in the coming week
|
|
|
|
|
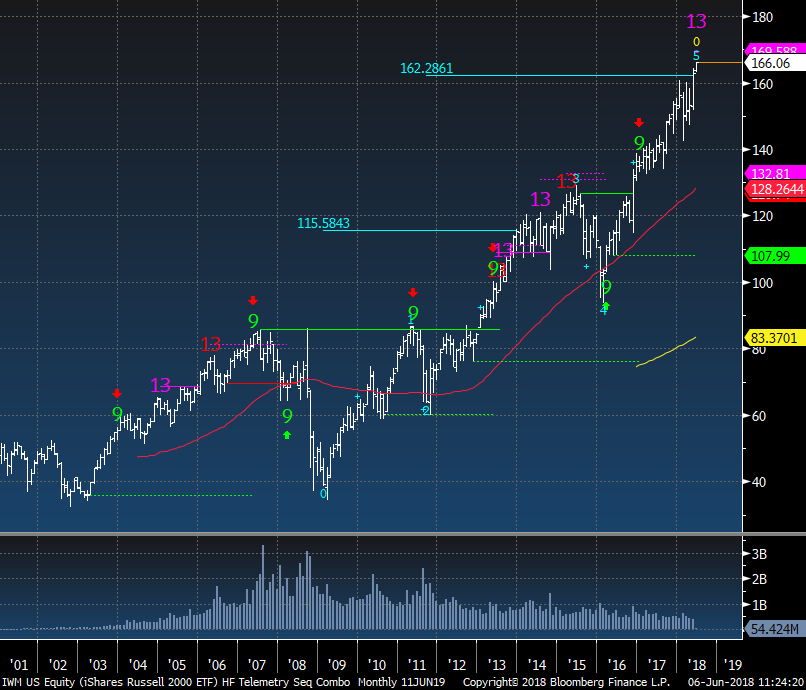
The monthly hit the upside wave 5 price objective and had a pink Combo upside exhaustion. The monthly red Countdown is on month 11 of 13 so if I'm wrong and this continues a little more the Sequential is looming
|
|
|
|
|
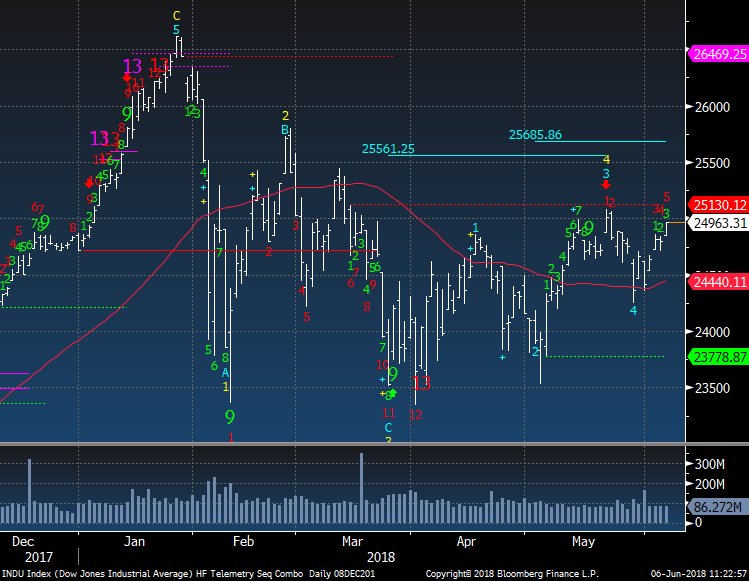
Dow Jones sideways correction could see a little higher with it on day 5 of 13.
|
|
|
|
|
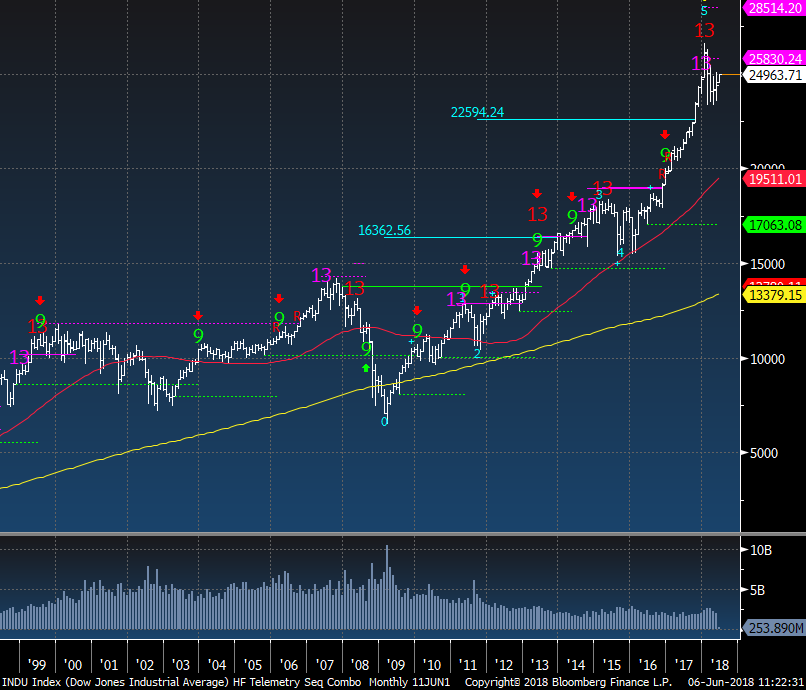
The monthly of the Dow also had upside exhaustion signals that have been effective in the past
|
|
|
|
|
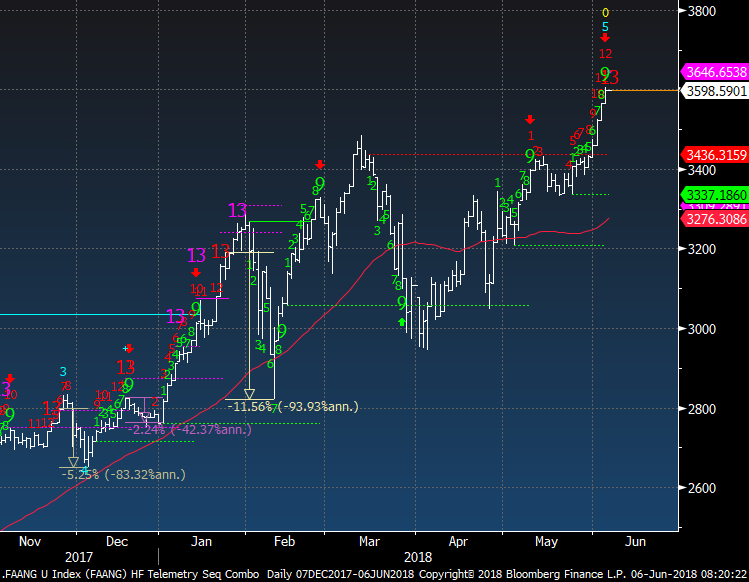
FAANG custom index has an upside 13 exhaustion today. One of the aspects of 2017 was that each upsides exhaustion resulted in small pullbacks or stalling out for a short while. The overlapping upside exhaustion signals seen in January was one of the main reasons back then I was recommending overweighting cash. The attribution studies below will bring home my point that this not a time to chase buying these
|
|
|
|
|
|
|
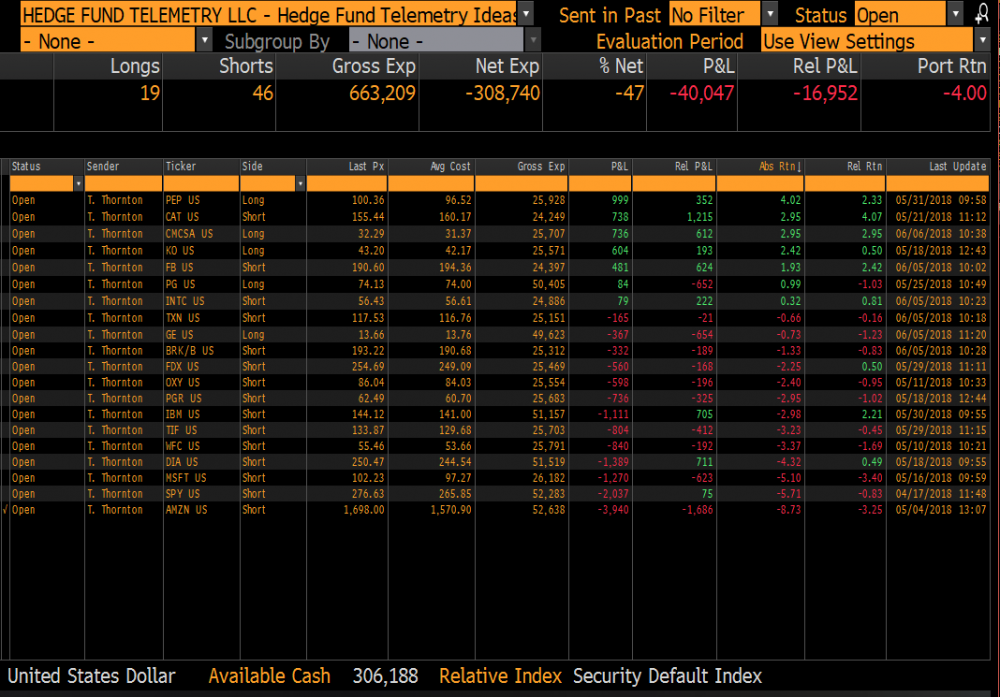
Hedge Fund Telemetry Trade Ideas
|
|
|
Trade Ideas - BA stopped out -9.8%, added CMCSA 2.5% size long, sold long AMGN +7%
|
|
|
|
|
|
|
Tech Stock Popularity and NDX Attribution
|
|
|
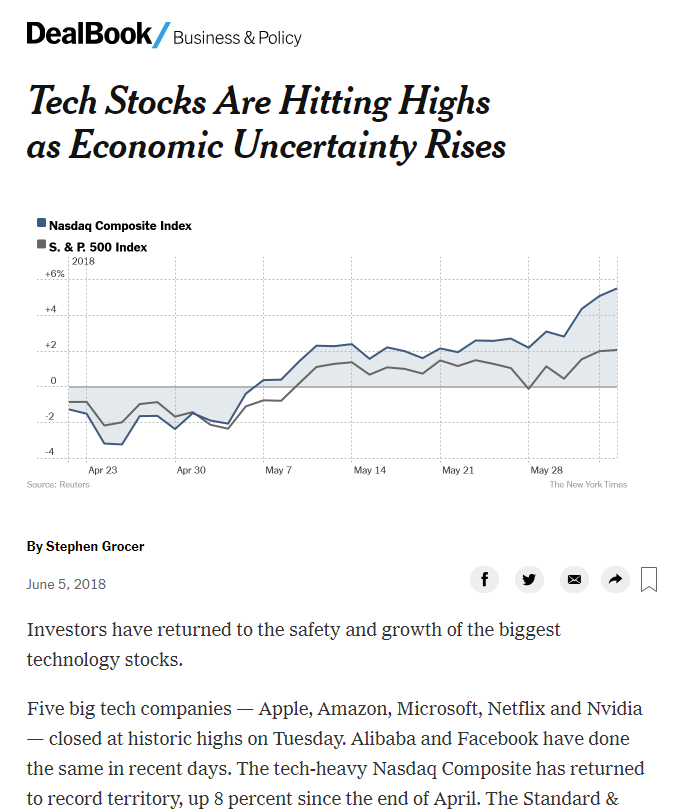
This was from a NY Times story yesterday. "Investors have returned to the safety and growth of the biggest technology stocks." God help the people just now buying these...
|
|
|
|
|
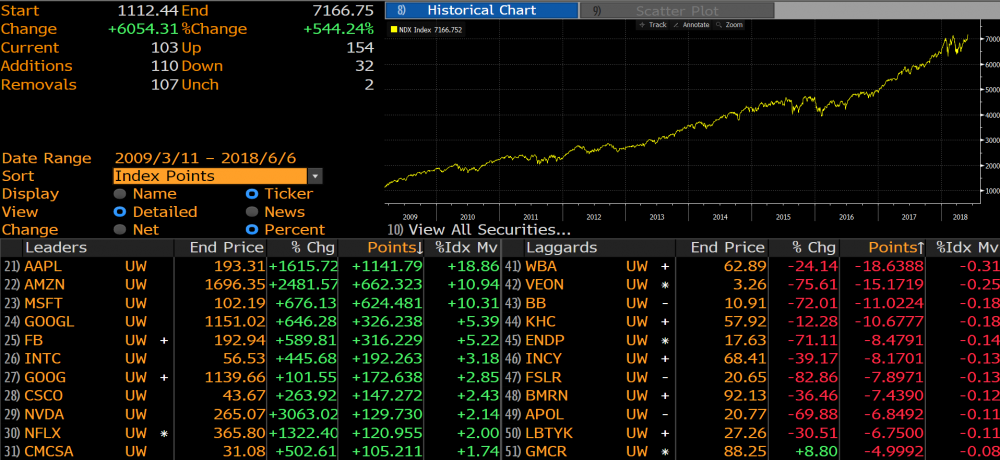
The NDX attribution from the March 2009 lows shows the index up 544% with the top 5 stocks attributing 53% by just the 5. The top 2 combined have been 30% of the gain.
|
|
|
|
|
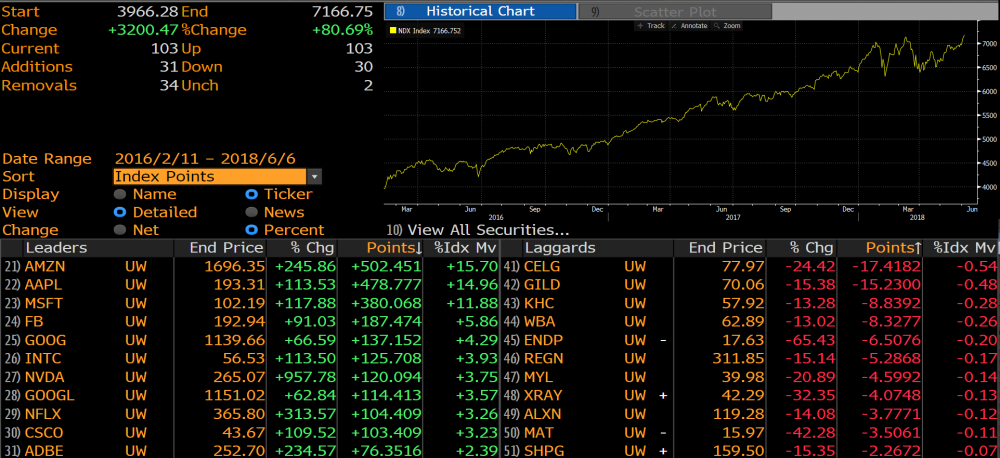
From the February 2016 low, which was a time when bullish sentiment was under 10% and there were many DOWNSIDE DeMark exhaustion signals on multiple time frames - a low risk buying opportunity. The top 5 have attributed 50% of the gains of 80%.
|
|
|
|
|
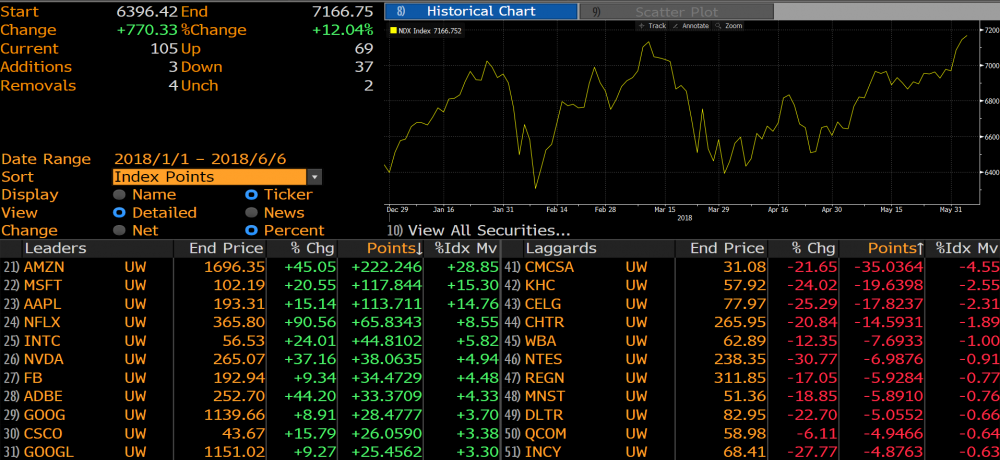
YTD shows attribution even more narrow with Amazon nearly 30% of the total gain. The top 3 attributed 59% of the gain. And for people saying but breadth has been so good... 69 up 37 down 2 unch... isn't as good as you'd think.
|
|
|
|
|
|
|
Apple and Amazon the two most important stocks in the world
|
|
|
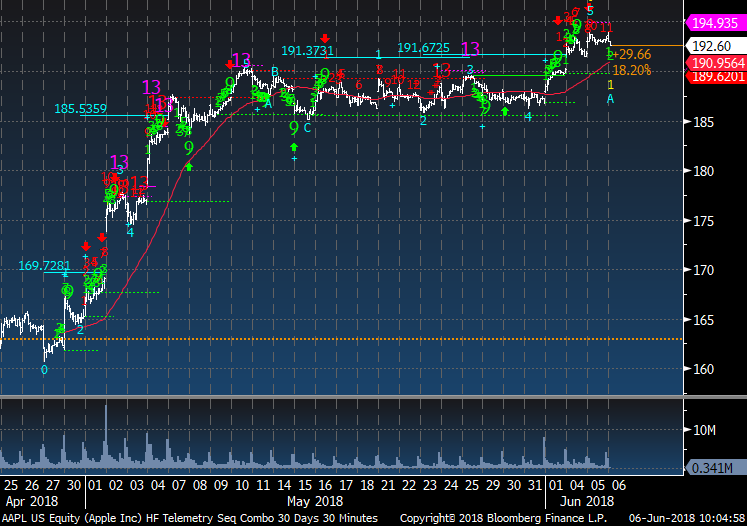
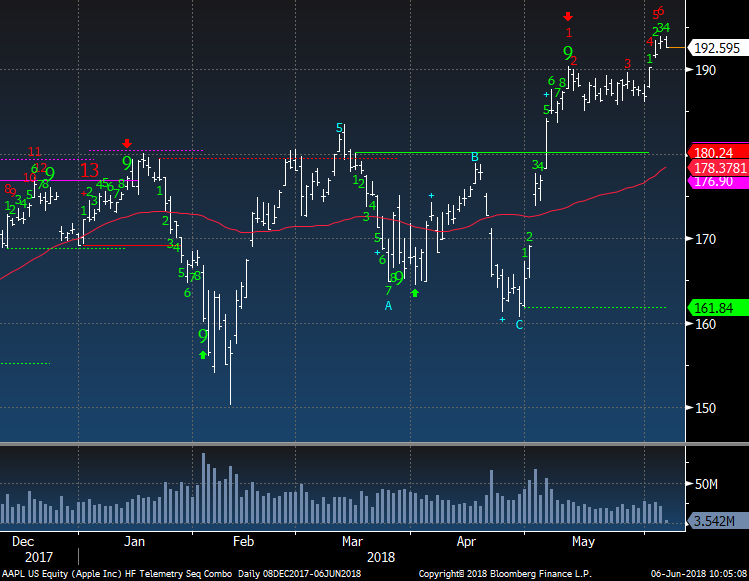
Apple short term 30 minute chart shows how it spiked on earnings and got afterburners with Buffett disclosure he bought 75 million shares months before. It's been mostly sideways
|
|
|
|
|
Apple is on day 6 of 13 with an upside daily Countdown. Can this go a little higher? Sure but I'm not in need to chase this when the product cycle is in a refresh for the iPhone
|
|
|
|
|
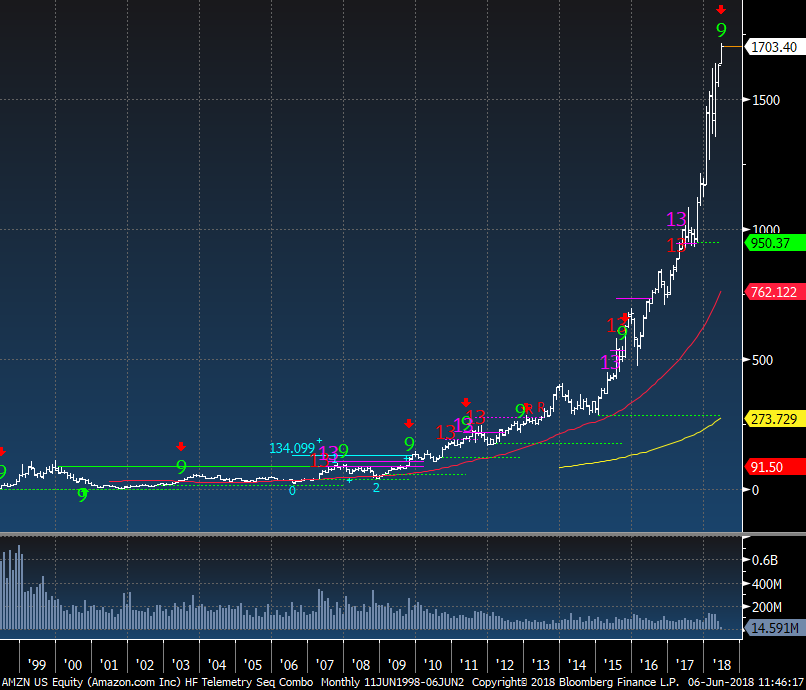
Amazon monthly shows the parabolic move. I don't buy these types of moves, and you shouldn't either. Keep in mind, the narrative was Amazon blew away earnings with double the expected EPS. They beat a 1.25 estimate with 3.27. 3.27 per share with a 1500 stock. What a value!
|
|
|
|
|
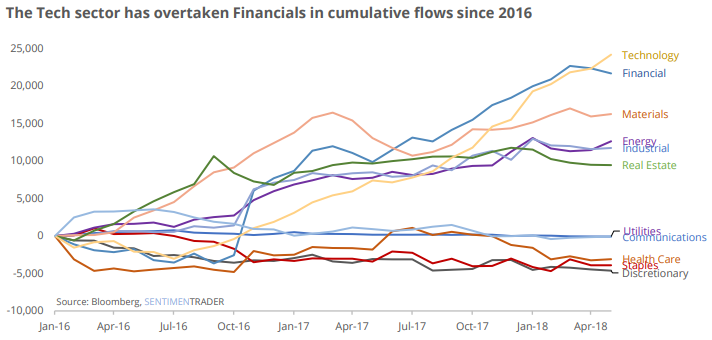
Technology inflows are now at the top. Thanks to Jason at Sentimentrader.com Jason does great work and I've been a client of his for many years and a really nice guy too.
|
|
|
|
|
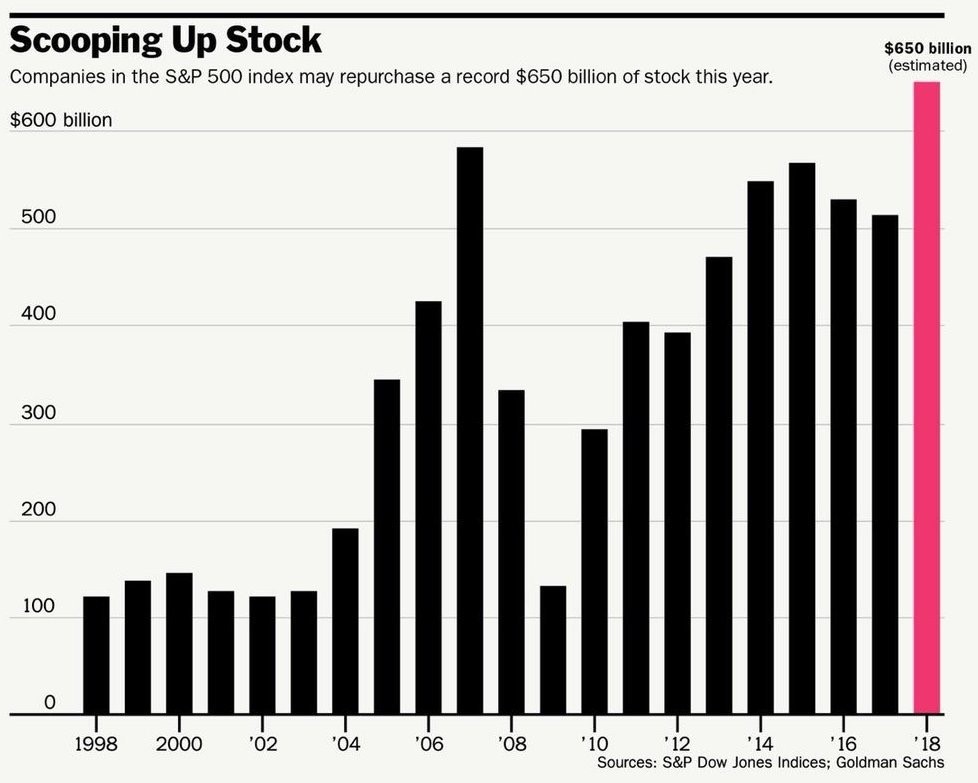
Buybacks back in 2007 were a reason people said the market would remain going up. Apple is a huge % of this number. In the last quarter they bought back 22 billion worth of stocks and this quarter they will buy back probably 25 billion. The average price paid was 171 last quarter and I will guess the average price between the two quarters will be 180 on nearly 50 billion. If the the stock price drops below it would remind me of IBM buyback that was huge
over the years but the average price remains higher than the current stock price.
|
|
|
|
|
|
|
Hong Kong / China ETF and Vanguard Total ex USA Index
|
|
|
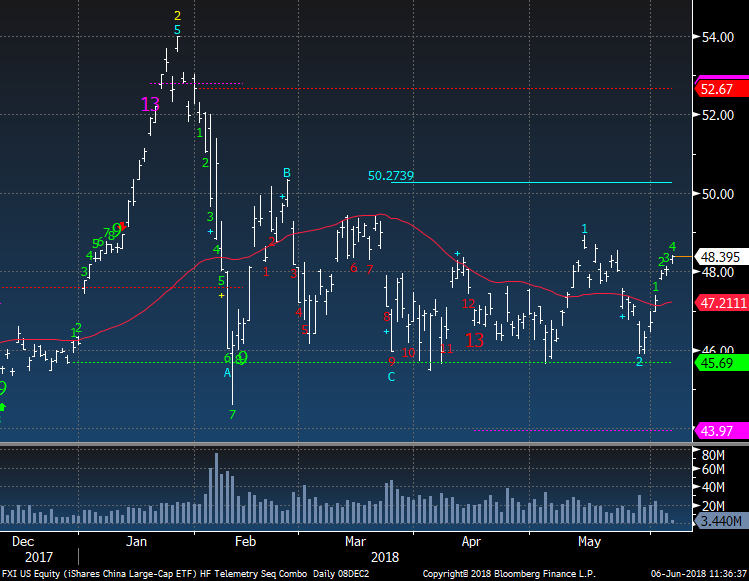
FXI Hong Kong China ETF still looks buyable
|
|
|
|
|
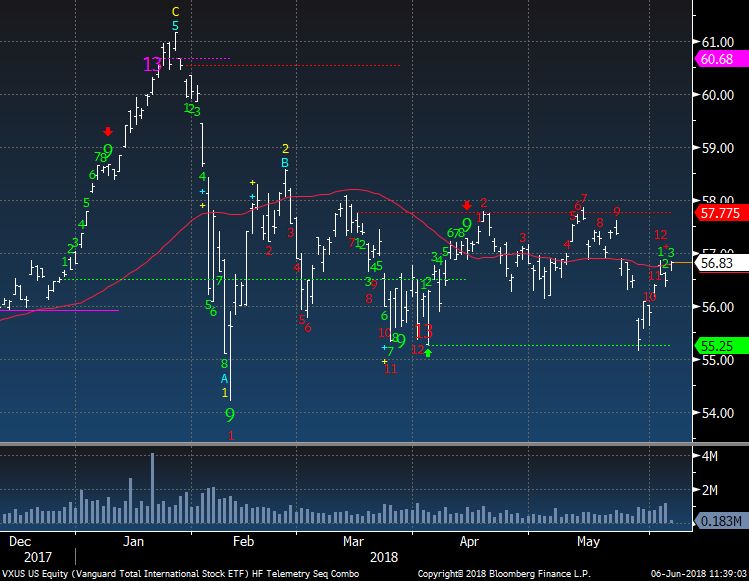
Vanguard Total International ex USA doesn't look that bullish and for a new upside red Countdown 13 a close over the 8th red bar is needed.
|
|
|
|
|
|
|
Some Key US Sectors Monthly Time Frame
|
|
|
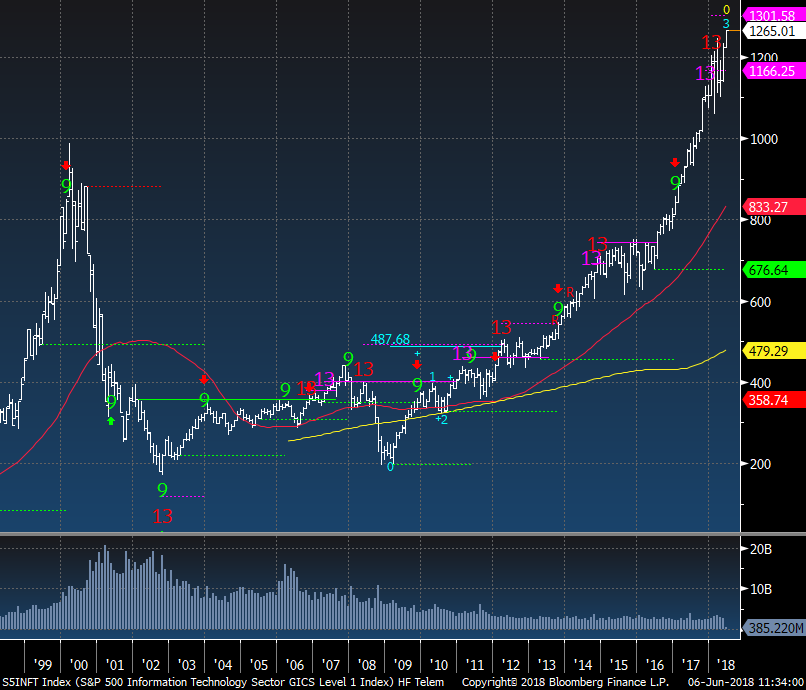
Tech has been on a tear and had upside exhaustion in recent months. These signals are still valid and in play.
|
|
|
|
|
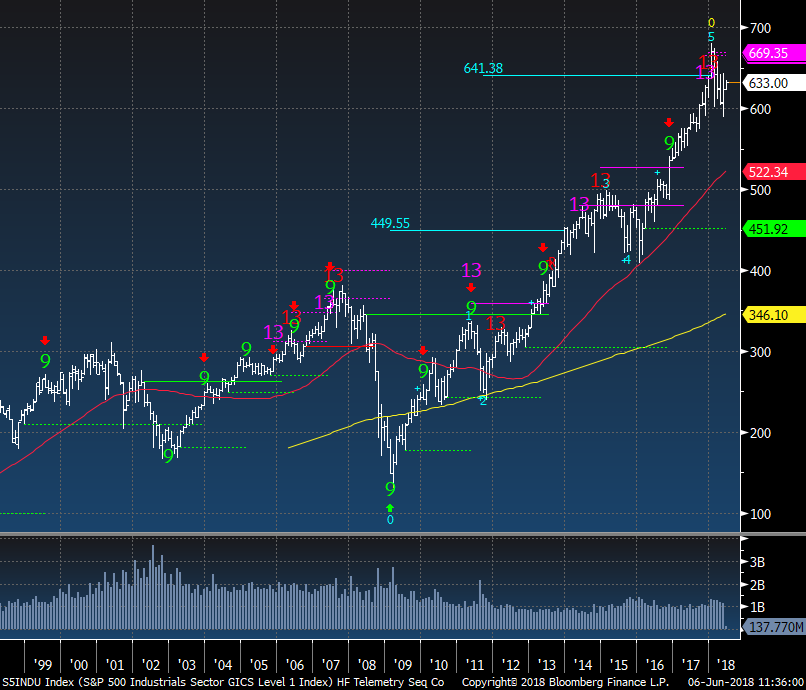
Industrials had upside exhaustion signals too after reaching the upside wave 5 price objective.
|
|
|
|
|
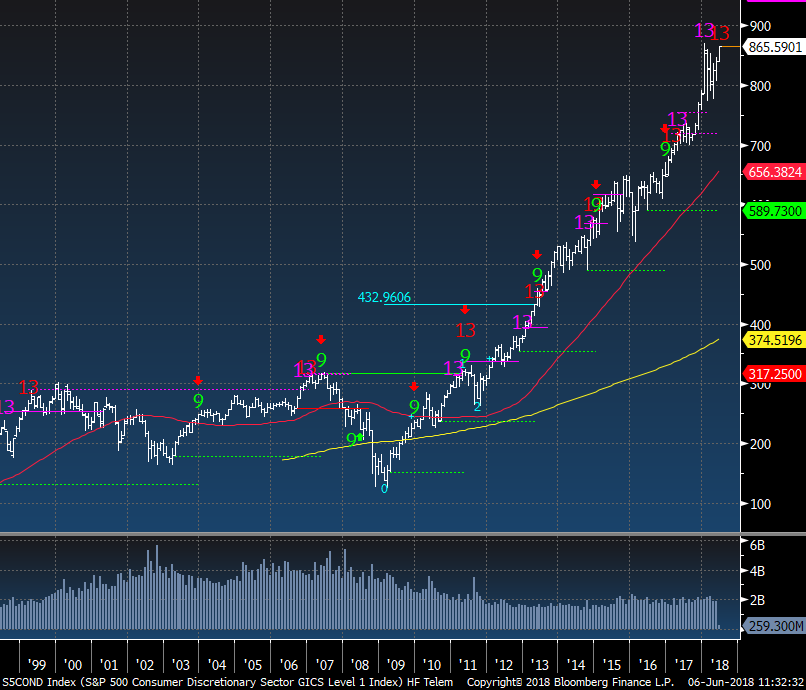
Consumer Discretionary has this month an upside red Sequential Countdown. Since 2012 the signals have stalled or not worked as effectively and I would attribute that to the very large weight of Amazon.
|
|
|
|
|
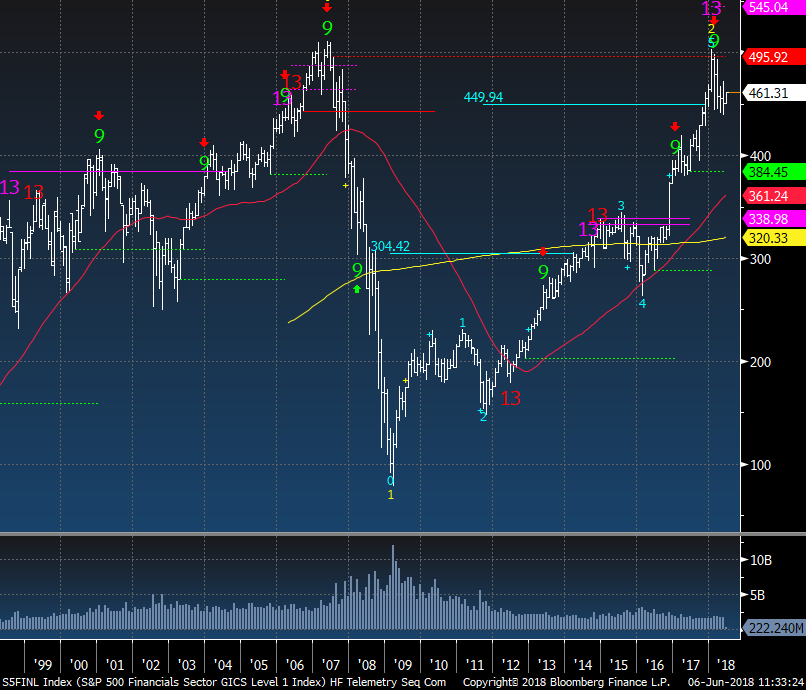
Financials had upside exhaustion late into 2017 and the sector remains well under the highs. I do not expect the same move lower than happened in 2008 but a pullback of more than 10% from here isn't that much to ask.
|
|
|
|
|
|
|
|
|
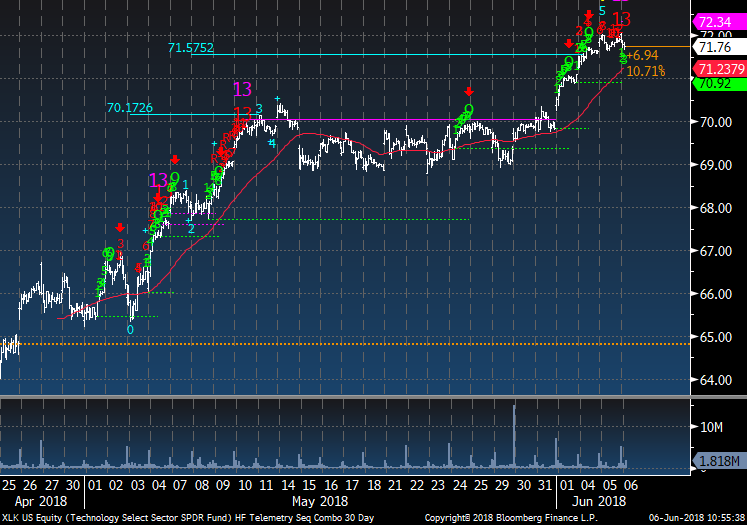
XLK short term 30 min time frame is getting tired with another upside Countdown 13.
|
|
|
|
|
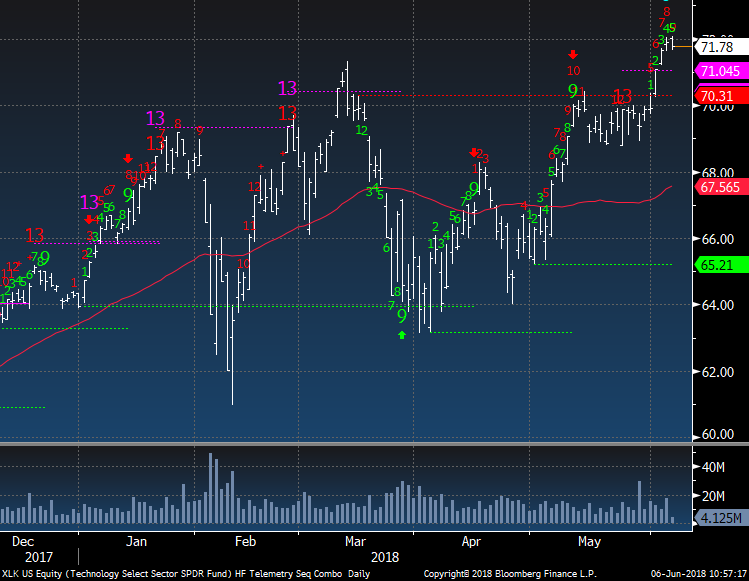
The daily is on day 9 of 13 so a few more days before the next upside exhaustion
|
|
|
|
|
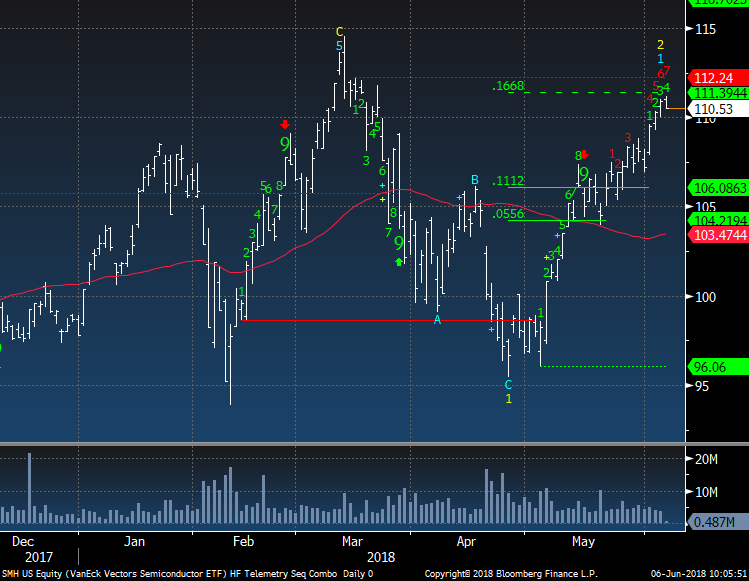
SMH Semiconductors ETF is on day 7 of 13 with its daily Countdown. I've already shorted INTC and TXN in anticipation of it topping again.
|
|
|
|
|
|
|
|
|
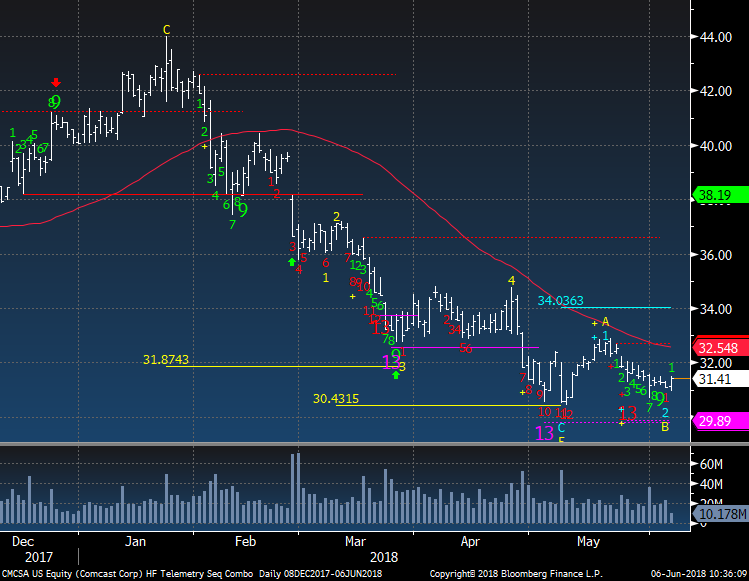
I added back 2.5% weight in CMCSA long today. If this can stay above the May low there is an upside wave 3 price objective of 34.03. They are fighting it out with Disney over the Fox assets and believe both CMCSA and DIS will lift once the winner is determined.
|
|
|
|
|
AMGN was removed from the trade ideas today as a long with a 7% gain. The 30 minute chart is distributive and I still like AMGN but want to try and pick this up lower.
|
|
|
|
|
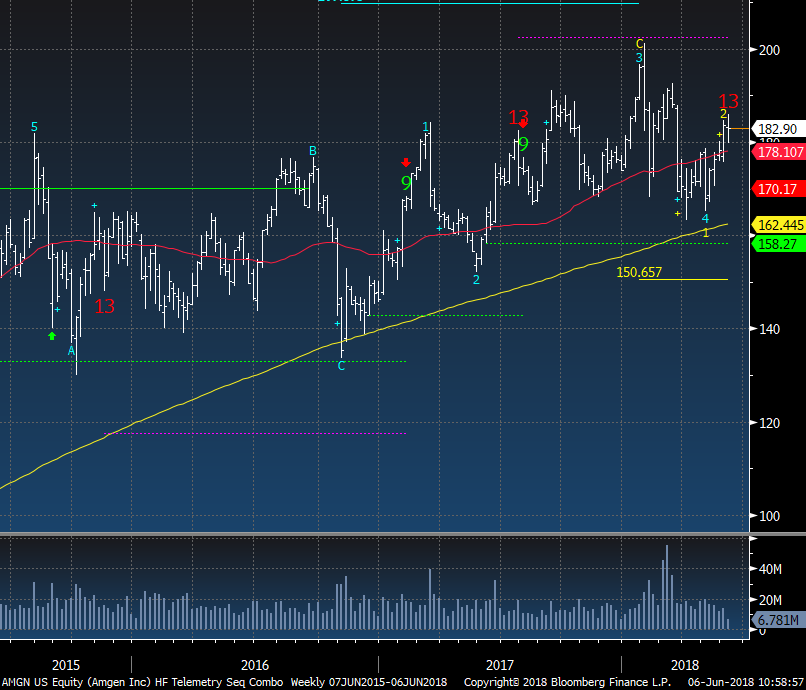
Another reason I removed it today is that there is an upside Countdown on the weekly.
|
|
|
|
|
|
|
Once again we see 18 year old hedge fund managers
|
|
|
This kid is living the dream. When I see these types of stories I know that things are getting to point of insanity. He's met with and put on his board of advisers another young hedge fund manager named Jacob Wohl who once was on a You Tube being interviewed and was asked if he thought he was better than Paul Tudor Jones or if he could teach him anything. Of course he said he was better and he could probably teach Paul a little about options. I sent this to
Paul saying you either have to hire them or kill them. He responded back saying he wasn't too worried about them unless they were robots.
|
|
|
|
|
|
|
|
|
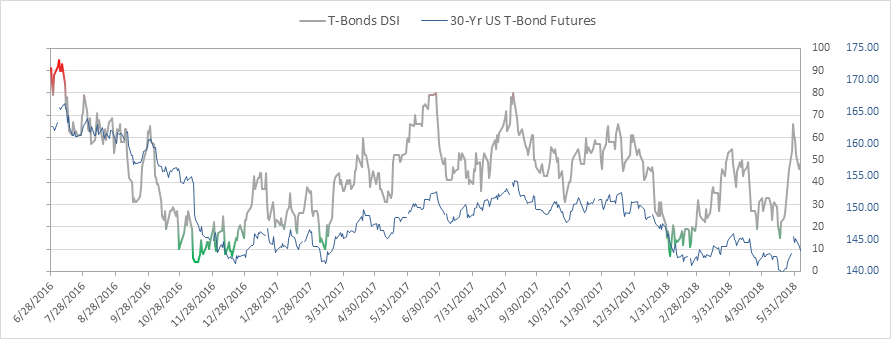
Bond bullish sentiment 48% and still at the mid point .
|
|
|
|
|
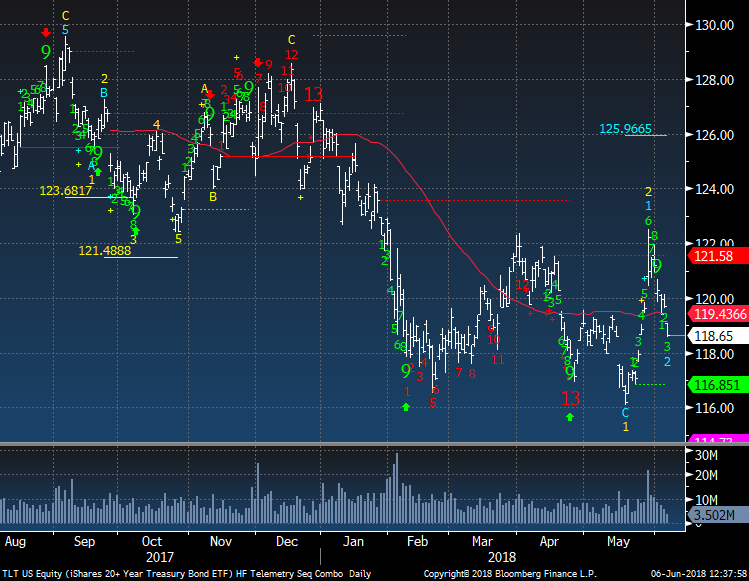
TLT Bond ETF is coming back down but now this wave is the corrective wave 2 so if this can hold above the recent low and reverse (not sure of this) there is a new wave 3 upside price objective. I am neutral bonds here
|
|
|
|
|
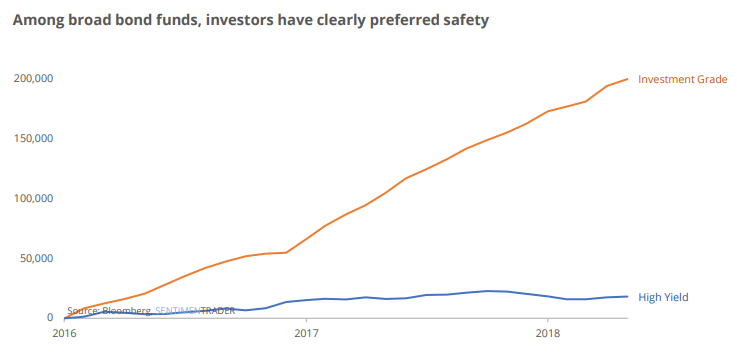
Another good one from Jason from Sentimentrader.com This shows huge inflows into investment grade bonds despite the recent price crush. Are people not looking at their statements?
|
|
|
|
|
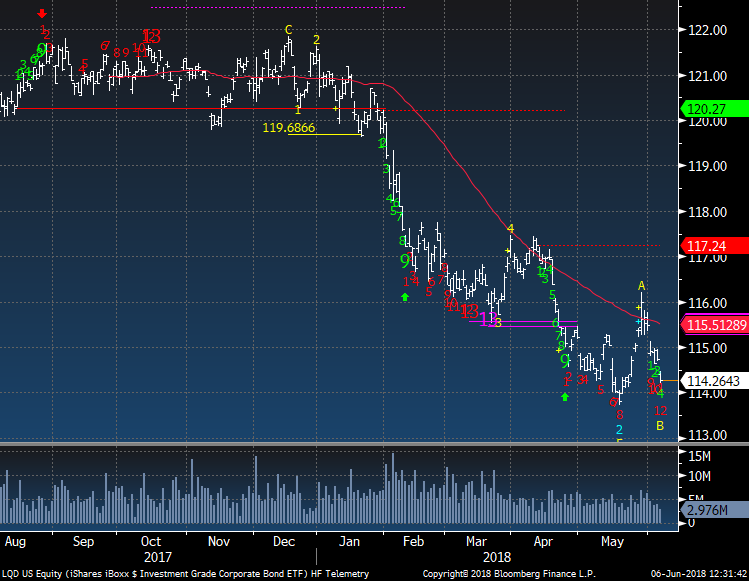
LQD Investment Grade ETF has been crushed. By the way there is a downside Countdown on day 12 of 13 and it might be an opportunity to buy
|
|
|
|
|
|
|
DEMARK SCREENS - Daily, Weekly, Monthly Upside/Downside Exhaustion Signals
|
|
|
Daily/Weekly DeMark upside/downside exhaustion signals (Sequential) weekly updated on Monday's and monthly on the first day of the new month. Price flips occur when a stock closes higher/lower than four previous closes and increases conviction of a price turn.
The upside 13's are sell signals and downside 13's are buy signals. Price flip's are confirmation signals that increases potential for a price trend change. For example, if you are long a stock and there is an upside 13, you will want to take cautious action by selling down or out of a position. If initiating a short sale with the upside 13's, we tend to start with a 1/2 size and add with the downside price flip. The opposite is true for when there are downside 13's. Take a 1/2 size position
and add with the upside price flip. The DeMark Indicators are designed to assist the user with buying into weakness and selling into strength to anticipate trend exhaustion. Selling into a rally and buying into a decline often afford the opportunity to exit a trade without too serious a loss if wrong.
S&P 1500 Universe:
DAILY UPSIDE 13: AEO, KMPR
DAILY DOWNSIDE 13: CASY
DAILY UPSIDE WITH PRICE FLIP REVERSAL DOWN: ACT, AHL, CRY, EGL, ICUI
DAILY DOWNSIDE WITH PRICE FLIP REVERSAL UP: NONE
Updated: 6/4/18
WEEKLY UPSIDE 13: AES, ASH, BA, CA, FTNT, IDTI, IPAR, MCHP, ORN, XOXO
WEEKLY DOWNSIDE 13: DIS, EGOV
Updated: 6/4/18
MONTHLY UPSIDE 13: BJRI, IDA, NSP, PFS, PVH, SCSC, SYY, TSCO, VDSI, VLO
MONTHLY DOWNSIDE 13: CLW, LQDT
Euro Stoxx 600 Universe:
DAILY UPSIDE 13: KER FP, PNN LN
DAILY DOWNSIDE 13:
SHBA SS
DAILY UPSIDE WITH PRICE FLIP REVERSAL DOWN: BWY LN, EOAN GR, QIA GR, SSE LN, TATE LN
DAILY DOWNSIDE WITH PRICE FLIP REVERSAL UP: AMS SW, FRA GR, PSM GR, SHB LN
Updated: 6/4/18
WEEKLY UPSIDE 13: AHT LN, ASML NA, AZN LN, DSY FP, LR FP
WEEKLY DOWNSIDE 13: MS IM
Updated: 6/4/18
MONTHLY UPSIDE 13: ADS GR, AMEAS FH, AV/ LN, BVS LN, DG FP, HELN SW, HLMA LN, ITRK LN, LEG GR, NESTE FH
MONTHLY DOWNSIDE 13:
NONE
|
|
|
Unsubscribe me from Hedge Fund Telemetry
Hedge Fund Telemetry LLC, P.O. Box 4675, Greenwich, CT 06861, United States
CONFIDENTIALITY NOTE and DISCLAIMER: This message is for the named person's use only. It may contain confidential, proprietary or legally privileged material. No confidentiality or privilege is waived by any accidental or unintentional transmission. If you receive this message in error, please immediately delete it and all copies of it from your system, destroy any hard copies and notify the sender. You must not, directly or indirectly, use, disclose,
distribute, print or copy any part of this message if you are not the intended recipient. Hedge Fund Telemetry LLC. cannot guarantee the confidentiality of the material transmitted; therefore, information of a sensitive or confidential nature should not be transmitted. There is risk in trading markets. Hedge Fund Telemetry LLC reports are based on information gathered from various sources and believed to be reliable, but are not guaranteed as to accuracy and completeness. The information is subject to change without notice and Hedge Fund Telemetry LLC has no obligation to provide any updates or changes. Hedge Fund Telemetry LLC is providing this data for informational and educational purposes and does not believe that it is sufficient to base an investment decision on. This information should not be regarded as a solicitation or recommendation of any particular security or to engage in any trading strategy. One should always check with your licensed financial
advisor to determine suitability of any investments.
|
|
|
|
|