|
|
|
|
|
|
I can't believe I am agreeing with Bernie Sanders
|
|
|
Amazon announced today that they are raising the minimum wage from $7.50 per hour to $15 per hour for over 250,000 workers. This has been a big crusade from Bernie Sanders (the most left leaning Senator - for those out of the US). I agree that $15 is a good step for minimum wage. It hasn't been great for some companies especially in food service as they can't raise wages enough to cover the costs. The people working in all of the Amazon distribution centers have lived at poverty
wage levels so this is a big deal for them. It also is a big deal for Amazon but in a negative way since it will add about $800 million to wage costs. Amazon really doesn't make much of a profit on all the stuff we buy online from them and this will only add more reliance on Amazon Web Services earnings which is extremely profitable. What I really wish Jeff Bezos CEO of Amazon would do is donate 1% of his Amazon stock per year to his employees as a bonus (he has about $150 billion in stock so $1.5 billion isn't going to make him pull the kids out of private school). At that rate instead of each worker making $29,000 per year they would make about $40,000. I'm a capitalist through and through and would rather not have someone tell me what to do with my money but I always take care of the people who take care of me. Thoughts?
The market continues to tick slightly higher with the Dow, S&P and Nasdaq 100 but the Russell 2000 has been trading off
making a two month low. Remember some people said the Russell 2000 small cap's are tariff proof? Now that the new Nafta agreement is complete these are no longer defensive? Some data I've seen lately shows about only 50% of the market is up on the year, while 40% of the market is down 10% in the past year. The markets have seen several breadth indicators divergent and cumulative breadth has stopped going up. Several upside DeMark Countdowns on a daily time frame still have some upside left before another upside signal but this is market that I feel has a trap door moment ahead. (read I'm very concerned and outright bearish) Adding to the evidence is that yields on the US 10 year and some other bond proxies are near exhaustion too. (The US 10 year did get the Combo upside exhaustion) The Nikkei has been strong and I was positive on the index but there now are several upside exhaustion signals and the index is a sell. There is an odd correlation
between the US 10 year yield and the Nikkei too.
Earnings season is starting and another major company guided down earnings - Pepsi. I have more thoughts on this below. My October theme is we'll see a lot of earnings guided down followed by lower prices.
- US Markets - Sentiment still divergent. A few more upside days remain with DeMark daily signals
- Hedge Fund Telemetry Trade Ideas - A bunch of ideas today
- Some
Sectors and Stocks I'm watching today
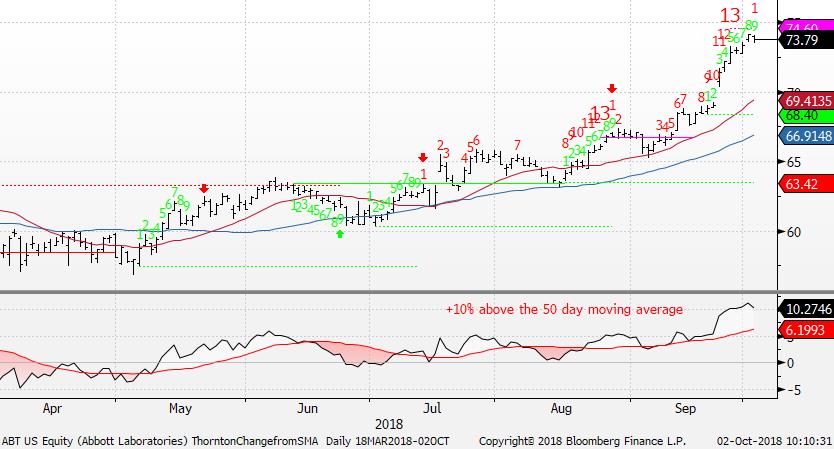
- PPO Monitor - Percentage Price Oscillator Force Ranked Sector Rotation - ABT notable overbought
- Bloomberg Technical Pattern Recognition Screen
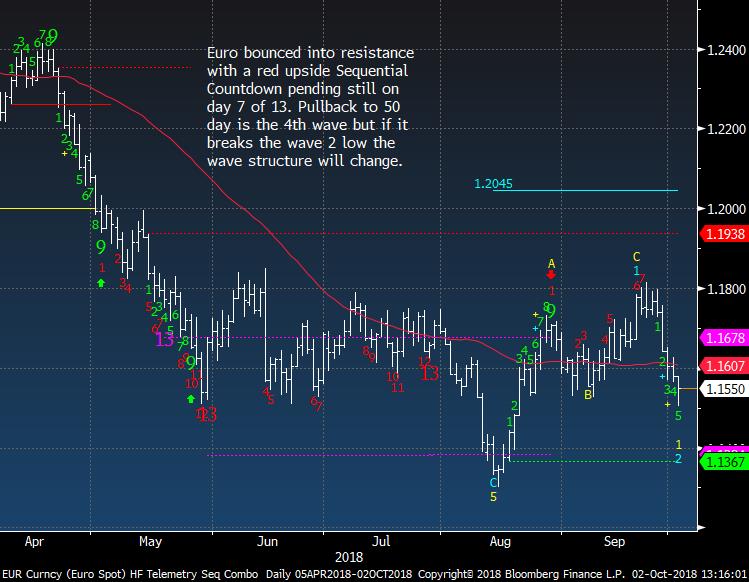
- Currency Update - USD sentiment and Euro Sentiment nearly crossing again
- European Market Update - just no momentum follow through
- Global Market Update - EEM and others back under 50 day but no new lows
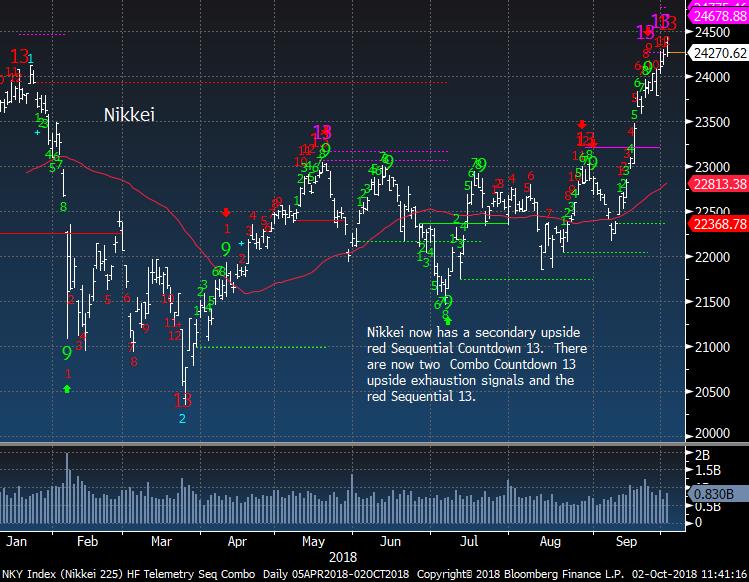
- Asian Market Update - BIG CALL - NIkkei upside exhaustion with 96% bulls - Bell ringer
- Crude Update - 96% bullish sentiment - Sell your longs but don't short yet
- Gold Update - Downside exhaustion recently followed by upside gap - Back long on GLD and GDX
- Bond Update - Getting very close to exhaustion signals - Very important to watch these
- DeMark Screens - Daily, Weekly, Monthly upside/downside exhaustion signals within the S&P 500 and Euro Stoxx 600 September Monthly data updated
|
|
|
|
|
Here's a link to the Hedge Fund Telemetry market sentiment page with 40 charts of sentiment including equities, bonds, currencies, and commodities updated each day. When the new website launches we will be adding new charts and historical sentiment data for Euro Stoxx 50, UK FTSE 100, German DAX, French Cac 40. We will be adding Japanese Bonds, German Bunds, and a few more.
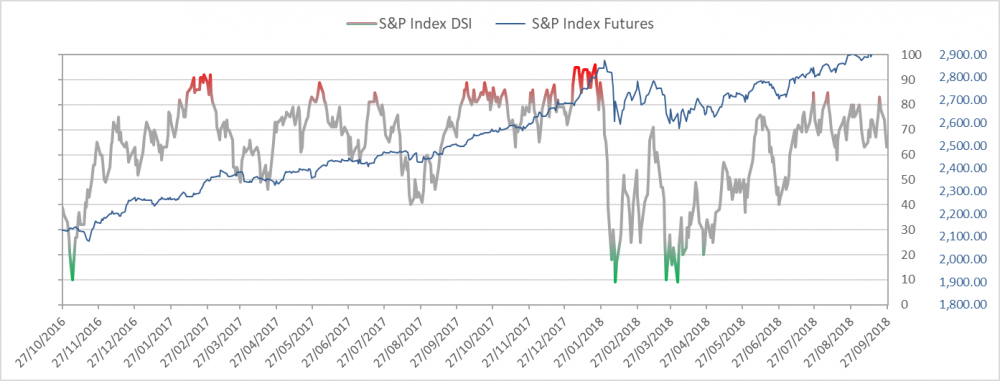
SPX bullish sentiment is at 65% and divergent from index price action
|
|
|
|
|
SPX daily still has a little more potential for nominal new highs but I'm positioning now
|
|
|
|
|
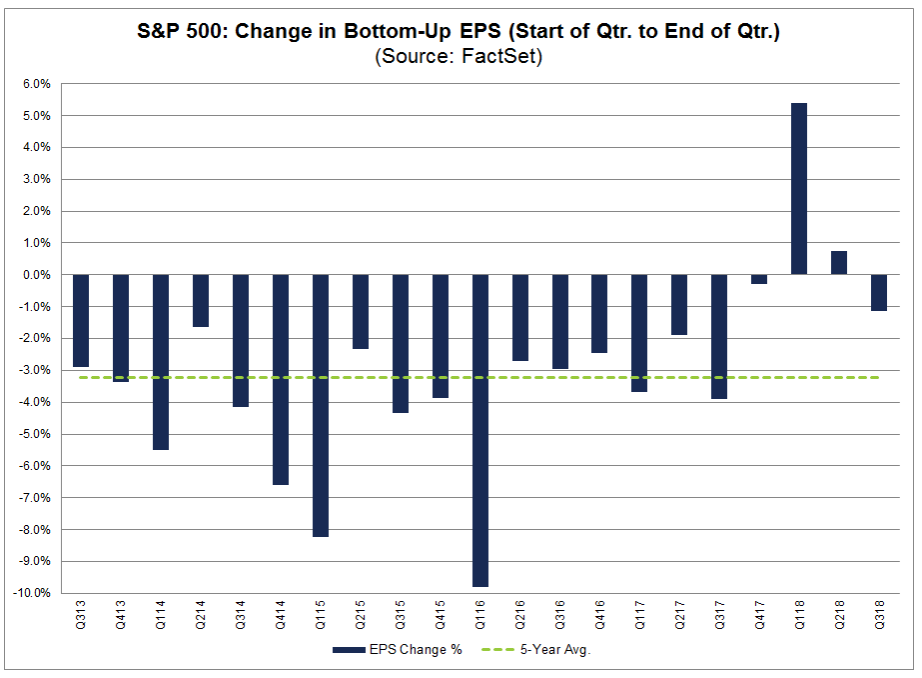
I've mentioned recently how I expect my theme of guidance cuts to hit stocks this October. A notable technical analyst who I like a lot mentioned on Twitter that guidance cuts see higher stock prices historically. This chart illustrates why i see problems and is counter to his argument. Usually guidance cuts come well below the 5 year average and currently there is a lot of room on the downside after very positive upside revisions. Notably back in Q1 2016
the market was down quite a bit and guidance cuts were very strong.
|
|
|
|
|
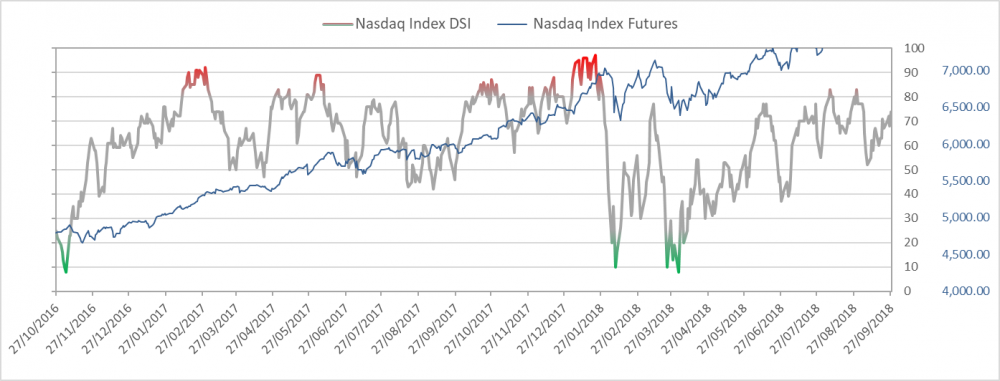
Nasdaq bullish sentiment is at 75%
|
|
|
|
|
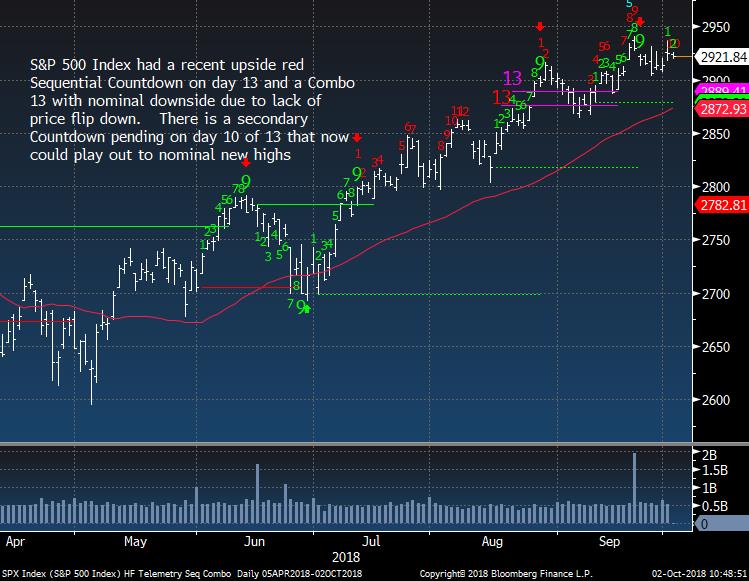
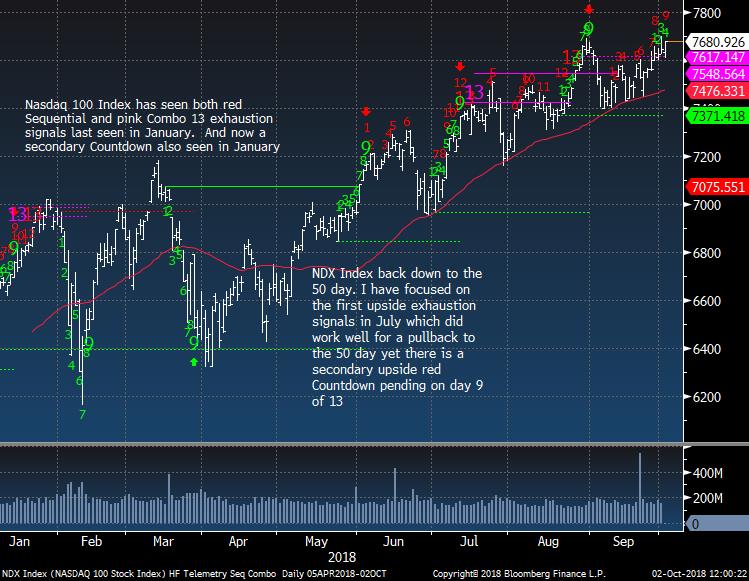
NDX Index still on day 9 of 13 with upside Countdown
|
|
|
|
|
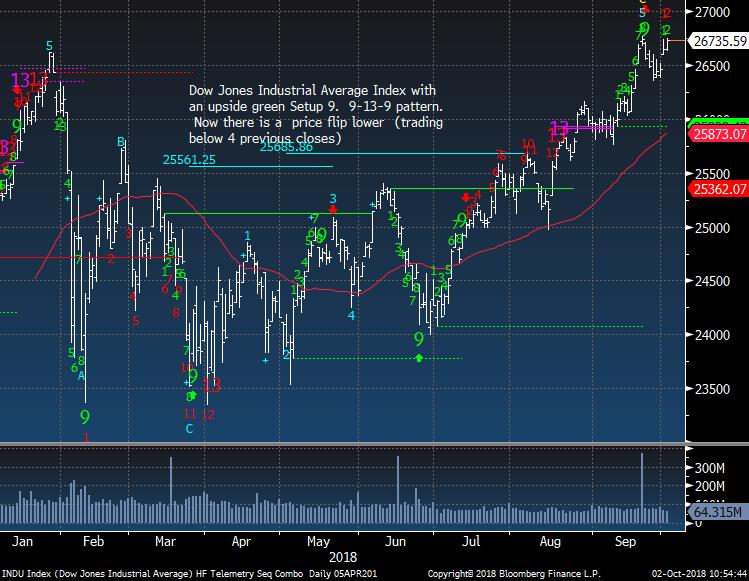
Dow Jones Industrial Average is actually only on day 2 of 13 so perhaps the Dow will be an outlier. If below 26,500 I could see a new downside green Setup that could cancel the upside Countdown
|
|
|
|
|
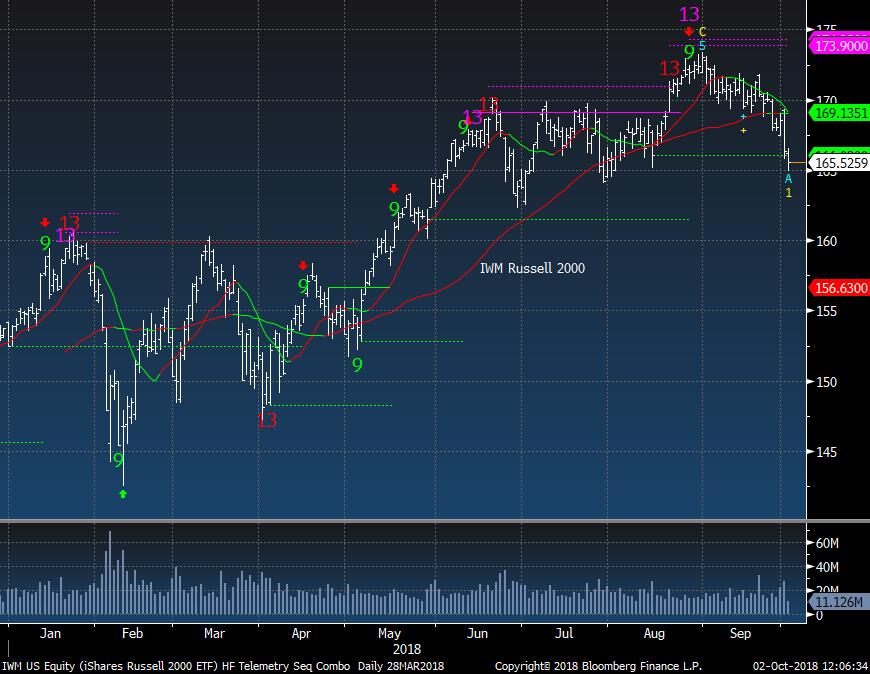
IWM Russell 2000 now below support.
|
|
|
|
|
|
|
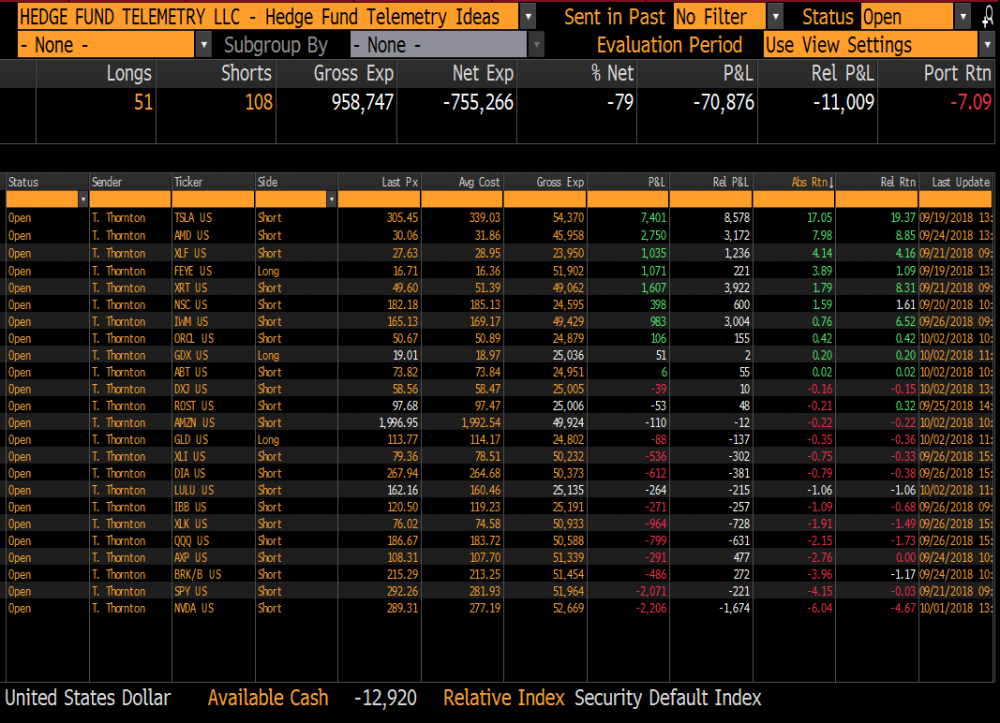
Hedge Fund Telemetry Trade Ideas
|
|
|
Trade Ideas Sheet - Long and short US equity ideas including ETF's. We will be overhauling the Trade Ideas Sheets for long only, short only, ETF's when the new website rolls out soon. There will also be a clearer email distribution with changes.
Trade Ideas Changes: STOPPED ON FXI +1%, NEW SHORTS: 2.5% SIZED ABT, ORCL (CHART TOMORROW), LULU, DXY. 5% AMZN. NEW LONGS 2.5% EACH GLD, GDX
Stops on everything. TSLA 320, GDX 17.35 , FEYE 16.00, FXI 41.95 (stopped), NVDA 295, QQQ 190 (raised stop), XLK 79 (raised stop), SPY 295, XLY 118, AXP 114, XRT 53, IWM 172, XLV 95, BRK/B 225, DIA 275, XLI 81.50, IBB 123, AMD 35, ROST 100.50, ABT 76, ORCL 53, LULU 165, AMZN 2050, DXJ 61, GLD 111
|
|
|
|
|
|
|
Some Sectors I'm Watching Today
|
|
|
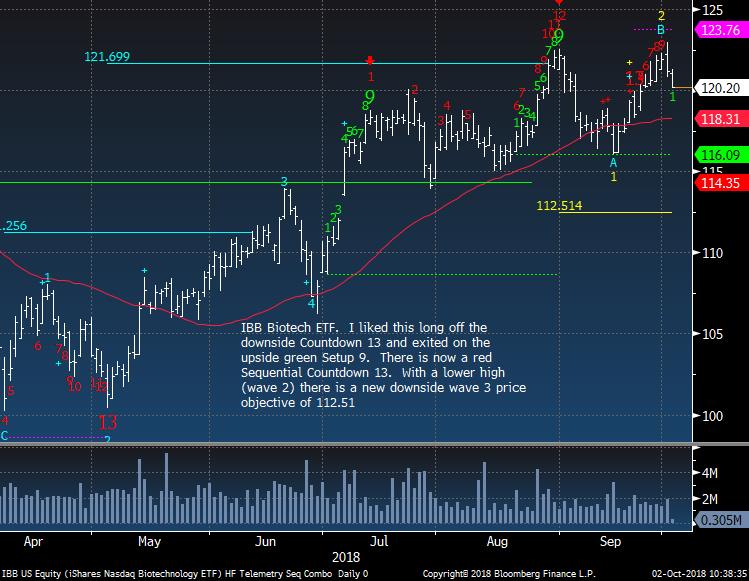
Biotech quite the reversal in the past two days
|
|
|
|
|
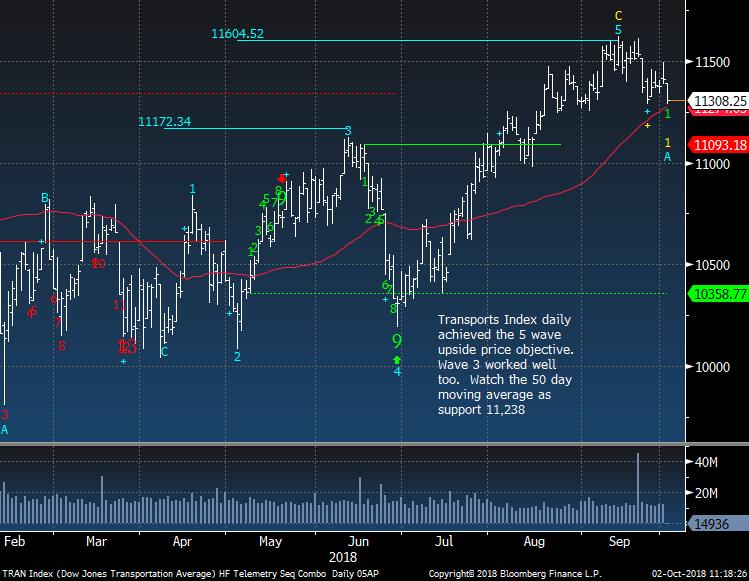
A few weeks ago I did a deep dive on all the sub sectors in the Transports sector and had real concerns on the truckers and rails. Airlines did not have much of a bounce and the are breaking down too. Autos continue to be terrible
|
|
|
|
|
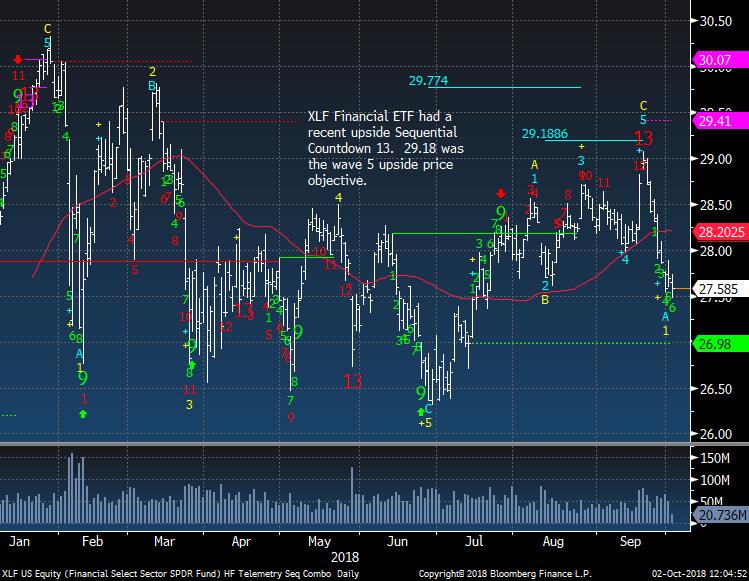
Financials reacted well when I showed the upside Countdown 13.
|
|
|
|
|
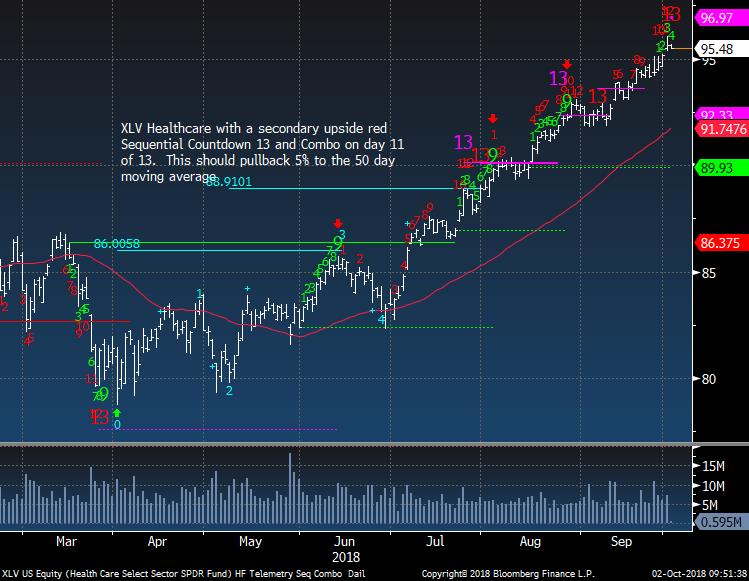
Healthcare has been very strong negating several upside Countdowns. Seasonality starts to get tougher for the sector so we'll see if this signal works
|
|
|
|
|
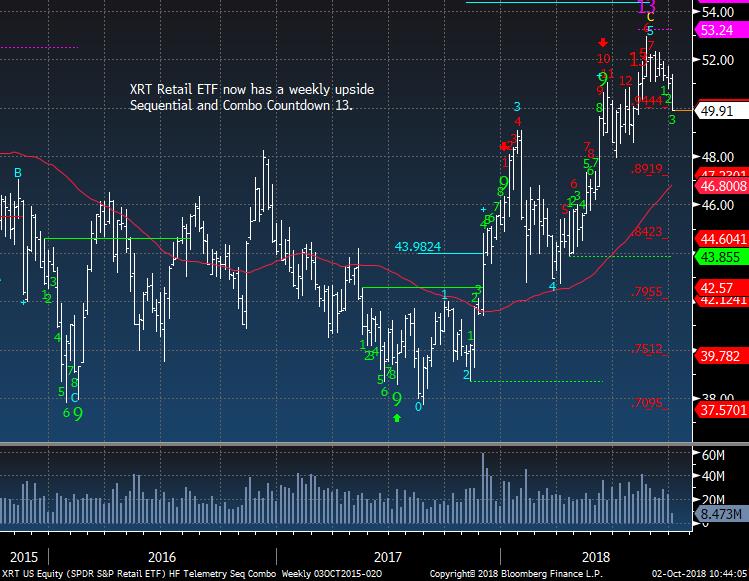
Retail weekly now starting to roll over
|
|
|
|
|
|
|
Several Stocks I'm Watching Today
|
|
|
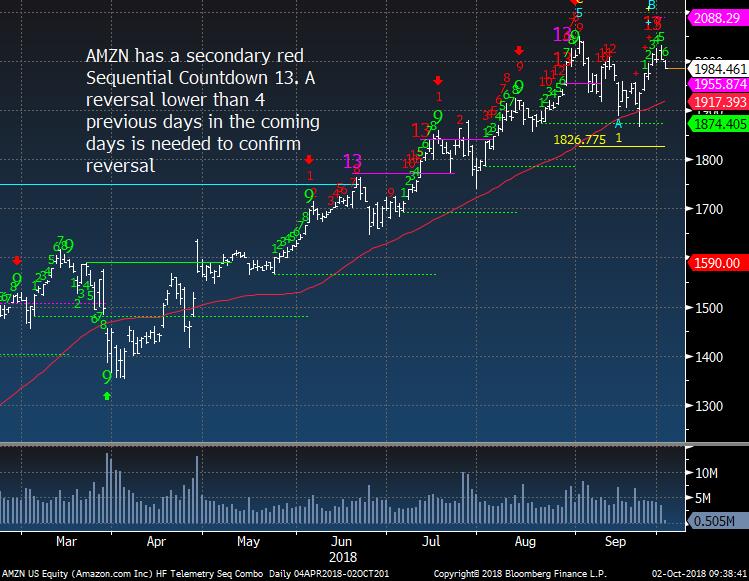
I added back AMZN again to the short side ahead of the price flip lower but that could happen tomorrow.
|
|
|
|
|
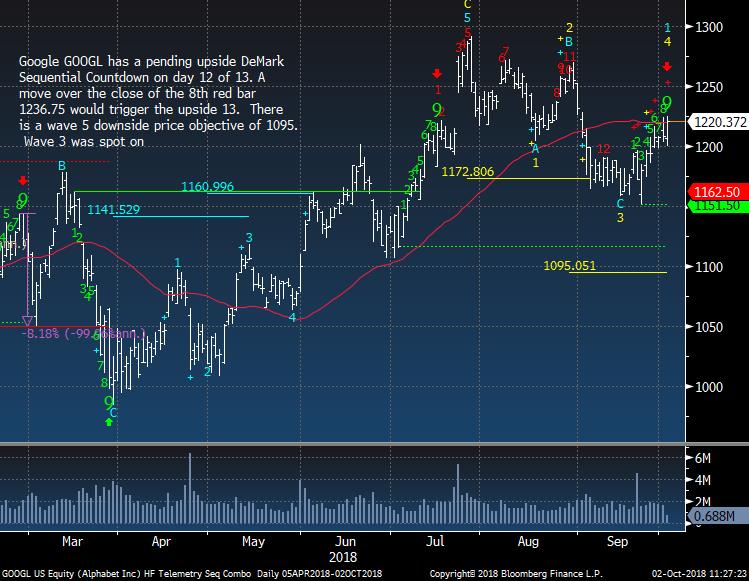
GOOGL has green Setup 9 but needs a little more the upside Countdown 13
|
|
|
|
|
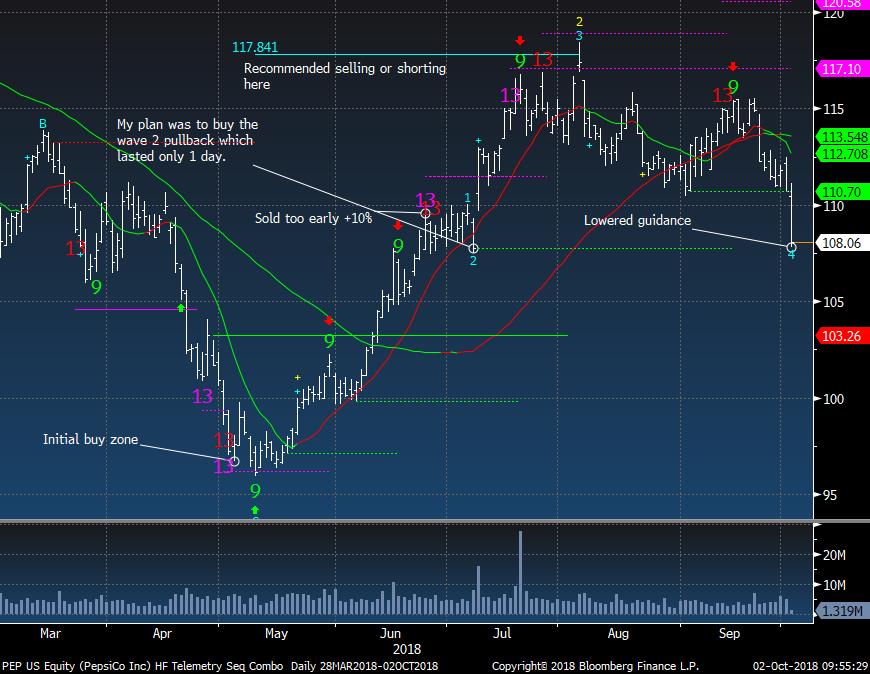
Pepsi in the past 6 months - Note they lowered guidance today and people didn't respond well to that surprise
|
|
|
|
|
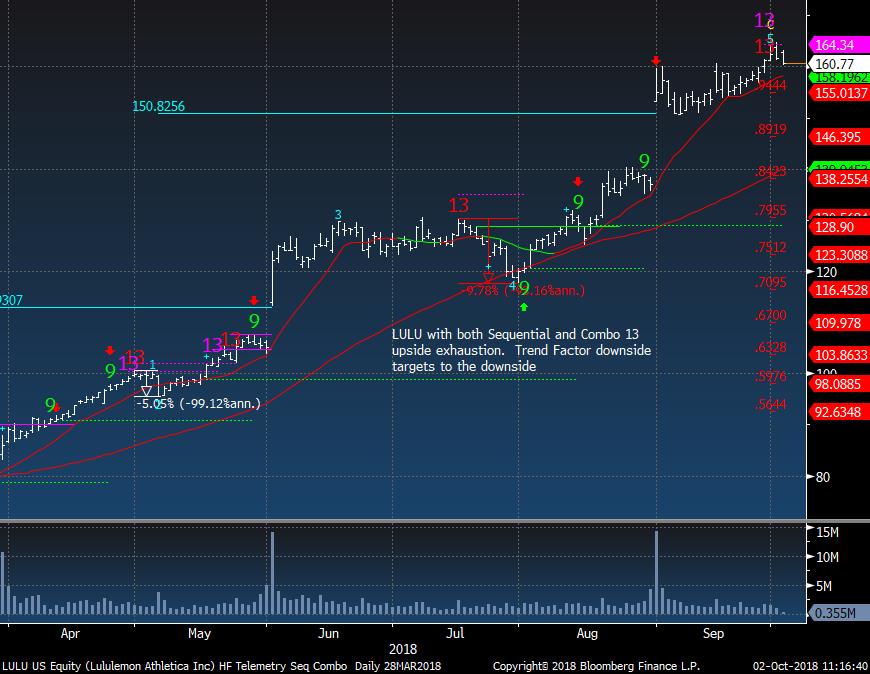
LULU has been great but there is a new upside Countdown with Sequential and Combo
|
|
|
|
|
LULU heads into weak seasonality
|
|
|
|
|
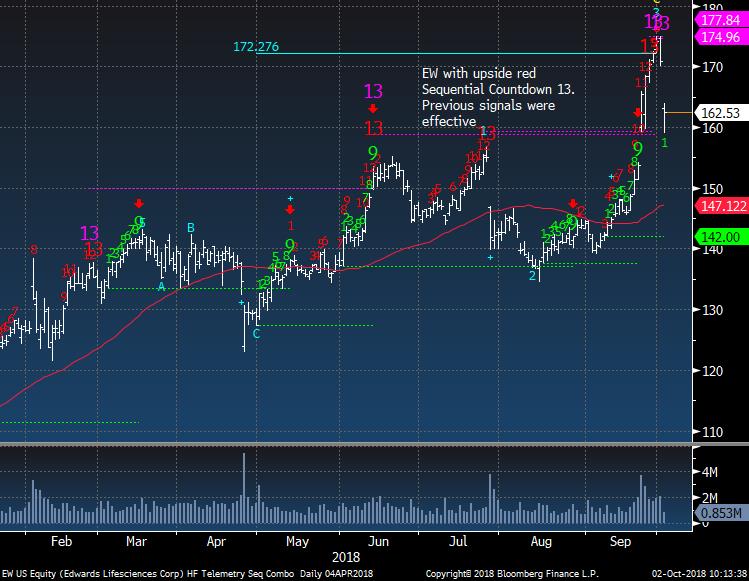
EW was highlighted last week as one that I spotted on the DeMark Screens that I post each day
|
|
|
|
|
|
|
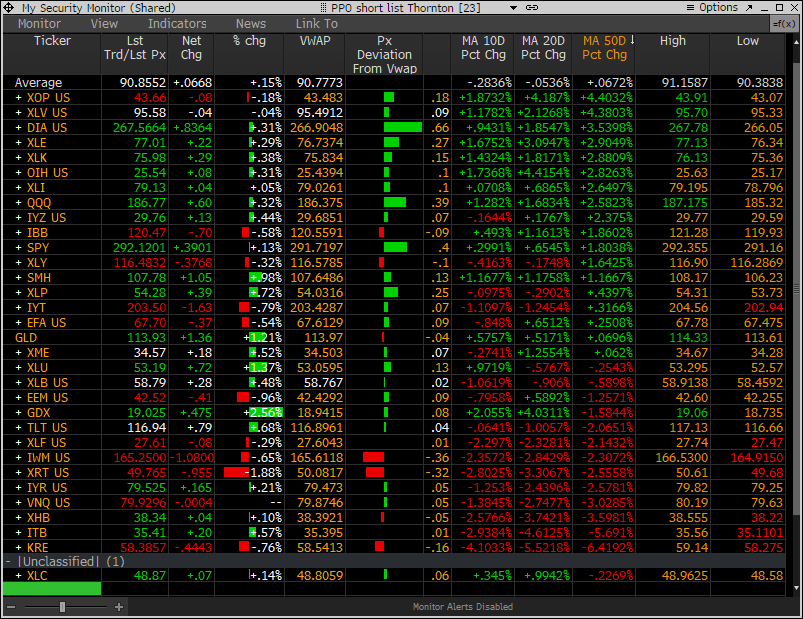
PPO Monitor - Percentage Price Oscillator
|
|
|
The PPO Monitor is a proprietary monitor developed to force rank Indexes, Sectors, and Stocks. It ranks top down by strongest to weakest by percentage above/below the 50 day moving average. Shorter term signals can be seen when the 10 and 20 day moving averages turn up (green) or down (red) which often are followed by the 50 day moving average. This is useful to watch for historically overbought/oversold percentage above/below the 50 day moving average. It is
non correlated with the DeMark Indicators however we have found upside/downside exhaustion signals often occur when something rises to the top or drifts to the bottom of the monitor - increasing the timing aspect. We share this monitor with clients with Bloomberg Terminals. An added feature is that each market/ETF can be expanded with each component force ranked in the same way. A couple other features include price deviation from intraday VWAP (useful for intraday reversals) and new 20 day highs/lows on right side. Please inquire if you would like to be permissioned to use the PPO Monitor.
Today's highlights: still seeing strength on the top of the monitor but the average of the 10 day and 20 day is now negative. Slowing momentum
|
|
|
|
|
The following chart shows the Percentage Price Oscillator (50 day moving average) in action. ABT was added to Trade Ideas today as a short and partly due to it being very overbought at 10% above the 50 day moving average.
|
|
|
|
|
|
|
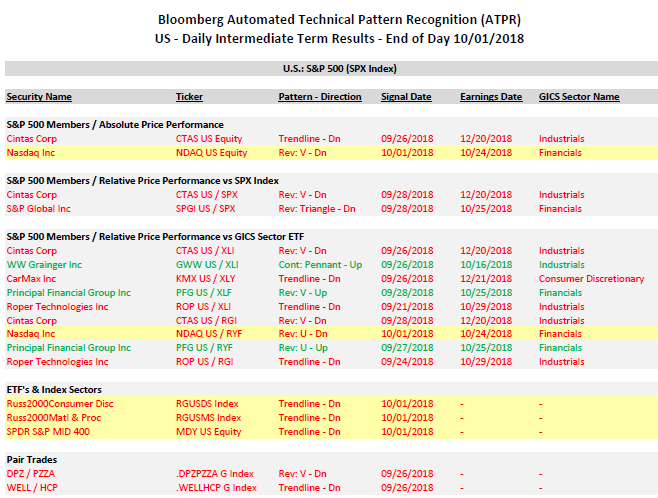
Bloomberg Automated Technical Pattern Recognition Screens
|
|
|
S&P 500 Members/Absolute Price Performance and Relative Price Performance vs S&P 500 and Sector ETF's. ETF's vs Index Sectors. Pair Trades. Long side is first symbol, short side is second symbol.
|
|
|
|
|
|
|
|
|
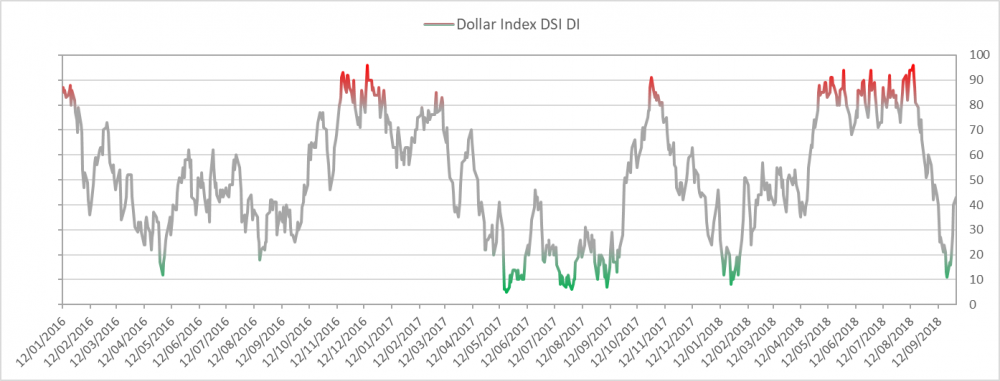
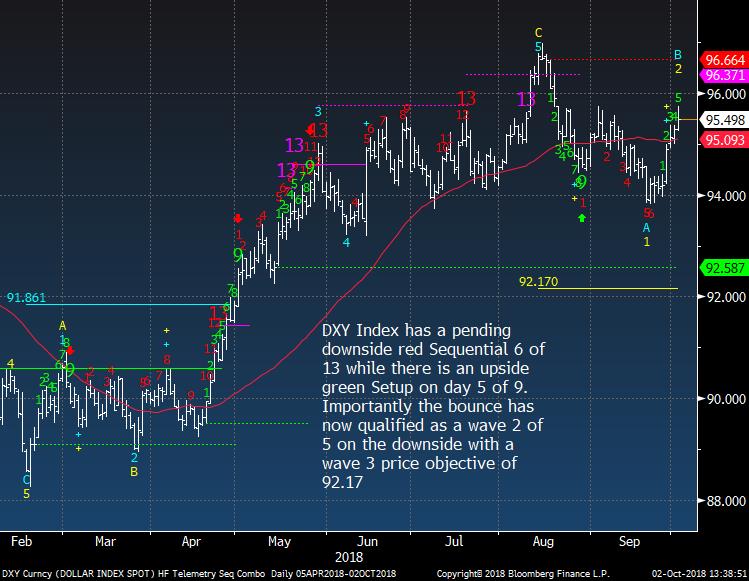
US Dollar bullish sentiment is at 43% and continues higher after hitting 11%. Lets see if it can get over 50% mid point
|
|
|
|
|
|
|
|
|
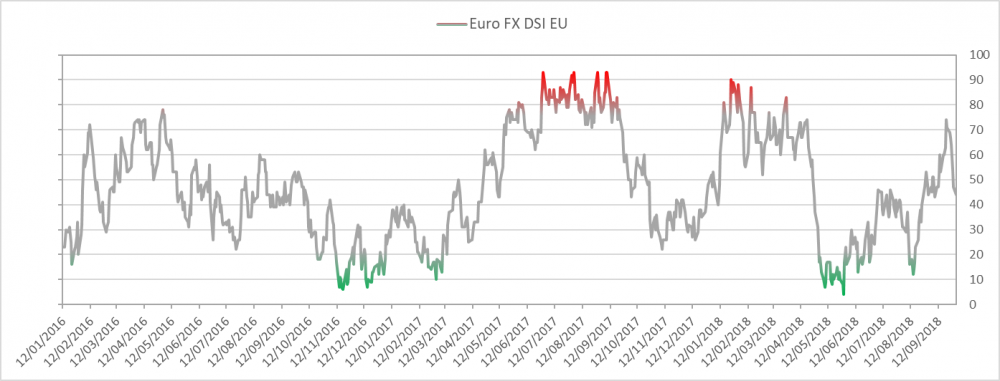
Euro bullish sentiment is at 44%
|
|
|
|
|
|
|
|
|
|
|
|
|
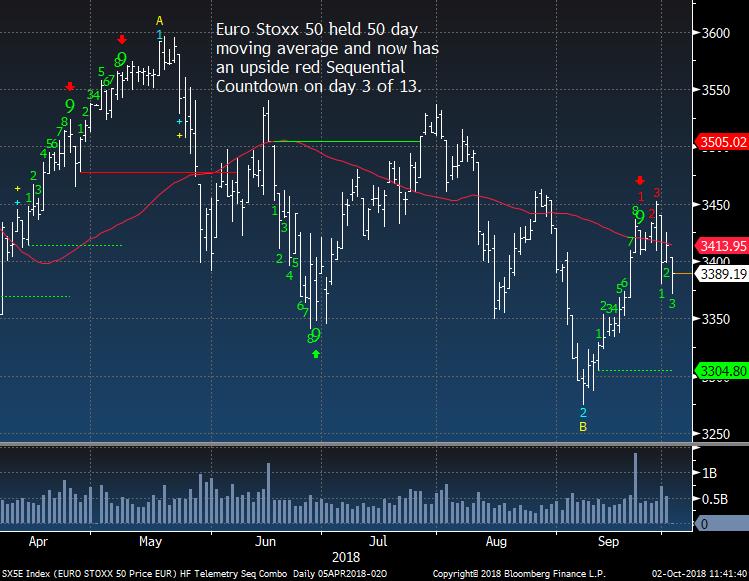
Euro Stoxx 50 just can't put some consistent momentum together
|
|
|
|
|
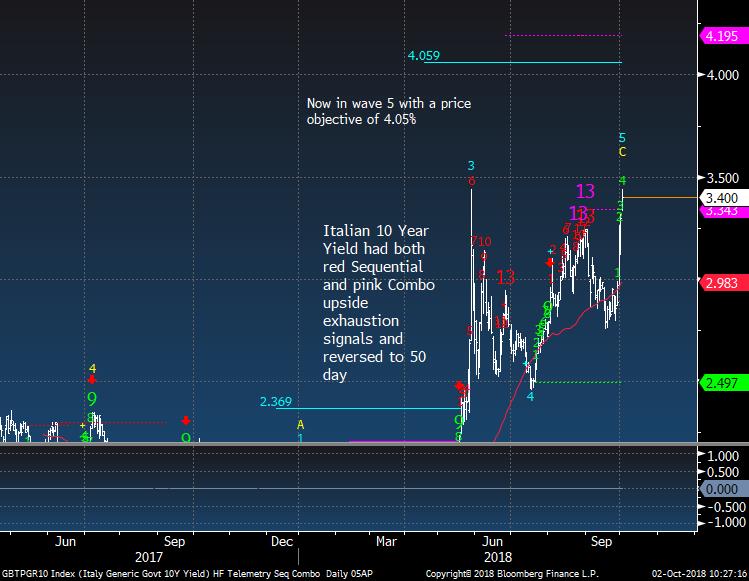
Italian 10 year yield now in wave 5 with a 4.05% price objective
|
|
|
|
|
|
|
|
|
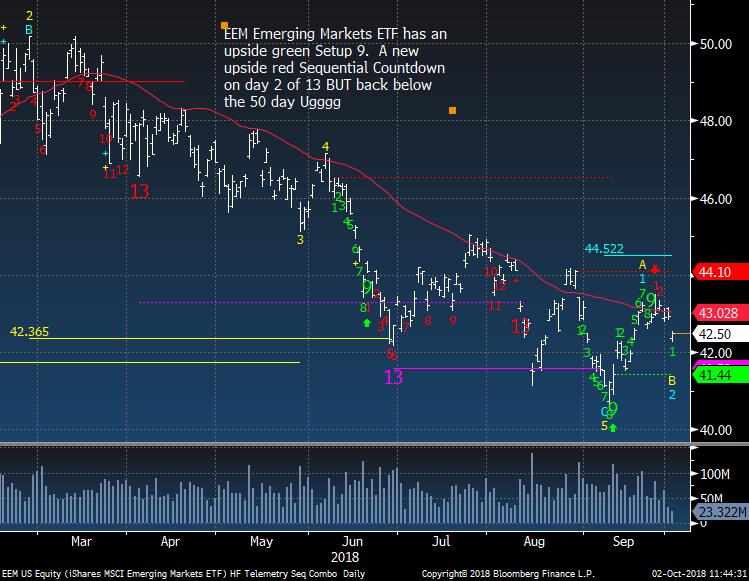
EEM Emerging Markets ETF failed at 50 day
|
|
|
|
|
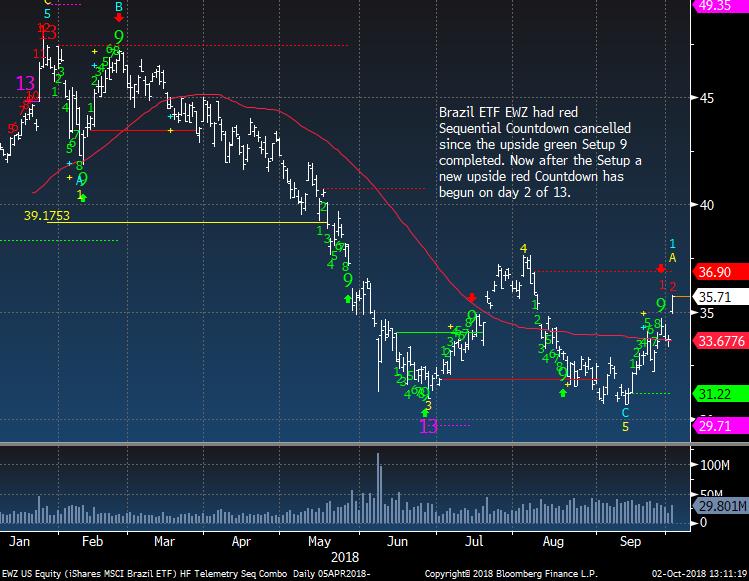
Brazil now looks pretty bullish but I don't want to chase this up 5% today
|
|
|
|
|
|
|
|
|
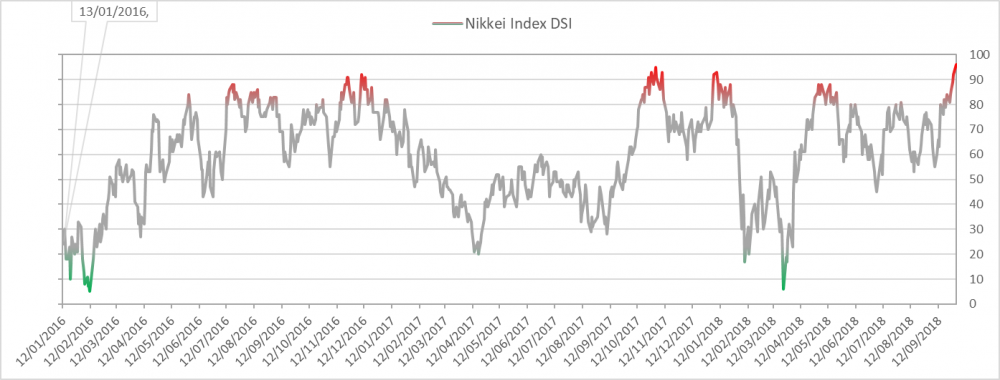
Nikkei bullish sentiment is at 96% and this is a bell ringer peak in sentiment
|
|
|
|
|
Nikkei upside exhaustion. I am using DXJ as a short proxy. DXJ does not have the same Countdown fyi but I use the Nikkei with the strong record with the DeMark Indicators
|
|
|
|
|
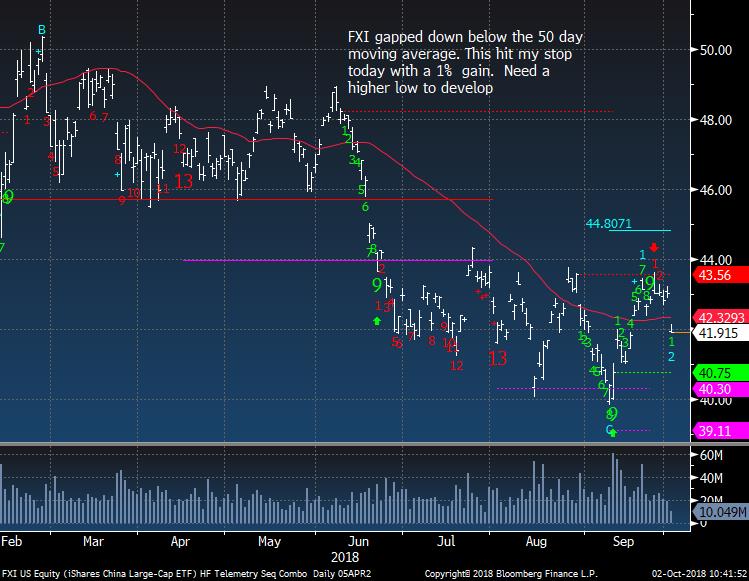
China / Hong Kong FXI ETF stopped out with the gap down. I'll be back as a long again
|
|
|
|
|
|
|
|
|
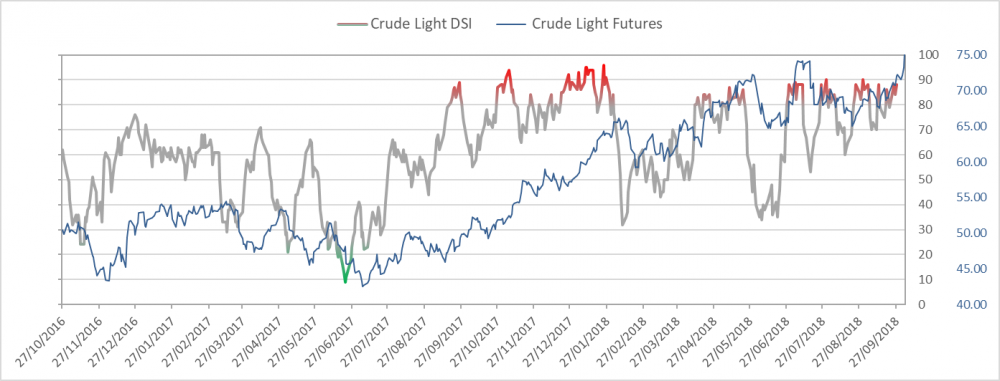
Crude bullish sentiment is at 96% and also a bell ringer peak in sentiment
|
|
|
|
|
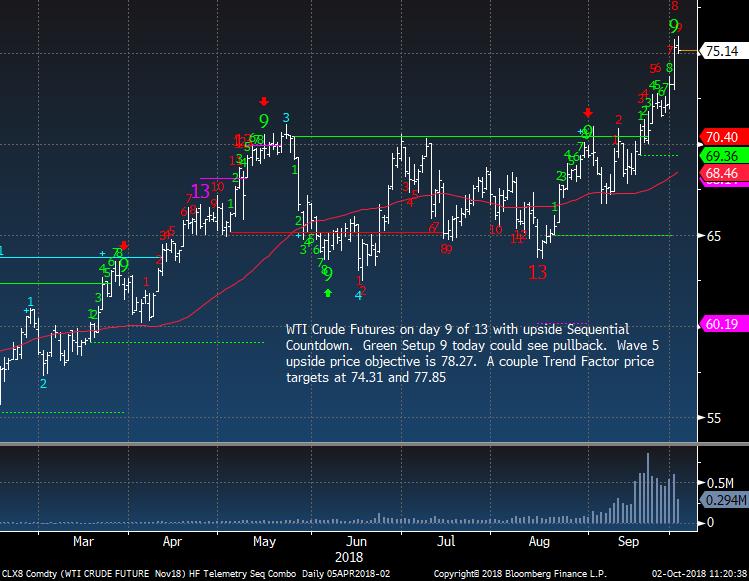
WTI Crude Futures still has an upside red Sequential Countdown but the green Setup 9 has worked well at inflection points. I would sell long positions in crude but not short it yet
|
|
|
|
|
|
|
|
|
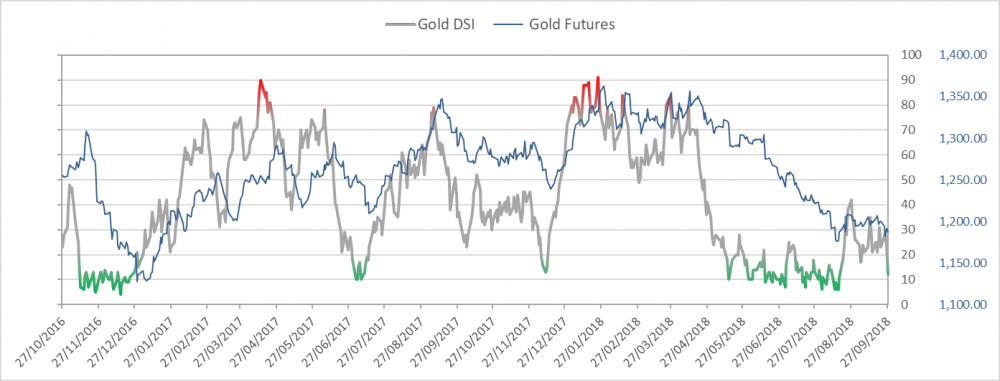
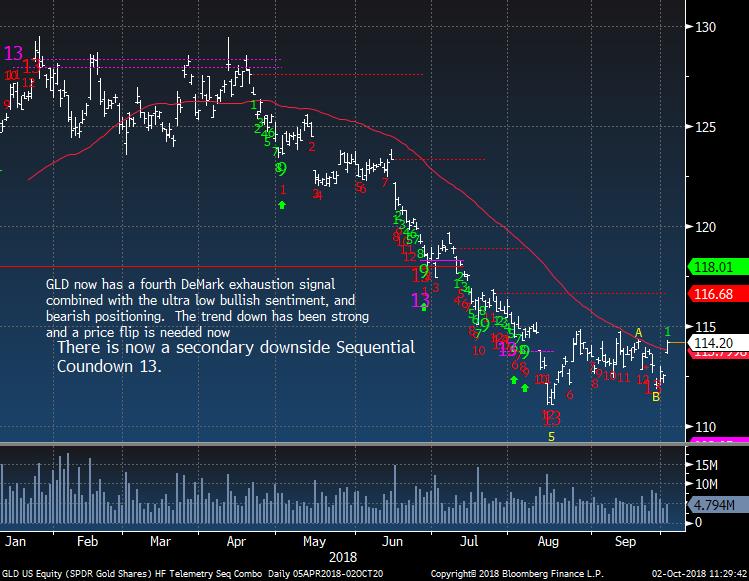
Gold bullish sentiment is at 17% and I expect it to go higher today
|
|
|
|
|
Gold GLD above the 50 day first time since April. After the downside Countdown 13 and now price flip up (green 1 trading higher than 4 previous closes) this is a buy. I bought a 2.5% sized long
|
|
|
|
|
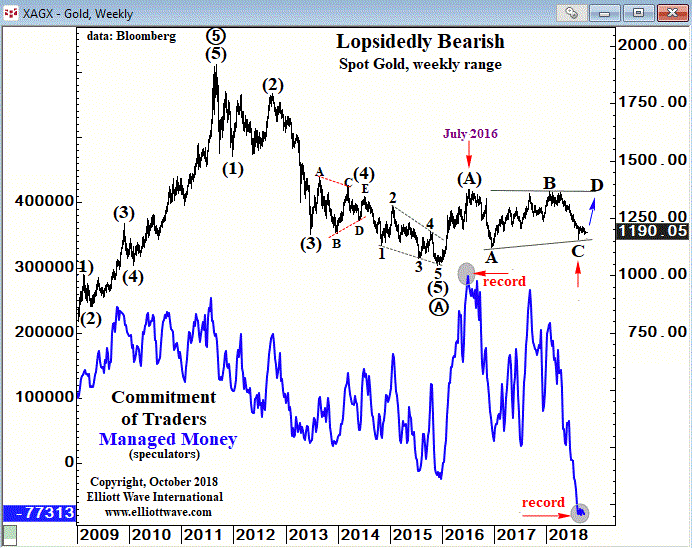
Elliott Wave guys posted this chart with the COT data showing record short positioning
|
|
|
|
|
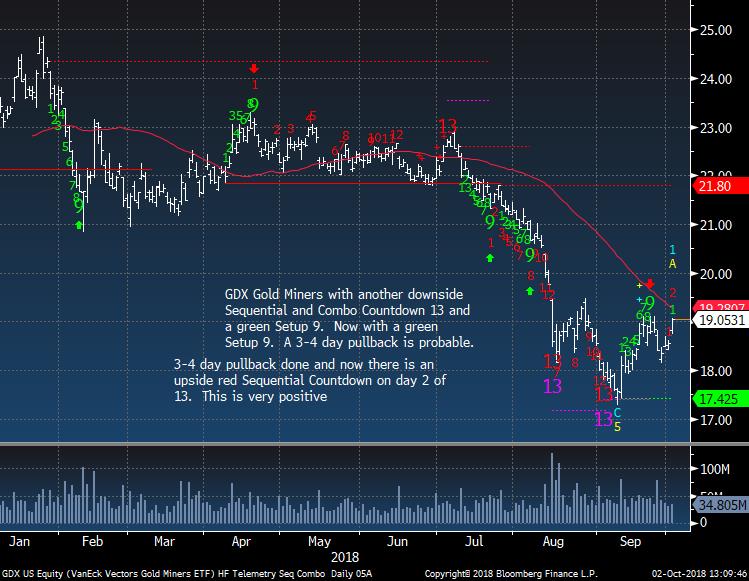
GDX also looks better and I bought it back today too with a 2.5% size long
|
|
|
|
|
|
|
|
|
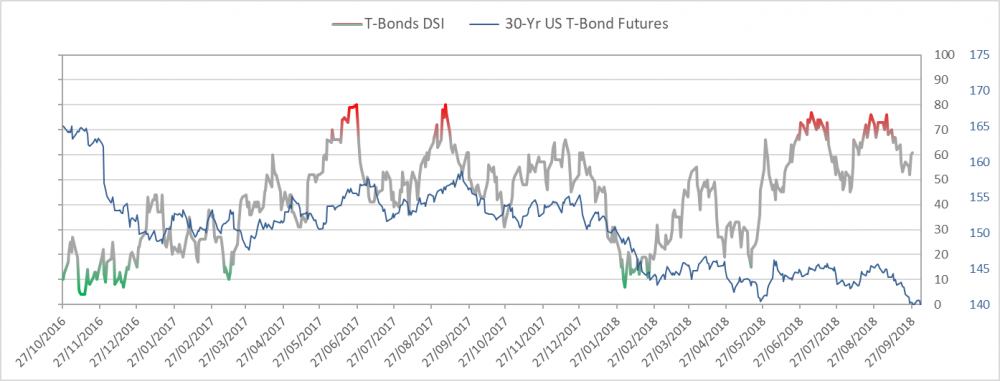
Bond bullish sentiment is at 52%. Considering bonds have been hit recently I am surprised this remains around 50%
|
|
|
|
|
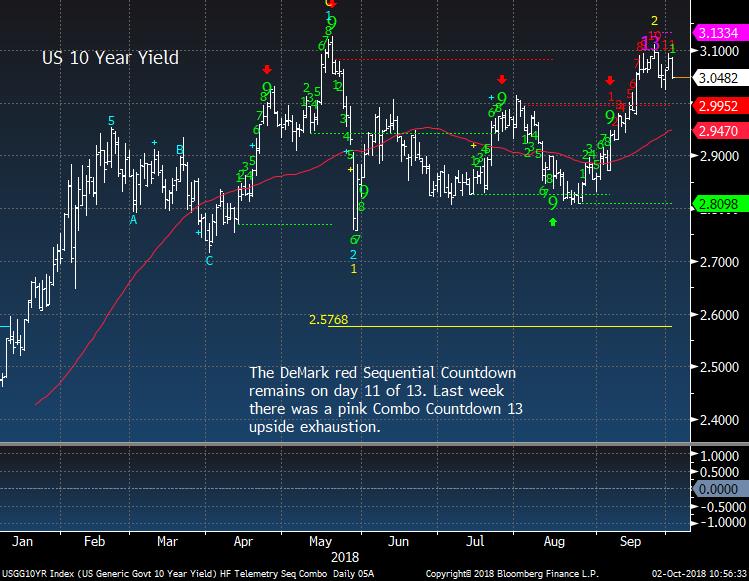
US 10 Year Yield nearing a top
|
|
|
|
|
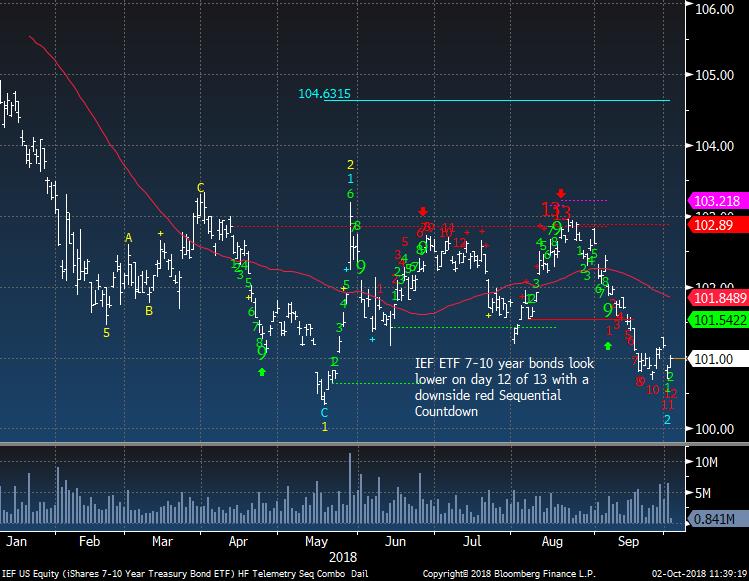
IEF ETF nearly at a bottom
|
|
|
|
|
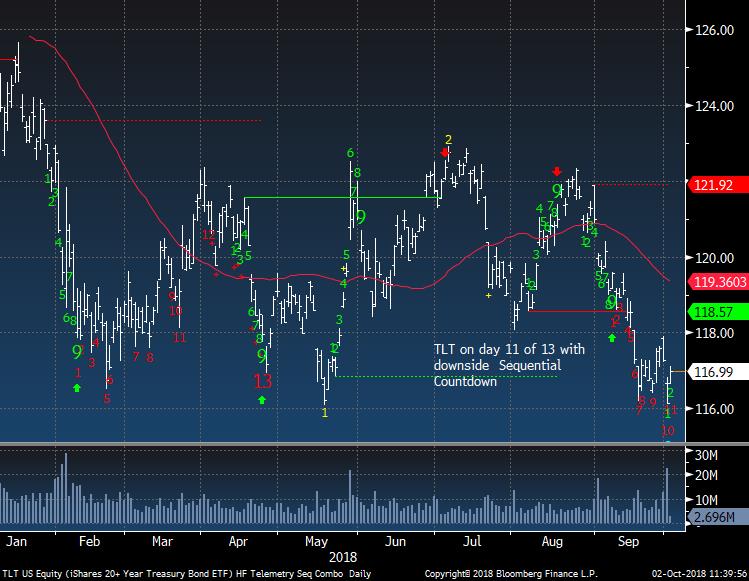
TLT nearly at a bottom too
|
|
|
|
|
|
|
DEMARK SCREENS - Daily, Weekly, Monthly Upside/Downside Exhaustion Signals
|
|
|
Daily/Weekly DeMark upside/downside exhaustion signals (Sequential) updated daily, Weekly signals on Monday's and monthly on the first day of the new month. Price flips occur when a stock closes higher/lower than four previous closes and increases conviction of a price turn.
The upside 13's are sell signals and downside 13's are buy signals. Price flip's are confirmation signals that increases potential for a price trend change. For example, if you are long a stock and there is an upside 13, you will want to take cautious action by selling down or out of a position. If initiating a short sale with the upside 13's, we tend to start with a 1/2 size and add with the downside price flip. The opposite is true for when there are downside 13's. Take a 1/2 size position
and add with the upside price flip. The DeMark Indicators are designed to assist the user with buying into weakness and selling into strength to anticipate trend exhaustion. Selling into a rally and buying into a decline often afford the opportunity to exit a trade without too serious a loss if wrong.
S&P 500 Universe:
DAILY UPSIDE 13: CNC, CVS, ESRX, HES, MA, NCLH, PKI, PLD
DAILY DOWNSIDE 13: FITB, MAS
DAILY UPSIDE WITH PRICE FLIP REVERSAL DOWN: FISV
DAILY DOWNSIDE WITH PRICE FLIP REVERSAL UP: NONE
Updated: 10/1/18
WEEKLY UPSIDE 13: BSX, HOLX, NKE, TDG
WEEKLY DOWNSIDE 13: NONE
Updated: 10/1/18
MONTHLY UPSIDE 13: ADSK, ALL, CCI, CME, DE, DLR, DTE, ETN, GLW, HPQ, INTU, PH, TPR, TXT, UPS, XLNX
MONTHLY DOWNSIDE 13: NONE
Euro Stoxx 600 Universe:
DAILY UPSIDE 13: CRDA LN
DAILY DOWNSIDE 13: BPSO IM, PNL NA, TEL NO
DAILY UPSIDE WITH PRICE FLIP REVERSAL DOWN: TOP DC
DAILY DOWNSIDE WITH PRICE FLIP REVERSAL UP: ASSAB SS, RHM GR, VIE FP
Updated: 10/1/18
WEEKLY UPSIDE 13: HELN SW, SKY LN
WEEKLY DOWNSIDE 13: FNTN GR
Updated: 10/1/18
MONTHLY UPSIDE 13: BNZL LN, EXPN LN, FPE3 GR, SBMO NA, SECUB SS, SWEDA SS
MONTHLY DOWNSIDE 13: BAYN GR, HMB SS, TEF SM
|
|
|
Unsubscribe me from Hedge Fund Telemetry
Hedge Fund Telemetry LLC, P.O. Box 4675, Greenwich, CT 06861, United States
CONFIDENTIALITY NOTE and DISCLAIMER: This message is for the named person's use only. It may contain confidential, proprietary or legally privileged material. No confidentiality or privilege is waived by any accidental or unintentional transmission. If you receive this message in error, please immediately delete it and all copies of it from your system, destroy any hard copies and notify the sender. You must not, directly or indirectly, use, disclose,
distribute, print or copy any part of this message if you are not the intended recipient. Hedge Fund Telemetry LLC. cannot guarantee the confidentiality of the material transmitted; therefore, information of a sensitive or confidential nature should not be transmitted. There is risk in trading markets. Hedge Fund Telemetry LLC reports are based on information gathered from various sources and believed to be reliable, but are not guaranteed as to accuracy and completeness. The information is subject to change without notice and Hedge Fund Telemetry LLC has no obligation to provide any updates or changes. Hedge Fund Telemetry LLC is providing this data for informational and educational purposes and does not believe that it is sufficient to base an investment decision on. This information should not be regarded as a solicitation or recommendation of any particular security or to engage in any trading strategy. One should always check with your licensed financial
advisor to determine suitability of any investments.
|
|
|
|
|