Share

If you are having difficulty seeing this email, you can view in your browser or click here to print.

04/29/2024
Thomas Thornton
info@hedgefundtelemetry.com

Don't Stop Believin'

With the recent down move I've had a lot people ask me when to buy and those that are setup short are quite concerned about a face ripper bounce.  I've also had people outright tell me to buy too.  This isn't usually what I hear when there is a durable bottom.  People still believe in the bull market that is now in the past.  There is real fear on both sides of the market and yesterday's note titled "Tug of war" was my exact point.  I should mention again my own time frame generally is spread out by weeks or months and I size my positions properly to withstand volatility and I employ stops on everything.  I preach this to all and hope people do not make unnecessary mistakes.

If your time frame is shorter term at a hedge fund or prop trading firm then you have to be involved in every bounce attempt.  I understand and I've been there too.  But part of the topping process involves breaking the moral and fortitude of the bullish buy the dip people.  I'll put it another way.  When markets are going up and shorts try and short every dip but just end up covering, their moral and fortitude breaks down and eventually they give up.  (Yes I have personal experience with this feeling)   Every dip seems to bring in buyers and they have hopes that they caught the bottom but that bottom gets taken out and they start to get less enthusiastic about buying those dips and their trigger finger gets faster in risk avoidance mode.  

Below I illustrate with some charts why I do not believe a durable bottom is in place with ANY equity market. Bounces will happen and there could be one at anytime.  But this is not the time to play hero with this week's equity markets steep declines.  Manage your risk on both sides and stay nimble.  For a little Friday laugh may I suggest this "Don't Stop Believin'" with Jimmy Fallon and Will Farrell.  Have a great weekend!

Notable:

  • US Markets - Sentiment not back to the recent lows
  • VIX Index - Upside Countdown in progress
  • Europe Market -  Breaking February lows
  • Nikkei Index - Looks lower
  • S&P Index with RSI DeMark Studies - Daily, Weekly, Monthly Time Frames
  • Bloomberg World Index - Looks lower
  • FANG - Daily, Weekly, Monthly - Exhaustion signals on all three time frames
  • DeMark Screens

US Markets


SPX bullish sentiment is at 25% and about in the middle of the recent range.  The market made a bottom in February at 9%.  I said at the time it was OK to buy the bounce then but sentiment rarely bottoms in a week and it could take weeks. 


SPX with the bearish wave formation looking like wave 3's downside price objective is possible.


SPX with the countdowns visible show it with a downside Countdown on day 6 of 13 and now under the TDST support at 2673.  A bounce to the 20 day at 2695 is where I would likely add to shorts.  I'm already pretty short but do have more firepower and will go very net short If I want.


S&P 100 OEX also has a downside wave formation and is also below it's TDST support at 118.64


OEF with the Countdowns show it on day 5 of 13 with it's downside Countdown


QQQ has held up much better due to FANGS (more on that below) and now has a downside Countdown on day 3 of 13


CNBC Index (Dow Jones) is on day 5 of 13 with it's downside Countdown

 
VIX Index


VIX held the 50 day moving average on the downside and now bounced with an upside Countdown on day 4 of 13.  I don't advocate trading the VIX ETF's for many obvious reasons

 
European Markets


UK FTSE 100 is on day 7 of 13 with it's downside Countdown and breaking the February lows.  How about that upside exhaustion signal in January?  


Italy is at support and on day 9 of 13 with it's downside Countdown.  


SXXP Euro Stoxx 600 also broke February lows and is on day 7 of 13 with it's downside Countdown


DAX gapped hard today and broke the February lows (wave 1) thus locking in the wave 3.  The price objective is 11,210 but wave 3 just needed to make a lower low and it's locked in and the price objective isn't the main issue but the wave count.

 
Nikkei


Nikkei bullish sentiment is at 30% and I expect to go under 10%  


Nikkei with the daily wave pattern needs a little more to break the February lows to lock in the wave 3.  


Nikkei monthly shows the upside exhaustion signals are the recent highs and 3 other times in the past 15 year this has also occurred.  -16%, -60%, -29% and it's only down 12% now


S&P 500 with RSI on Daily, Weekly, Monthly Time Frames


These are SPX charts with the bottom indicator a RSI with DeMark overlay.  The first one is the daily and it shows the bunch of upside exhaustion signals from last year that stalled out but didn't turn lower but that was the market we had and now we have a new market.  On February 9th I was highlighting the green Setup 9 on the Index and I had the the same 9 on the RSI too.  With the bounce the RSI didn't achieve much and now it's headed lower and not oversold


The weekly had some exhaustion on the RSI at 90%!!!  When the down move happened in February it woke up the extended RSI to the downside and I believe there is more to go before it's oversold like February 2016


The monthly RSI also had exhaustion and woke up to the downside.  This too has more downside risk to either the February 2016 levels or 2008/2009 market

 
Bloomberg World Index


Bloomberg World Index also made a lower high bounce and has a wave 3 price objective that would take the index back to September levels.  


Bloomberg World Index is on day 6 of 13 with it's downside Countdown

 
FANG Update
 
FANG + index has been incredibly strong and I shouldn't be so surprised.  It's still far away from the 50 day.  
 

FANG on a weekly time frame had a recent upside exhaustion and keep in mind it's up 165% from the February 2016 low.  Hey Jeremy Grantham still believin in a meltup?  


FANG monthly had an upside exhaustion in February.  

 
DEMARK SCREENS - Daily, Weekly, Monthly Upside/Downside Exhaustion Signals

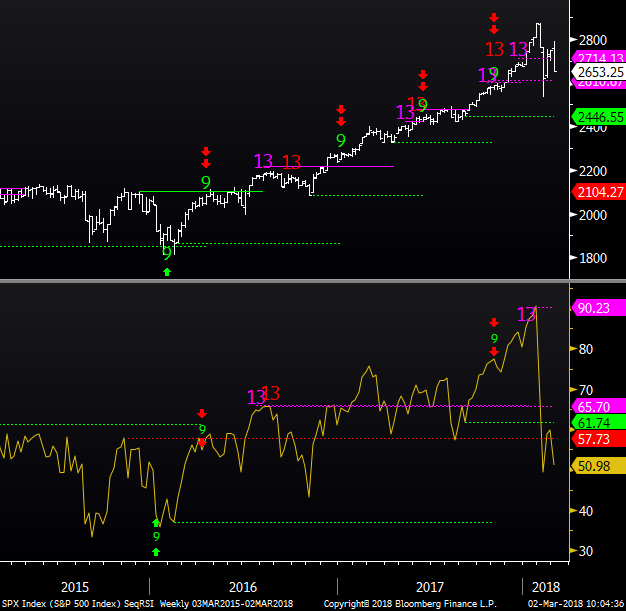
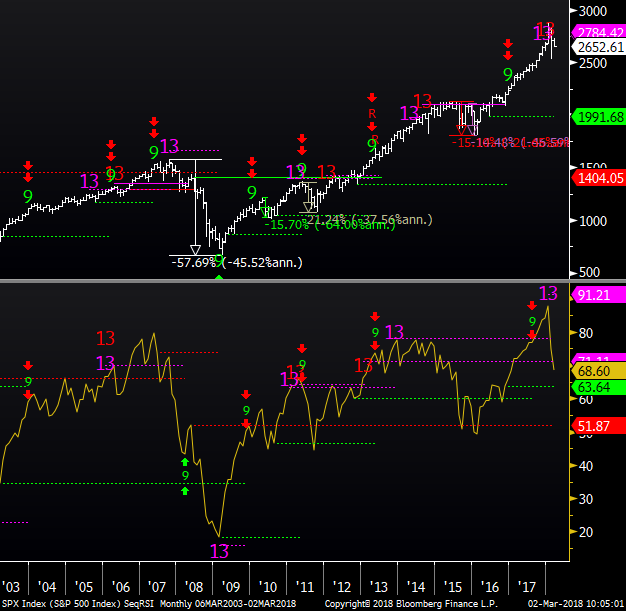
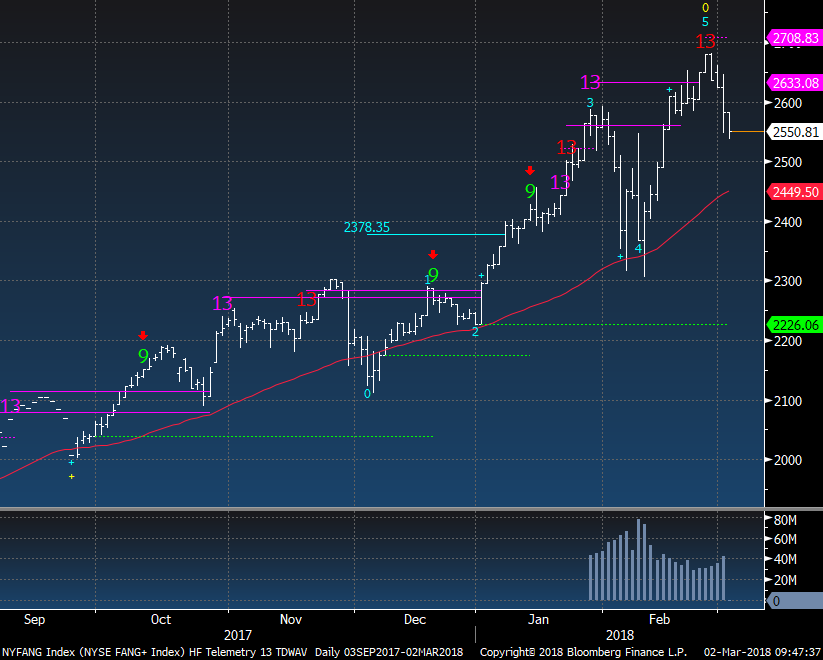
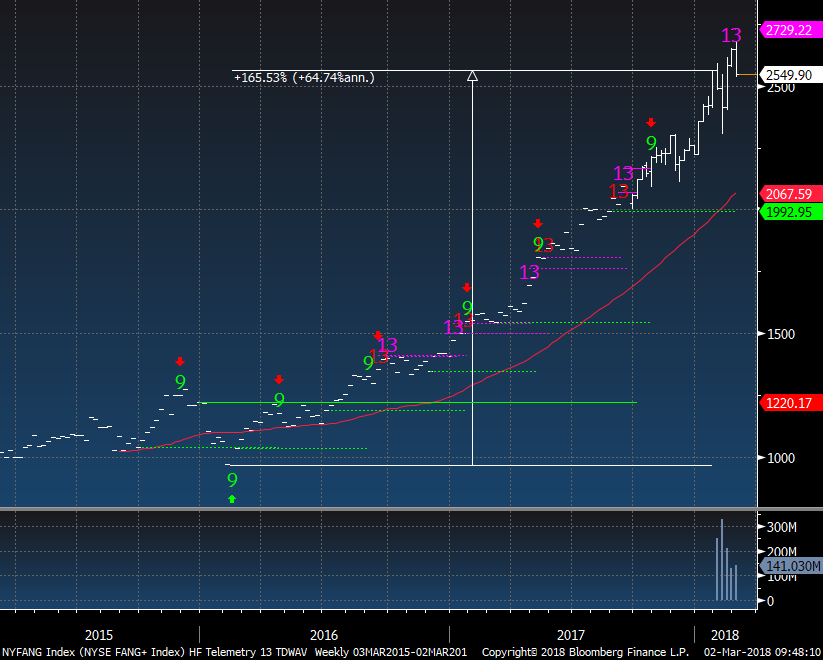
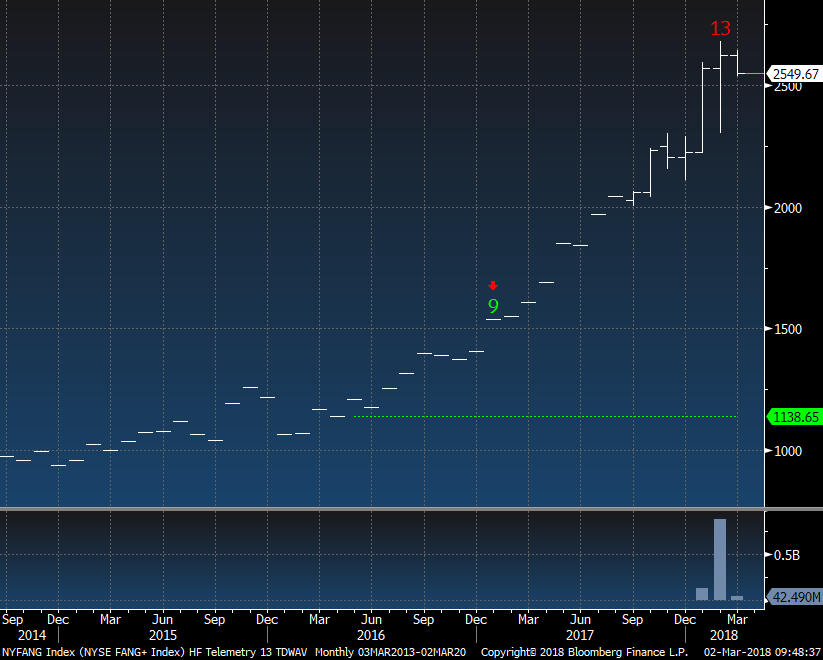
Daily/Weekly DeMark upside/downside exhaustion signals (Sequential) Weekly updated on Monday's.  Price flips occur when a stock closes higher/lower than four previous closes.    

S&P 1500 Universe:

DAILY UPSIDE 13:   NONE
DAILY DOWNSIDE 13:   CPT, DAKT, ESV, FII, GXP, JJSF, KBH, UPS, WEC

DAILY UPSIDE WITH PRICE FLIP REVERSAL DOWN:     ABMD, BA, BAC, BR, CHE, CSCO, CTSH, DGX, ETFC, EW, FFIV, FTNT, GD, HAYN, IDXX, JBLU, JPM, MNTA, MSFT, NDAQ, NTRS, RHT, RTN, SHLM, V
DAILY DOWNSIDE WITH PRICE FLIP REVERSAL UP:    FRT, UPS

Updated: 2/26/18
WEEKLY UPSIDE 13:   ACN, ALLE, ATI, EBIX, EPAY, MSI, PTC, RS,
WEEKLY DOWNSIDE 13:   DVN, SLCA, SPTN

Updated: 2/1/1
MONTHLY UPSIDE 13:     CHD, CLGX, CLX, CNMD, DVA, FICO, IDCC, MSCI, ORLY, PAYX, TFX, VMC, XYL
MONTHLY DOWNSIDE 13:    GPOR

Euro Stoxx 600 Universe:

DAILY UPSIDE 13:   NONE
DAILY DOWNSIDE 13: CO FP, MRK GR

DAILY UPSIDE WITH PRICE FLIP REVERSAL DOWN:    AHT LN, BPSO IM, DNB NO, INVP LN
DAILY DOWNSIDE WITH PRICE FLIP REVERSAL UP:   NONE

Updated: 2/26/18
WEEKLY UPSIDE 13:    GLEN LN, IGG LN
WEEKLY DOWNSIDE 13:   TATE LN

Updated: 2/1/18
MONTHLY UPSIDE 13:    COFB BB, GAS SM, GKN LN, ING FP, KINVB SS, OML LN, VIS SM
MONTHLY DOWNSIDE 13:   NONE

Unsubscribe me from Hedge Fund Telemetry

Hedge Fund Telemetry LLC, P.O. Box 4675, Greenwich, CT 06861, United States

CONFIDENTIALITY NOTE and DISCLAIMER: This message is for the named person's use only. It may contain confidential, proprietary or legally privileged material. No confidentiality or privilege is waived by any accidental or unintentional transmission. If you receive this message in error, please immediately delete it and all copies of it from your system, destroy any hard copies and notify the sender. You must not, directly or indirectly, use, disclose, distribute, print or copy any part of this message if you are not the intended recipient. Hedge Fund Telemetry LLC. cannot guarantee the confidentiality of the material transmitted; therefore, information of a sensitive or confidential nature should not be transmitted. There is risk in trading markets.  Hedge Fund Telemetry LLC reports are based on information gathered from various sources and believed to be reliable, but are not guaranteed as to accuracy and completeness.  The information is subject to change without notice and Hedge Fund Telemetry LLC has no obligation to provide any updates or changes. Hedge Fund Telemetry LLC is providing this data for informational and educational purposes and does not believe that it is sufficient to base an investment decision on. This information should not be regarded as a solicitation or recommendation of any particular security or to engage in any trading strategy. One should always check with your licensed financial advisor to determine suitability of any investments.


Email Marketing by ActiveCampaign