If you are having difficulty seeing this email, you can view in your browser or click here to
print.
|
|
|
|
|
04/30/2024
Thomas Thornton
info@hedgefundtelemetry.com
|
|
|
Sellers remain
lower after hanging on in February
|
|
|
The WSJ today had a good and very telling story about individual investors who held on through the recent correction. Most of them were concerned but felt that nobody could time the market. One of the reasons they didn't want to sell is that they missed the up moves that followed the down moves! Obviously, I believe we can time the market. I have some quotes below that tells me these people have a level where they will sell and that's lower. Sometimes just
listening to what people are saying and doing is the best way of timing the market.
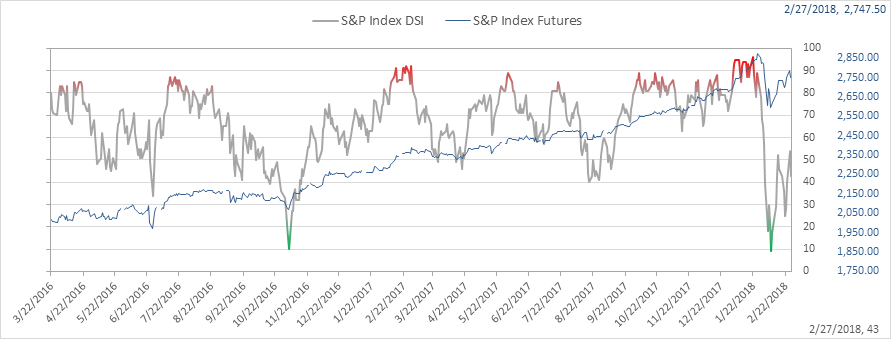
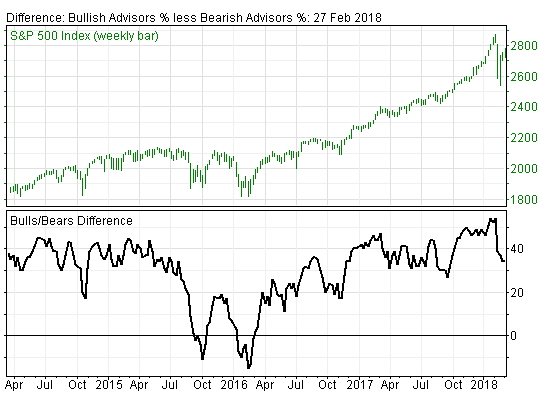
Sentiment has been an incredibly valuable tool in the past two months, as bullish sentiment made new all time highs (S&P 500 96% bulls, Nasdaq 97% bulls - raise cash was the call) and then broke down quickly moving to a low of 9%. At that time, I felt there was sufficient evidence for a bounce which included many DeMark green Setup 9's and some shorter term RSI levels met. I have had the conviction that a lower high would develop and then a breakdown lower would follow (wave 3 down). Investors Intelligence survey of newsletter writers has seen some of the extreme bullishness worked off moving bulls down from 66% to 48% yet the percentage of bears has only moved up to 14% from 12%. The percentage "expecting a correction" moved up to 37% from a January low of 20% when I made a big point on this that this showed extreme complacency. In the past, the bearish
percentage tends move up from those expecting a correction move to the bear camp.
What all of this means is that sellers remain lower perhaps when they see and hear indexes breaking recent lows they will start to sell aggressively. I suggest watching earlier support using the VWAP levels calculated from the exact low on 2/9 at 3:30pm. SPY 270.75, QQQ 164.25, IWM 151.50, DIA 250.50. Some people will naturally use the SPX 50 day 2736 and then the recent lows at 2700. Housekeeping, out of the 18 stocks screened as short candidates recently, ADBE and BRK/B were stopped out. Having the discipline to size positions right and to stop out keeps you out of harms way.
Notable:
- US Indexes - Bullish sentiment back under 50% and Nasdaq huge divergence
- WSJ story of how investors "Hung On"
- A few random items
- US Dollar Update
- Some leading stocks and sectors - BA upside exhaustion today
- Energy Update
- Bonds
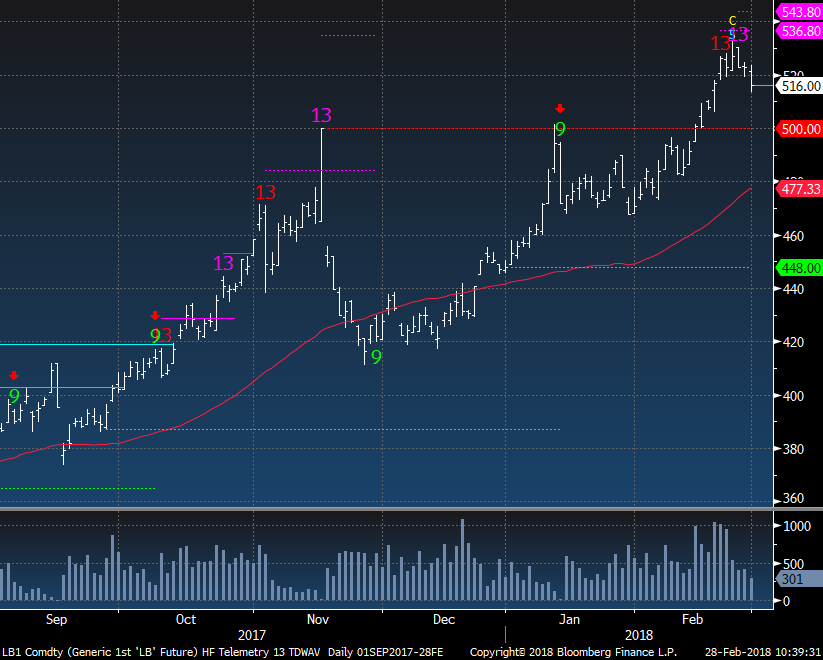
- Lumber Update
- Corn Update
- DeMark Screens
|
|
|
|
|
SPX bullish sentiment is at 43% back under 50%.
|
|
|
|
|
|
|
Investors Intelligence percentage of bulls vs bears has moved down yet a good oversold condition is where there are more bears than bulls. We've got a way to go.
|
|
|
|
|
|
|
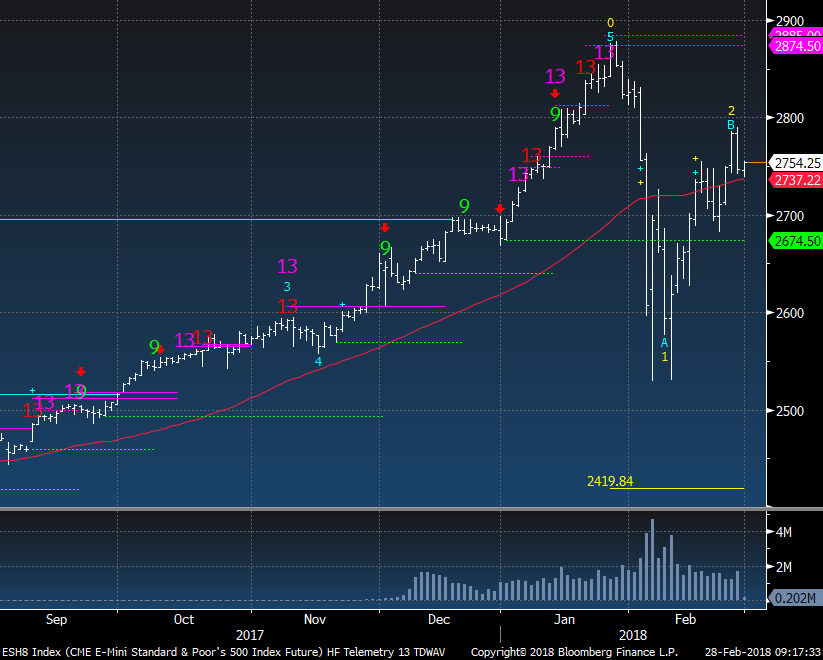
S&P Futures backed off the to nearly the 50 day moving average and it will be important to see if this level is defended today.
|
|
|
|
|
|
|
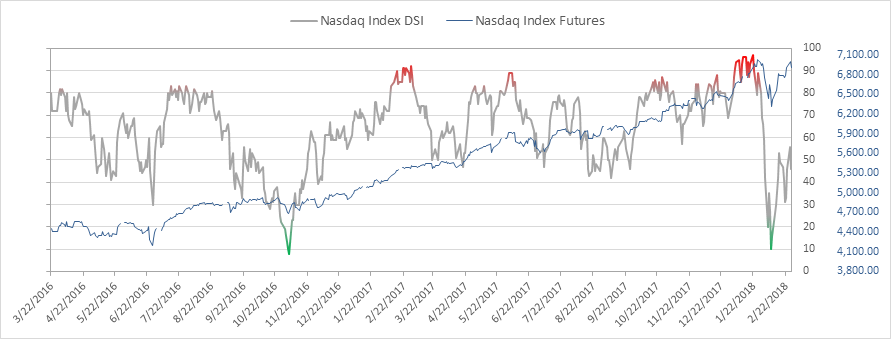
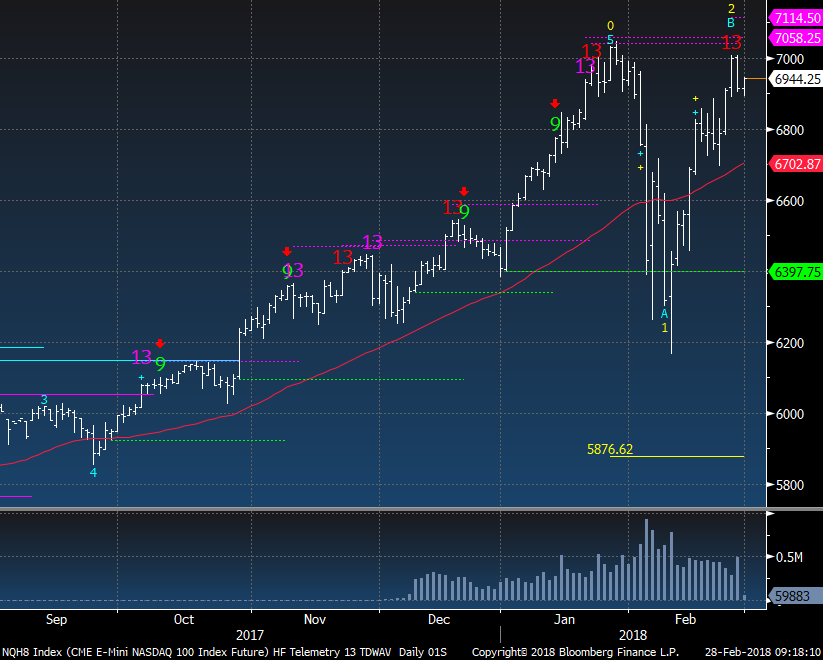
Nasdaq bullish sentiment is at 46% down from 56% the previous day. Considering the index made back 98% of the losses this is a huge divergence as the best it could do is 56%
|
|
|
|
|
|
|
Nasdaq futures have a some room before the 50 day comes into play.
|
|
|
|
|
|
|
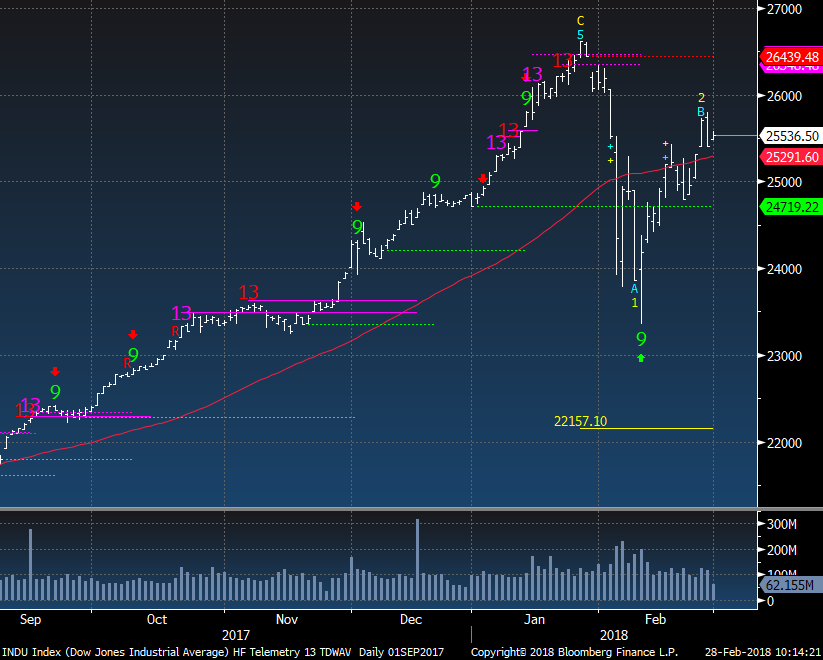
The Dow bounced and now is nearing the 50 day too
|
|
|
|
|
|
|
WSJ story on how investors "Hung On"
|
|
|
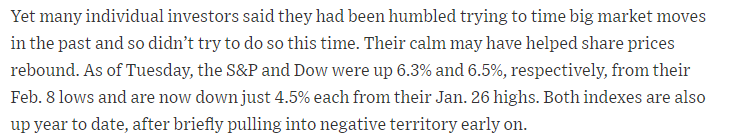
This WSJ story is really telling how investors are thinking after the correction. They gave up trying to time the market. This shows a false sense of confidence stocks will only go up over time.
|
|
|
|
|
They have tried to time big market moves in the past...
|
|
|
|
|
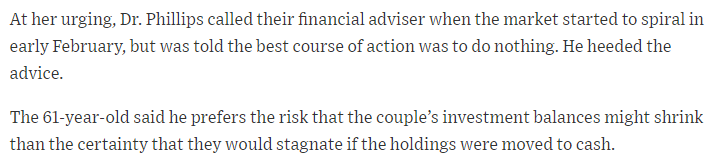
Do nothing was best course of action... perhaps for now. This retired doctor "prefers the risk..balances might shrink... than the certainty that they would stagnate...in cash" Wow that's confidence!
|
|
|
|
|
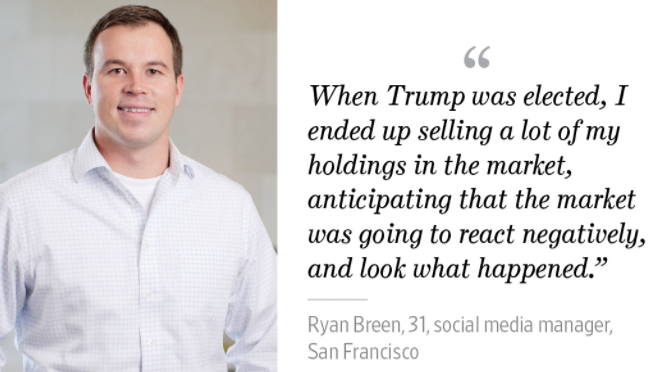
This guy sold when bullish sentiment after the election hit 10% bulls and there was a downside DeMark exhaustion on the Dow... the last downside exhaustion since.
|
|
|
|
|
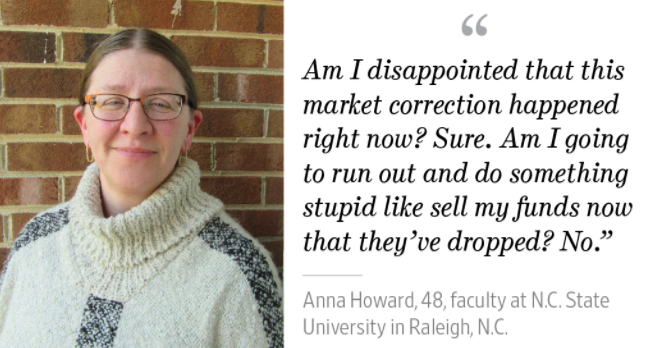
Ok this woman is disappointed and that's real but people have been falsely been told you can't sell when things are down 10%
|
|
|
|
|
Her funds must have been lagging the SPX which I don't fault and that could due to being diversified but she's basically said she'd be unhappy if they go down more.
|
|
|
|
|
|
|
|
|
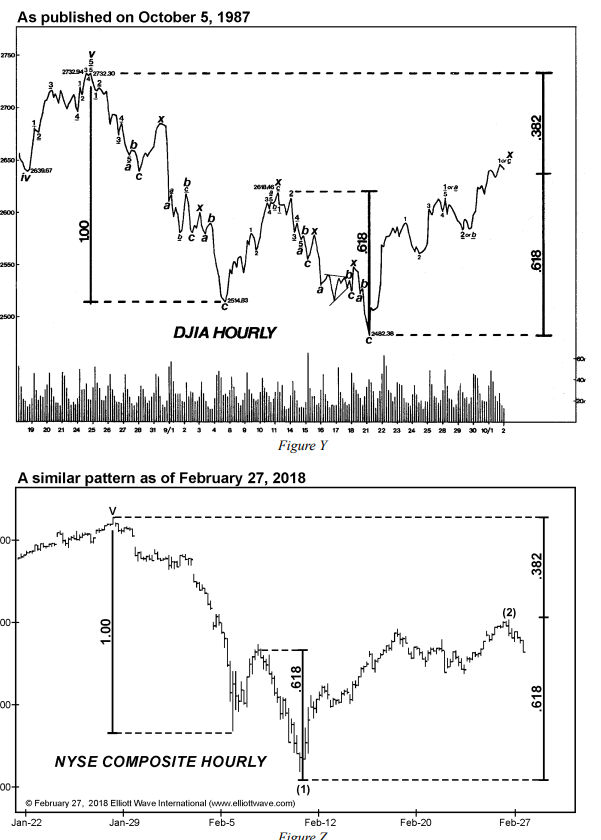
Robert Prechter from Elliott Wave International put this out yesterday comparing the bounce ahead of the October 87 crash and today's bounce. This has been part of my thesis for a lower high bounce followed by a wave 3 down move.
|
|
|
|
|
|
|
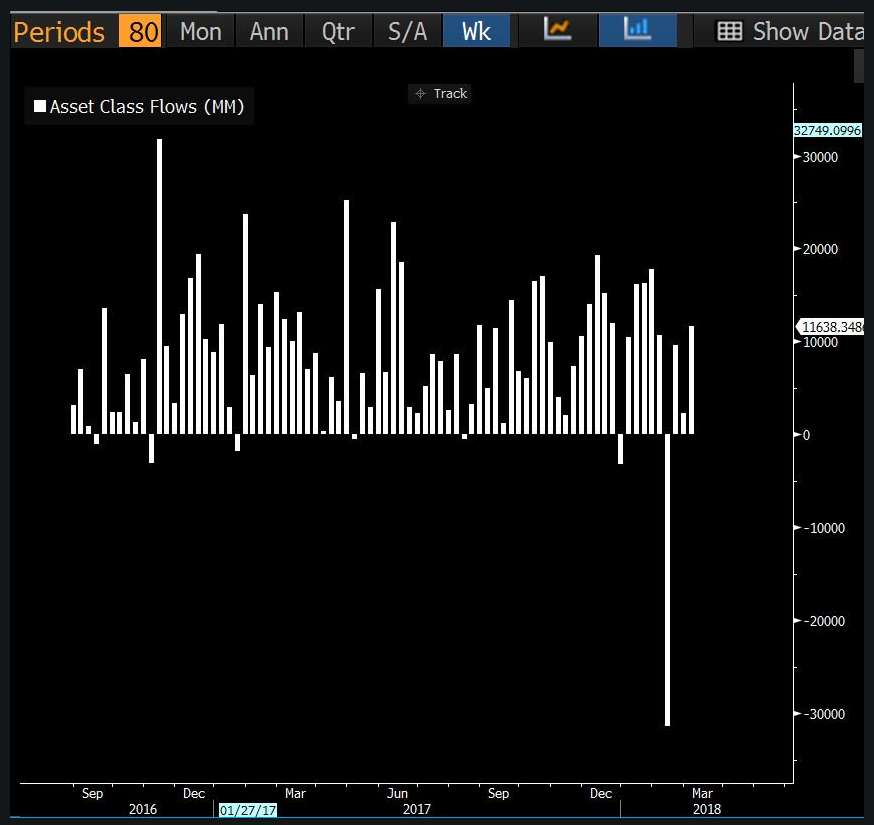
Tell me if you can spot the week of outflows? A lot of inflows have followed but this is important as it tells us that with the proliferation of passive funds and ETF's trigger fingers are quicker that previous periods
|
|
|
|
|
|
|
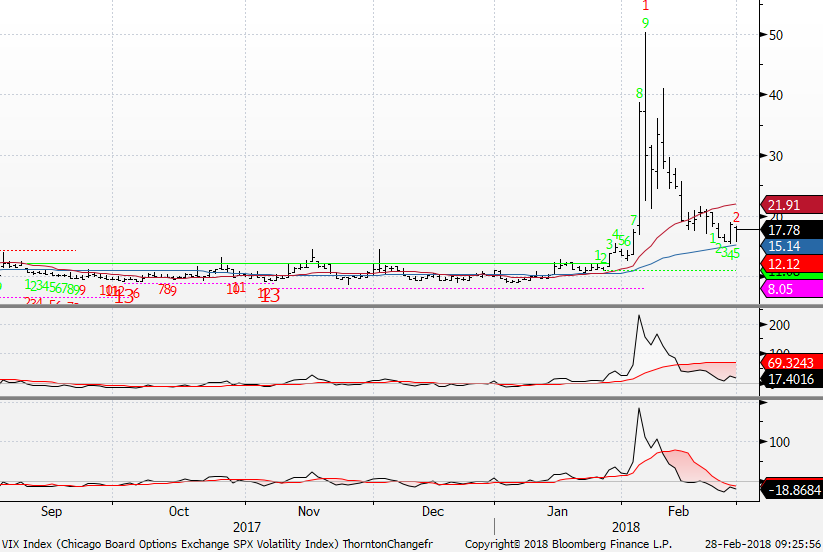
VIX index had a green Setup 9 on the peak day and now with it backing off to the 50 day there is a red 2 of 13 Countdown potentially starting. By the way the downside green Setup count was nullified with this turning positive today. If it breaks back lower today the green Setup will come back.
|
|
|
|
|
|
|
|
|
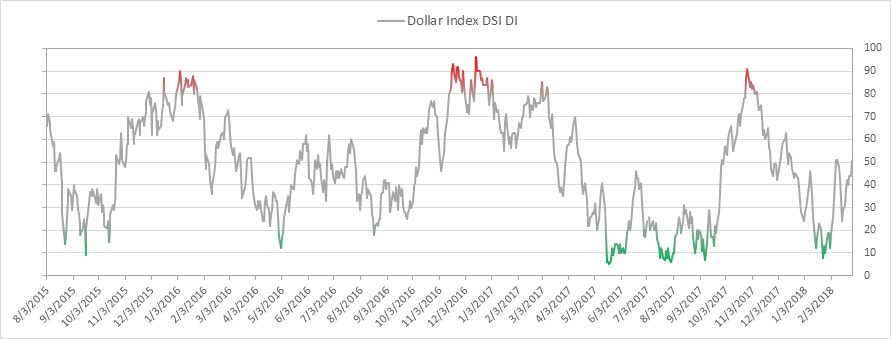
US Dollar bullish sentiment is at 51% matching the recent high and there now is potential for a move higher. Watch your currency crosses
|
|
|
|
|
|
|
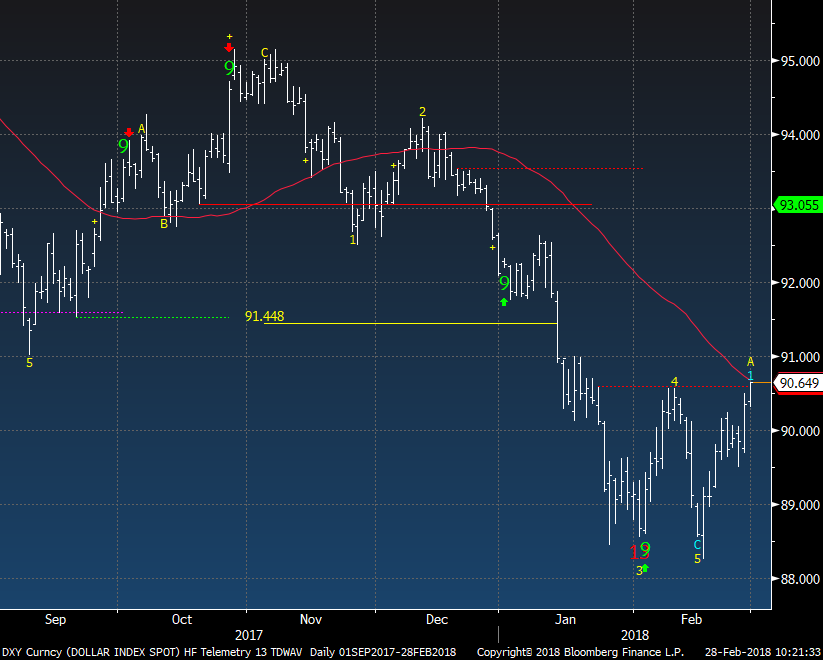
The DXY US Dollar Index is making a month high today and is at the 50 day moving average. There is also a new upside wave count on the first wave. Recall during the first wave - nobody believes in this move. Let me quote Rich Ross technician from ISI who doesn't believe
· DXY is "a Bounce, not a Bottom" and insofar as it weighs on commodities and yields I’m fine with it.
|
|
|
|
|
|
|
Some market leading stocks and indexes
|
|
|
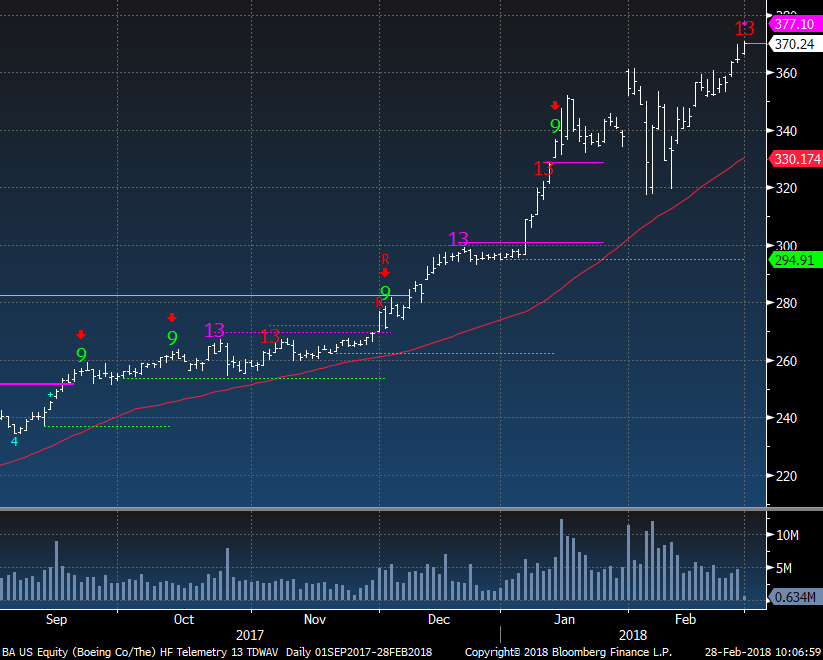
Boeing BA has been flying high and is the largest weight in the Dow attributing 25% in the past 6 months alone to the index. The Dow is price weighted and BA is the largest weight by far. Recent upside exhaustion signals have seen stalling out periods but will this one work a little deeper? We will see in the coming weeks
|
|
|
|
|
|
|
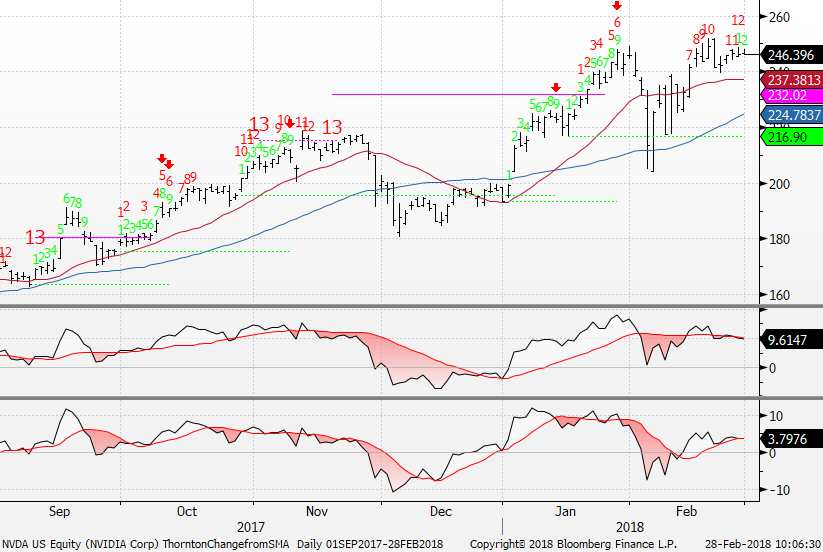
Nvidia NVDA is on day 12 of 13 with it's latest upside Countdown. It needs to move up above the 8th red bar to get the upside exhaustion
|
|
|
|
|
|
|
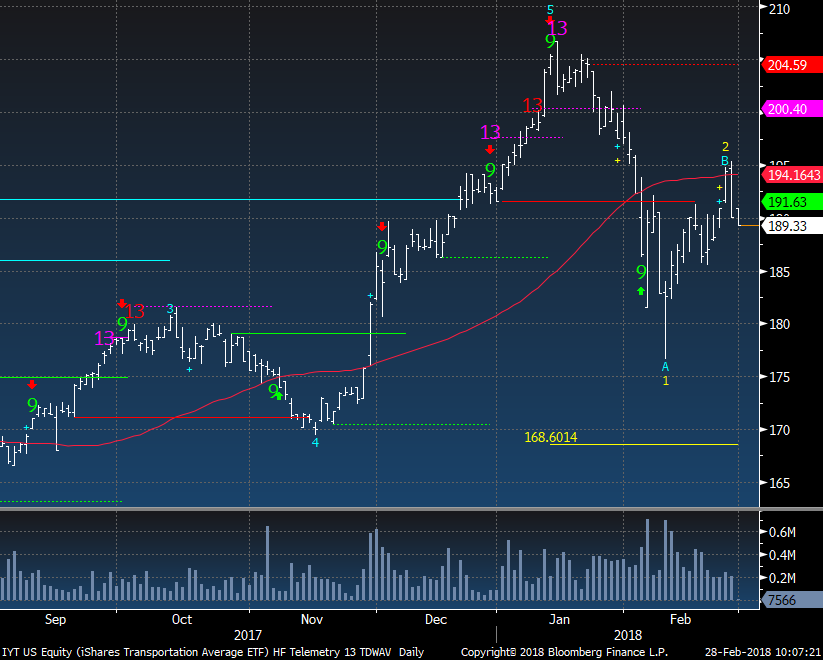
Transports IYT ETF used to be a leading sector from November to January when the tax reform and infrastructure was fresh in everyone's hopes and dreams. Failure at the 50 day moving average isn't what bulls want to see
|
|
|
|
|
|
|
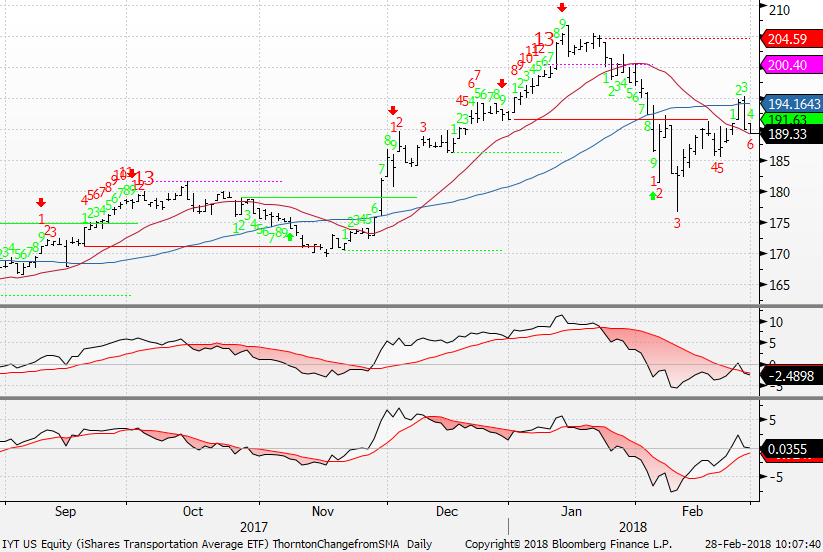
IYT with the Countdowns visible show this on day 6 of 13 with it's downside Countdown.
|
|
|
|
|
|
|
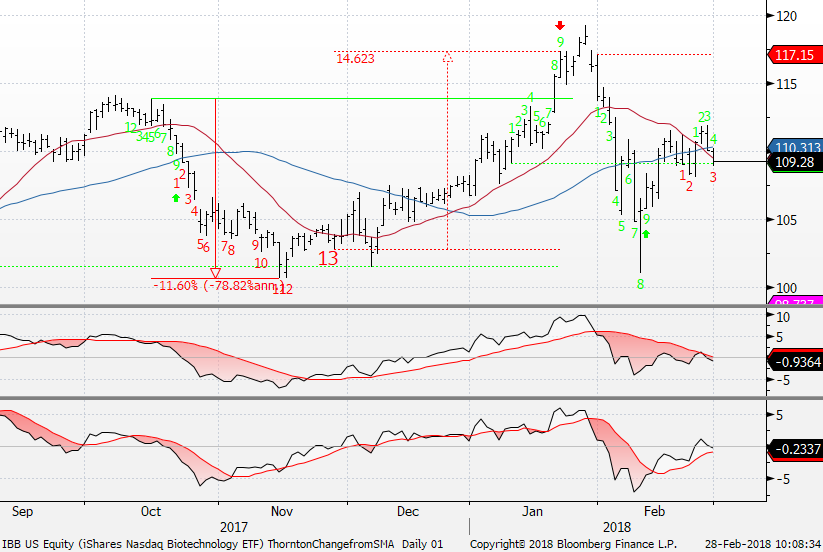
IBB Biotech ETF also is failing at the 50 day and has a downside Countdown on day 3 of 13. This was a recent long idea in Q4. This weighs on the NDX too
|
|
|
|
|
|
|
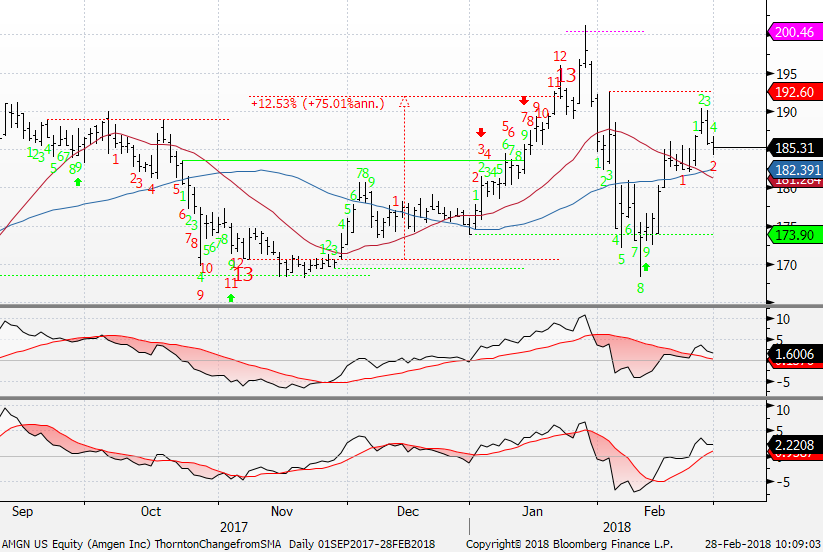
AMGN is on day 2 of 13 with a downside Countdown and also was a long idea closed in January.
|
|
|
|
|
|
|
|
|
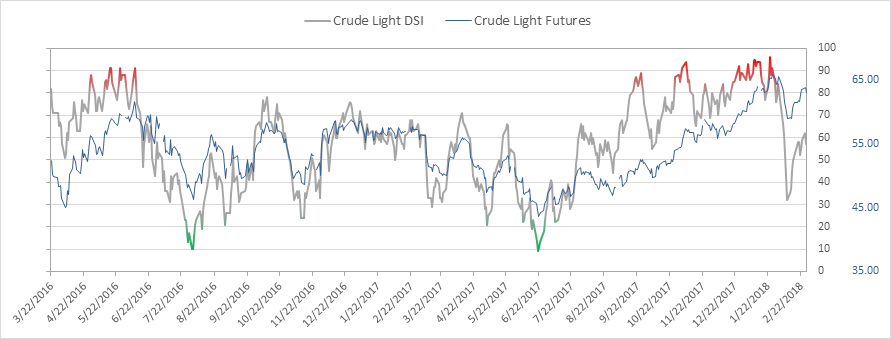
Crude bullish sentiment is at 57%
|
|
|
|
|
|
|
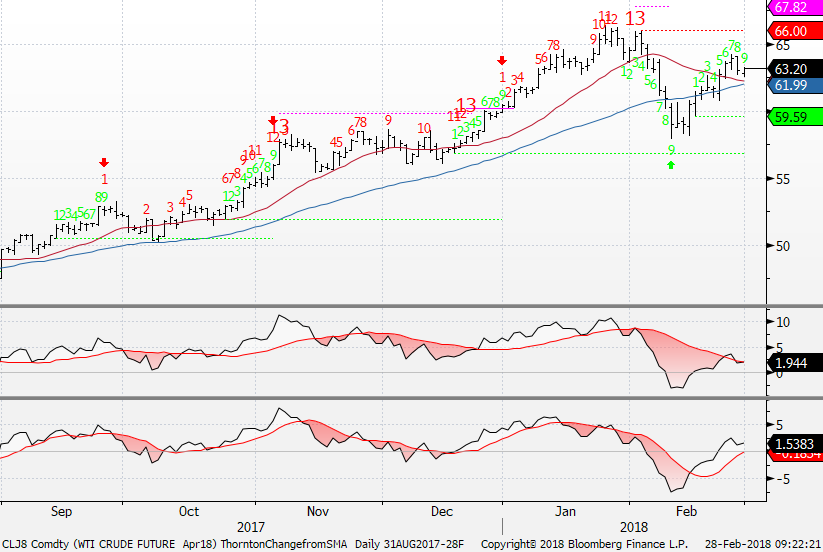
WTI Crude bounced on the downside green Setup 9 and now has the same signal on today so watch for a few down days ahead. This has very good seasonality from now until June so there is some bullish factors to take into consideration.
|
|
|
|
|
|
|
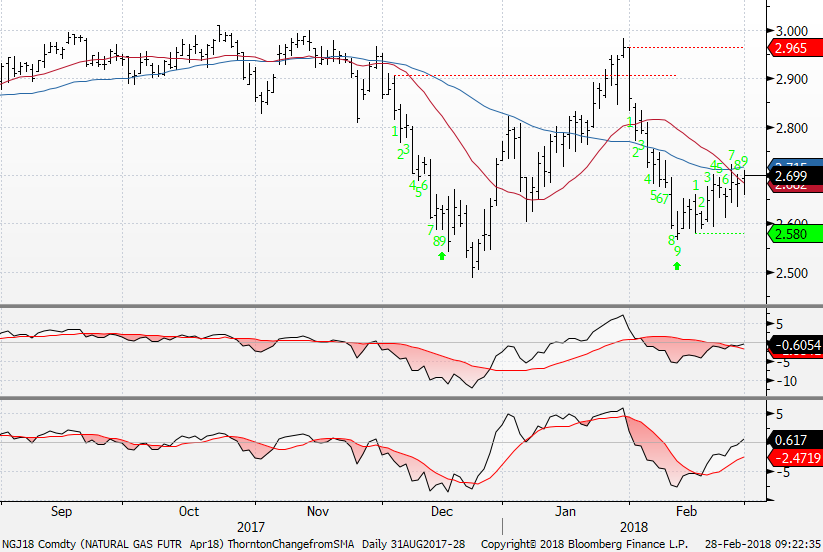
Natural Gas has the same green Setup 9 today
|
|
|
|
|
|
|
|
|
|
|
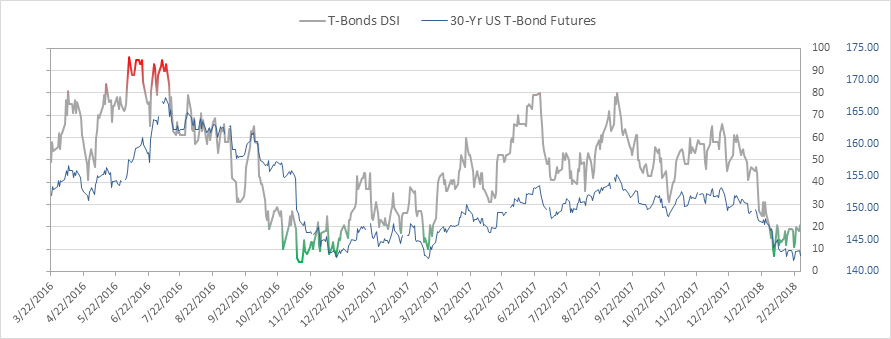
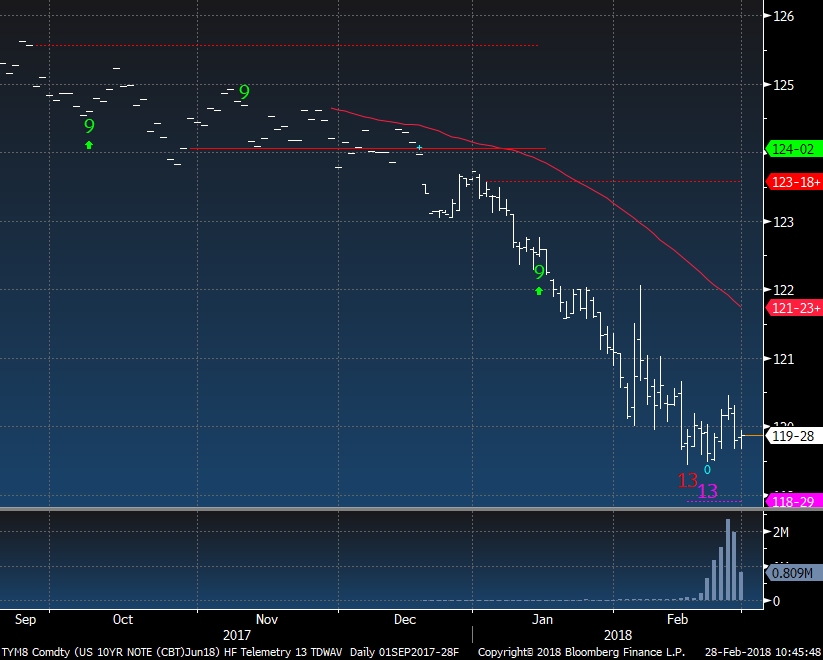
Bond bullish sentiment is at 21%
|
|
|
|
|
|
|
10 year bond futures had some recent daily downside exhaustion thus a bounce in bonds (lower yields) has potential. Let's see this get going first.
|
|
|
|
|
|
|
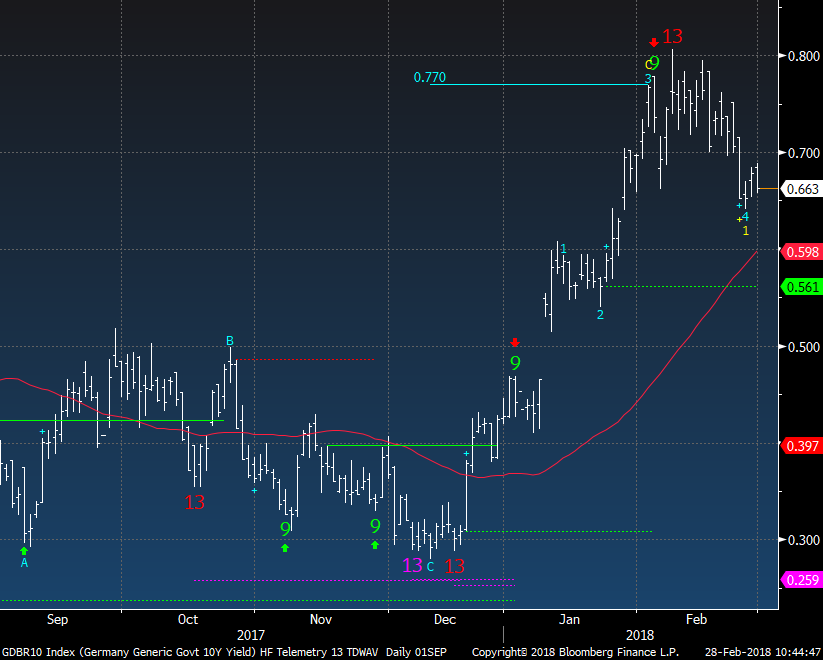
German 10 year yields had a recent upside exhaustion and when I showed this I thought US yields would come in too.. they haven't
|
|
|
|
|
|
|
|
|
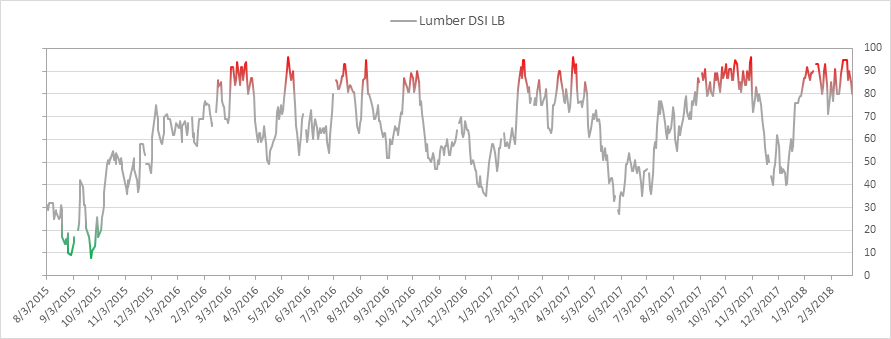
Lumber bullish sentiment is at 80% down in a few days from the very extreme 95% readings last week
|
|
|
|
|
|
|
Lumber Futures had some recent upside exhaustion and now has moved lower.
|
|
|
|
|
|
|
|
|
|
|
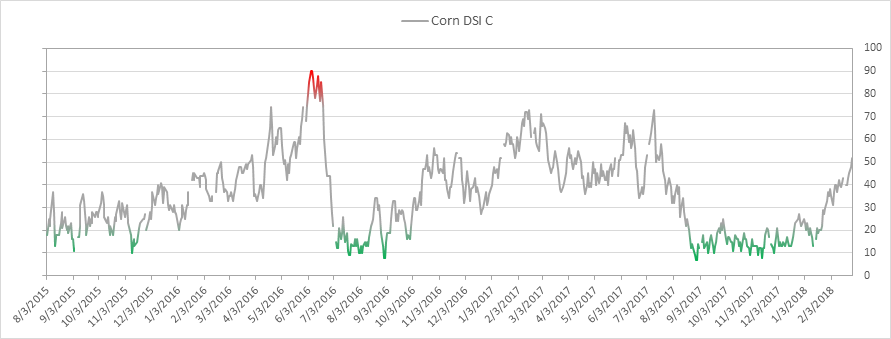
Corn bullish sentiment is 52% and still looks very good as a long
|
|
|
|
|
|
|
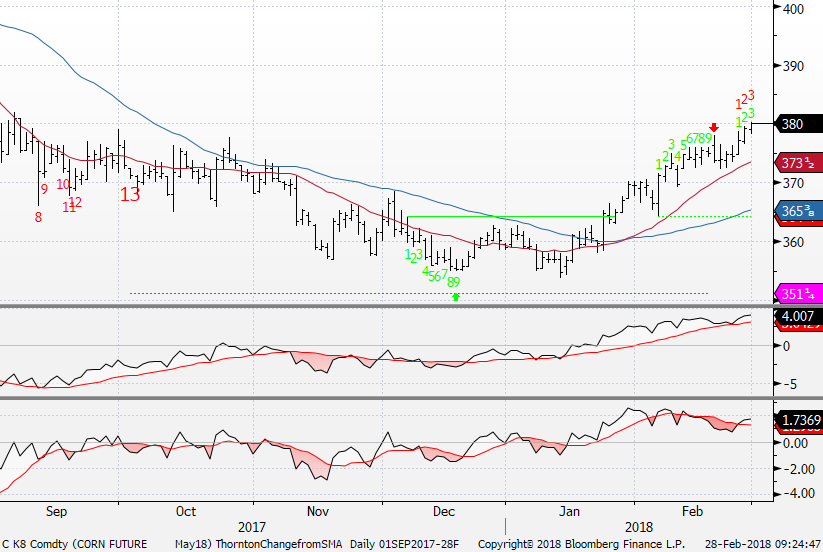
Corn futures are breaking out. I like breakouts when there is a low red Countdown like this on day 3 of 13.
|
|
|
|
|
DEMARK SCREENS - Daily, Weekly, Monthly Upside/Downside Exhaustion Signals
|
|
|
Daily/Weekly DeMark upside/downside exhaustion signals (Sequential) Weekly updated on Monday's. Price flips occur when a stock closes higher/lower than four previous closes.
S&P 1500 Universe:
DAILY UPSIDE 13: BAC, CVGW, DECK, DGX, ETFC, EW, MNTA, RTN, SJM, STI
DAILY DOWNSIDE 13: IRM, LSI, NWE, OFC
DAILY UPSIDE WITH PRICE FLIP REVERSAL DOWN: AIT, ASTE, CVGW, DECK, DPZ, MOS, STI
DAILY DOWNSIDE WITH PRICE FLIP REVERSAL UP: MAA, UDR
Updated: 2/26/18
WEEKLY UPSIDE 13: ACN, ALLE, ATI, EBIX, EPAY, MSI, PTC, RS,
WEEKLY DOWNSIDE 13: DVN, SLCA, SPTN
Updated: 2/1/1
MONTHLY UPSIDE 13: CHD, CLGX, CLX, CNMD, DVA, FICO, IDCC, MSCI, ORLY, PAYX, TFX, VMC, XYL
MONTHLY DOWNSIDE 13: GPOR
Euro Stoxx 600 Universe:
DAILY UPSIDE 13: AHT LN, ASZA NA, BEZ LN, BPSO IM, TOP DC, ULE LN
DAILY DOWNSIDE 13: RTN LN
DAILY UPSIDE WITH PRICE FLIP REVERSAL DOWN: NONE
DAILY DOWNSIDE WITH PRICE FLIP REVERSAL UP: NONE
Updated: 2/26/18
WEEKLY UPSIDE 13: GLEN LN, IGG LN
WEEKLY DOWNSIDE 13: TATE LN
Updated: 2/1/18
MONTHLY UPSIDE 13: COFB BB, GAS SM, GKN LN, ING FP, KINVB SS, OML LN, VIS SM
MONTHLY DOWNSIDE 13: NONE
|
|
|
Unsubscribe me from Hedge Fund Telemetry
Hedge Fund Telemetry LLC, P.O. Box 4675, Greenwich, CT 06861, United States
CONFIDENTIALITY NOTE and DISCLAIMER: This message is for the named person's use only. It may contain confidential, proprietary or legally privileged material. No confidentiality or privilege is waived by any accidental or unintentional transmission. If you receive this message in error, please immediately delete it and all copies of it from your system, destroy any hard copies and notify the sender. You must not, directly or indirectly, use, disclose,
distribute, print or copy any part of this message if you are not the intended recipient. Hedge Fund Telemetry LLC. cannot guarantee the confidentiality of the material transmitted; therefore, information of a sensitive or confidential nature should not be transmitted. There is risk in trading markets. Hedge Fund Telemetry LLC reports are based on information gathered from various sources and believed to be reliable, but are not guaranteed as to accuracy and completeness. The information is subject to change without notice and Hedge Fund Telemetry LLC has no obligation to provide any updates or changes. Hedge Fund Telemetry LLC is providing this data for informational and educational purposes and does not believe that it is sufficient to base an investment decision on. This information should not be regarded as a solicitation or recommendation of any particular security or to engage in any trading strategy. One should always check with your licensed financial
advisor to determine suitability of any investments.
|
|
|
|
|