|
|
|
|
|
|
Is "Bond King" Jeff Gundlach reading the CoT data wrong on
the US 10 year?
|
|
|
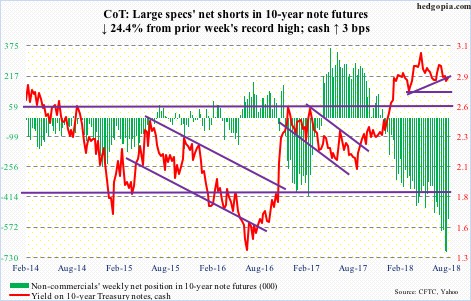
I've been perplexed with the US 10 Year over the recent months as it has been in a very tight range with bullish sentiment elevated and Commitment of Traders data showing large speculators set up very net short. Jeff Gundlach, of Double Line Funds is one of my favorite market people and I have huge respect for him as he is never shy to express an opinion on all types or markets including stocks which most bond people never do. But I think he might be interpreting the CoT data wrong.
Yesterday I had one of my clients who runs a credit hedge fund email me with a explanation of what he sees actually happening. Here's are his thoughts:
We are a credit hedge fund that is intimately familiar with the long
basis trade. Big money…. Fixed income mutual funds are using futures for duration needs and taking the cash (not margined on the long future position) to purchase commercial paper or shorter duration product which in a flat yield curve give them almost as much yield with less duration risk. Meanwhile, the institutional bid for futures make futures look rich to their cash cousins. So large speculators are selling the futures and buying the cash… long the basis to capitalize on the relative richness of the futures. These large speculators are not short… but leveraged and what will affect their being pushed out of the position will be the cost of financing the position…. Not a rally. A tell tale sign of this is that cash repo markets have very few specials indicating no large short base in treasuries at all.
If anyone is friends with Jeff Gundlach, I'd love to get his opinion on this. By the way my client, like Jeff is a Buffalo Bills fan too.
I feel so lucky that I have so many super smart clients from around the world who are experts in various markets. Everyday is a day to learn more.
Today is 9/11 and around the US and especially around the NY area, it is a somber day as we all knew people who died. After 17 years I still get chills when I was in San Francisco attending the Bank of America Tech Conference and early morning communicating with friends in NYC by IM they all logged off suddenly. It was strange. When I saw what was happening, I had friends in NYC call me and IM me asking me to call their parents and wives saying they were headed home. I had a new laptop and remember never opening the Cantor early note from 9/11. It was a
time of utter confusion and disbelief that if you were too young back then, my words can't describe the sadness, anger, and resilience in the US. Here's my favorite Tom Petty song "I won't back down" he did at the 9/11 tribute. It sums up how I felt going forward.
- US Markets - Sentiment off highs but above midpoint majority line. Will the 50 day hold with the NDX?
- Hedge Fund Telemetry Trade Ideas - Added VOD long
- Jeff Gundlach and the
Commitment of Traders data on the US 10 Year
- FAANG and FANG + Index Update
- FDX and UPS Update
- Vodaphone New Long Idea
- Currency Update - Watch the Yuan for continued weakness
- European Market Update - Not a buy yet
- Global Market Update - EEM, Brazil, and India
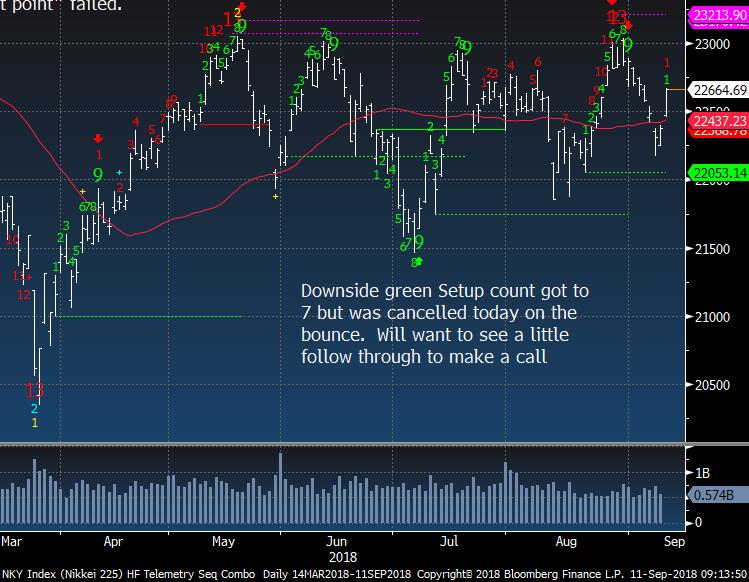
- Asian Market Update - Big bounce in Japan but not in China
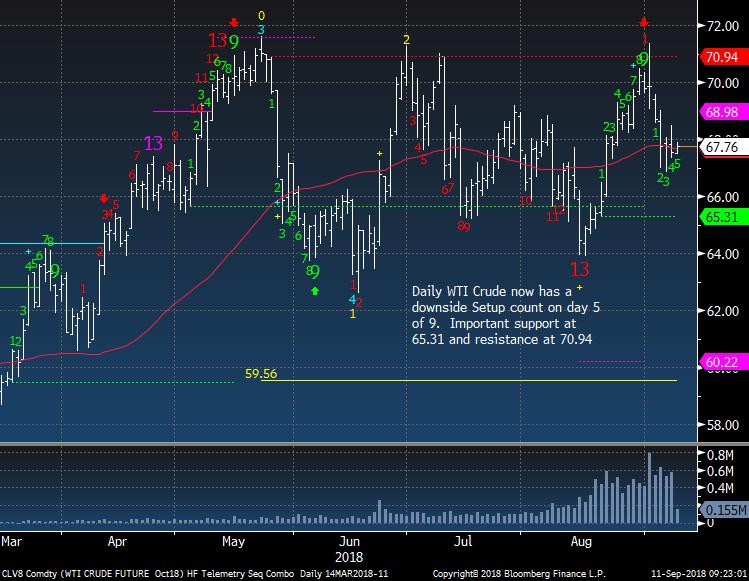
- Crude Update - Still think drift lower
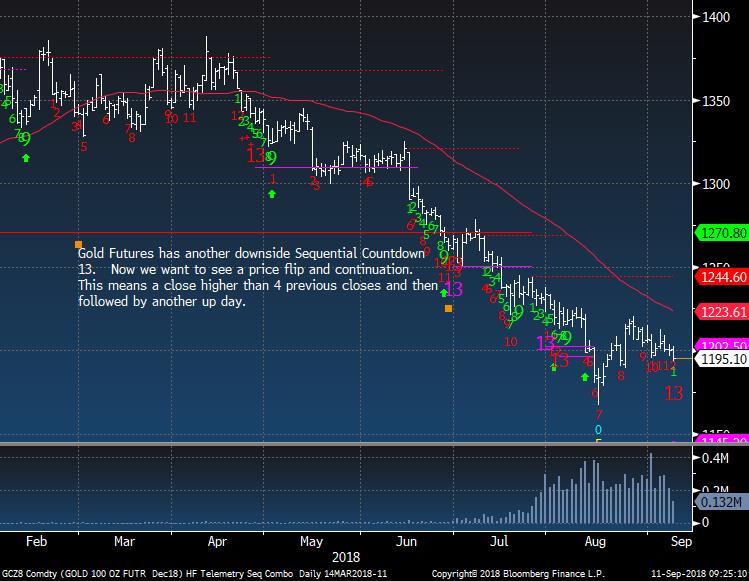
- Gold and Copper Update - Gold Futures daily with another downside exhaustion but weekly not there yet
- DeMark Screens - Daily, Weekly, Monthly upside/downside exhaustion signals within the S&P 1500 and Euro Stoxx 600
|
|
|
|
|
Here's a link to the Hedge Fund Telemetry market sentiment page with 40 charts of sentiment including equities, bonds, currencies, and commodities updated each day.
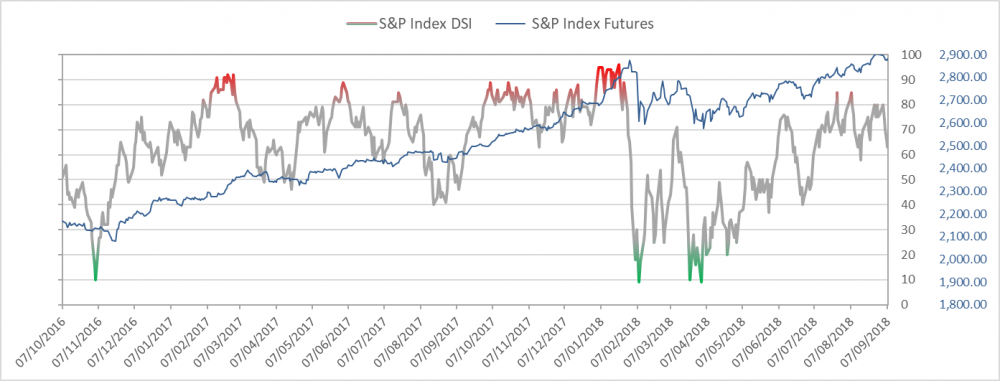
SPX bullish sentiment is at 65%. Next week we will be rolling out new charts. Much improved.
|
|
|
|
|
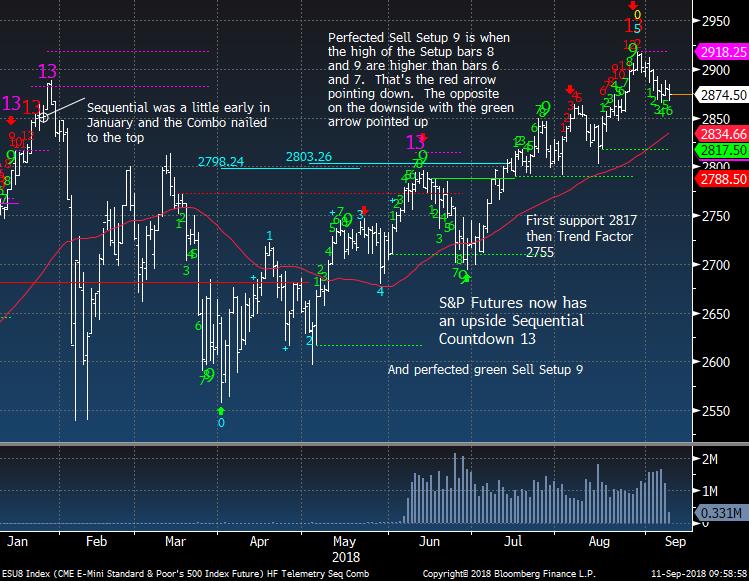
S&P Futures still room on the downside to get to 50 day
|
|
|
|
|
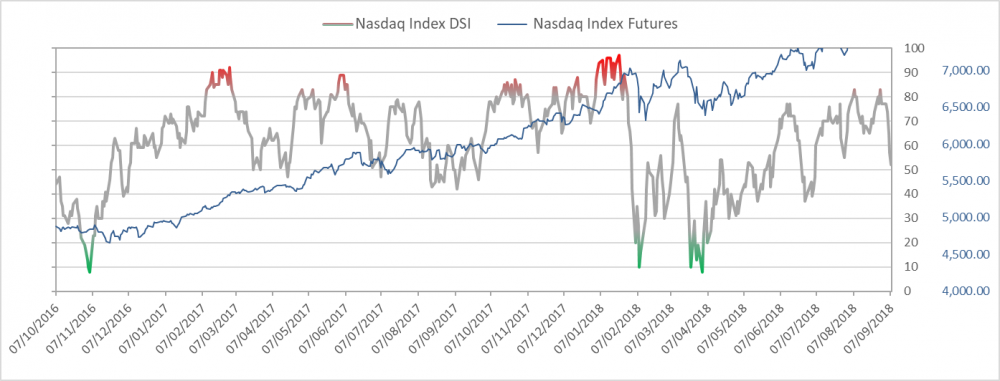
Nasdaq bullish sentiment is at 55% holding the important majority line at 50%
|
|
|
|
|
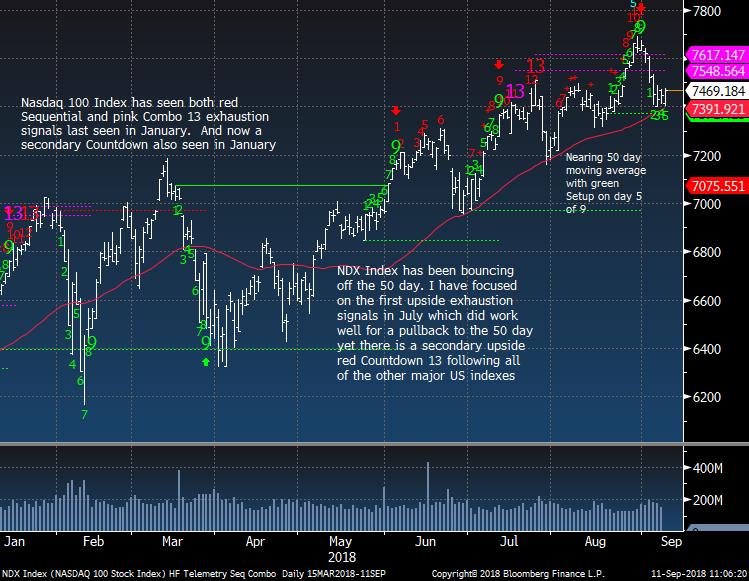
NDX Index holding the 50 day.
|
|
|
|
|
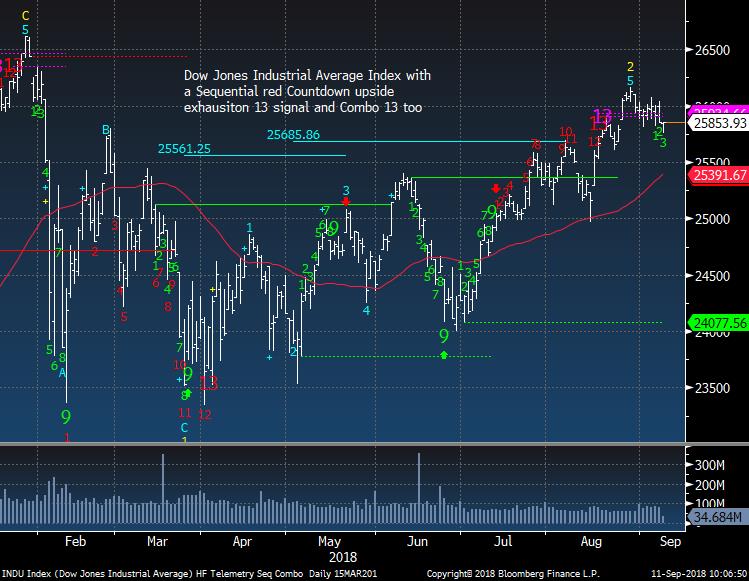
Dow Jones Industrial Average also have turned over a little
|
|
|
|
|
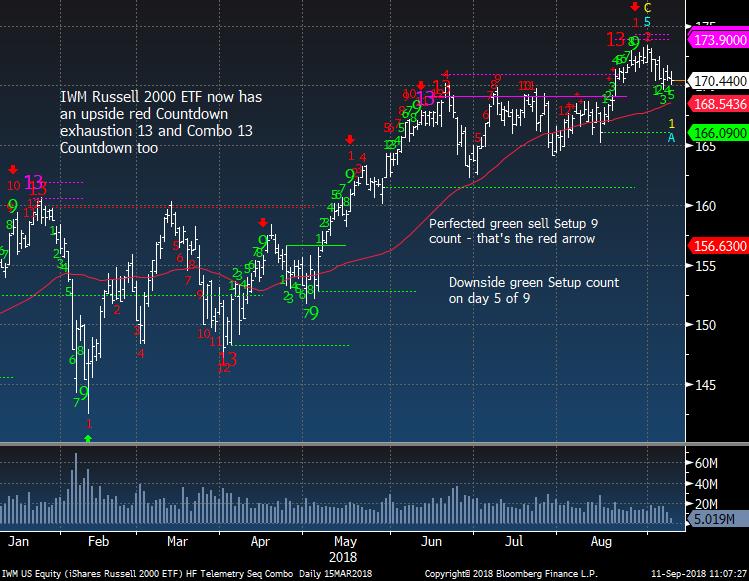
IWM Russell 2000 weaker relatively lately
|
|
|
|
|
|
|
Hedge Fund Telemetry Trade Ideas
|
|
|
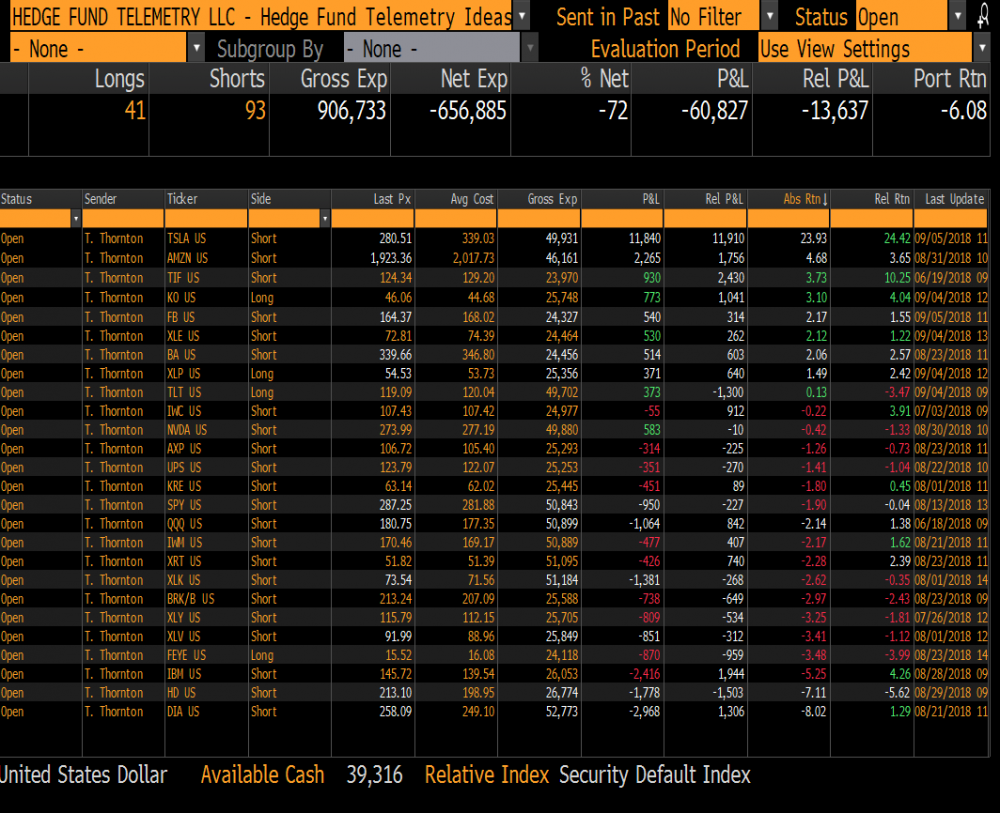
Trade Ideas - Removed TLT long and added VOD 2.5% long
|
|
|
|
|
|
|
Jeff Gundlach and the Commitment of Traders Data for the US 10 Year
|
|
|
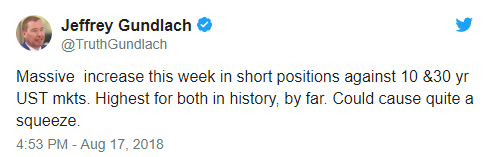
Jeff tweeted this out recently
|
|
|
|
|
Here's how the CoT positioning with large speculators is set up. It looks very short but is it?
|
|
|
|
|
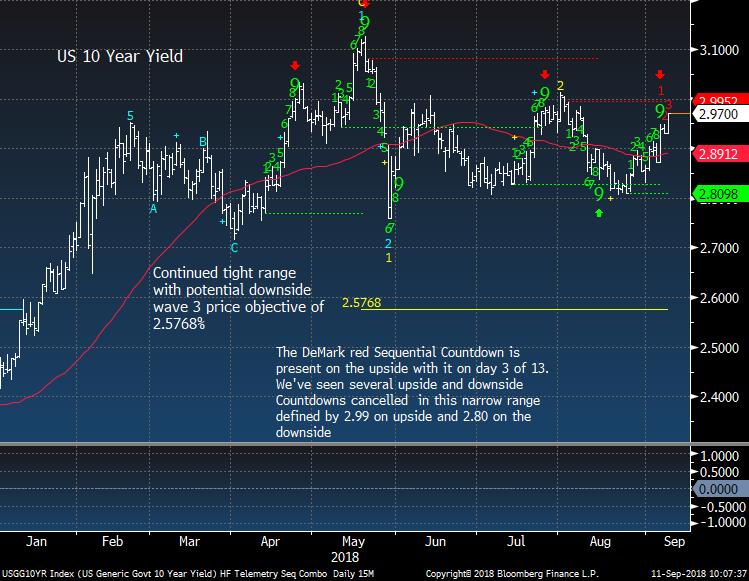
US 10 year held the 2.80 level and now looks like it will breakout with the upside red Sequential Countdown on day 3 of 13
|
|
|
|
|
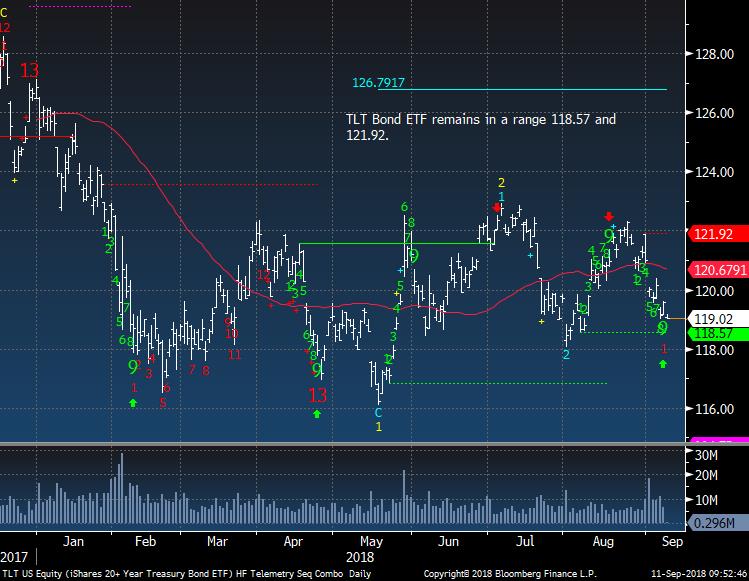
TLT Bond ETF is still in that range but I'm removing my long for now.
|
|
|
|
|
|
|
|
|
|
|
|
|
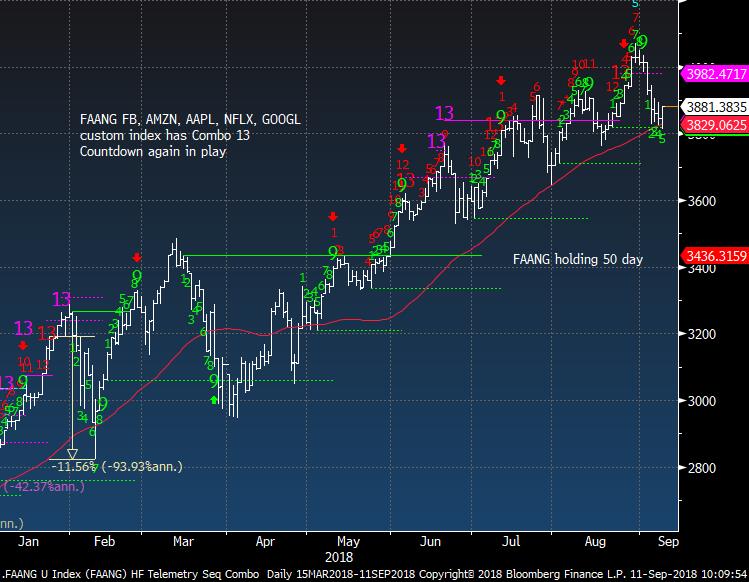
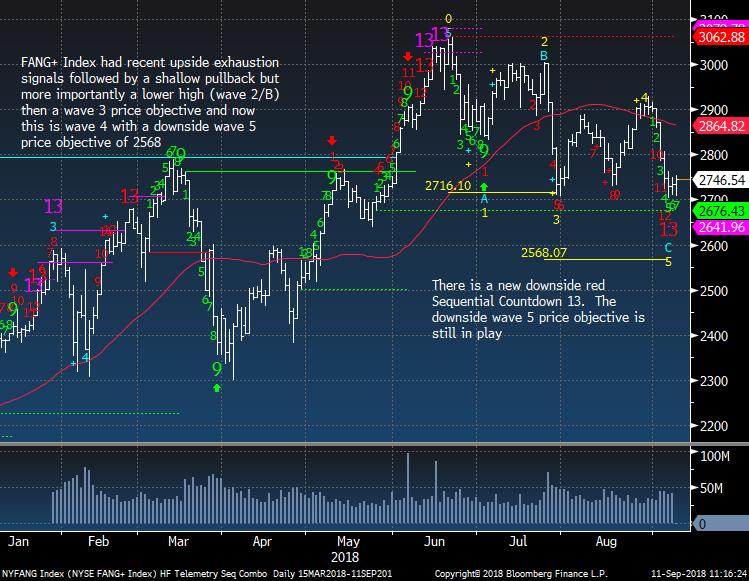
FANG + was well under the 50 day and at support. There is a new red Sequential Countdown
|
|
|
|
|
|
|
|
|
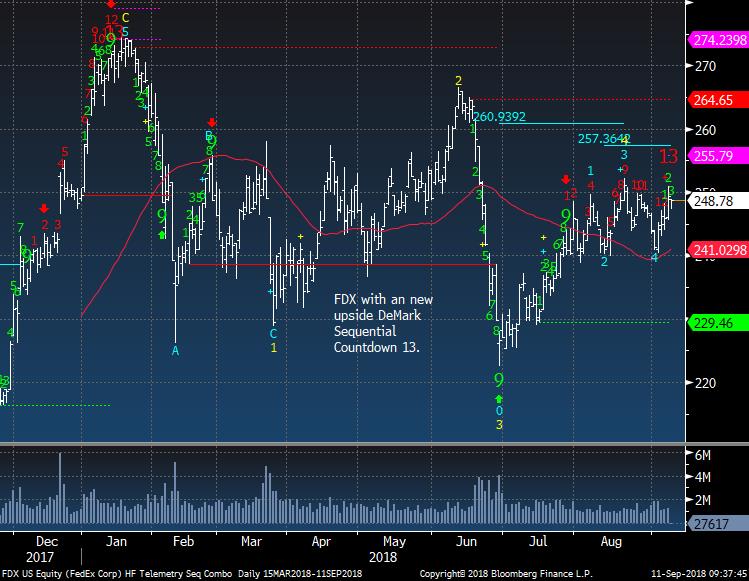
FDX with a new upside red Sequential Countdown 13
|
|
|
|
|
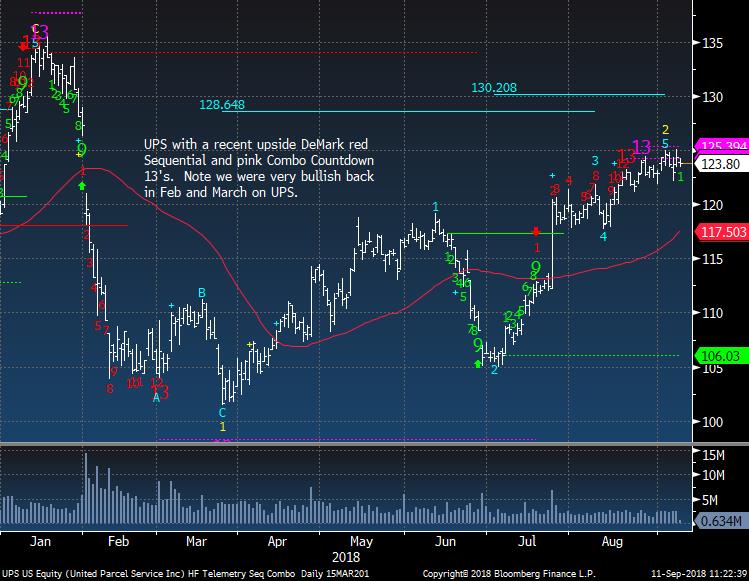
UPS had a recent upside Sequential and Combo upside exhaustion where it has stalled but hasn't been able to turn lower. Perhaps with FDX triggering it will work with the group
|
|
|
|
|
|
|
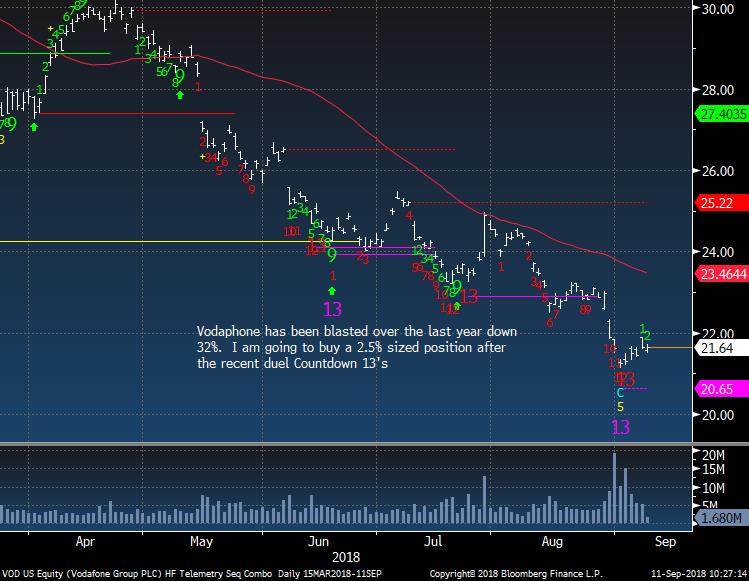
Vodaphone - New Long Idea
|
|
|
Vodaphone is down 32% in the past year and has both Sequential and Combo exhaustion. The yield on this is 8% and I am adding this to the long side with the Trade Ideas Sheet. For those who trade the local shares in London, the Countdowns are similar
|
|
|
|
|
|
|
|
|
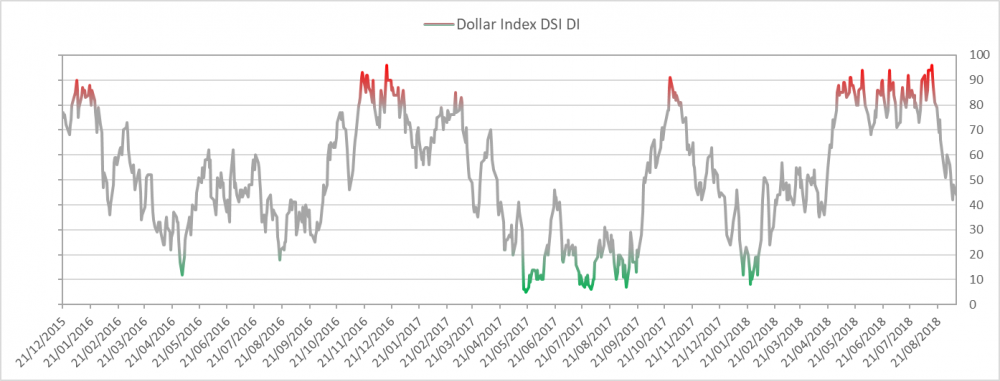
US Dollar bullish sentiment is at 44%
|
|
|
|
|
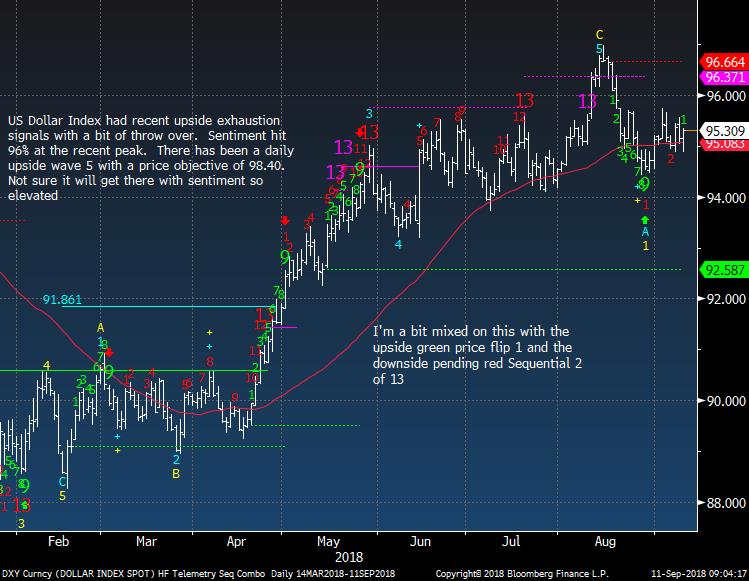
US Dollar Index still in tight range
|
|
|
|
|
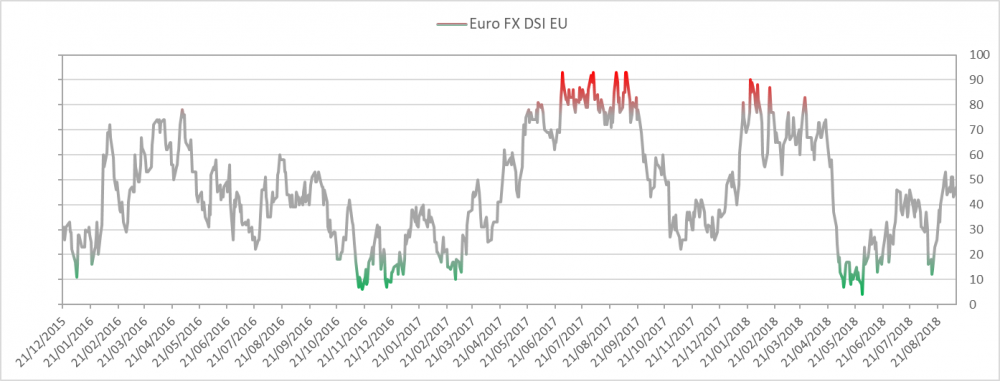
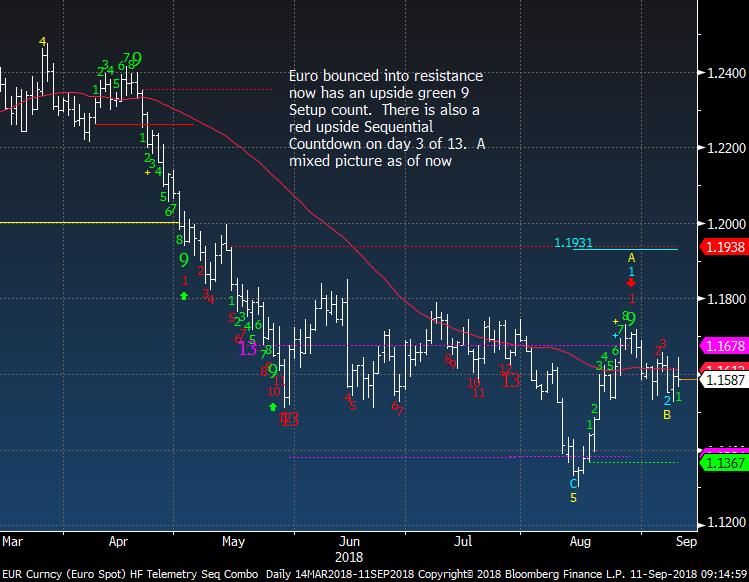
Euro bullish sentiment is at 47% and nearly equal to the USD sentiment
|
|
|
|
|
|
|
|
|
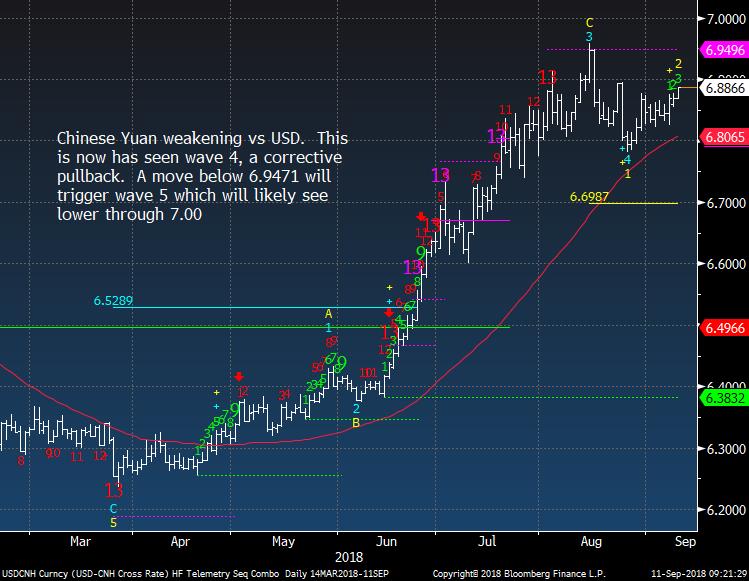
Yuan continues to weaken and I expect it to be below 6.90 this week and soon below 7
|
|
|
|
|
|
|
|
|
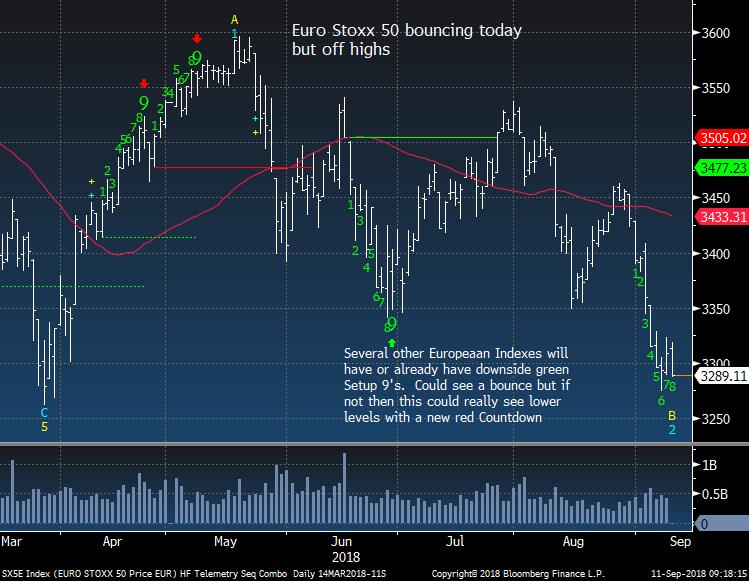
Euro Stoxx 50 still not a buy but could bounce on tomorrow green 9
|
|
|
|
|
|
|
|
|
|
|
|
|
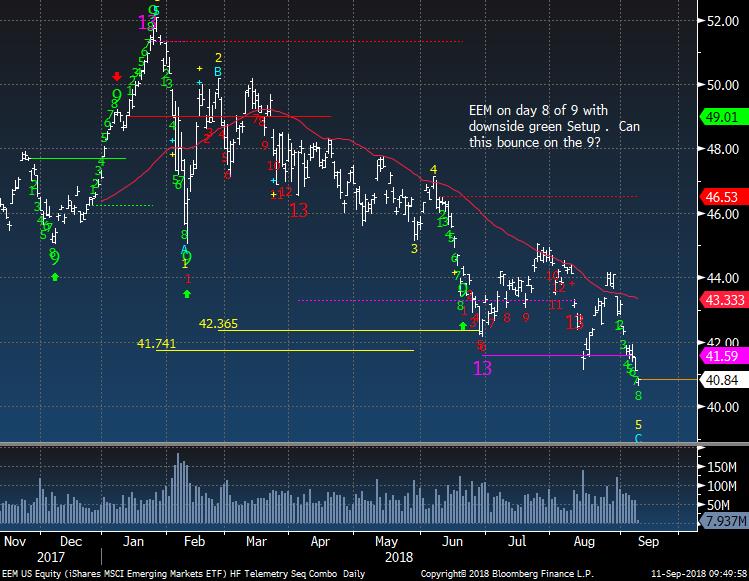
EEM is also expecting a green 9 tomorrow
|
|
|
|
|
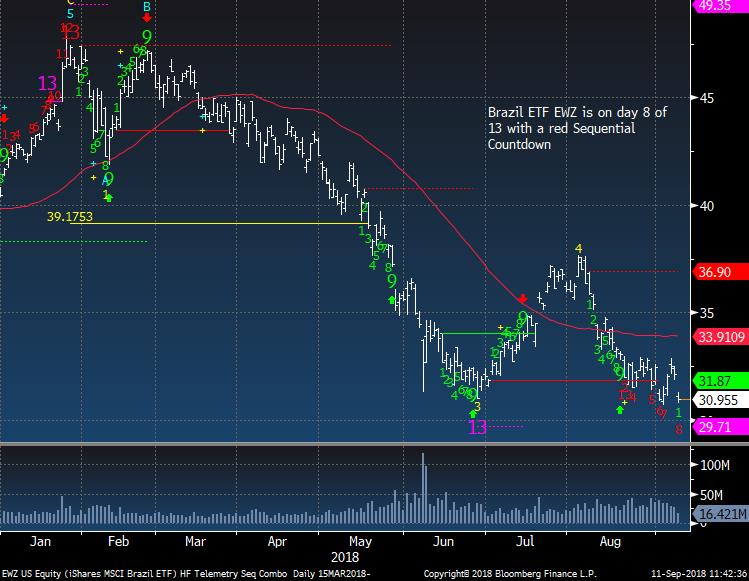
Brazill at risk of making a new low.
|
|
|
|
|
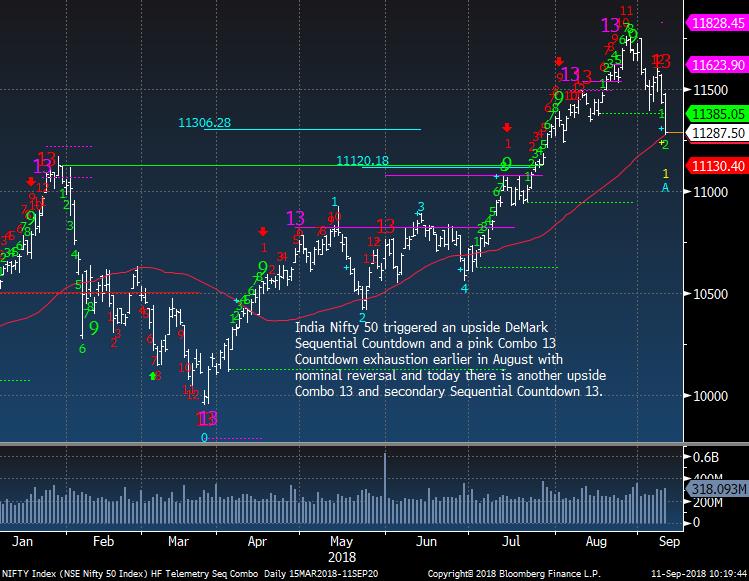
India Nifty 50 continues lower to the 50 day
|
|
|
|
|
|
|
|
|
|
|
|
|
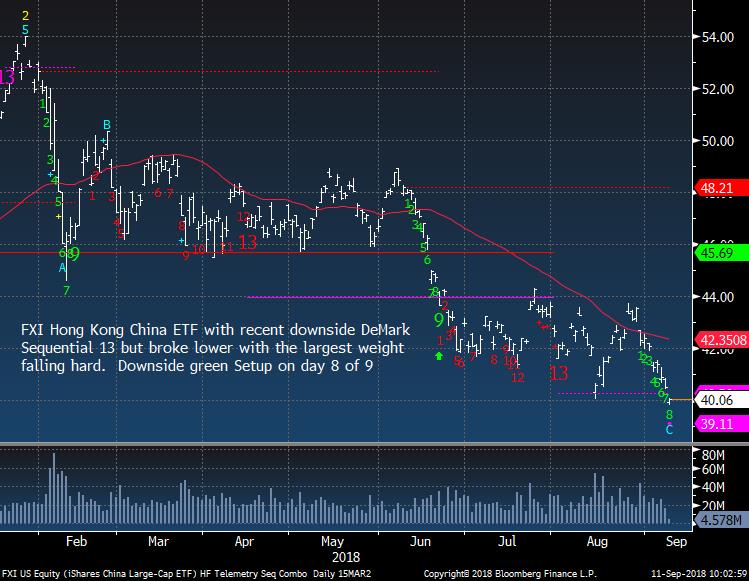
FXI still looks weak but green 9 could turn this so we will see
|
|
|
|
|
|
|
|
|
Crude bullish sentiment is at 70%
|
|
|
|
|
|
|
|
|
|
|
|
|
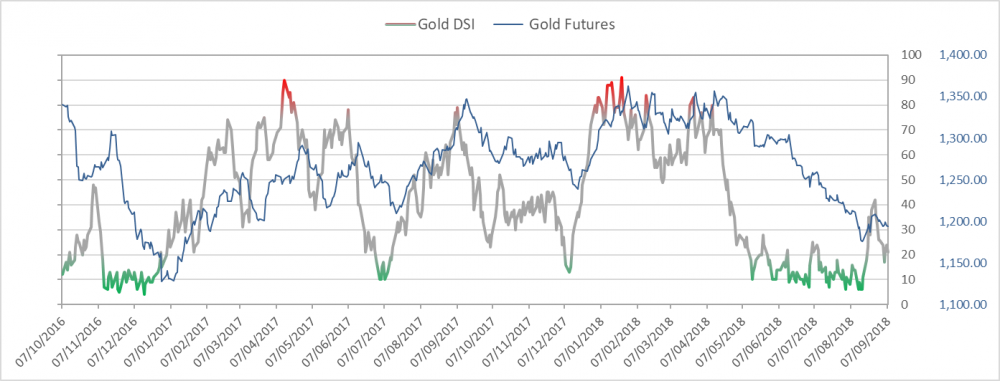
Gold bullish sentiment is at 23%
|
|
|
|
|
Gold Futures with another daily downside red Sequential Countdown 13.
|
|
|
|
|
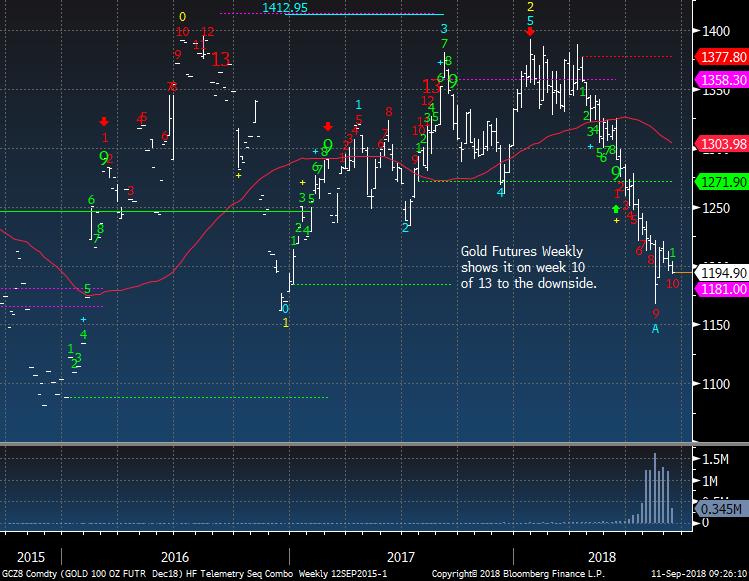
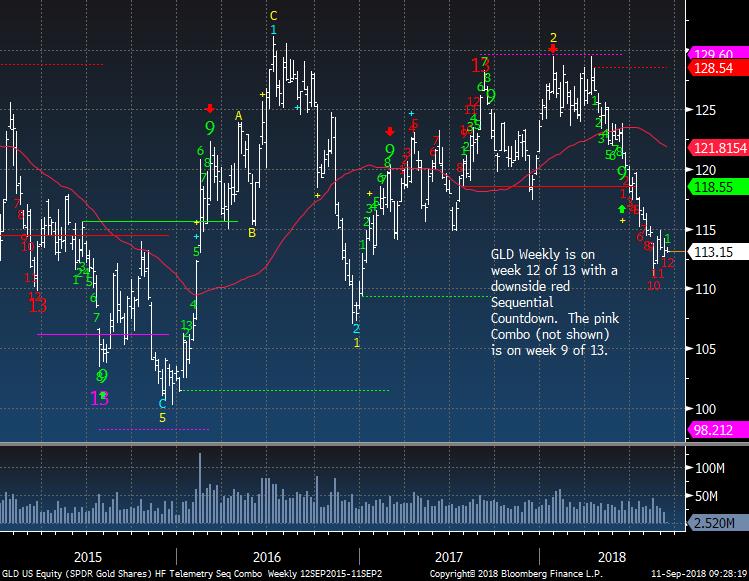
Gold Futures weekly has more downside to go
|
|
|
|
|
GLD weekly is on week 12 of 13 so getting closer but Combo is on week 9 of 13
|
|
|
|
|
|
|
|
|
|
|
|
|
|
|
DEMARK SCREENS - Daily, Weekly, Monthly Upside/Downside Exhaustion Signals
|
|
|
Daily/Weekly DeMark upside/downside exhaustion signals (Sequential) weekly updated on Monday's and monthly on the first day of the new month. Price flips occur when a stock closes higher/lower than four previous closes and increases conviction of a price turn.
The upside 13's are sell signals and downside 13's are buy signals. Price flip's are confirmation signals that increases potential for a price trend change. For example, if you are long a stock and there is an upside 13, you will want to take cautious action by selling down or out of a position. If initiating a short sale with the upside 13's, we tend to start with a 1/2 size and add with the downside price flip. The opposite is true for when there are downside 13's. Take a 1/2 size position
and add with the upside price flip. The DeMark Indicators are designed to assist the user with buying into weakness and selling into strength to anticipate trend exhaustion. Selling into a rally and buying into a decline often afford the opportunity to exit a trade without too serious a loss if wrong.
S&P 1500 Universe:
DAILY UPSIDE 13: AIN, BBBY, CSL, FDX, HUM, NAVG, RLI, RMD, TTC, XYL
DAILY DOWNSIDE 13: DLPH, GPOR, HIW, NEM, PETS, SWKS
DAILY UPSIDE WITH PRICE FLIP REVERSAL DOWN: BF/B, CACI, HAE, HUM, MANT, PGR, RF, SIGI, VVC
DAILY DOWNSIDE WITH PRICE FLIP REVERSAL UP: DLPH, HIW, KAMN, RYN
Updated: 9/10/18
WEEKLY UPSIDE 13: BRC, CIEN, EBS, ESRX, POOL, TXT
WEEKLY DOWNSIDE 13: NONE
Updated: 9/4/18
MONTHLY UPSIDE
13: AFG, AJG, AMD, CBT, CECO, EIG, IR, MAA, MRCY, MSA, MSFT, NSC, ORI, ROK, TDY, TTWO, UNT, UNP, WCG, WTR
MONTHLY DOWNSIDE 13: FTR, RRD, SMCI, SSI
Euro Stoxx 600 Universe:
DAILY UPSIDE 13: ANDR AV, EDF FP, SRG IM, TRN IM
DAILY DOWNSIDE 13:
CAPC LN, PPB ID, TKA GR
DAILY UPSIDE WITH PRICE FLIP REVERSAL DOWN: FINGB SS
DAILY DOWNSIDE WITH PRICE FLIP REVERSAL UP: DAI GR, INDV LN, ITX SM, PSM GR, RPC LN, VOD LN
Updated: 9/10/18
WEEKLY UPSIDE 13: IPN FP, LISN SW, SRT3 GR
WEEKLY DOWNSIDE 13: MONY LN, RPC LN
Updated: 9/4/18
MONTHLY UPSIDE 13: ACKB BB, GALP PL, IPN FP, KOMB CP, MTX GR, UCB BB
MONTHLY DOWNSIDE 13: ALPHA GA, BARC LN, TL5
SM
|
|
|
Unsubscribe me from Hedge Fund Telemetry
Hedge Fund Telemetry LLC, P.O. Box 4675, Greenwich, CT 06861, United States
CONFIDENTIALITY NOTE and DISCLAIMER: This message is for the named person's use only. It may contain confidential, proprietary or legally privileged material. No confidentiality or privilege is waived by any accidental or unintentional transmission. If you receive this message in error, please immediately delete it and all copies of it from your system, destroy any hard copies and notify the sender. You must not, directly or indirectly, use, disclose,
distribute, print or copy any part of this message if you are not the intended recipient. Hedge Fund Telemetry LLC. cannot guarantee the confidentiality of the material transmitted; therefore, information of a sensitive or confidential nature should not be transmitted. There is risk in trading markets. Hedge Fund Telemetry LLC reports are based on information gathered from various sources and believed to be reliable, but are not guaranteed as to accuracy and completeness. The information is subject to change without notice and Hedge Fund Telemetry LLC has no obligation to provide any updates or changes. Hedge Fund Telemetry LLC is providing this data for informational and educational purposes and does not believe that it is sufficient to base an investment decision on. This information should not be regarded as a solicitation or recommendation of any particular security or to engage in any trading strategy. One should always check with your licensed financial
advisor to determine suitability of any investments.
|
|
|
|
|
|
|