If you are having difficulty seeing this email, you can view in your browser or click here to
print.
|
|
|
|
|
04/30/2024
Thomas Thornton
info@hedgefundtelemetry.com
|
|
|
Checking in with the smart money
|
|
|
The last four days have seen intraday reversals off highs to close near lows. And 10 of the last 20 days have also seen the same low of the day close too. They say traders late in the day are the smart money. In bull markets you want to see closes at the highs and in bear markets you tend to see closes near the lows or at least under the opening price. In the past I have shown the Smart Money Flow Index which compares action at the beginning of the day and
action at the end of the day. I have posted the daily, weekly, and monthly charts and the full definition below. The takeaway is that this recent correction woke up the late in the day sellers which could last a while if history repeats.
I had quite a few people send me John Murphy from Stockcharts.com wave analysis suggesting the recent pullback was a wave 4 and wave 5 is ahead on the upside. John wrote the book on technical analysis (his book is the main book for the CMT exam) and he's been around a long time. Unfortunately his analysis with the current wave set up does not line up with my work and Elliott Wave International's too.
Continue to watch the VWAP levels calculated from 3:30pm on 2/9 as first support. A break under these levels will see accelerated selling. SPY 269.10, QQQ 162.80, IWM 150.80, DIA 248.75
Have a great weekend and thank you for your support. Do something fun with a loved
one.
Notable:
- US Markets - consolidating
- Smart Money Flow Index
- What wave is the market in?
- European Indexes
- S&P YoY Earnings rate of change
- Bonds
- Gold
- DeMark screens
|
|
|
|
|
SPX bullish sentiment is at 28% up slightly from 25% a day ago
|
|
|
|
|
|
|
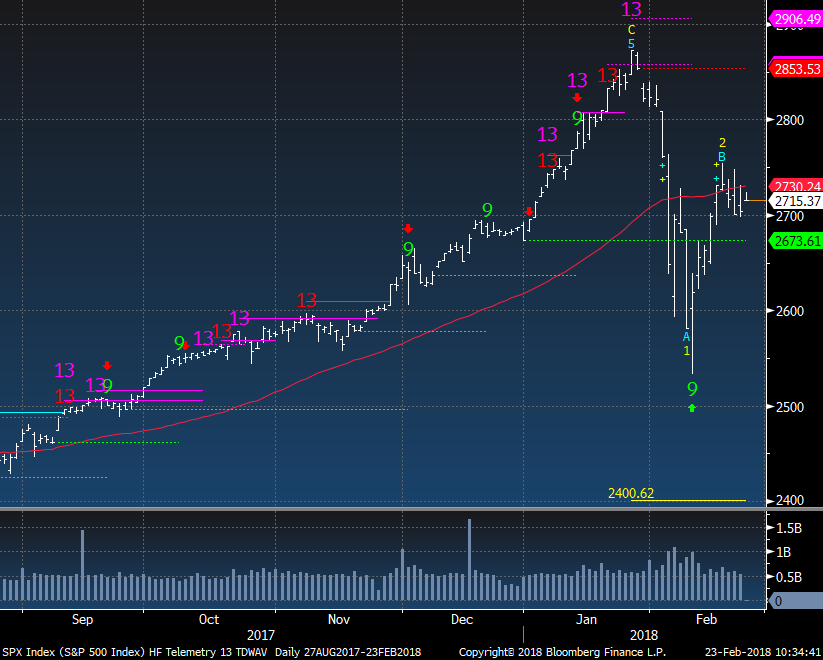
SPX daily has been consolidating below the 50 day with 2700 as a level that has held a couple time recently. A break under could spook people
|
|
|
|
|
|
|
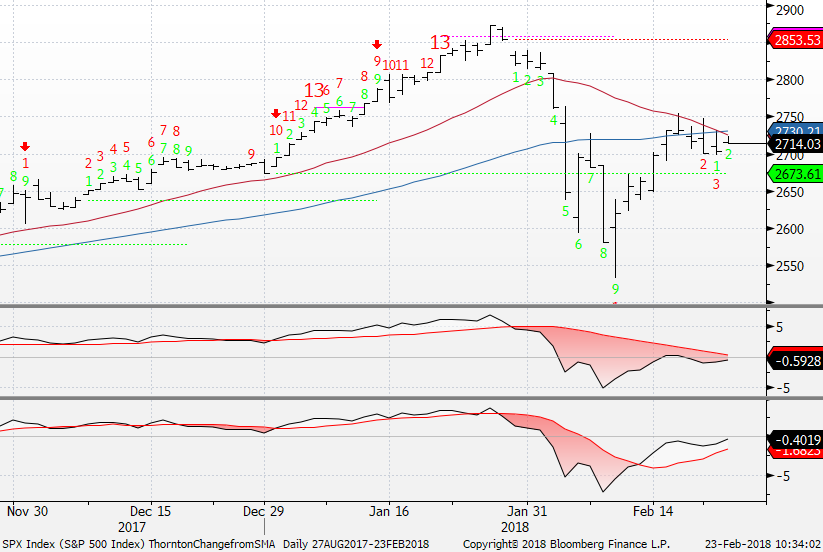
SPX with the Countdowns. There is a downside red Countdown on day 3 of 13 and I am watching close the 2673 level as another support level.
|
|
|
|
|
|
|
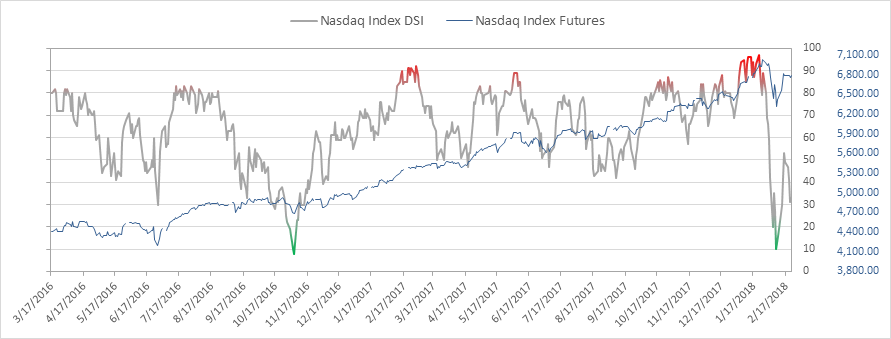
Nasdaq bullish sentiment is at 33% ticking up from 31 a day ago.
|
|
|
|
|
|
|
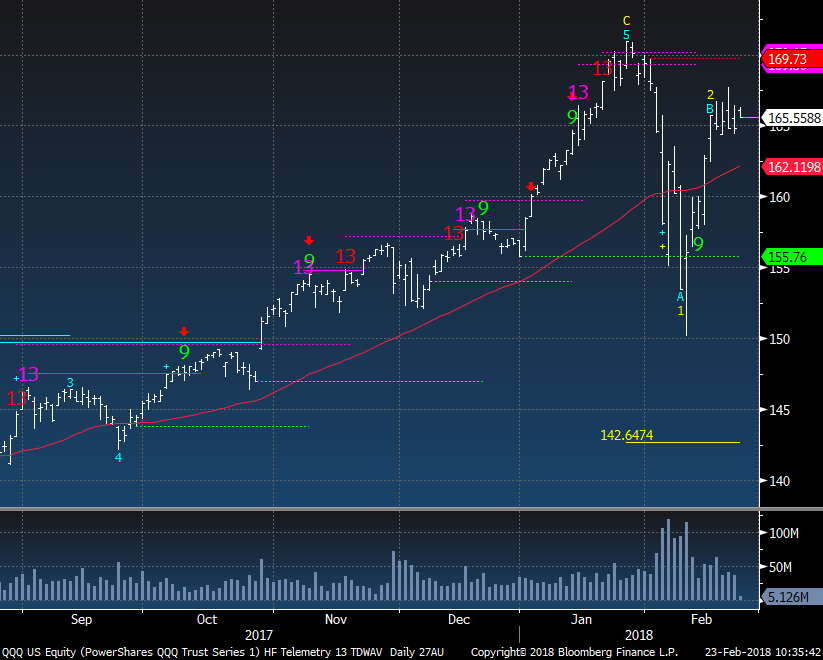
QQQ remains over the 50 day also consolidating gains.
|
|
|
|
|
|
|
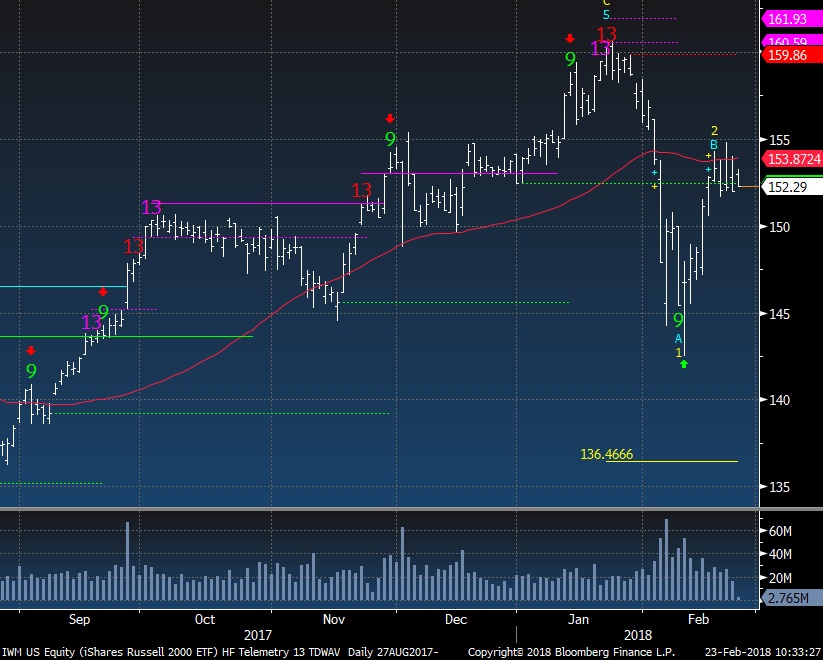
IWM Russell 2000 ETF is consolidating gains under the 50 day moving average. I saw a blog technician saying the ratio between the IWM and SPY is about to turn up. Maybe on a relative basis the IWM will outperform but I see both going down further and potentially by a lot.
|
|
|
|
|
|
|
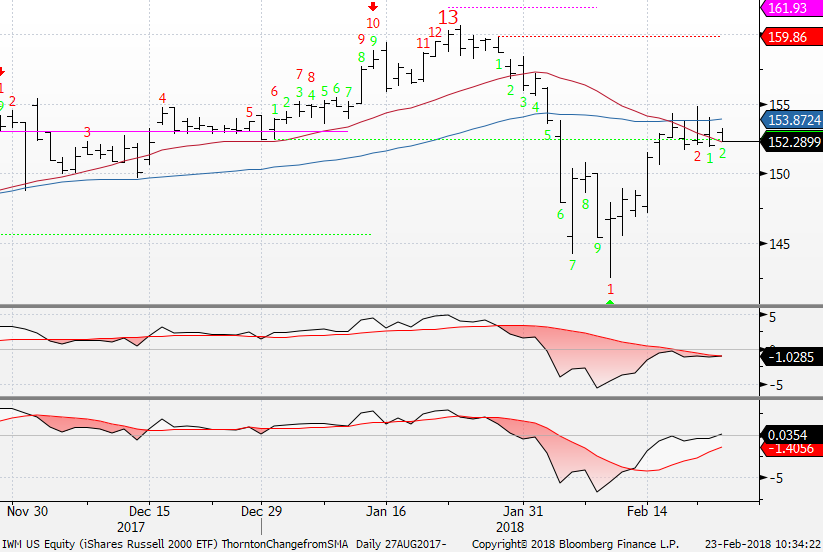
IWM with a downside Countdown on day 2 of 13 in progress.
|
|
|
|
|
|
|
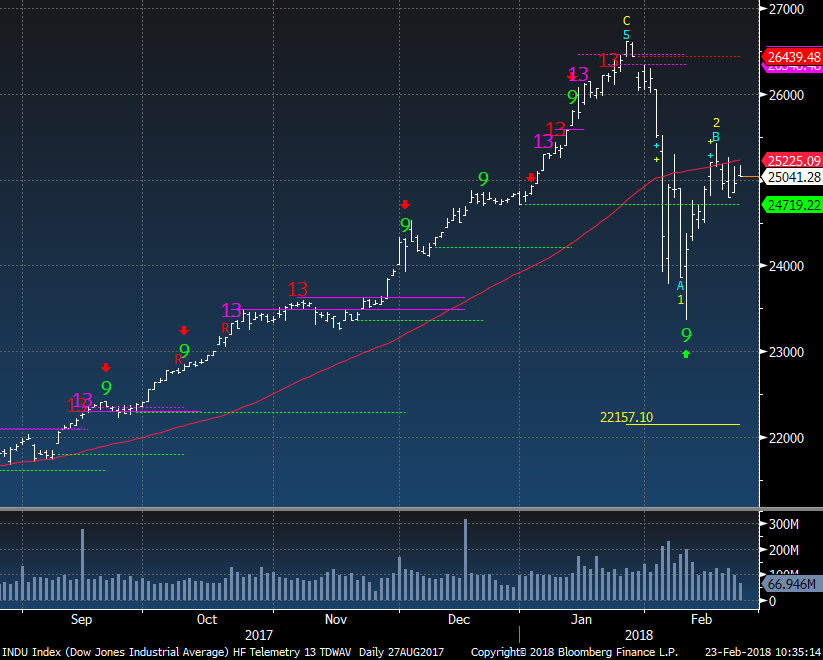
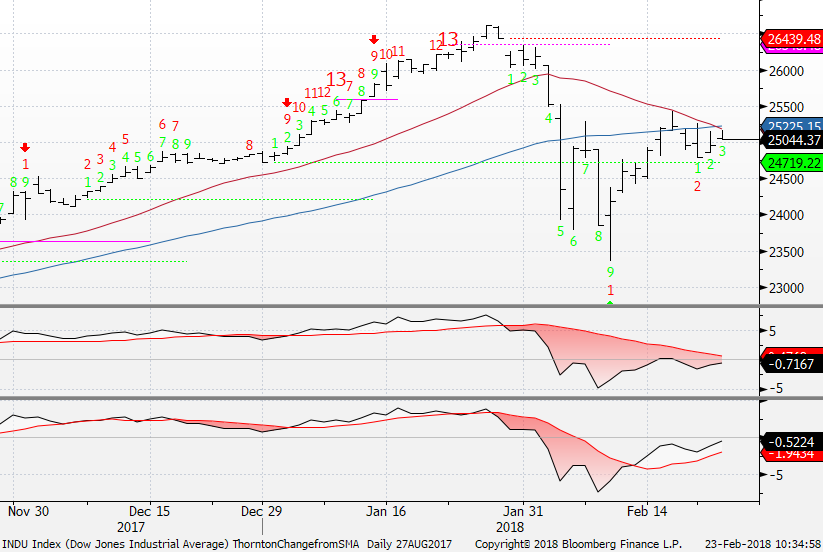
INDU Dow Jones also consolidating under the 50 day with many people looking at the round number 25,000. I'm watching the 24,719 level
|
|
|
|
|
|
|
INDU has a downside Countdown on day 2 of 13 in progress.
|
|
|
|
|
|
|
|
|
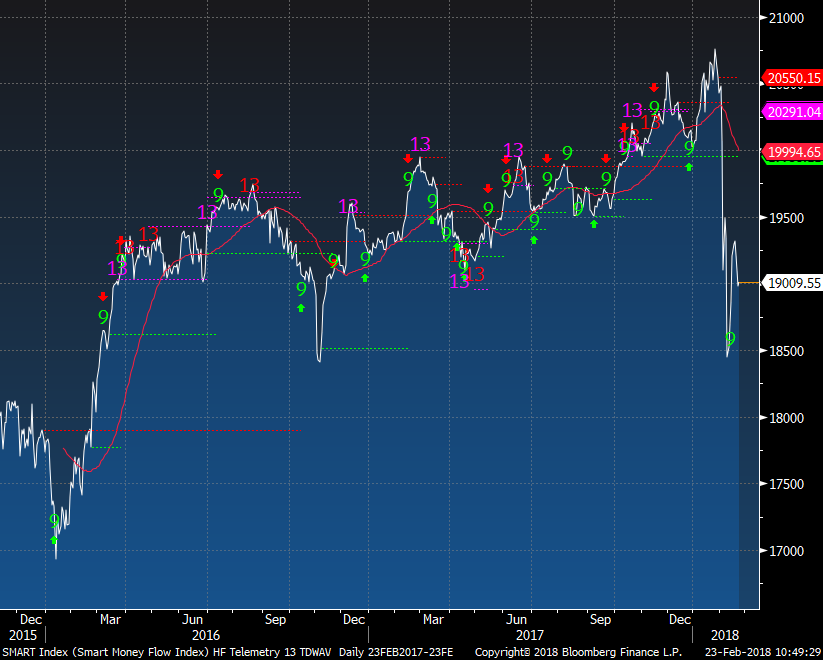
The Smart Money Flow Index is calculated by taking the action of the Dow in two time periods: the first 30 minutes and the close. The first 30 minutes represent emotional buying, driven by greed and fear of the crowd based on good and bad news. There is also a lot of buying on market orders and short covering at the opening. Smart money waits until the end and they very often test the market before by shorting heavily just to see how the market reacts. Then they move in the big way. These heavy hitters also have the best possible information available to
them and they do have the edge on all the other market participants. To replicate this index, just start at any given day, subtract the price of the Dow at 10 AM from the previous day's close and add today's closing price.
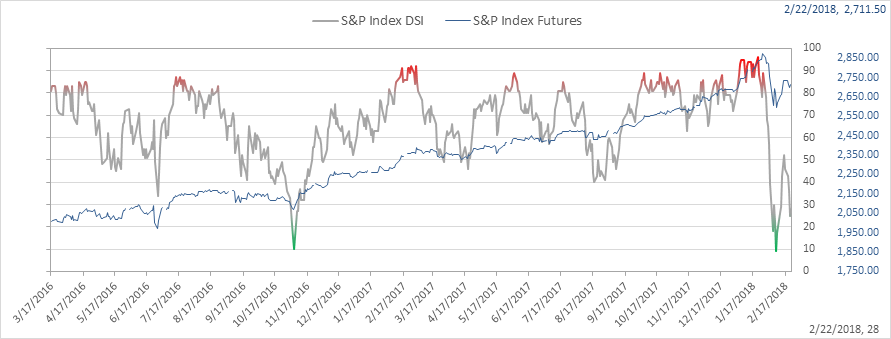
The daily chart of the Smart Index on the left shows the bottom from early 2016 low, a dip ahead of the election and a grind higher with upside and downside exhaustion signals capturing the small and short lived pullbacks. This recent correction has given back a year with this index and I believe it's woken up the longer term time frames.
|
|
|
|
|
|
|
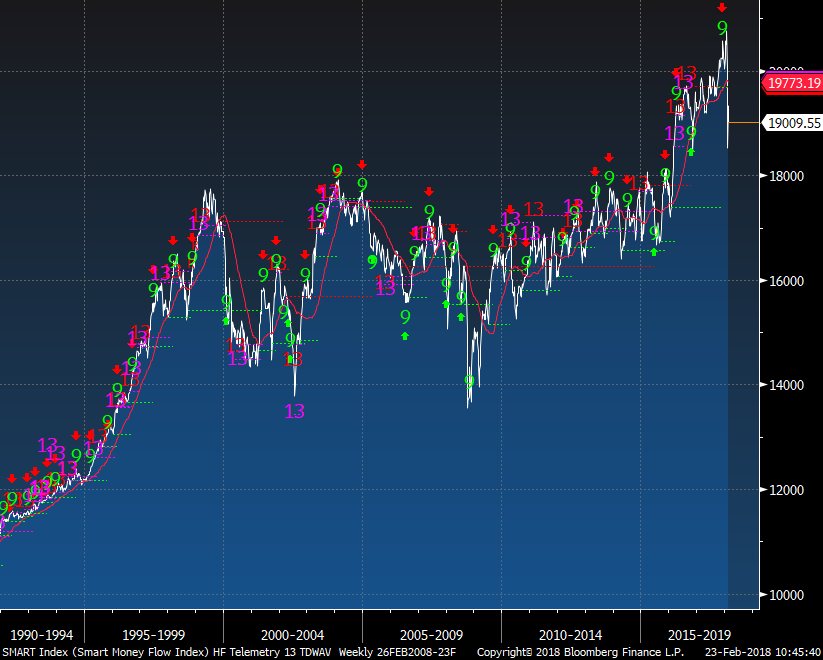
The weekly of the Smart Index shows many signals which isn't the point but I wanted to show the big drop in such a short period of time. If one week can do this much damage of major selling in the last hour, what do you think is going to happen when the indexes break the recent lows? The amount of passive funds and ETF's in the market certainly had an impact and this story will only get more exciting.
|
|
|
|
|
|
|
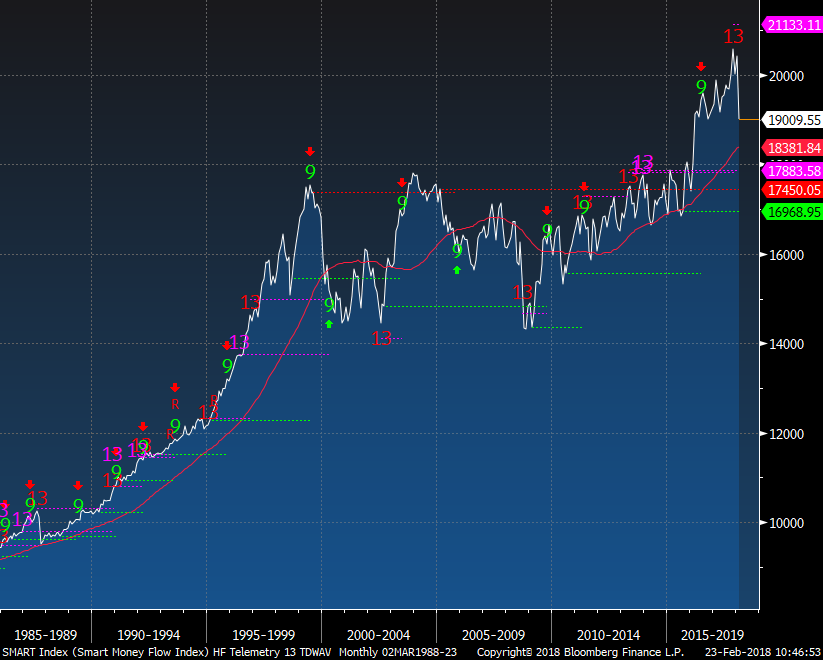
The monthly of the Smart Index has fewer signals but important ones. On the far left there was a red Countdown right ahead of 1987's drop, several in the 90's run which resulted in some pullbacks that at the time were challenging. The recent upside red Countdown also coincided with the monthly upside exhaustion signals on many indexes including all of the US major indexes and Bloomberg World Index.
|
|
|
|
|
|
|
What wave is the market in?
|
|
|
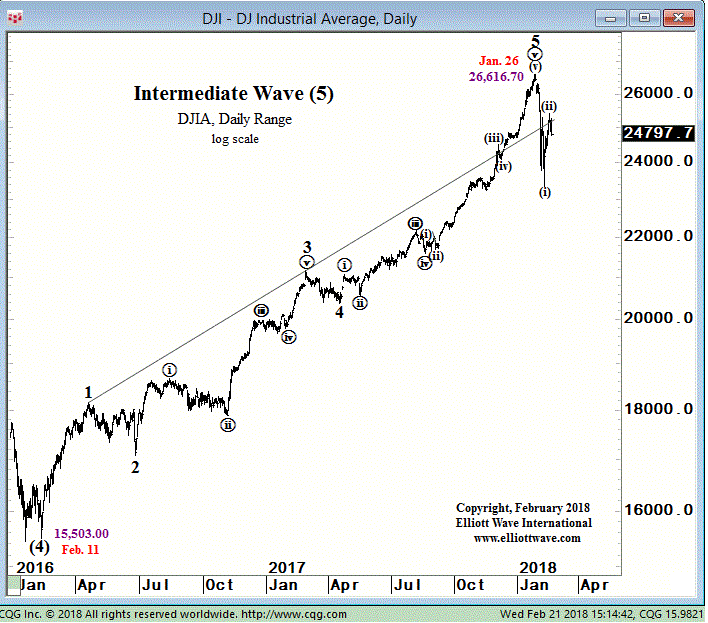
Below is John Murphy's comments on what wave he thinks we're in. I use the DeMark Indicators TDWave which eliminates the subjectivity found with Elliott Wave analysis. Tom's work has rules different that the strict Elliott Wave rules. I can get deeper in this but I'm going to go to CAPS in John Murphy's as a rebuttal. Below is the Elliott Wave International chart of the Dow that just had an upside wave 5 top with a wave 1 down and now 2 up.
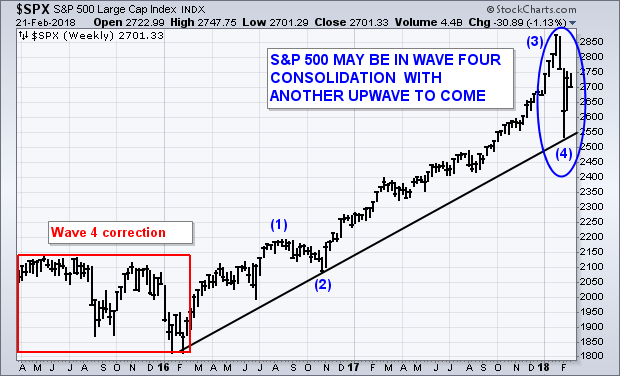
STOCKS MAY BE IN FOURTH WAVE CONSOLIDATION PATTERN ... My message from January 6 expressed concern about the fact that the S&P 500 was well into its fifth Elliott Wave advance that started in March 2009. Elliott Wave analysis is built on the idea that bull markets have five waves which break down into three upwaves (1,3,5) and two intervening corrective waves (2 and 4). The red box in Chart 8 shows the last serious market correction that lasted from August 2015 to February 2016. My August 22 message from that year carried the headline: "Stocks Have Entered a Wave 4 Correction". That meant that the
market still had another upwave to go before completing a five-wave bull market sequence. That final upwave should itself form five waves. IT DID AS YOU SEE BELOW ON THE EWI CHART The blue numerals in Chart 8 show my interpretation of that advance since the early 2016 bottom. And it looks incomplete. Waves 1 and 2 during the second half of 2016 look pretty clear. The third wave,
however, that lasted from November 2016 to this January was absent any notable correction or consolidation. So I'm defining that as a long wave 3. If I'm right, that would make the current market weakness a wave 4. The fact that the February correction bounced off its major up trendline appears to support that view. What does that mean? Wave 4 consolidation patterns are often "triangular" in shape. That would suggest the market trending sideways between its recent highs and lows for several weeks or months (the last correction lasted three months). THE VOLUME OF WAVE 4 IS ALWAYS LESS THAN WAVE 3 AND THAT CLEARLY IS NOT THE CASE. WAVE 1 ON THE DOWNSIDE ALWAYS HAS HIGHER VOLUME THAN THE 5TH WAVE AND THE BOUNCE WE ARE IN NOW ALWAYS HAS LIGHTER VOLUME THAN WAVE 1 DOWN. That could pave the way for another fifth (and possible final) upwave. There's good and bad news in that analysis. The good news is that the bull market probably isn't over. The bad news is that the next upleg (if and when it occurs) could be the last one in a bull market nearing its ninth
anniversary in March. HONESTLY, I THINK HE'S WRONG HERE.
|
|
|
|
|
|
|
The EWI chart clearly shows all of the wave up in the past year and they do sub waves that are based on different time frames. I'll put more weight into EWI analysis everyday.
|
|
|
|
|
|
|
|
|
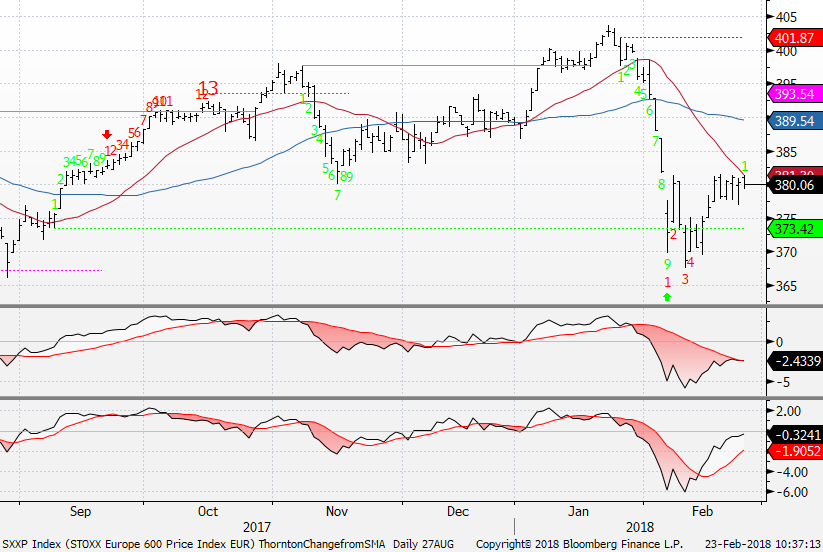
SXXP Euro Stoxx 600 has consolidated in the last week but still has a downside Countdown on day 4 of 13.
|
|
|
|
|
|
|
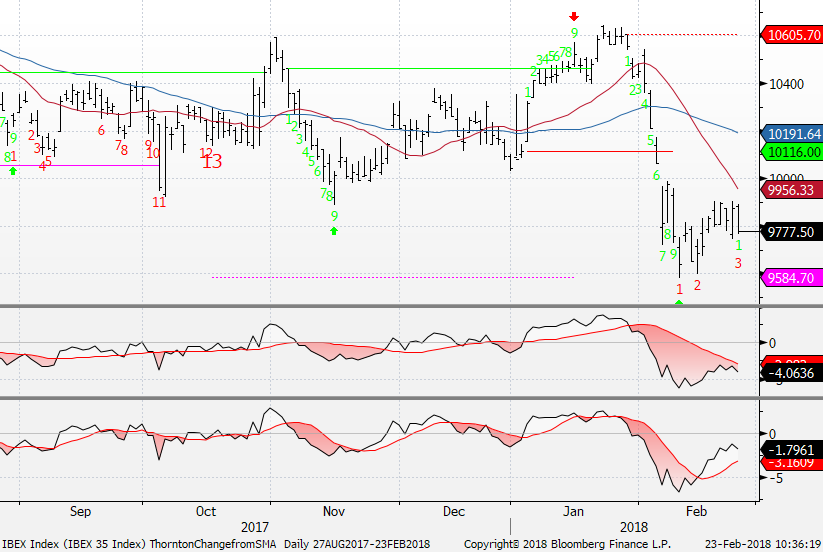
Spain looks more troubling on day 3 of 13 with it's downside Countdown closing on the lows for the week.
|
|
|
|
|
|
|
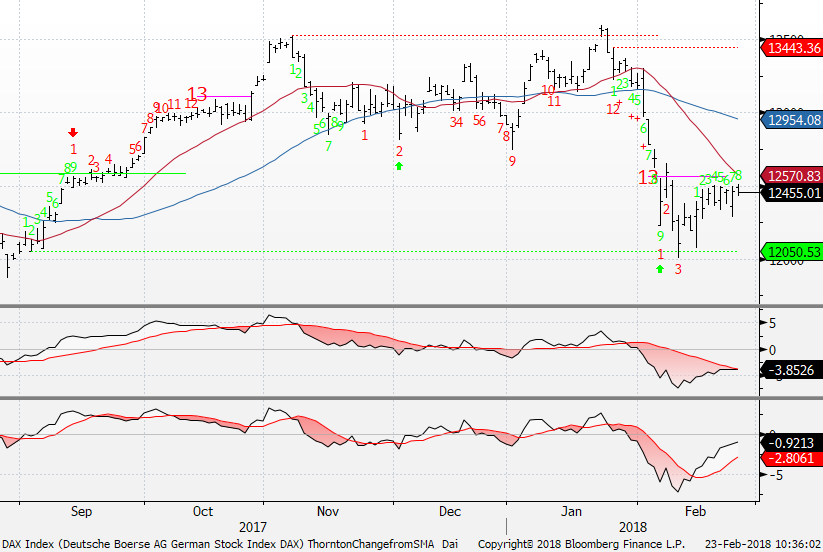
The German DAX actually looks better than other indexes in Europe. It's on day 8 of 9 with a green Setup count and Monday if it can close higher than 4 previous closes they the 9 will stick and the pending red Countdown on day 3 of 13 will be nullified.
|
|
|
|
|
|
|
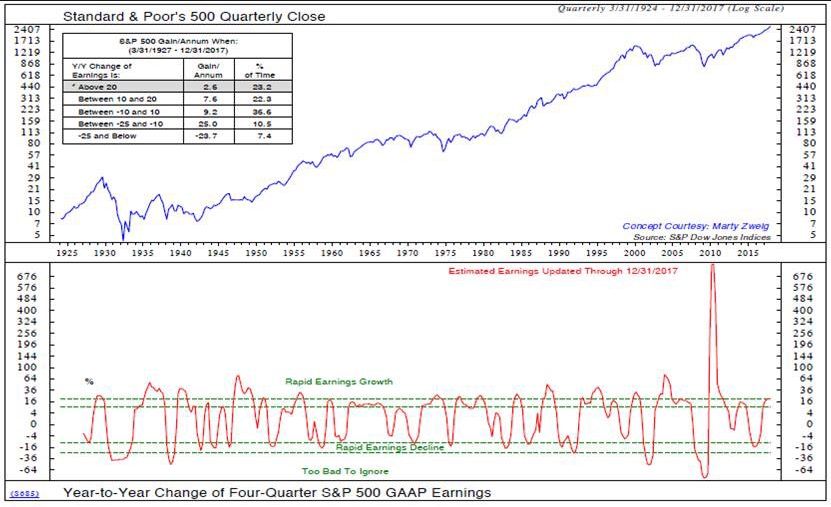
S&P 500 Earnings YoY rate of change
|
|
|
NDR has a good chart looking at rapid earnings growth and when above the annualized gain is actually the weakest. My call is that the hockey stick earnings revisions are too high and will come down... likely with stocks too
|
|
|
|
|
|
|
|
|
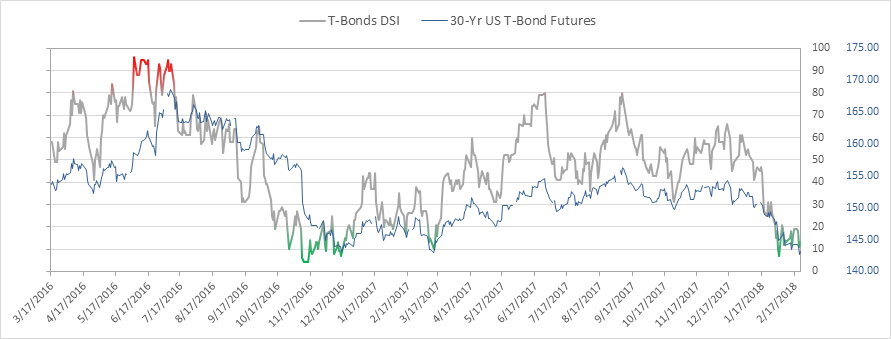
Bond bullish sentiment is at 13% and has been loitering in the oversold extreme zone for a nearly a month. A move over 25% would spark my interest in an oversold bond rally.
|
|
|
|
|
|
|
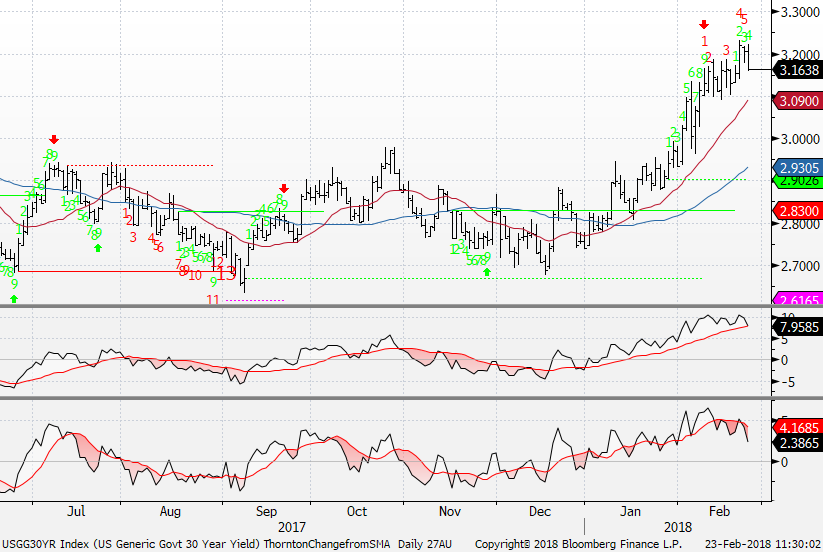
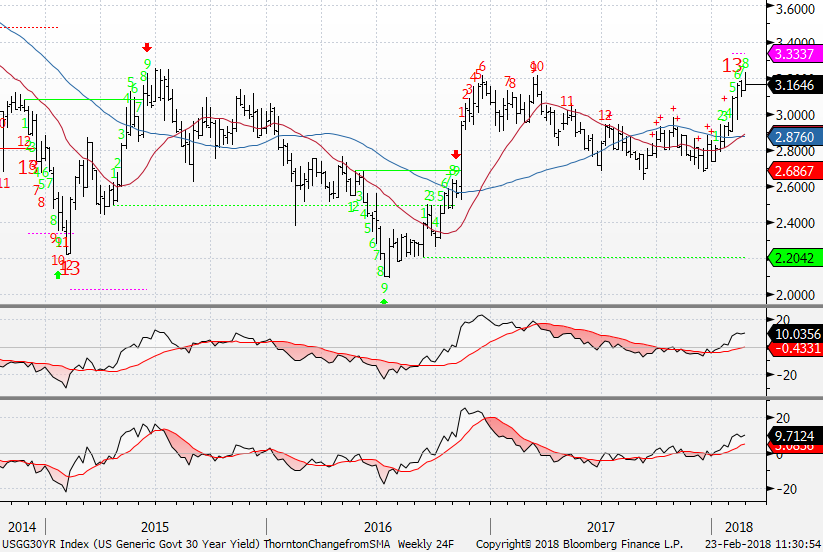
US 30 year daily still has an upside red Countdown on day 5 of 13.
|
|
|
|
|
|
|
The weekly of the 30 year has a red Countdown in play as well a green Setup on week 8/9 so perhaps next week the 9 will trigger.
|
|
|
|
|
|
|
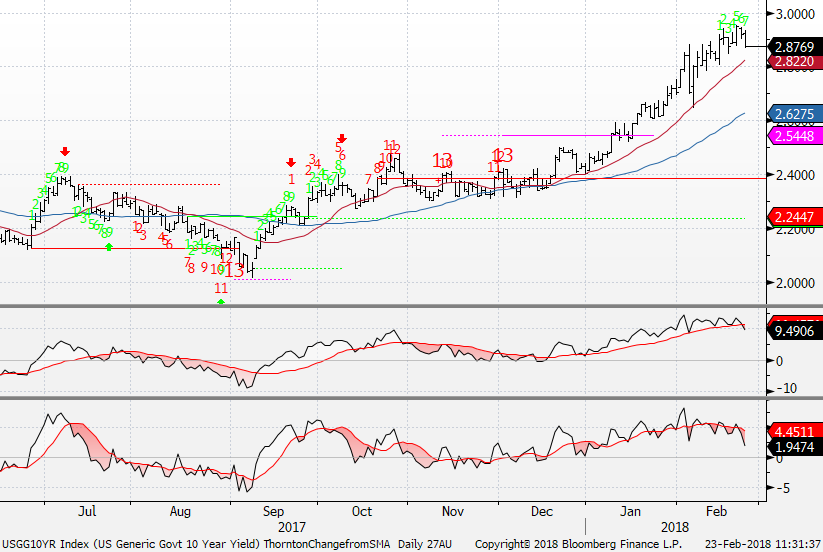
The US 10 year has been in drift up mode after breaking out above the pink risk line at 2.54%. It's on day 7 of 9 but remember to get the 9 you need 9 consecutive closes higher than 4 previous closes.
|
|
|
|
|
|
|
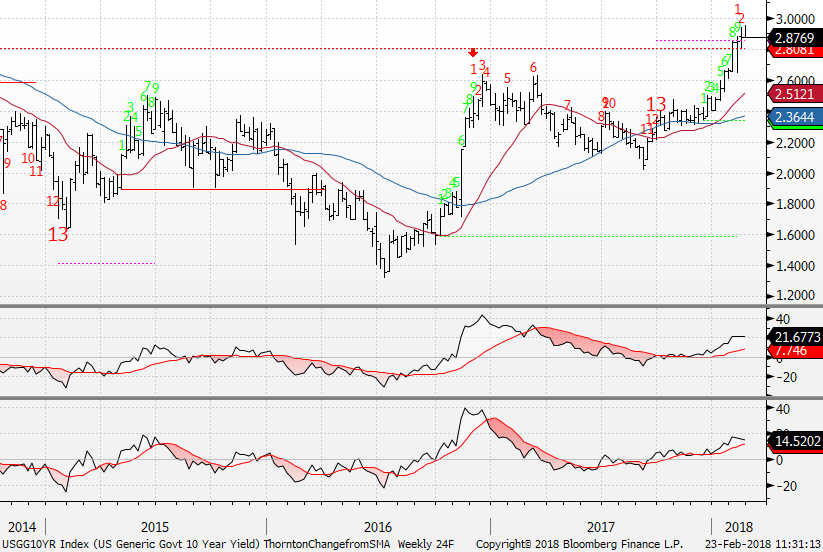
The weekly of the 10 year had a green Setup 9 and the last two times rates faded
|
|
|
|
|
|
|
|
|
|
|
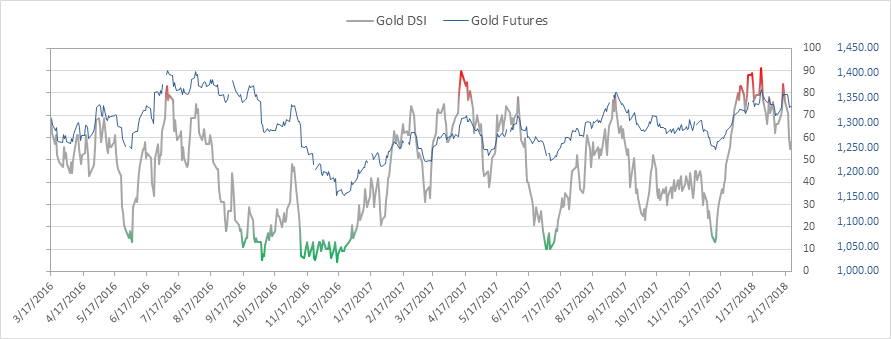
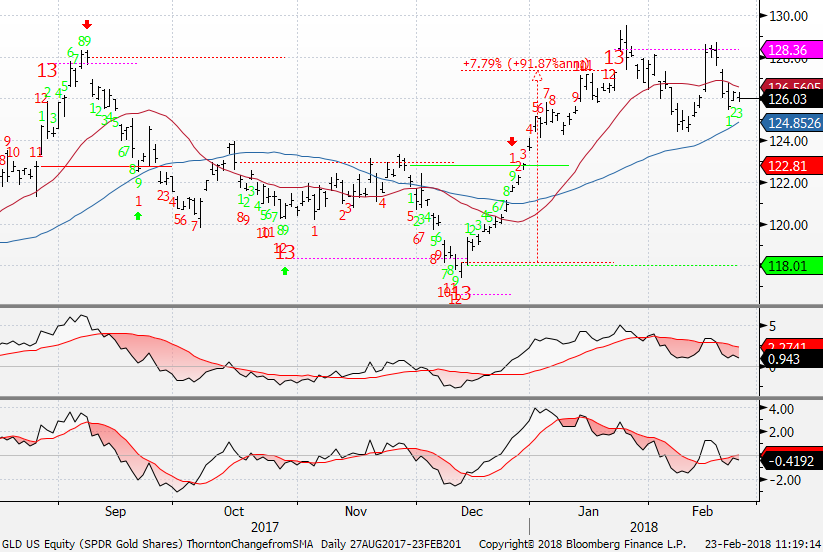
Gold bullish sentiment is at 58%. Breaking 50% would usher in lower prices
|
|
|
|
|
|
|
GLD stalled at the recent high as I suspected it might with sentiment pretty high. If this can hold the 50 day and bounce with sentiment holding the midpoint then there's hope for a breakout.
|
|
|
|
|
|
|
DEMARK SCREENS - Daily, Weekly, Monthly Upside/Downside Exhaustion Signals
|
|
|
Daily/Weekly DeMark upside/downside exhaustion signals (Sequential) Weekly updated on Monday's. Price flips occur when a stock closes higher/lower than four previous closes.
S&P 1500 Universe:
DAILY UPSIDE 13: AIT, BR, JPM, KELYA, ROP
DAILY DOWNSIDE 13: ADC, BKH, CBB, ED, FF, GEOS, HAIN, MAA, NTRI, REG, SKT, SVU, UDR, UHT
DAILY UPSIDE WITH PRICE FLIP REVERSAL DOWN: ABAX, ACXM, ADBE, AOI, BCOR, HI, JPM, LH, LMT, TYL
DAILY DOWNSIDE WITH PRICE FLIP REVERSAL UP: GEOS, REG, UHT
Updated: 2/20/18
WEEKLY UPSIDE 13: AOI
WEEKLY DOWNSIDE 13: ACN, ANDE, HWKN, MTSC, PSA
Updated: 2/1/1
MONTHLY UPSIDE 13: CHD, CLGX, CLX, CNMD, DVA, FICO, IDCC, MSCI, ORLY, PAYX, TFX, VMC, XYL
MONTHLY DOWNSIDE 13: GPOR
Euro Stoxx 600 Universe:
DAILY UPSIDE 13: RSA LN, SBRY LN
DAILY DOWNSIDE 13: BDEV LN, SRG IM, TALK LN, TCH FP
DAILY UPSIDE WITH PRICE FLIP REVERSAL DOWN: BA/ LN, BME LN, HAS LN, IGG LN, SGRO LN
DAILY DOWNSIDE WITH PRICE FLIP REVERSAL UP: PNN LN
Updated: 2/20/18
WEEKLY UPSIDE 13: AC FP, DB1 GR
WEEKLY DOWNSIDE 13: INTU LN, INVEB SS, ITV LN, MKS LN, NCCB SS, PFC LN, PROX BB, SESG FP, TELIA SS
Updated: 2/1/18
MONTHLY UPSIDE 13: COFB BB, GAS SM, GKN LN, ING FP, KINVB SS, OML LN, VIS SM
MONTHLY DOWNSIDE 13: NONE
|
|
|
Unsubscribe me from Hedge Fund Telemetry
Hedge Fund Telemetry LLC, P.O. Box 4675, Greenwich, CT 06861, United States
CONFIDENTIALITY NOTE and DISCLAIMER: This message is for the named person's use only. It may contain confidential, proprietary or legally privileged material. No confidentiality or privilege is waived by any accidental or unintentional transmission. If you receive this message in error, please immediately delete it and all copies of it from your system, destroy any hard copies and notify the sender. You must not, directly or indirectly, use, disclose,
distribute, print or copy any part of this message if you are not the intended recipient. Hedge Fund Telemetry LLC. cannot guarantee the confidentiality of the material transmitted; therefore, information of a sensitive or confidential nature should not be transmitted. There is risk in trading markets. Hedge Fund Telemetry LLC reports are based on information gathered from various sources and believed to be reliable, but are not guaranteed as to accuracy and completeness. The information is subject to change without notice and Hedge Fund Telemetry LLC has no obligation to provide any updates or changes. Hedge Fund Telemetry LLC is providing this data for informational and educational purposes and does not believe that it is sufficient to base an investment decision on. This information should not be regarded as a solicitation or recommendation of any particular security or to engage in any trading strategy. One should always check with your licensed financial
advisor to determine suitability of any investments.
|
|
|
|
|