|
|
|
|
|
|
Macro Risks Hiding In Plain Sight
|
|
|
Today's note is going to focus on some of the macro risks I see developing that will cause at first ripples then serious issues around the world. The first risk is the potential for a continued risk in the US Dollar. US companies have had a tailwind at their backs for 18 months and it's benefited multinational exports from technology, industrials to commodities. The US Dollar is still the dominant currency globally and if there is a stronger US Dollar it's going
to weigh on countries and companies who have borrowed in US Dollars as it will make it more difficult to repay the debt and harder to roll over loans when they come due. In the past 10 years US denominated credit to the rest of the world has more than doubled to $10 trillion. There are already clear signs of this stress in Argentina, Turkey, and other EM countries. The weakest countries will see the stress first, just as sub prime lending was first to see stress in 2007. Once it starts as you know it's hard to contain.
Second, interest rates around the world are much higher than a year ago or even two years ago. Despite some conflicting signals I have right now, on balance I see higher rates around the world. The magnitude of sovereign and corporate debt issued that is now underwater will only increase with higher rates. Losses no matter what cause stress even if the economies are more stable or even growing at a reasonable pace. The trade off
of higher rates vs better economy in theory makes sense with academics yet I fear again the sheer magnitude of issuance in the recent years increases the risk vs. reward. Corporations have benefited by borrowing at low rates to fund stock buybacks and if rates continue to rise this strategy will be at risk. It won't happen immediately as it took time in 2007 with the massive buybacks to turn into a risk.
Third, crude prices have been rising even with this initial rise in the US Dollar. Historically when the US Dollar rises crude prices declined due to the cut in import price declines, however this time might be different with the US being the less dependent on crude imports more than ever before. Higher crude prices have benefited the beleaguered US energy sector which has been a huge lift for several indexes such as the S&P 500 and the smaller cap indexes too. With the rise in crude, it's also kept high yield credit spreads quietly contained.
The energy sector, as seen in 2014-2015 when under stress caused credit spreads to widen to very concerning levels. My work is showing WTI Crude Futures nearing upside exhaustion levels as well an increase in exhaustion signals with ETF's and individual stocks.
These are just three macro risks I wanted to point out and would welcome discussion and feedback along with your thoughts what macro risks you are watching. I will elaborate on future macro focused notes. Shoot me an email.
Notable:
- US Markets - Sentiment increase is a positive but will it last? Nearly getting green Setup 9's on the upside with several indexes. Russell 2000 weekly upside exhaustion should contain breakout
- Hedge Fund Telemetry Trade Ideas - No changes today.
- Bloomberg World Index - On day 11 of 13 with upside Countdown. Weekly doesn't look like a breakout by any means
- European Markets - Stalling out as expected
- Currencies -
USD and Euro thoughts
- German and Italian 10 year yields
- US Bonds - Still on balance see risk to upside on yields
- Crude and Energy Update - Seeing some upside exhaustion signals starting
- Gold Update - Waiting for a better setup
- DeMark Screens - Daily, Weekly, Monthly upside/downside exhaustion signals within the S&P 1500 and Euro Stoxx 600
|
|
|
|
|
Here's a link to the Hedge Fund Telemetry market sentiment page with 40 charts of sentiment including equities, bonds, currencies, and commodities updated each day.
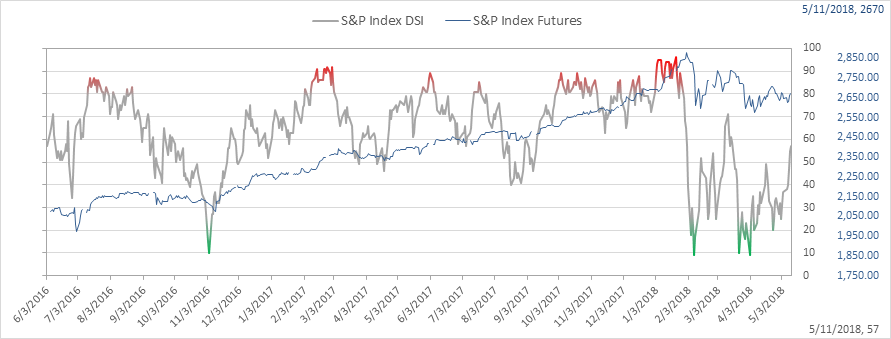
SPX bullish sentiment is at 57% and continues to strengthen. If this breaks again making another lower high, I would place odds of the S&P and other indexes moving to new lows.
|
|
|
|
|
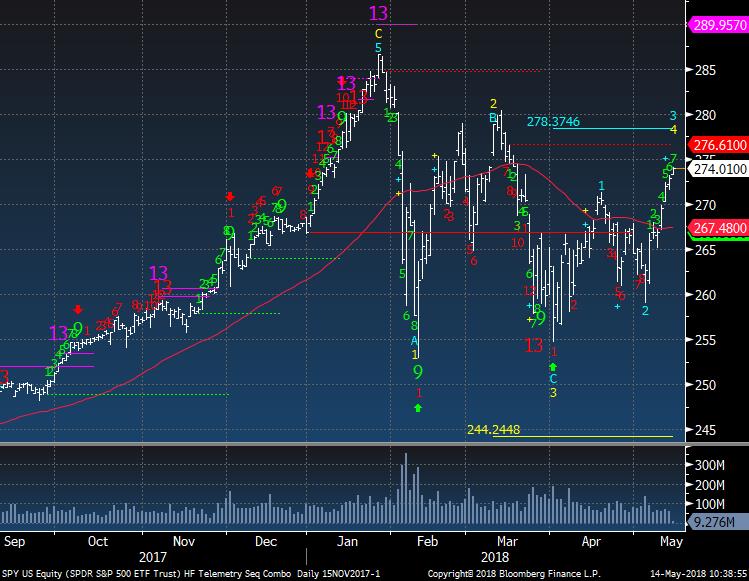
SPY is on day 7/9 with a green upside Setup. If this fullfils the Setup to 9 the pending downside red Countdown will be cancelled. As much as people have gone on about a "breakout" my friend Andrew Thrasher, who is an outstanding technician said today on Twitter "The issue I take with diagonal trend lines is when people identify a "break out." I believe a breakout (when to the upside) is when demand exhausts supply, causing the price to rise. That isn't identified with a diagonal trend line." @AndrewThrasher
|
|
|
|
|
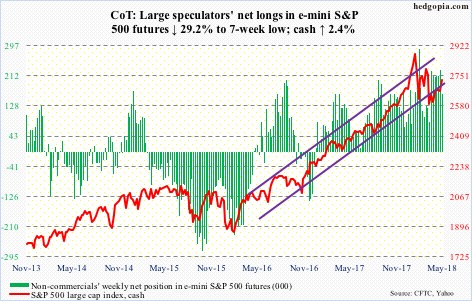
COT data showed large speculators decreased their long positioning by 29% last week. The reading was taken on Tuesday and they did not get the lift seen after Tuesday.
|
|
|
|
|
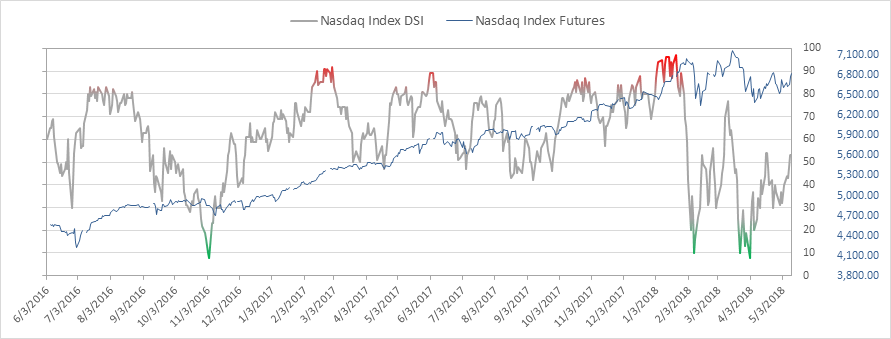
Nasdaq bullish sentiment is at 53%
|
|
|
|
|
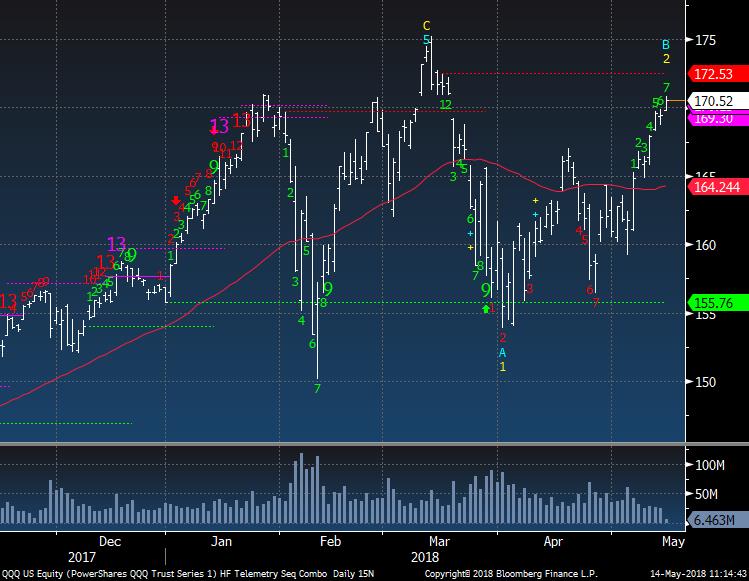
QQQ is on day 7 of 9 with its upside green Setup and will cancel out the red Countdown if fulfilled
|
|
|
|
|
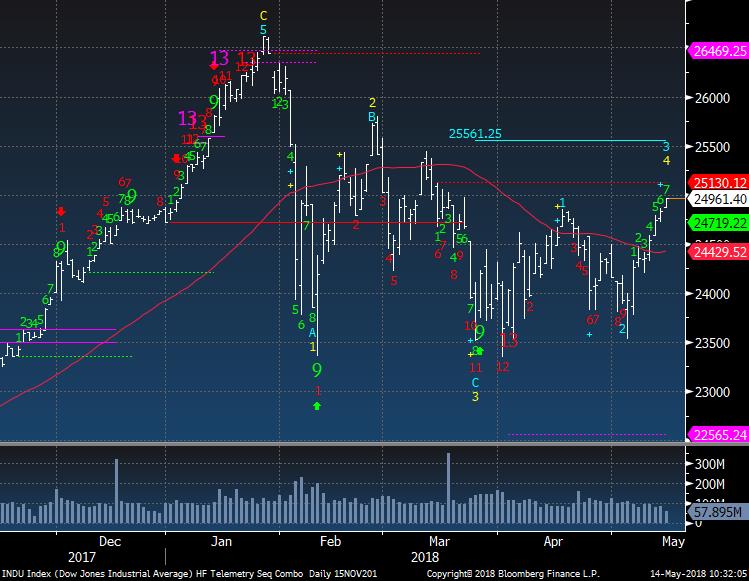
Dow Jones also on day 7/9 with green Setup. FYI the green Setup 9 could also contain this recent move too
|
|
|
|
|
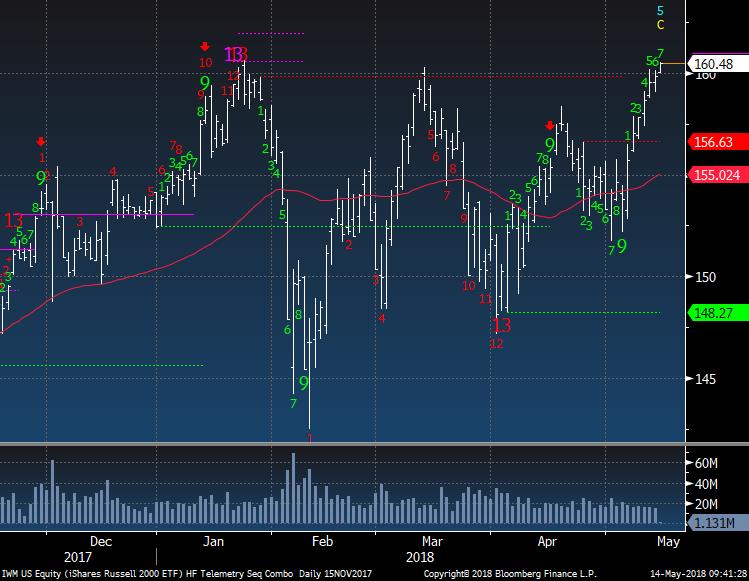
IWM Russell 2000 has been the best looking of the US indexes after the correction in February. I've mentioned this a few times yet there is risk here failing to breakout
|
|
|
|
|
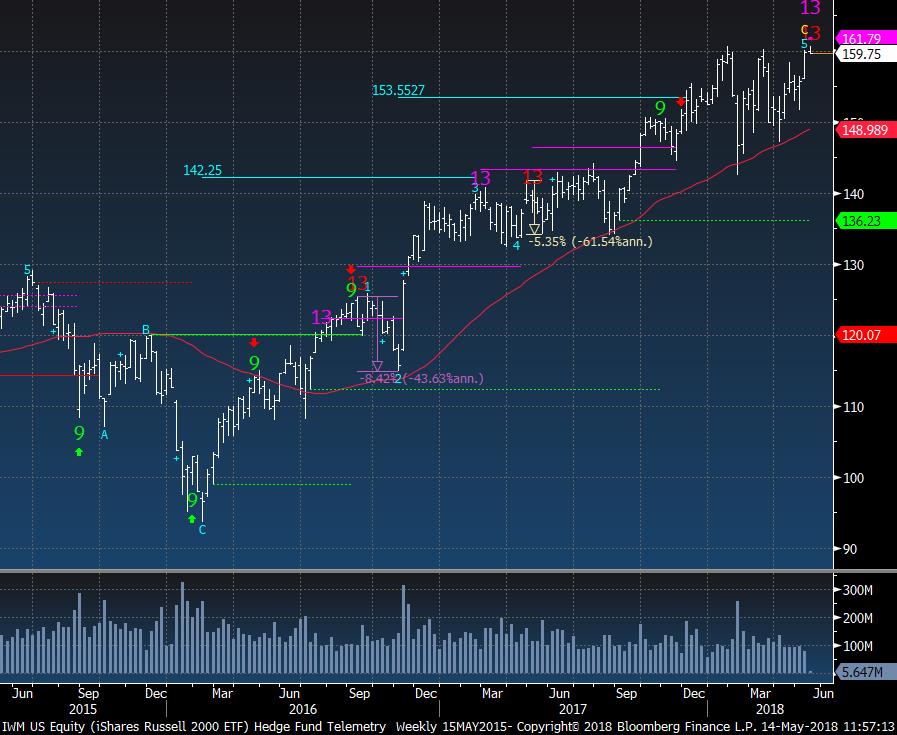
The IWM Weekly did get the upside red Sequential and pink Combo 13 exhaustion signal today. Previous signals have been excellent and even last year pulled back more than the S&P did when there were upside weekly exhaustion signals.
|
|
|
|
|
|
|
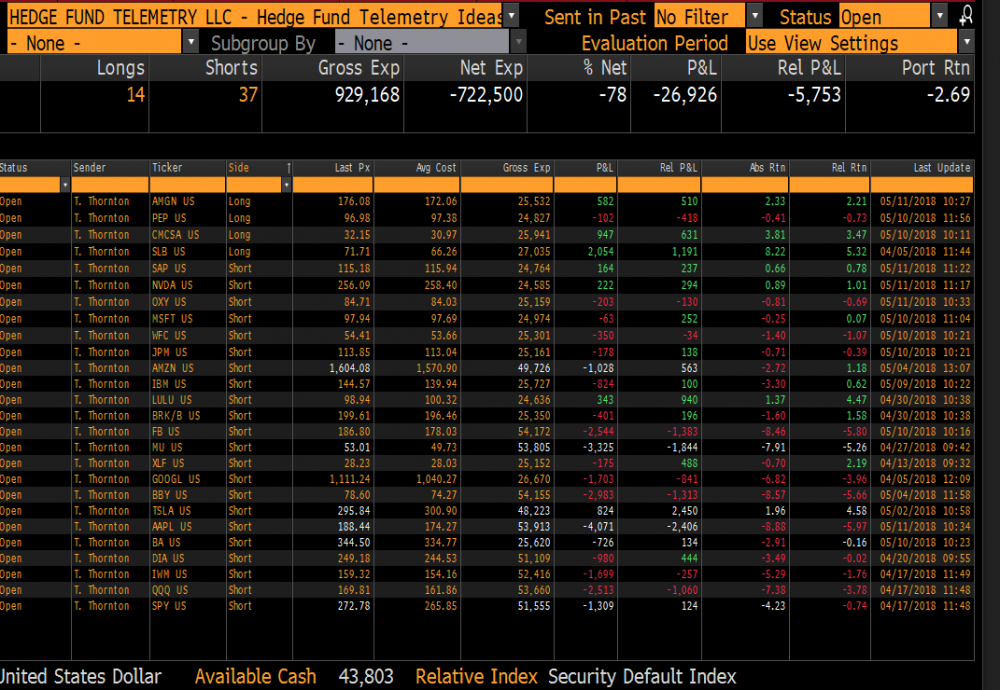
Hedge Fund Telemetry Trade Ideas
|
|
|
Trade Ideas: Not changes today. Seeing some expected weakness with some of the mega cap names I am short as they are trading below today's VWAP although some are still holding gains. It's a potential reversal sign. QQQ has support at 169 an SPY at 271.50. Breaking that support is needed for the shorts to show any signs of working.
|
|
|
|
|
|
|
|
|
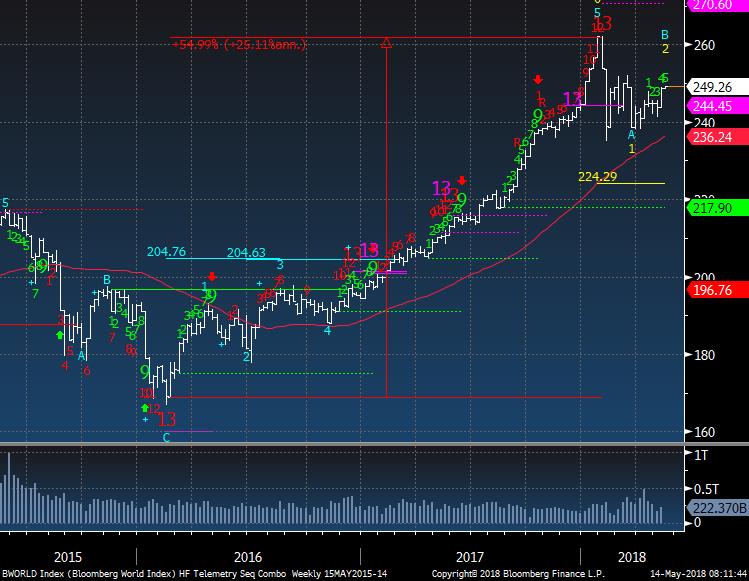
The weekly of the Bloomberg World Index has traded in a narrow range and bounced with a 2/B wave with now a downside wave 3 price objective of 224.
|
|
|
|
|
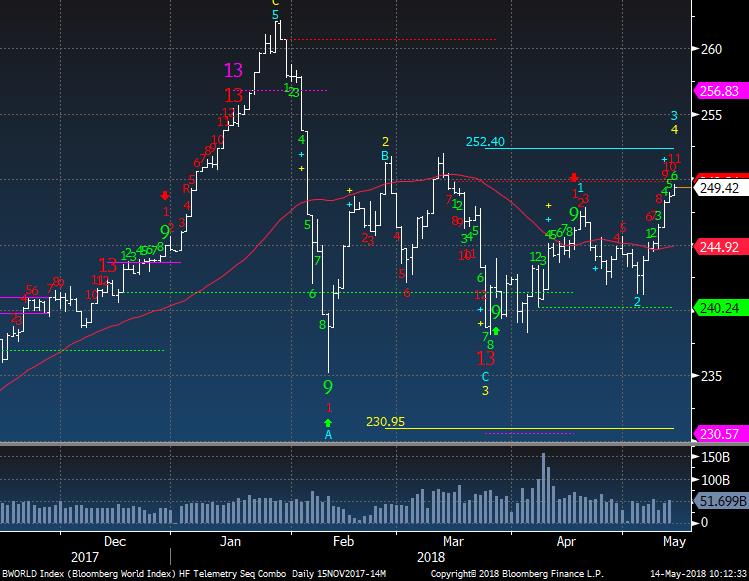
The daily shows it on day 11 of 13 with a red Countdown. The downside wave 5 price objective remains 230.95
|
|
|
|
|
|
|
|
|
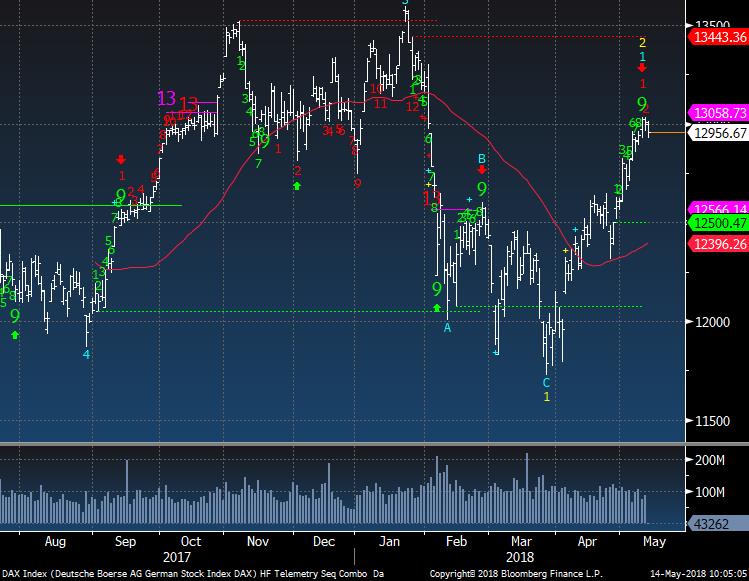
German DAX has stalled with the green Setup 9 as expected. I would not be surprised to see this start to decline back to the 12,500 level
|
|
|
|
|
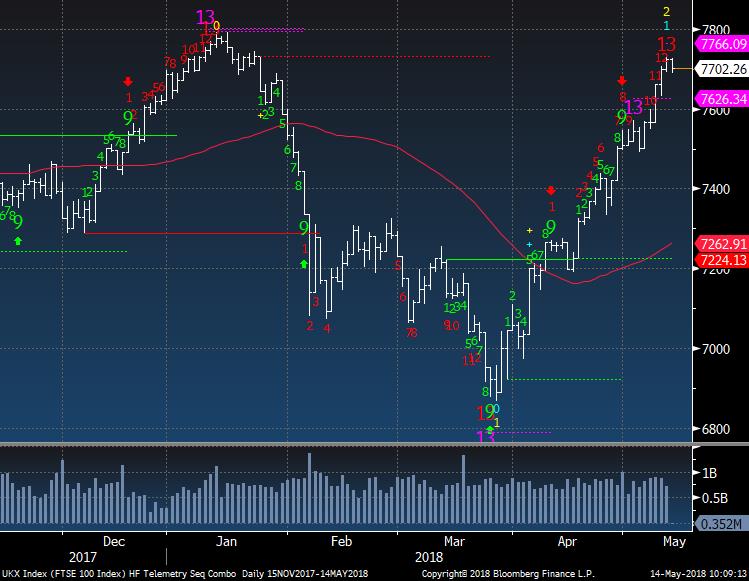
UK FTSE 100 had its upside Countdown and is down today. It will take a little more time to get the price flip down (a move under 4 previous closes)
|
|
|
|
|
|
|
|
|
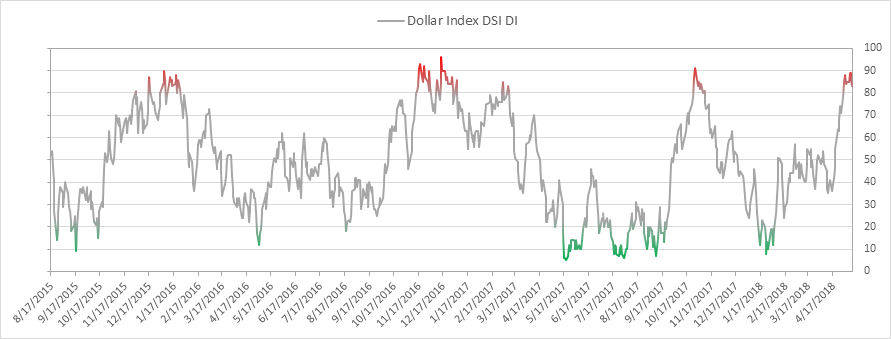
US Dollar bullish sentiment is at 83% and in the extreme zone. A pullback in sentiment to 60-70% is likely before a resumption higher
|
|
|
|
|
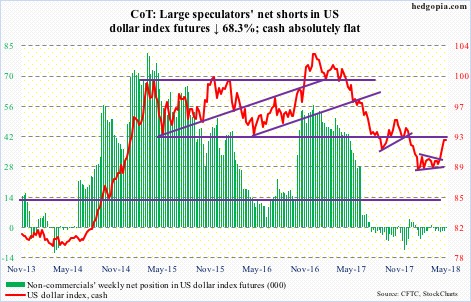
US Dollar COT data shows speculators flat to slightly net short. This is fuel for a higher USD
|
|
|
|
|
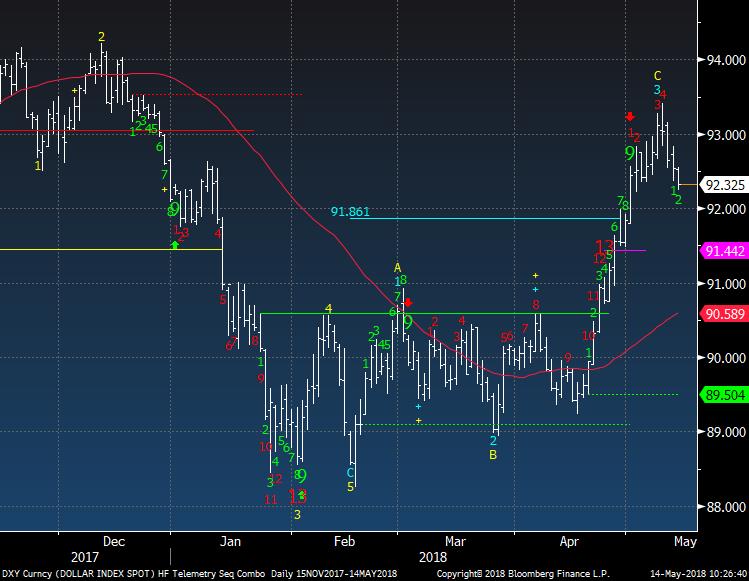
DXY US Dollar Index is consolidating. It will take a 13 day low off the recent high to lock in wave 4 and then I will get the computer generated upside wave 5 price objective.
|
|
|
|
|
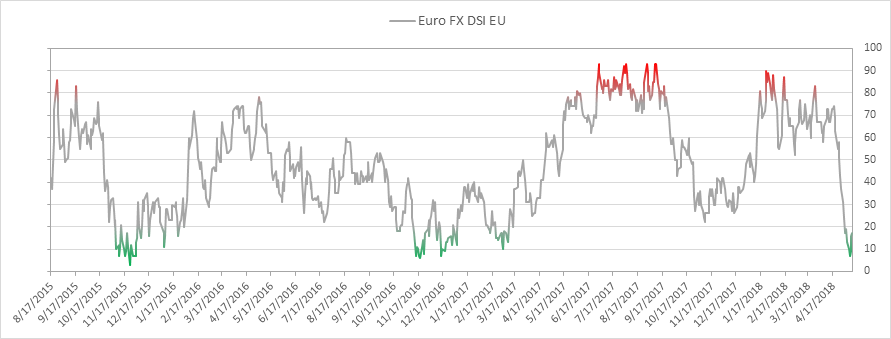
Euro bullish sentiment is at 17% up from the recent low of 7%
|
|
|
|
|
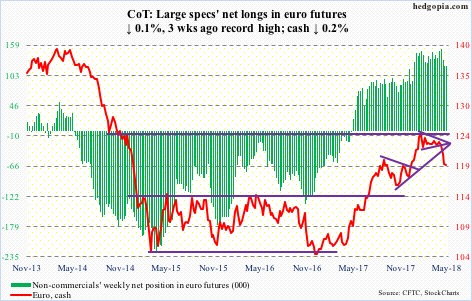
COT data for the Euro shows speculators still very long the Euro and this is fuel for a long squeeze lower.
|
|
|
|
|
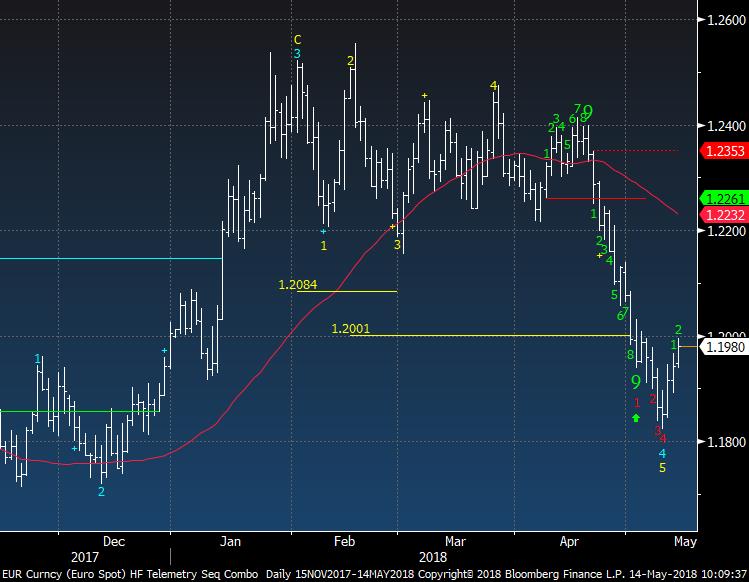
Euro bouncing with that extreme measure in sentiment but there still is a downside red Countdown on day 4 of 13. A little bounce then lower.
|
|
|
|
|
|
|
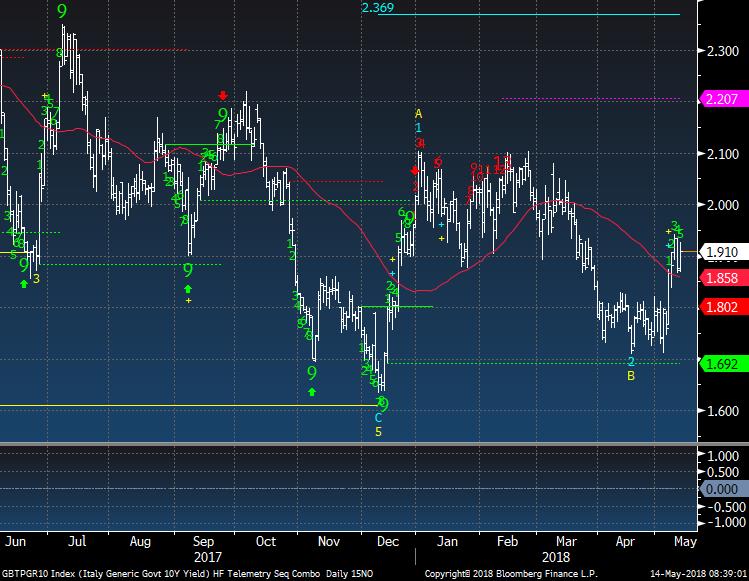
German and Italian 10 year yields
|
|
|
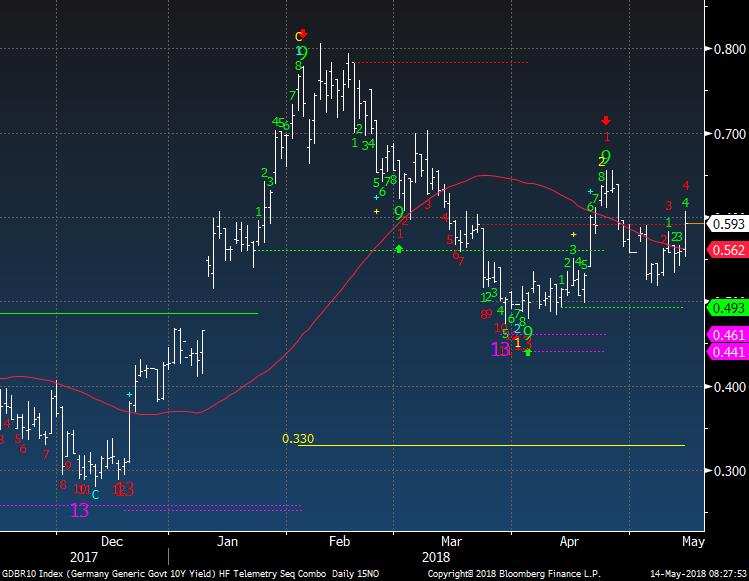
German 10 year yield bottomed in December after a downside pink and red Countdown 13 exhaustion, lifted and ended the move with a green Setup 9 backed off 35bps with another downside pink and red Countdown 13 and green Setup. It stalled with another green Setup 9 and now has made a higher low and has a red upside Countdown on day 4 of 13. This correlates with the upside Countdown on the US 10 year yield too.
|
|
|
|
|
Italian 10 year yield has chopped around and has some resistance above but there is an upside wave 3 price objective of 2.36%
|
|
|
|
|
|
|
|
|
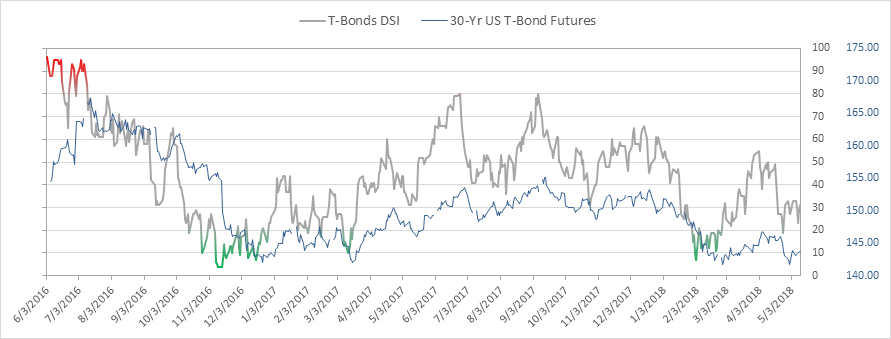
Bond bullish sentiment is at 31% and has been in a 5 point range for 2 weeks
|
|
|
|
|
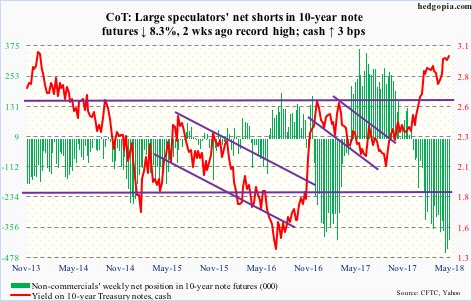
COT data for US 10 year positioning shows a very bearish set up. THIS is a risk to my thesis that we will see the 10 year above 3.10%. As I said I have some conflicting data.
|
|
|
|
|
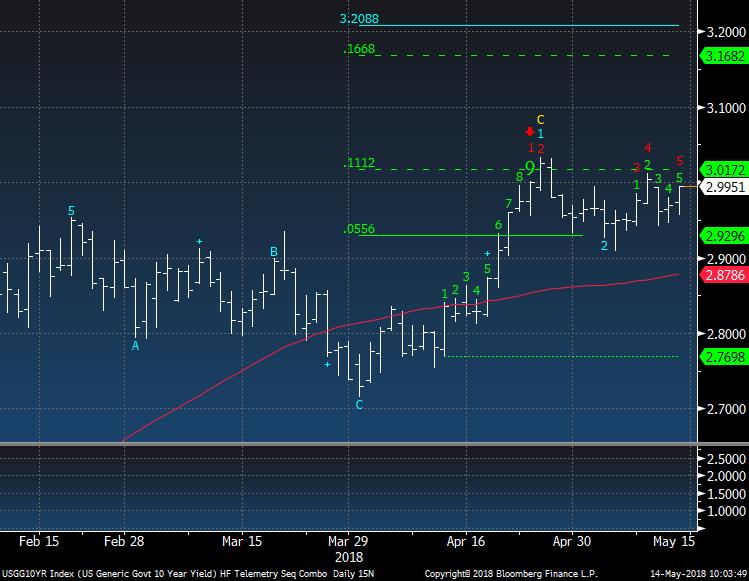
A close up of the US 10 year yield has an red upside Countdown on day 5 of 13. There are some upside targets on this chart. A break under 2.90% would delay the upside breakout but from an intermediate time frame I see rates higher.
|
|
|
|
|
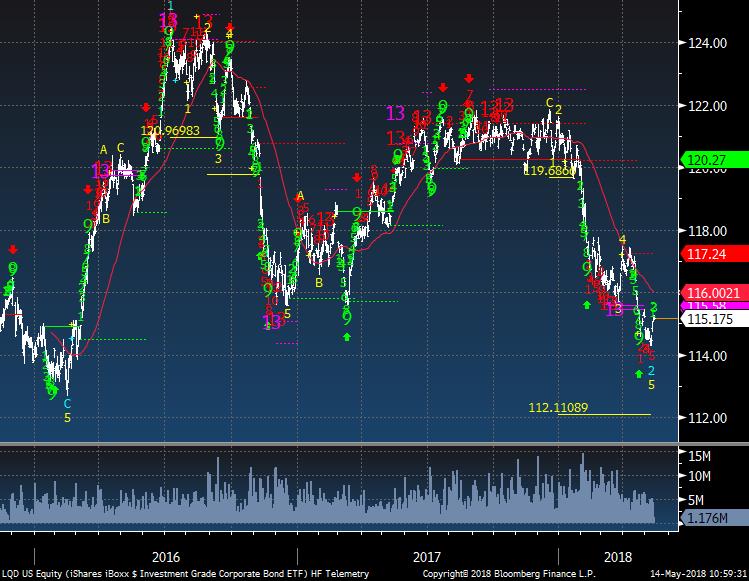
LQD Investment Grade ETF bounced slightly but the direction still looks lower. When this hit lows in February 2016 it bounced significantly with the equity markets. With equity markets at highs, could this bounce and take equities to much higher levels? It's a risk to my thesis that I ponder.
|
|
|
|
|
|
|
|
|
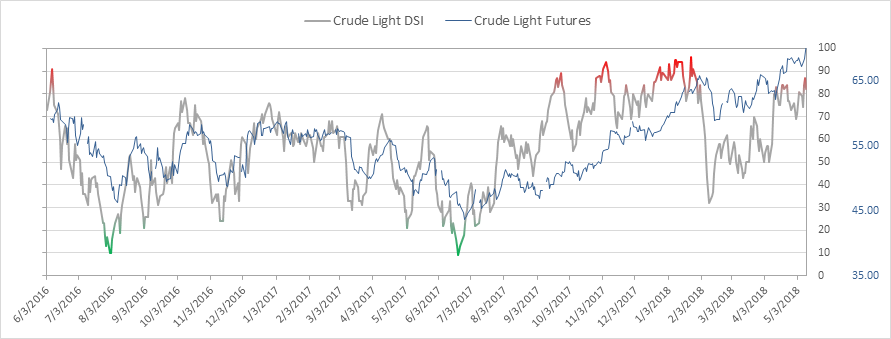
Crude bullish sentiment is at 82%, still in the extreme zone but I've seen tops with this reading above 90% many times.
|
|
|
|
|
WTI Crude Futures still is on day 9 of 13 with an upside Countdown. A little more upside left
|
|
|
|
|
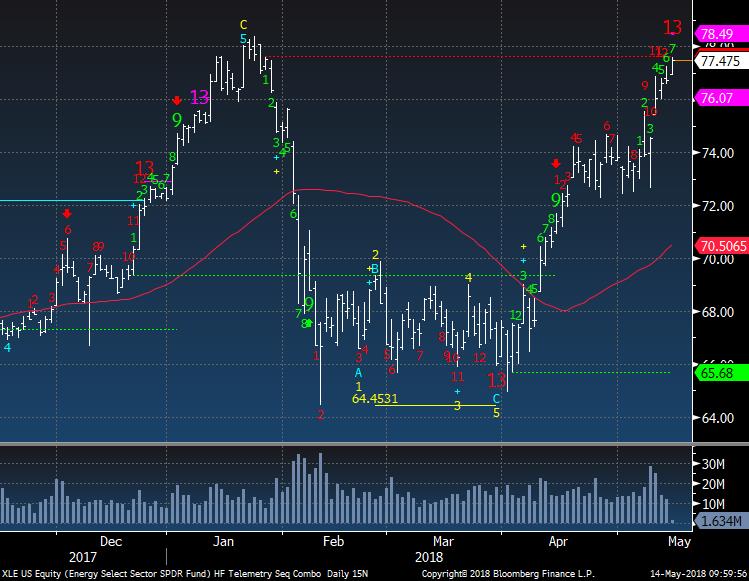
XLE ETF is the most watched and traded energy ETF and it had an upside 13 exhaustion
|
|
|
|
|
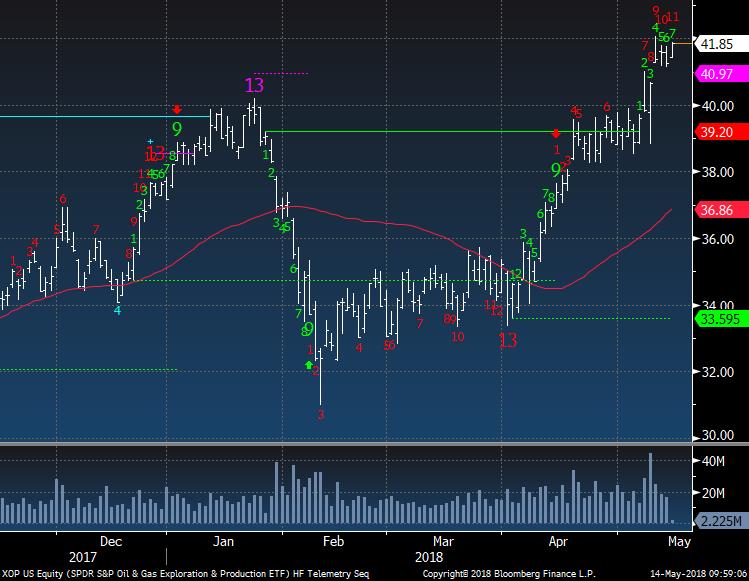
XOP oil and gas ETF is on day 11 of 13 with its Countdown. Forward this to Jeff Gundlach as he's been bullish on XOP. A few more days with this rally. Start taking some profits in the group
|
|
|
|
|
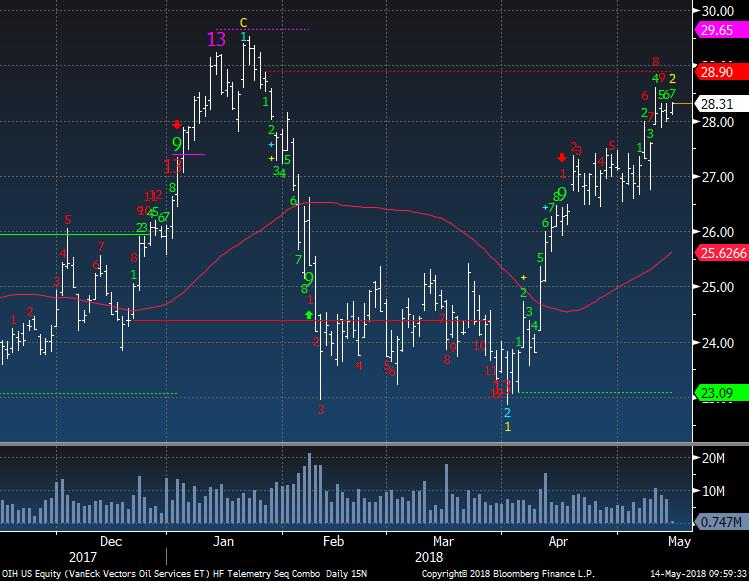
OIH Oil Service is only on day 9 of 13 with its Countdown. FYI I turned bullish on Energy with the downside 13 exhaustions seen across the board in energy back in late March
|
|
|
|
|
|
|
|
|
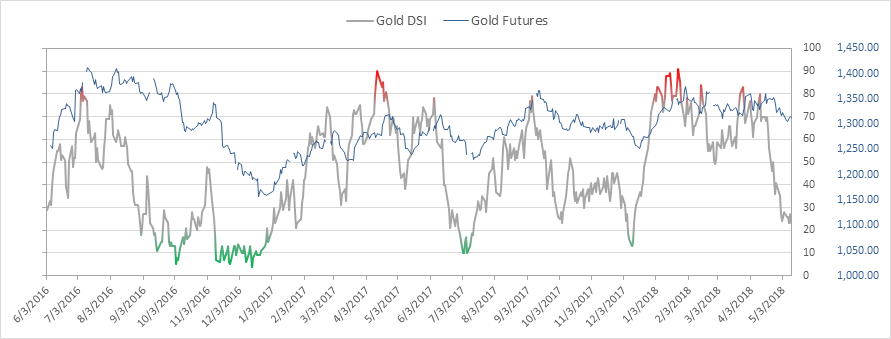
Gold bullish sentiment is at 23% and a low for this cycle. It can and likely will go to 10% or lower
|
|
|
|
|
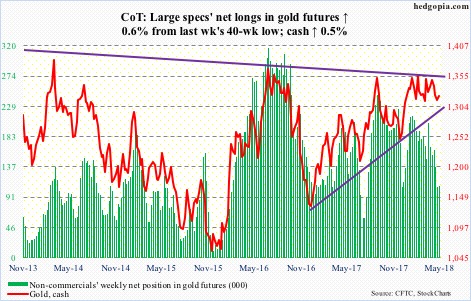
COT data for Gold shows speculators selling down long exposure last week.
|
|
|
|
|
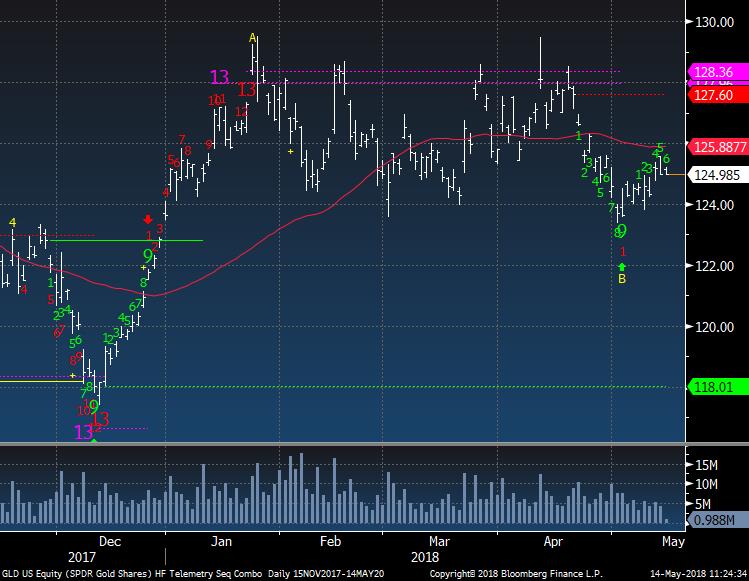
GLD has some resistance above and I recently tried to buy both GLD and SLV down here but moved to the sidelines without much of a loss. I've decided I'd rather sit and wait for a better signal either ultra low sentiment or a downside exhaustion. The last long trade was the 13 on the lows to the 13 on the highs earlier in the year with the backdrop of very low sentiment to high sentiment.
|
|
|
|
|
|
|
DEMARK SCREENS - Daily, Weekly, Monthly Upside/Downside Exhaustion Signals
|
|
|
Daily/Weekly DeMark upside/downside exhaustion signals (Sequential) Weekly updated on Monday's. Price flips occur when a stock closes higher/lower than four previous closes.
S&P 1500 Universe:
DAILY UPSIDE 13: AES, AGYS, BR, CRM, EXR, GEF, HCP, MED, NJR, UDR
DAILY DOWNSIDE 13: ADT, XL
DAILY UPSIDE WITH PRICE FLIP REVERSAL DOWN: AGYS, ARE, EAT, FRT, MAA, UDR
DAILY DOWNSIDE WITH PRICE FLIP REVERSAL UP: DLTR, INGR, T, XRAY
Updated: 5/7/18
WEEKLY UPSIDE 13: AMZN, BRO, FLIR, LH, LYV, TJX
WEEKLY DOWNSIDE 13: FTK
Updated: 5/1/18
MONTHLY UPSIDE 13: CTXS, HSII, SYK, UFCS, WBS
MONTHLY DOWNSIDE 13: AKRX, HLX, HVT, MNK
Euro Stoxx 600 Universe:
DAILY UPSIDE 13: AENA SM, AZN LN, CAST SS, FGR FP, LSE LN, REL LN, SMDS LN, SWMA SS
DAILY DOWNSIDE 13: ENX FP, RYA ID
DAILY UPSIDE WITH PRICE FLIP REVERSAL DOWN: AIR FP, DWNI GR, EOAN GR, MHG NO, SAN FP
DAILY DOWNSIDE WITH PRICE FLIP REVERSAL UP: NONE
Updated: 5/7/18
WEEKLY UPSIDE 13: ATL IM, BKG LN, COLOB DC, DWNI GR, KINVB SS, LEG GR, RACE IM, STL NO
WEEKLY DOWNSIDE 13: BMPS IM, VWS DC
Updated: 5/1/18
MONTHLY UPSIDE 13: HNR1 GR, HWDN LN, MHG NO
MONTHLY DOWNSIDE 13: AGK LN
|
|
|
Unsubscribe me from Hedge Fund Telemetry
Hedge Fund Telemetry LLC, P.O. Box 4675, Greenwich, CT 06861, United States
CONFIDENTIALITY NOTE and DISCLAIMER: This message is for the named person's use only. It may contain confidential, proprietary or legally privileged material. No confidentiality or privilege is waived by any accidental or unintentional transmission. If you receive this message in error, please immediately delete it and all copies of it from your system, destroy any hard copies and notify the sender. You must not, directly or indirectly, use, disclose,
distribute, print or copy any part of this message if you are not the intended recipient. Hedge Fund Telemetry LLC. cannot guarantee the confidentiality of the material transmitted; therefore, information of a sensitive or confidential nature should not be transmitted. There is risk in trading markets. Hedge Fund Telemetry LLC reports are based on information gathered from various sources and believed to be reliable, but are not guaranteed as to accuracy and completeness. The information is subject to change without notice and Hedge Fund Telemetry LLC has no obligation to provide any updates or changes. Hedge Fund Telemetry LLC is providing this data for informational and educational purposes and does not believe that it is sufficient to base an investment decision on. This information should not be regarded as a solicitation or recommendation of any particular security or to engage in any trading strategy. One should always check with your licensed financial
advisor to determine suitability of any investments.
|
|
|
|
|