|
|
|
|
|
|
|
|
The definition of "Hot Mess" is "a person or thing that is spectacularly unsuccessful or disordered, especially one that is a source of peculiar fascination." This is my view of the Fed as they are not independent nor data dependent but rather only market dependent. For the Fed and Powell to shift policy 180 degrees when the markets start to wobble is an embarrassment. What they have now done is create a mini bubble from the December lows. The market has gone up 20% and now is up 12% YTD but the policy of being patient should be reversed again but they probably won't change this direction. Tomorrow afternoon we'll know more.
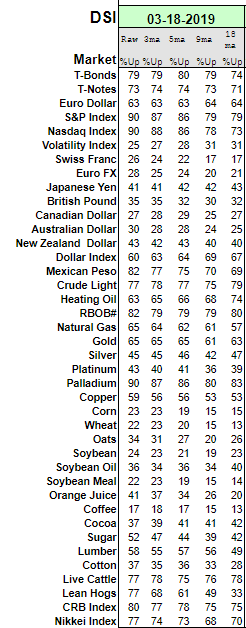
I do know that bullish sentiment for the S&P and Nasdaq is 90% for both and this is extreme. This compares with the 4% at the lows in December. The secondary DeMark Countdowns are getting near the 13th day and some indexes and many stocks have already been triggering the 13's. Transports are fading as are utilities after a straight up run.
China trade headlines will continue to serve as "tape bombs" on both sides. "China backs off" "US China in final stages" bla bla bla headlines like this only chop up short term traders. I am still very cautious especially with the extreme sentiment. Take down some risk, raise stops, have a decent % of cash, buy some puts, or short. Markets used to like Fed days but Powell's Fed hasn't had such a good record so even more reason to be cautious ahead of tomorrow.
|
|
|
|
|
Here's the list of sentiment. I'm told by new developers they have recoded all charts and the site will be up in next couple days
|
|
|
|
|
|
|
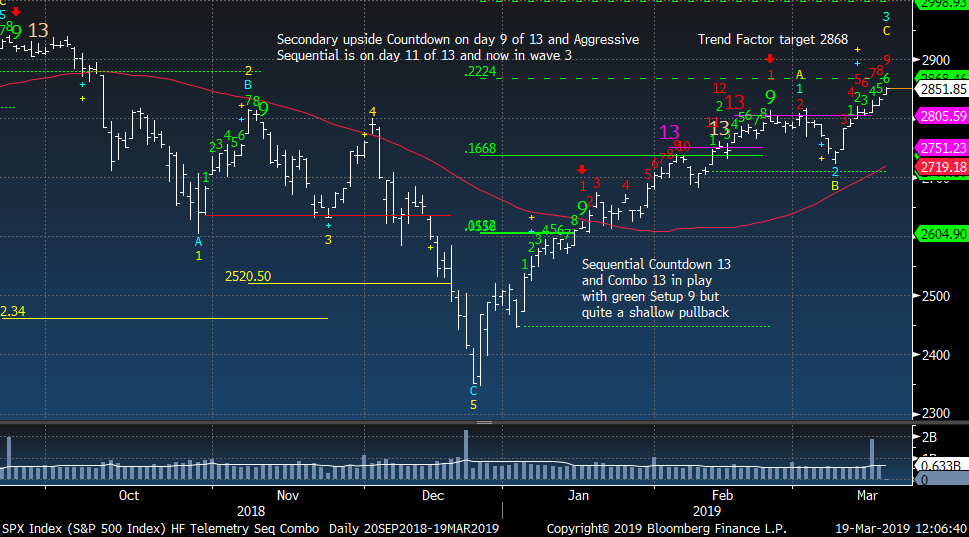
SPX daily only on day 9 of 13 with upside Countdown
|
|
|
|
|
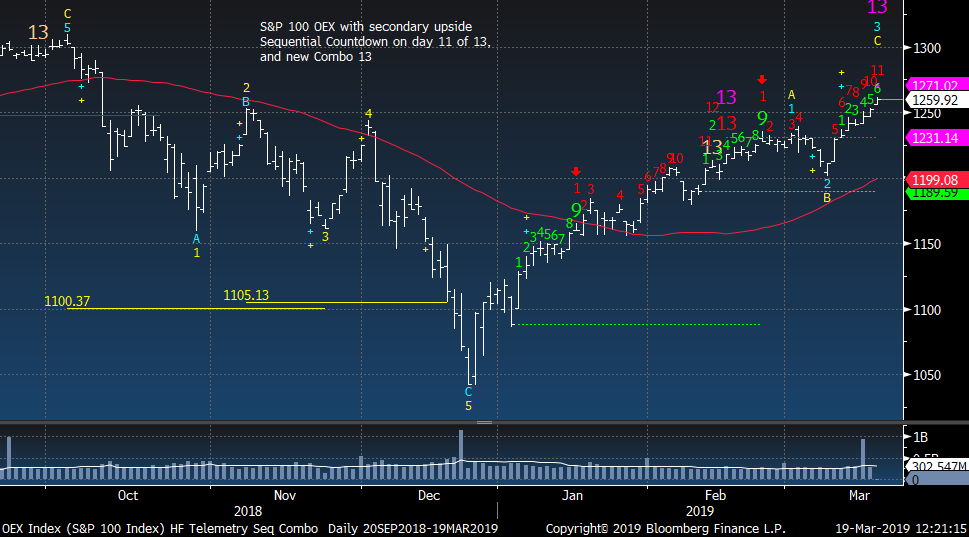
SPX 100 with Combo 13 and on day 11 of 13. This is the meat of the market
|
|
|
|
|
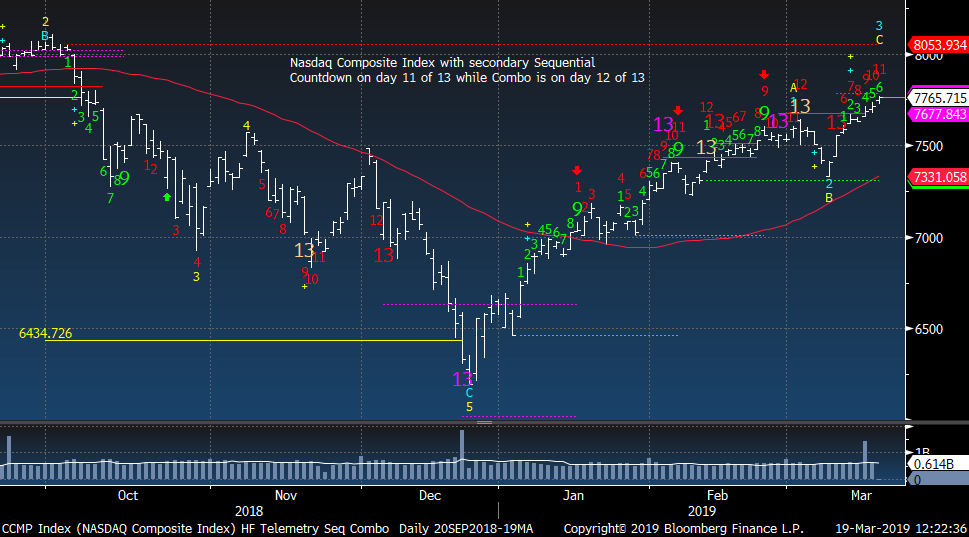
Nasdaq Composite Index on day 11 of 13 with Sequential Countdown
|
|
|
|
|
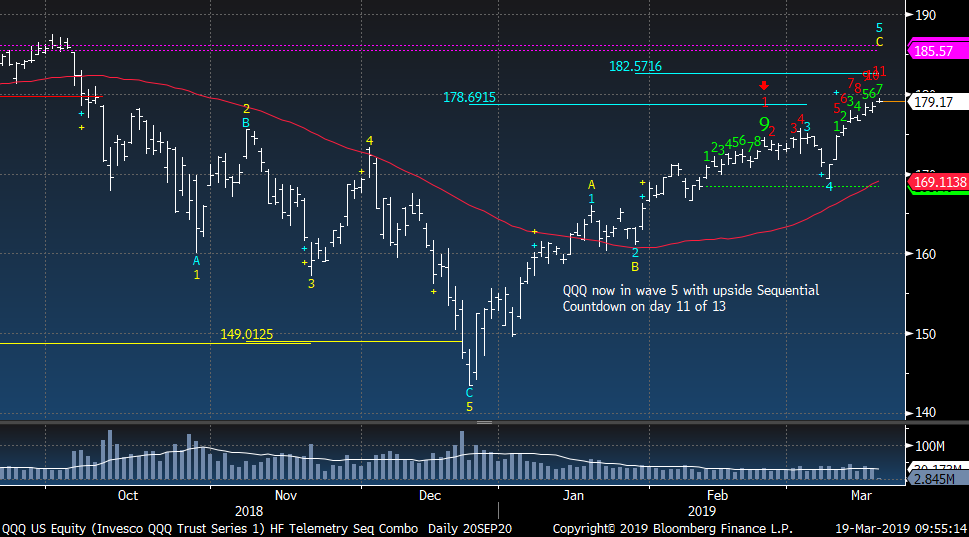
QQQ daily on day 11 of 13 with upside Sequential Countdown
|
|
|
|
|
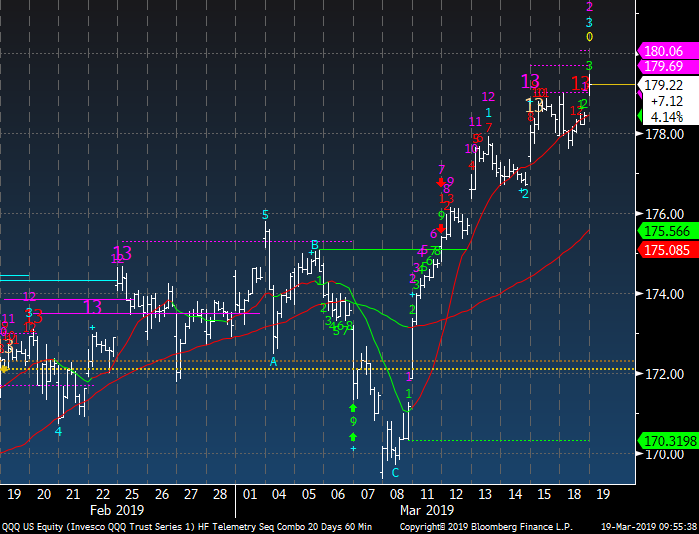
QQQ 60 minute tactical time frame should dip here
|
|
|
|
|
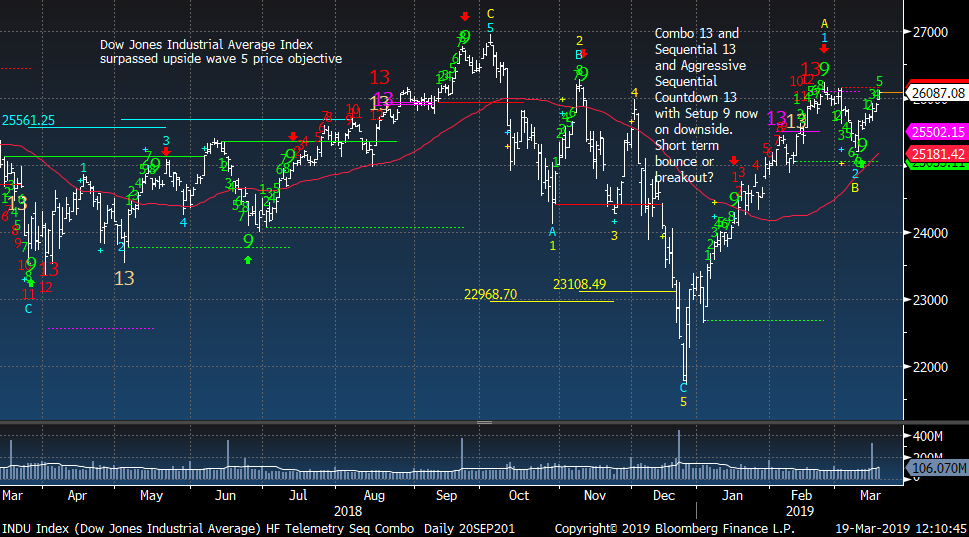
Dow Jones Industrial Average at resistance
|
|
|
|
|
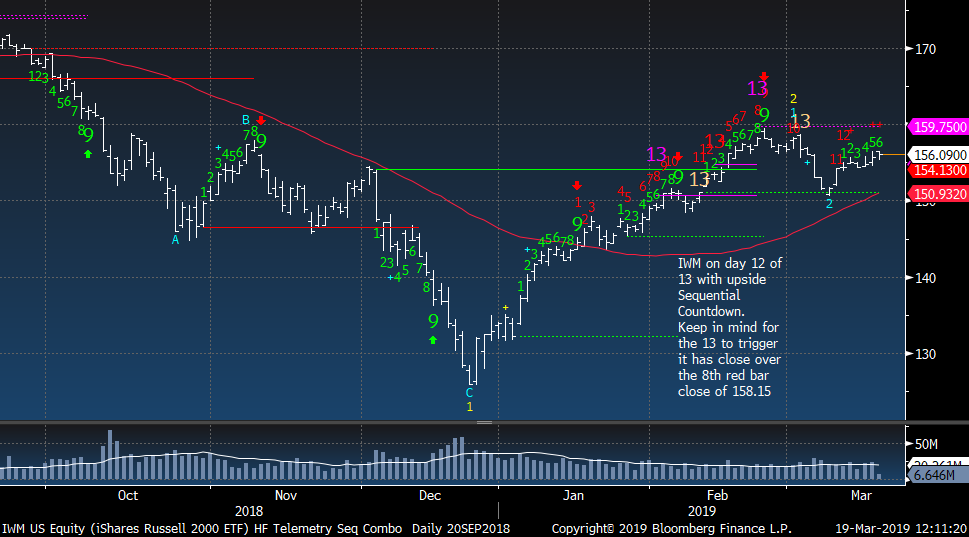
IWM Russell 2000 still sideways
|
|
|
|
|
|
|
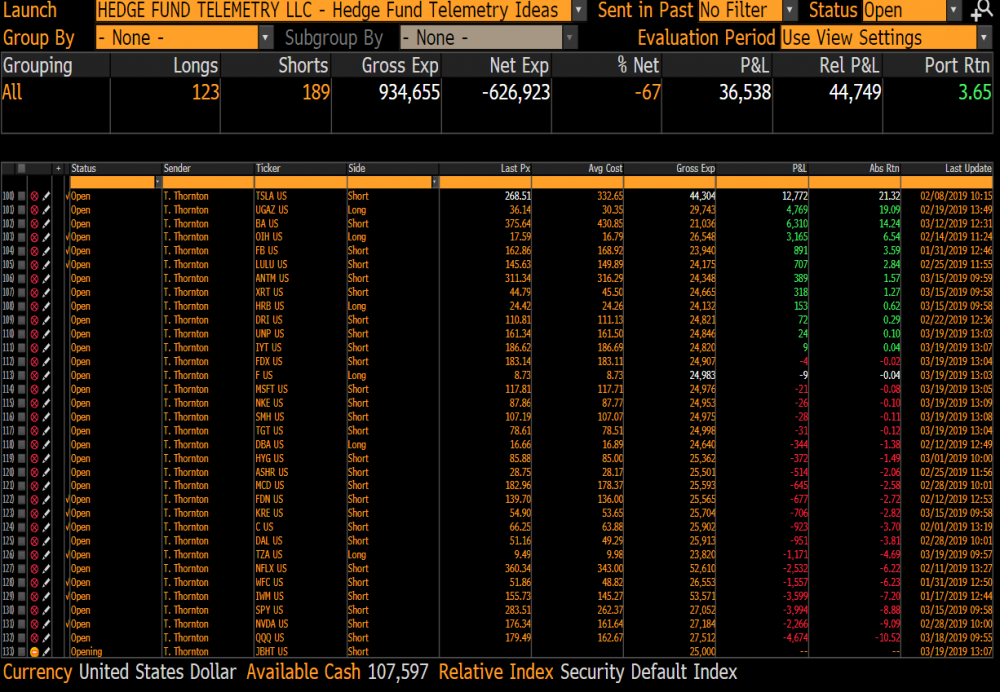
Hedge Fund Telemetry Trade Ideas
|
|
|
Trade Ideas Sheet
Trade Ideas Changes: ALL 2.5% SIZE. ADDED LONG: F (FORD). ADDED SHORT: NKE, SMH, JBHT, IYT, MSFT, TGT, FDX, UNP
|
|
|
|
|
|
|
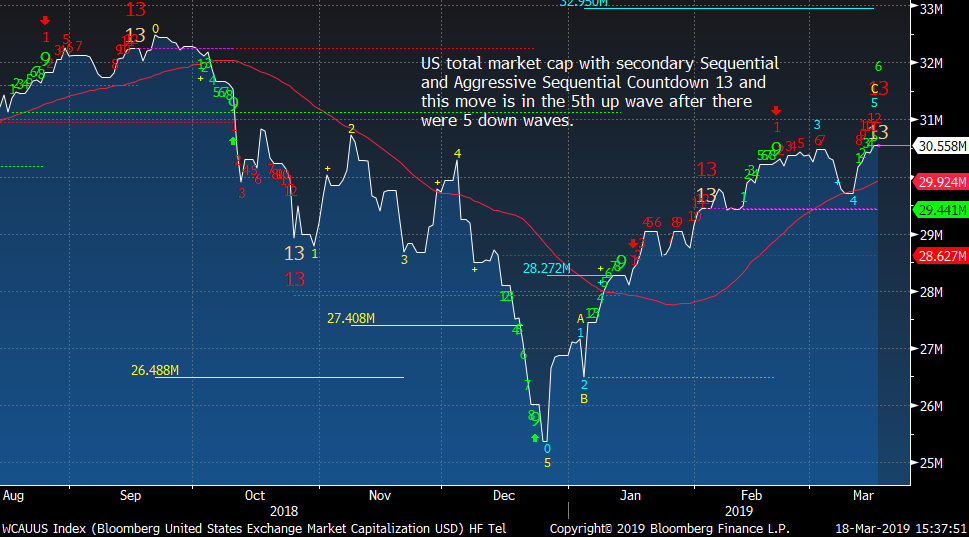
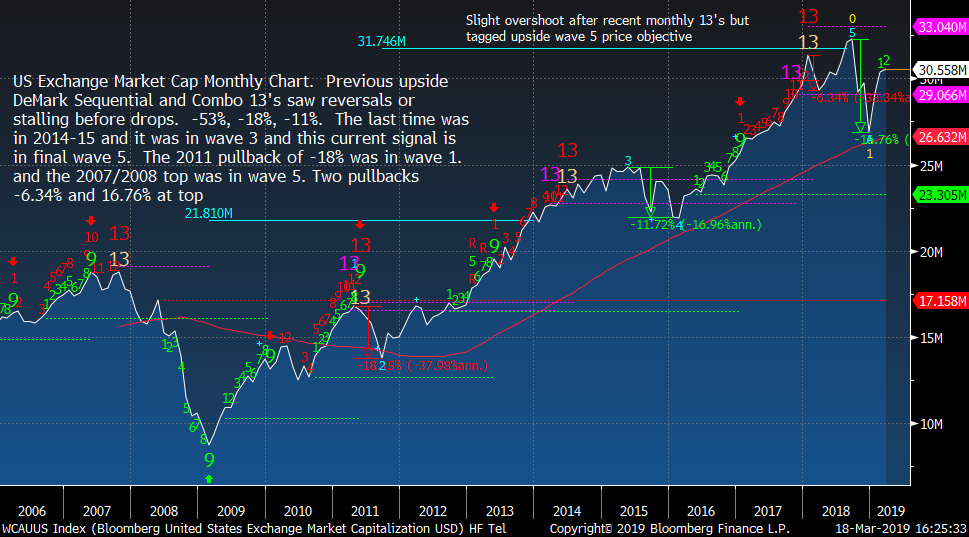
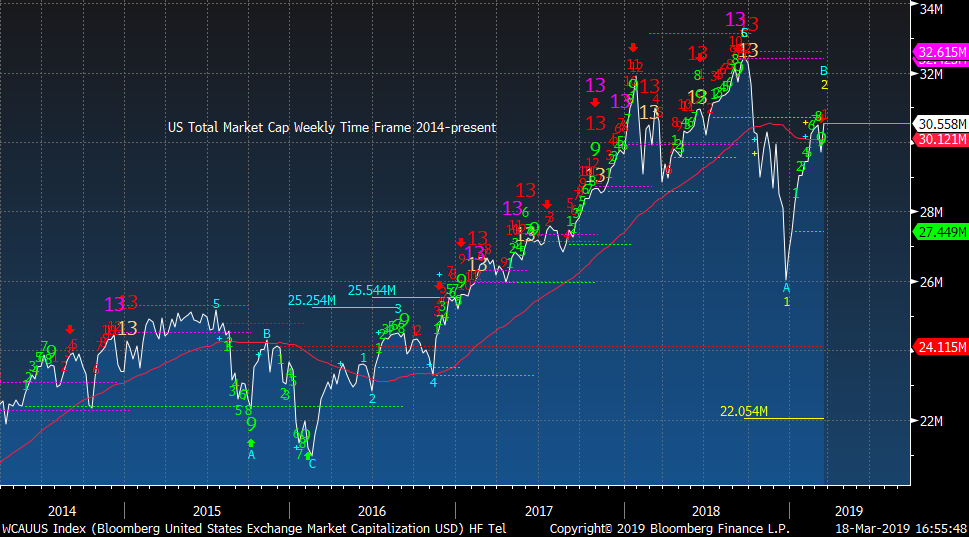
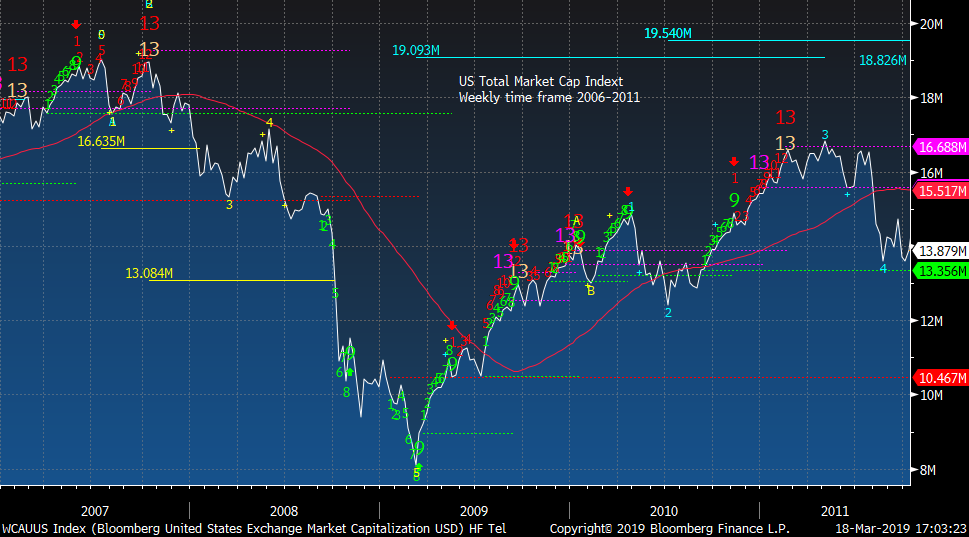
US Total Market Cap Index - Toppy on daily, weekly, and monthly time frames
|
|
|
US Total Market Cap Index daily with upside Countdown 13's
|
|
|
|
|
|
|
|
|
|
|
|
|
|
|
|
|
|
|
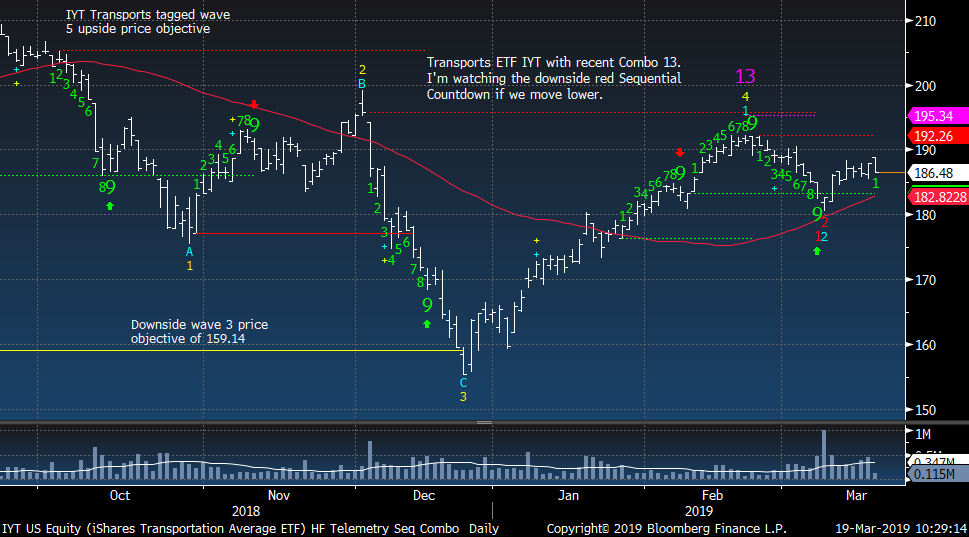
Planes, Trains, and Automobiles - Transports look lower
|
|
|
IYT Transports at support and I expect this to continue lower
|
|
|
|
|
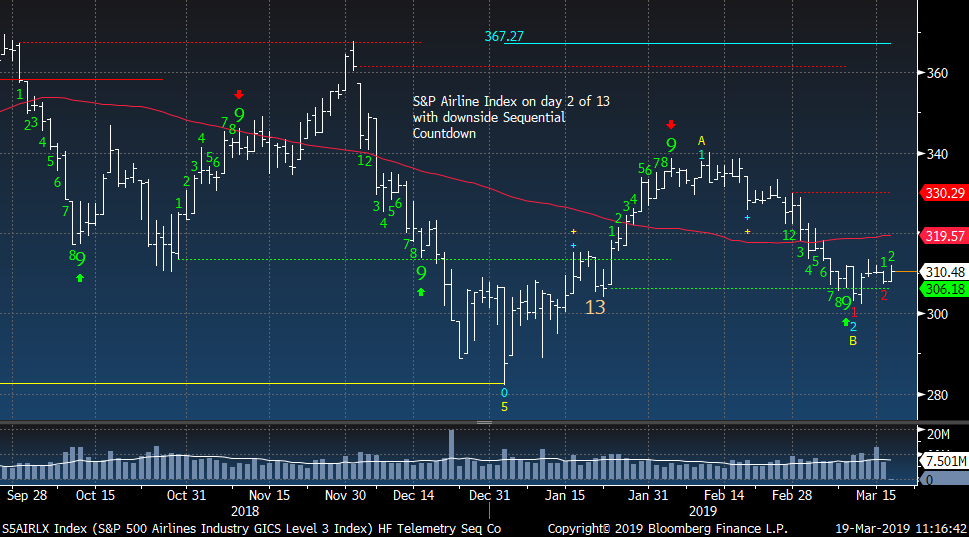
Airlines at support after a decent move down so far
|
|
|
|
|
|
|
|
|
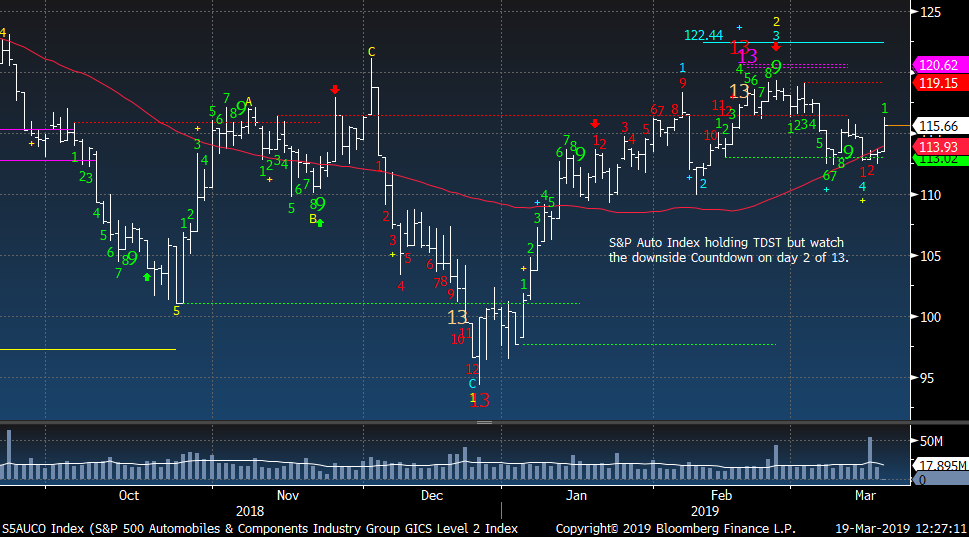
Autos held support but not sure it will in coming days
|
|
|
|
|
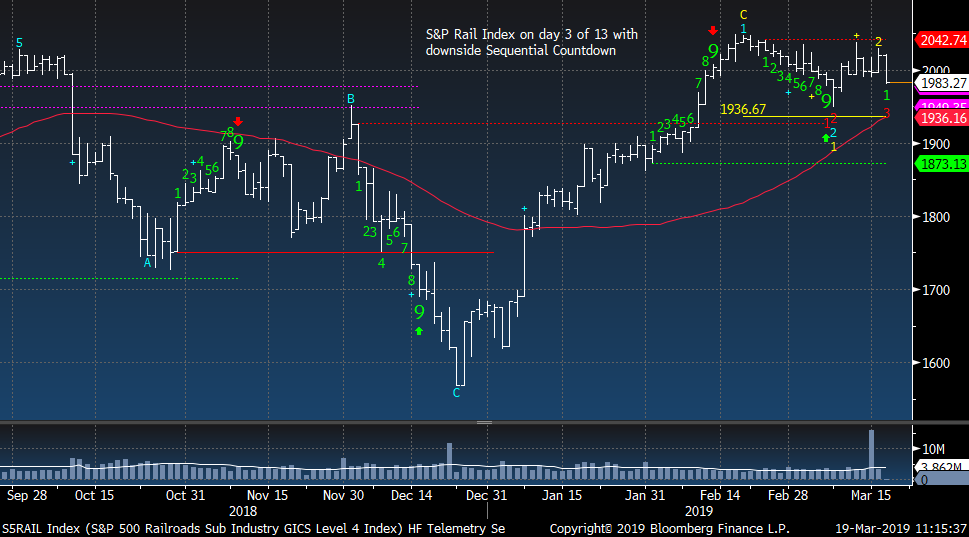
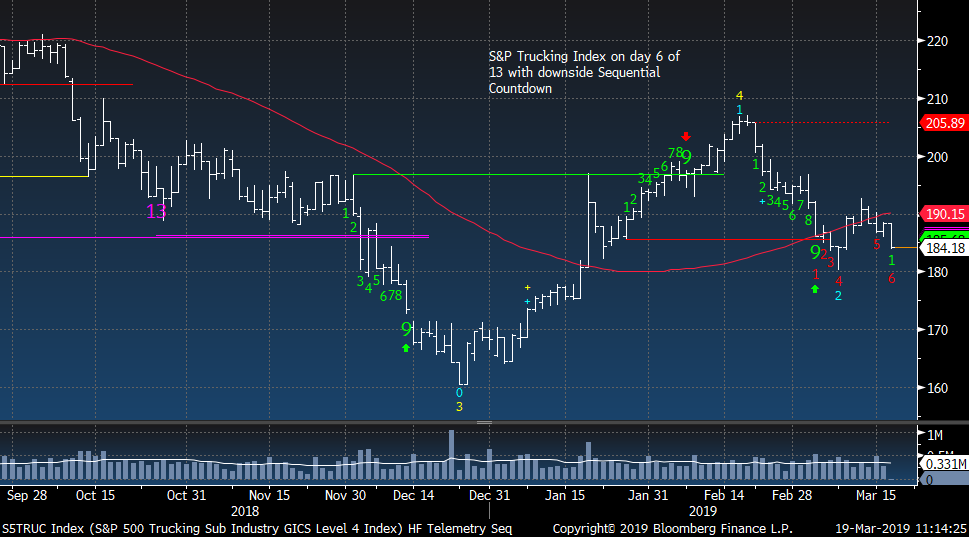
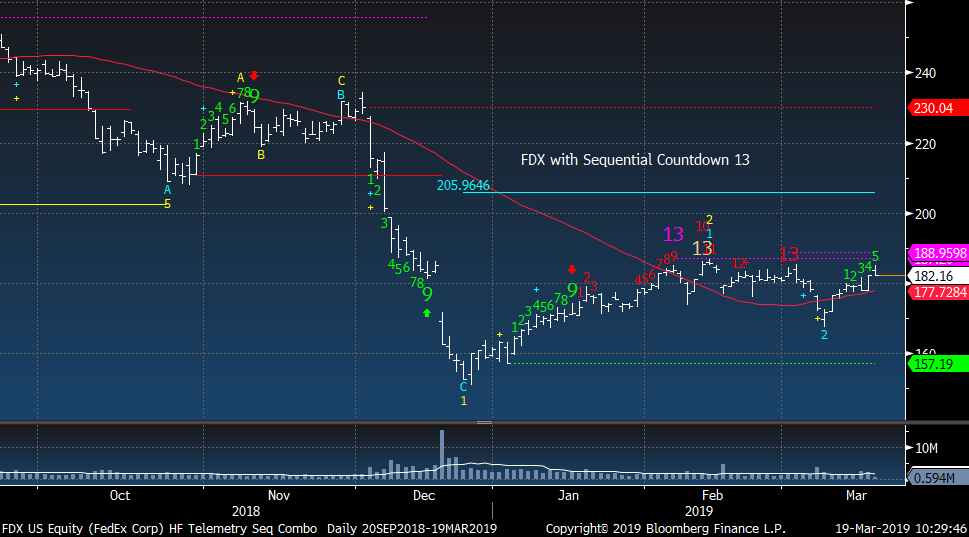
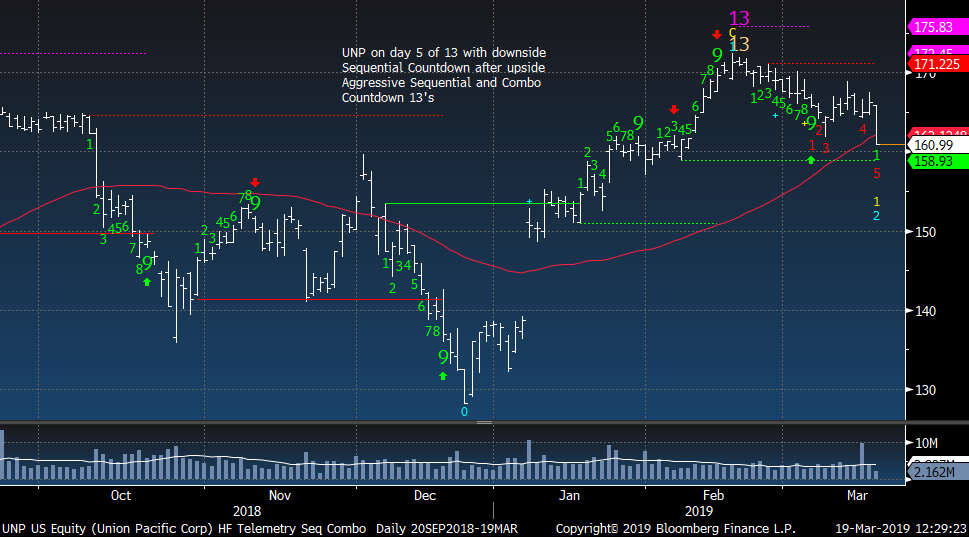
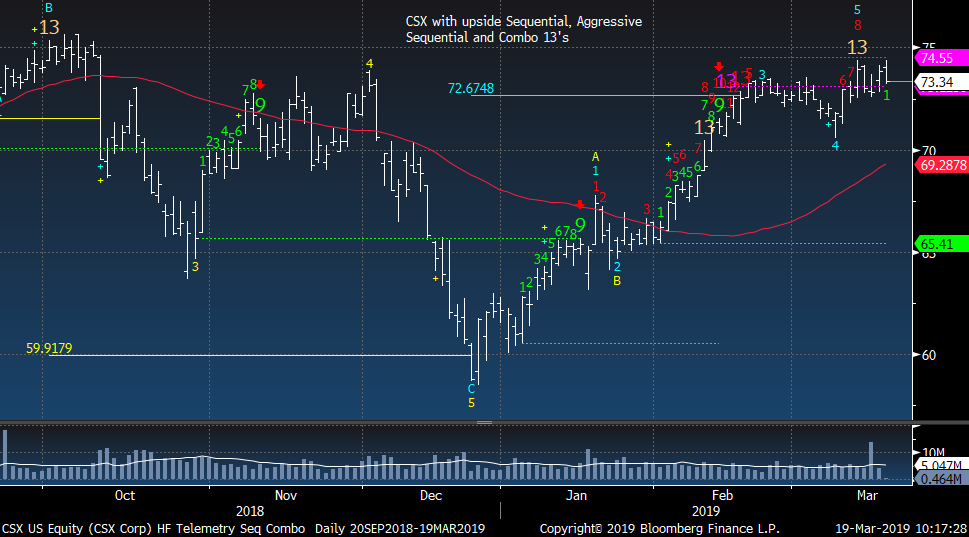
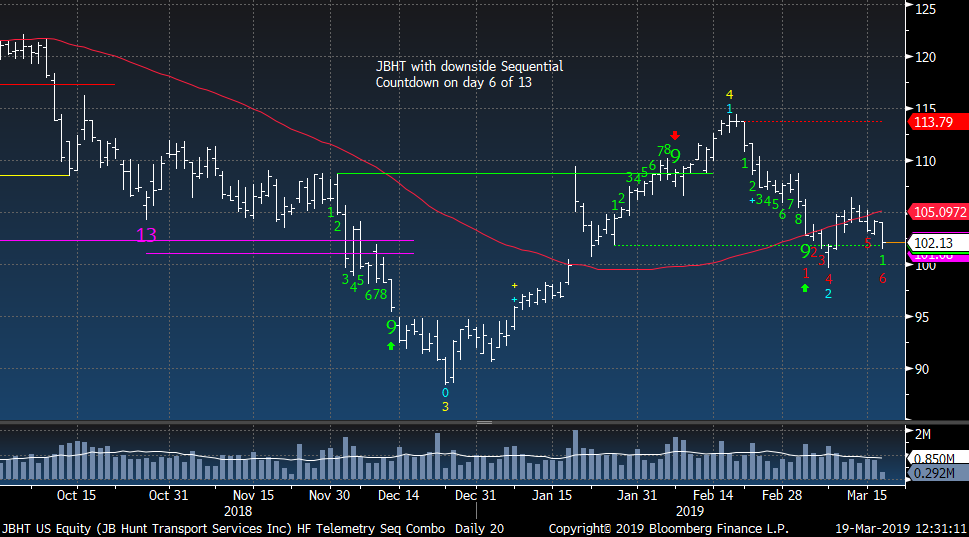
Truckers with downside Countdown in progress... Jackknife ahead
|
|
|
|
|
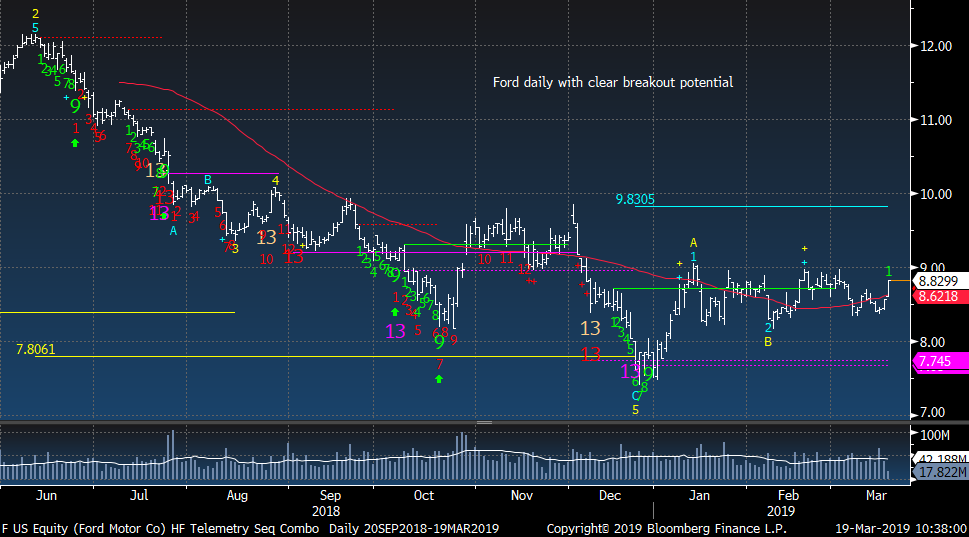
Ford daily looks like it could breakout
|
|
|
|
|
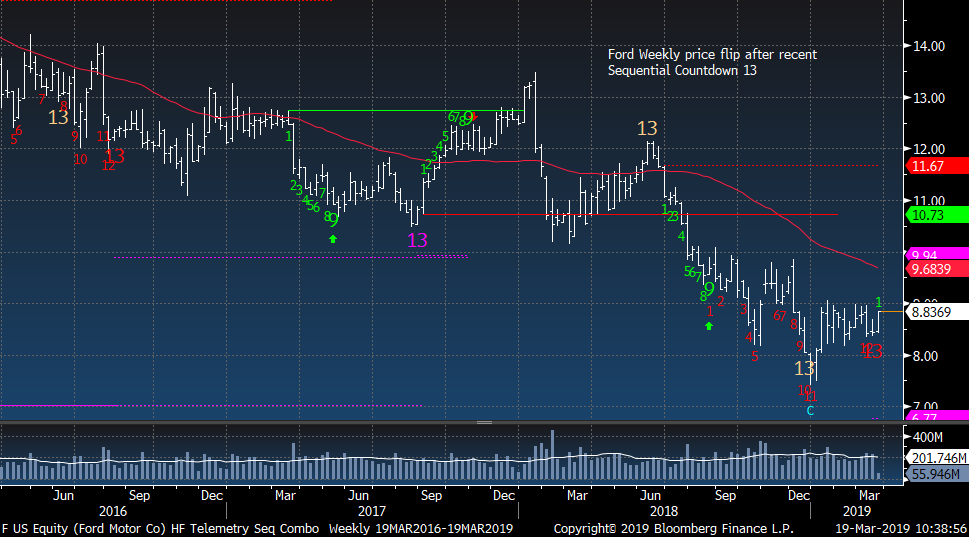
Ford weekly with recent Countdown 13
|
|
|
|
|
|
|
|
|
|
|
|
|
|
|
|
|
|
|
|
|
|
|
|
|
|
|
|
|
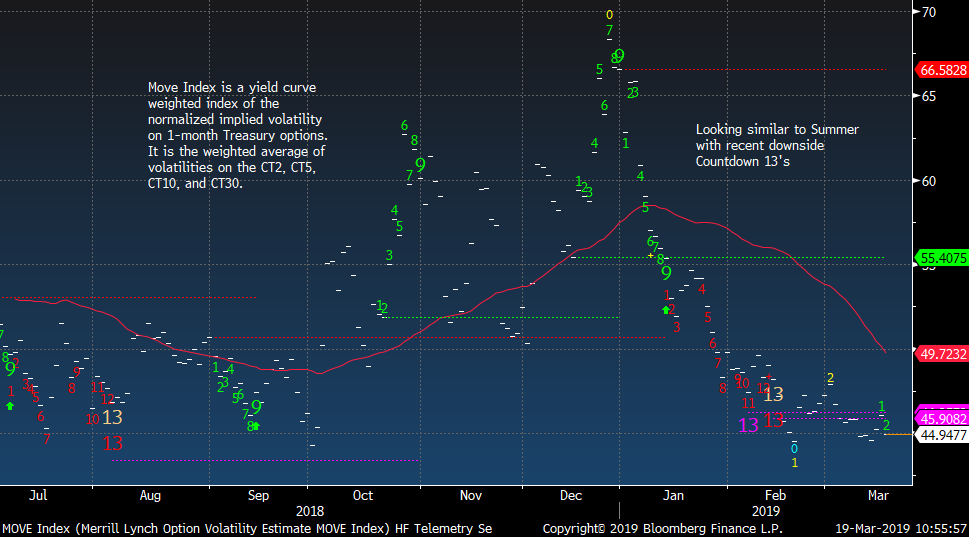
MOVE Index is the VIX for Bonds. Very calm here but probably not for long
|
|
|
|
|
|
|
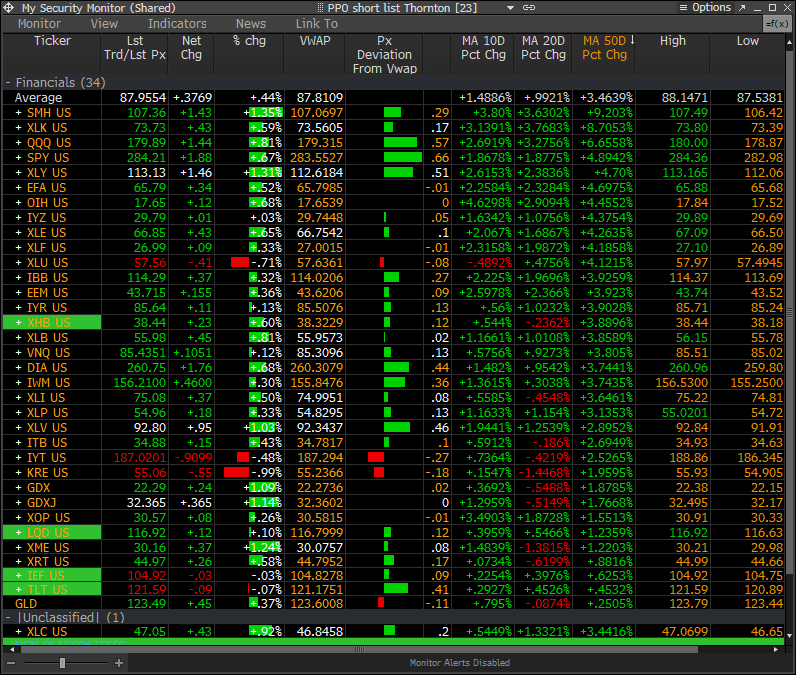
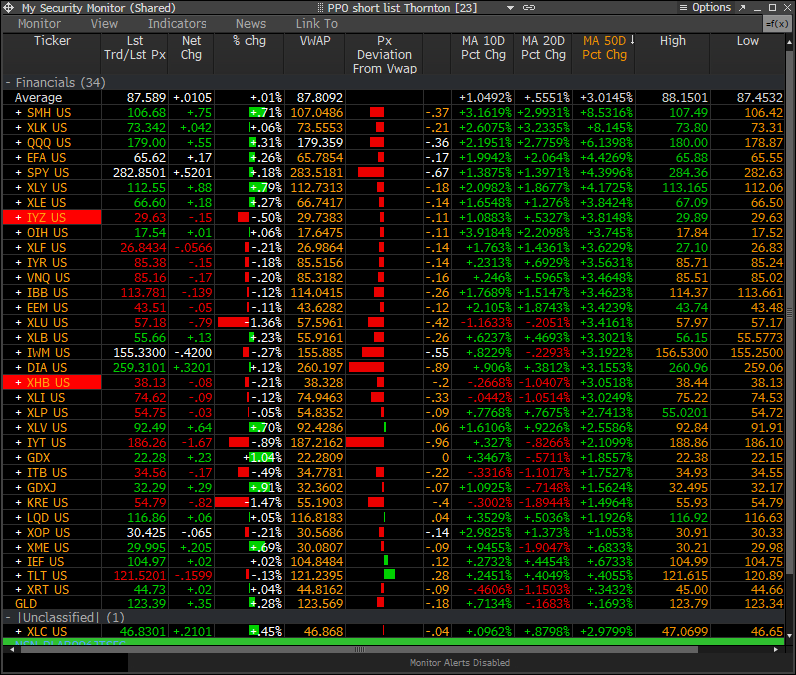
PPO Monitor - Percentage Price Oscillator
|
|
|
The PPO Monitor is a proprietary monitor developed to force rank Indexes, Sectors, and Stocks. It ranks top down by strongest to weakest by percentage above/below the 50 day moving average. Shorter term signals can be seen when the 10 and 20 day moving averages turn up (green) or down (red) which often are followed by the 50 day moving average. This is useful to watch for historically overbought/oversold percentage above/below the 50 day moving average. It is non correlated with the DeMark Indicators however we have found upside/downside exhaustion signals often occur when something rises to the top or drifts to the bottom of the monitor - increasing the timing aspect. We share this monitor with clients with Bloomberg Terminals. An added feature is that each market/ETF can be expanded with each component force ranked in the same way. A couple other features include price deviation from intraday VWAP (useful for intraday reversals) and new 20 day highs/lows on right side. Please inquire if you would like to be permissioned to use the PPO Monitor.
Today's highlights: Before and after the China walking back trade. One of the reasons I use VWAP to spot early weakness and strength
|
|
|
|
|
|
|
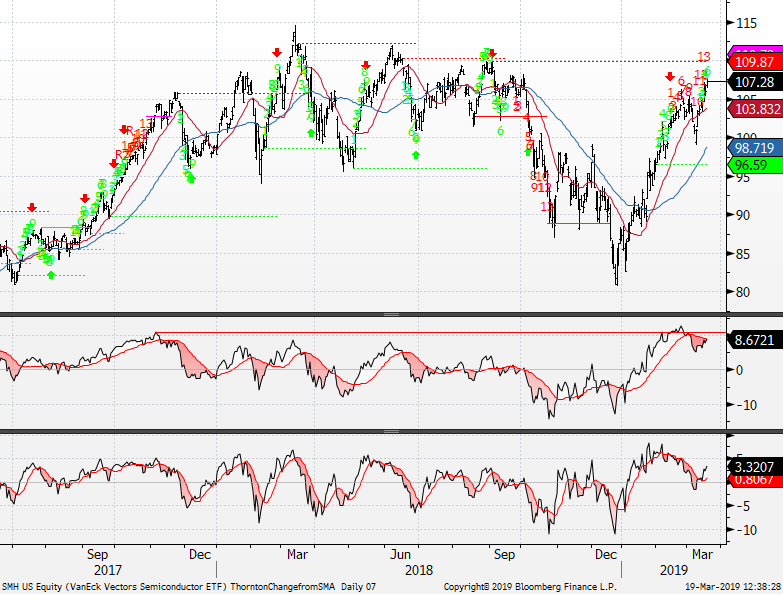
The following chart shows the Percentage Price Oscillator (50 day moving average) in action. SMH Semiconductors has a Countdown 13 and was at the top of the PPO monitor but it was 9% above the 50 day (middle indicator with red line) and that's overbought
|
|
|
|
|
|
|
Bloomberg Automated Technical Pattern Recognition Screens
|
|
|
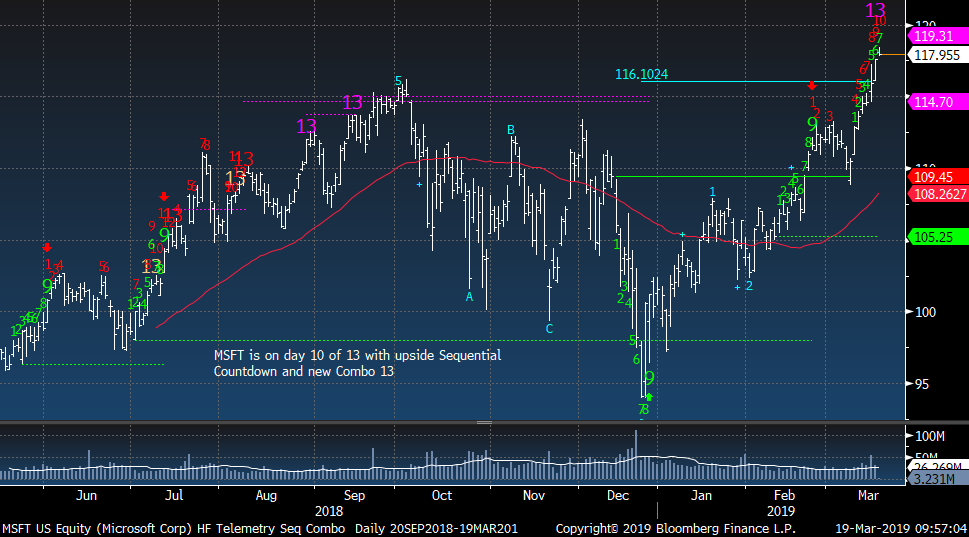
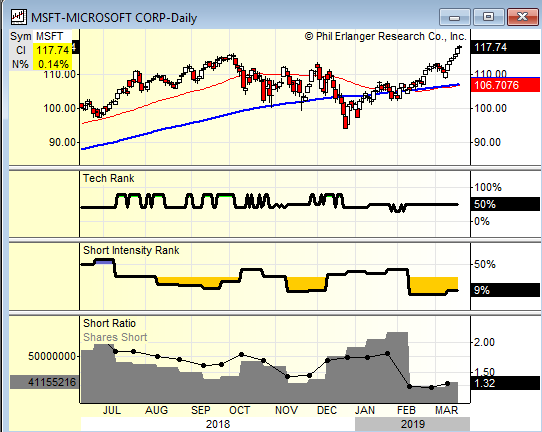
MSFT on day 10 of 13 with upside Countdown while there is a Combo 13 today. Very low short interest here with Short Ratio of 1.32 cut nearly cut in half in last month
|
|
|
|
|
|
|
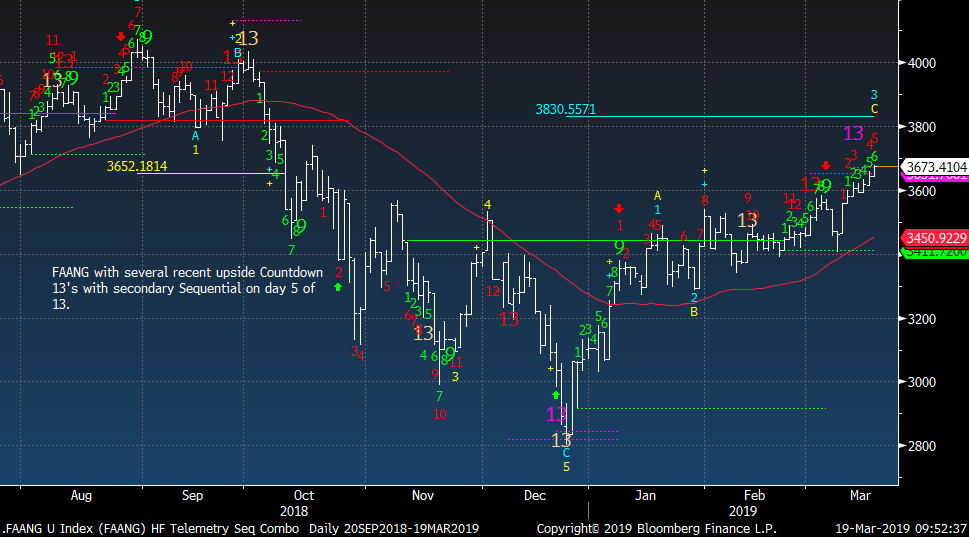
FAANG custom index trickling higher with secondary Countdown on day 5 of 13
|
|
|
|
|
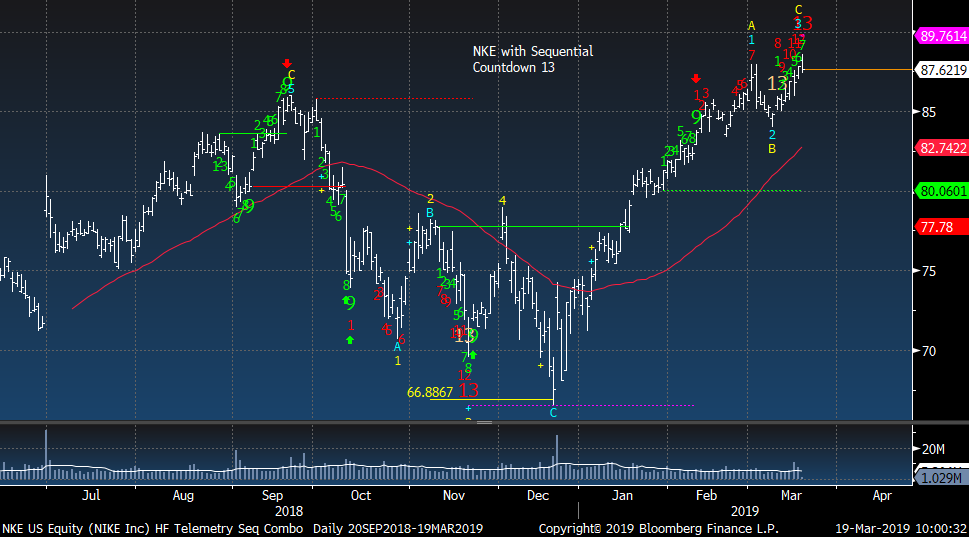
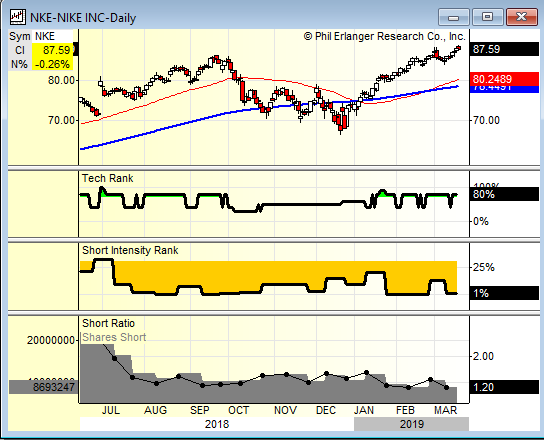
NKE with Sequential Countdown 13 and very low short interest.
|
|
|
|
|
|
|
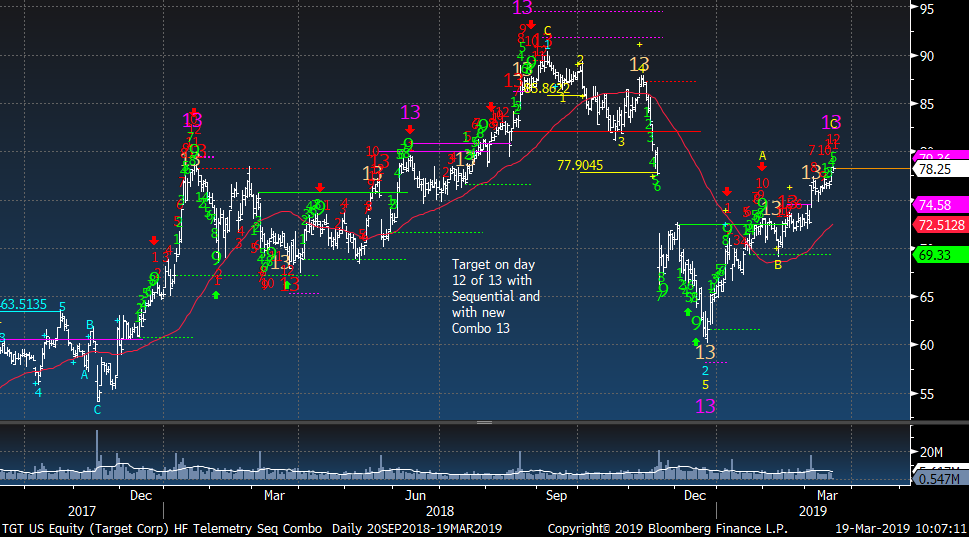
Target has a good record with the DeMark Indicators
|
|
|
|
|
|
|
|
|
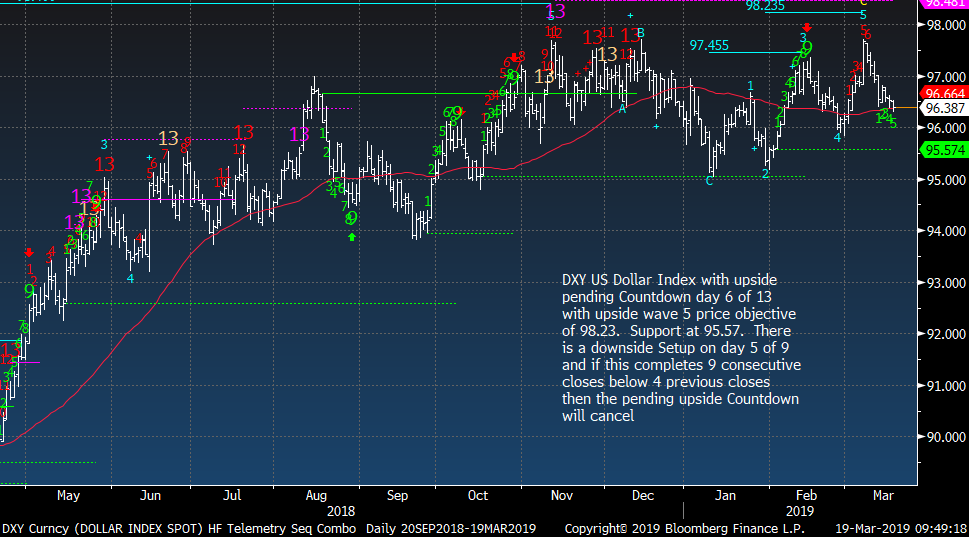
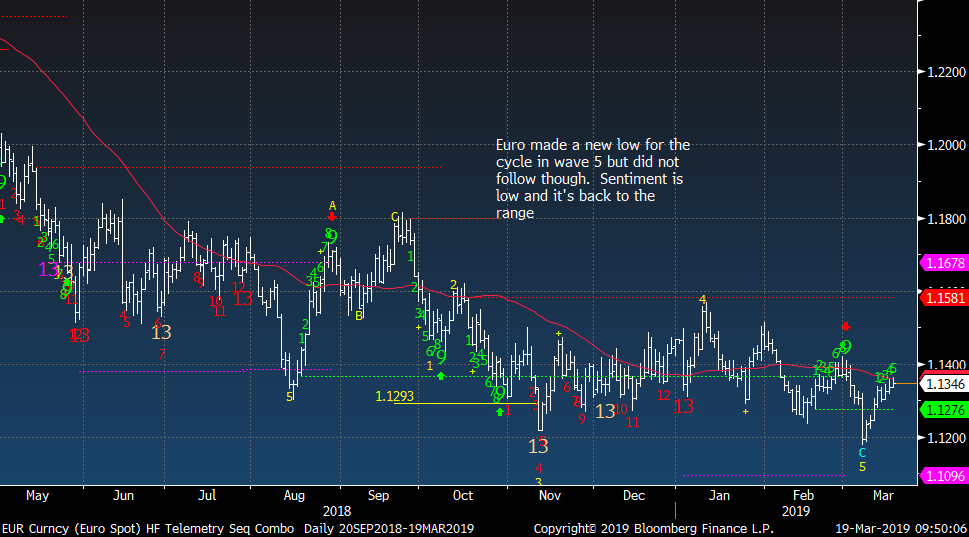
USD still in tight range with low volatility
|
|
|
|
|
|
|
|
|
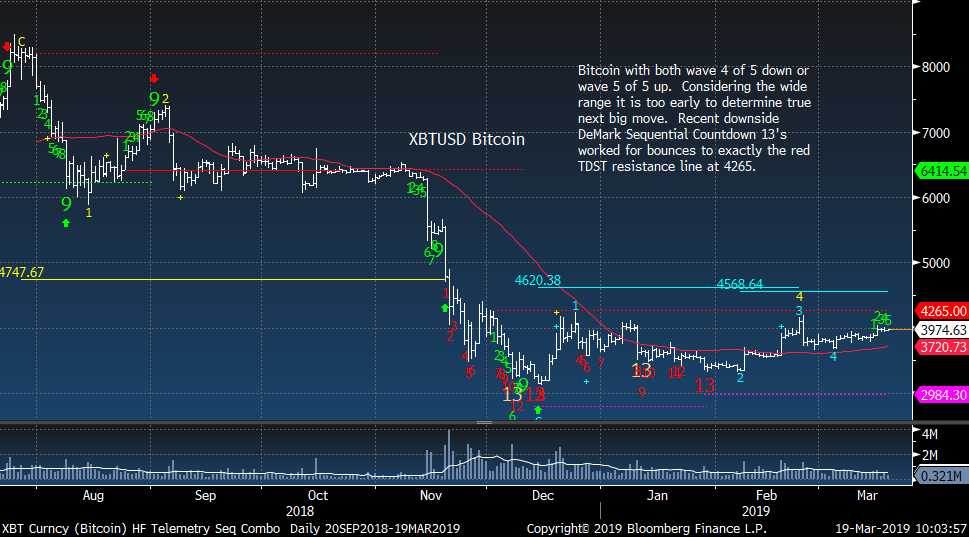
Bitcoin has resistance at 4265. Above that level and this could run. I'm not a Bitcoin person and will not be trading this in the future
|
|
|
|
|
|
|
|
|
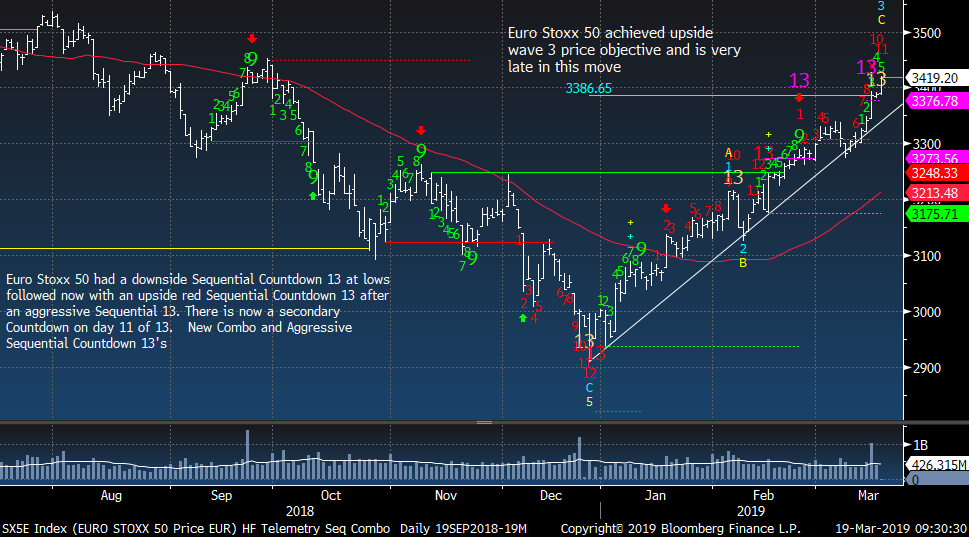
Euro Stoxx 50 on day 11 of 13 with upside Countdown
|
|
|
|
|
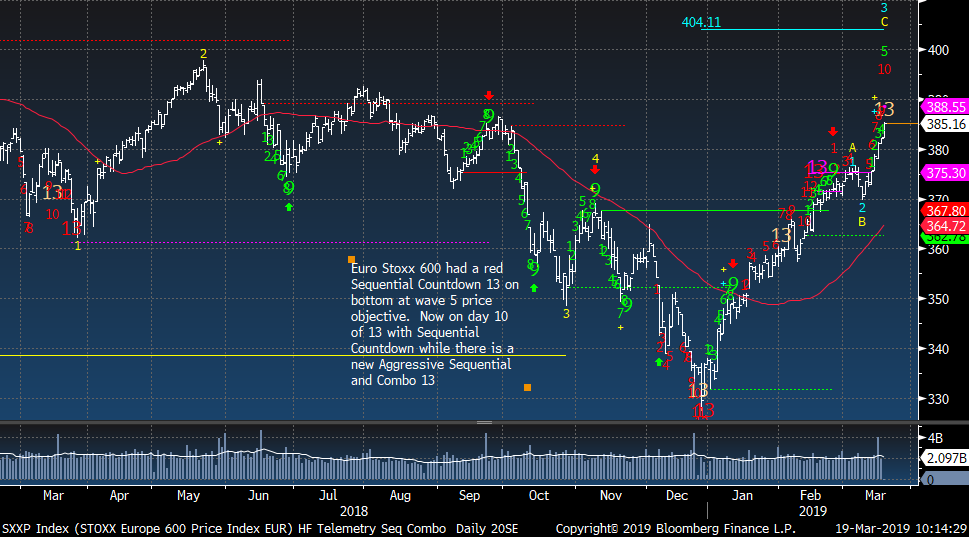
Euro Stoxx 600 on day 10 of 13 with Sequential Countdown
|
|
|
|
|
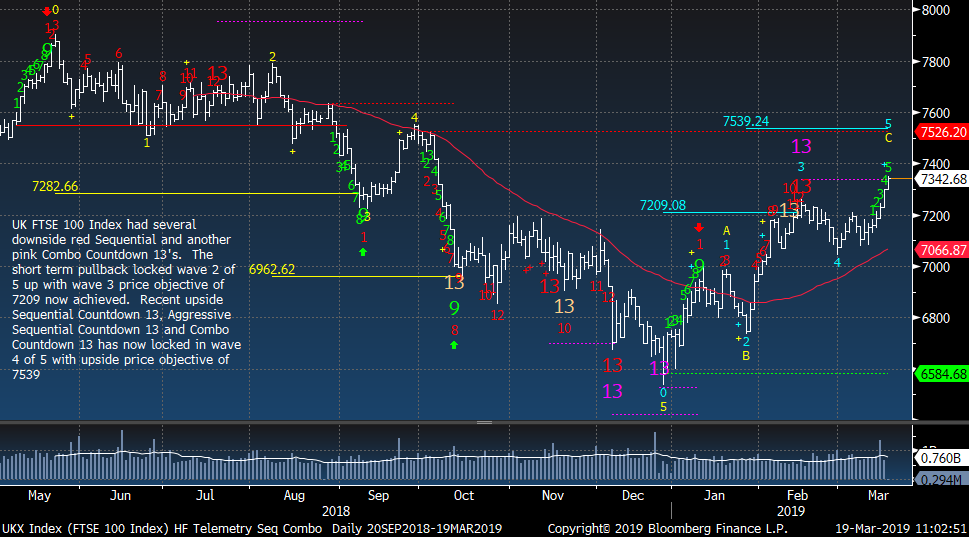
UK FTSE 100 now in wave 5 on day 5 of 9 with Setup
|
|
|
|
|
|
|
|
|
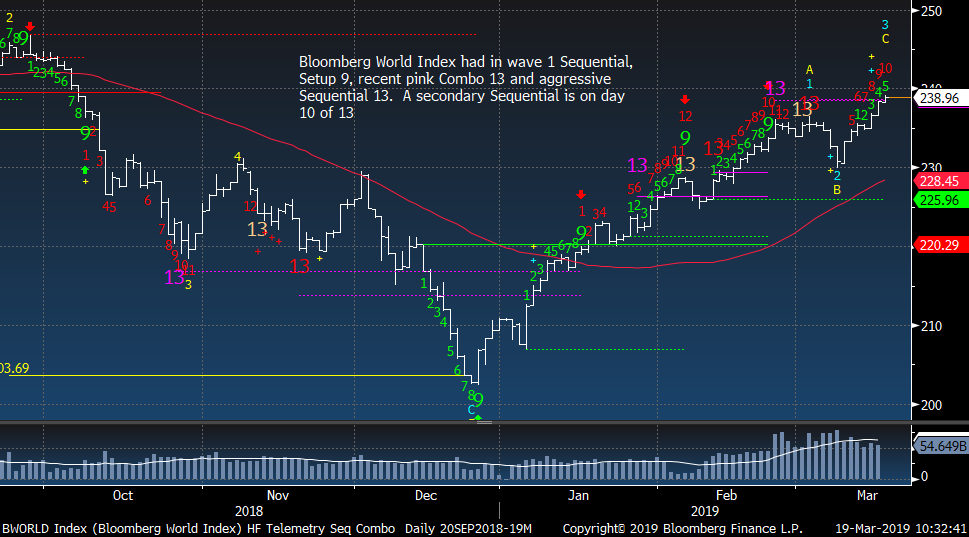
Bloomberg World Index on day 10 of 13 with secondary Countdown
|
|
|
|
|
|
|
|
|
|
|
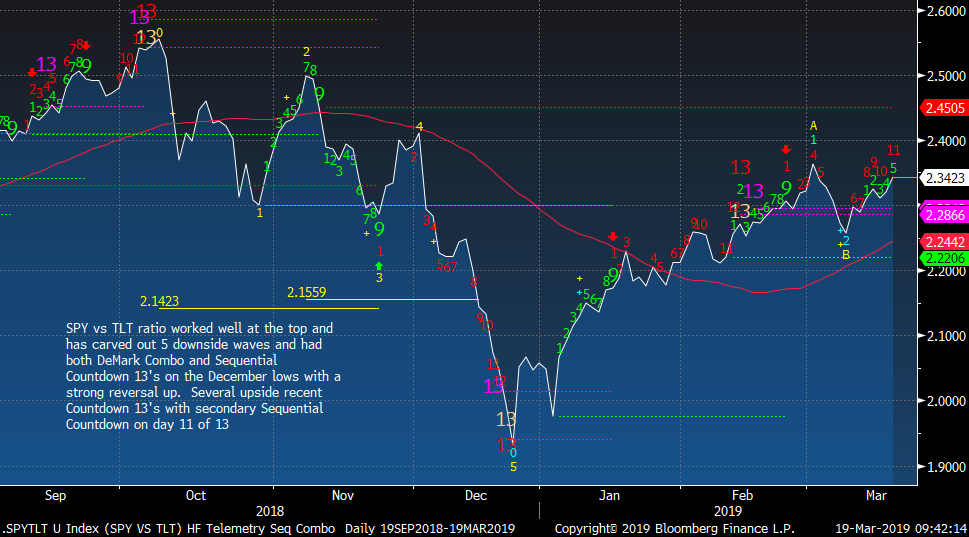
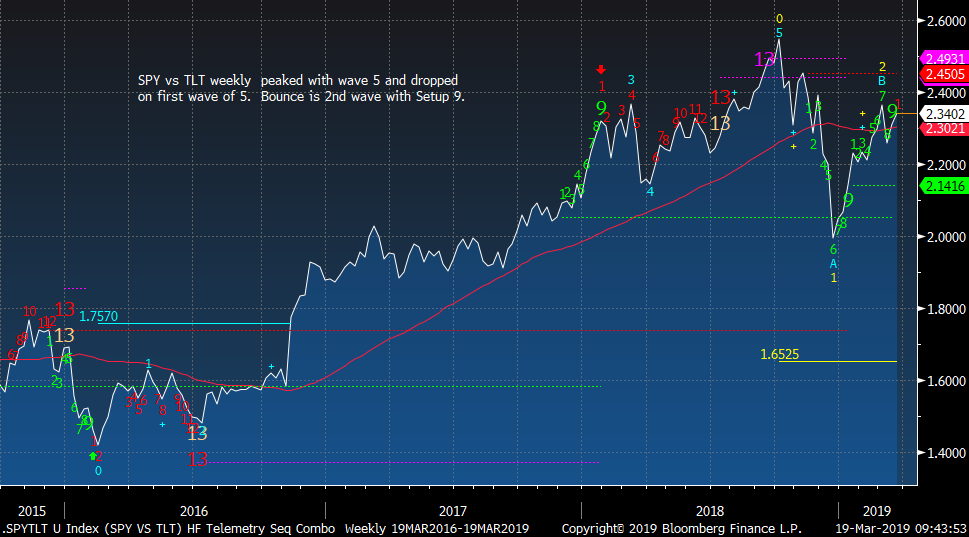
SPY vs TLT - Who you got?
|
|
|
SPY vs TLT custom ratio (stocks vs bonds) on day 11 of 13 with secondary upside Sequential
|
|
|
|
|
SPY vs TLT weekly with a lower wave 3 price objective a lot lower (this would bring things back closer to 2016 levels)
|
|
|
|
|
|
|
|
|
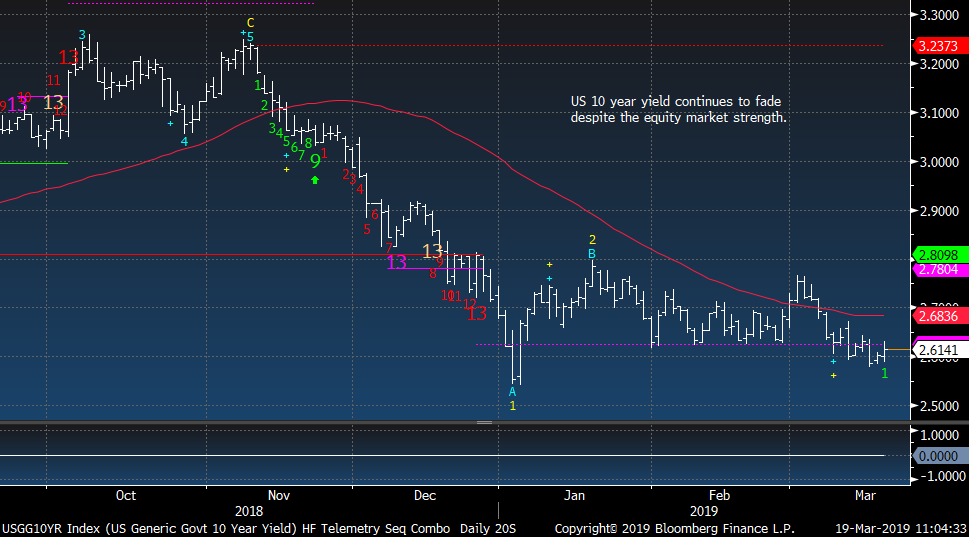
Bond bullish sentiment is at 79% and remains elevated while 10 year yield and other bond proxies hold these levels. A break below with sentiment elevated seems unlikely but it could happen
|
|
|
|
|
|
|
Unsubscribe me from Hedge Fund Telemetry
Hedge Fund Telemetry LLC, P.O. Box 4675, Greenwich, CT 06861, United States
CONFIDENTIALITY NOTE and DISCLAIMER: This message is for the named person's use only. It may contain confidential, proprietary or legally privileged material. No confidentiality or privilege is waived by any accidental or unintentional transmission. If you receive this message in error, please immediately delete it and all copies of it from your system, destroy any hard copies and notify the sender. You must not, directly or indirectly, use, disclose, distribute, print or copy any part of this message if you are not the intended recipient. Hedge Fund Telemetry LLC. cannot guarantee the confidentiality of the material transmitted; therefore, information of a sensitive or confidential nature should not be transmitted. There is risk in trading markets. Hedge Fund Telemetry LLC reports are based on information gathered from various sources and believed to be reliable, but are not guaranteed as to accuracy and completeness. The information is subject to change without notice and Hedge Fund Telemetry LLC has no obligation to provide any updates or changes. Hedge Fund Telemetry LLC is providing this data for informational and educational purposes and does not believe that it is sufficient to base an investment decision on. This information should not be regarded as a solicitation or recommendation of any particular security or to engage in any trading strategy. One should always check with your licensed financial advisor to determine suitability of any investments.
|
|
|
|
|