If you are having difficulty seeing this email, you can view in your browser or click here to
print.
|
|
|
|
|
04/18/2024
Thomas Thornton
info@hedgefundtelemetry.com
|
|
|
Potential downside targets now set on some major indexes
|
|
|
Thanks to all who joined us yesterday for our State Of The Markets Webinar. We had an overwhelming amount of people register and watch. I know how sometimes impossible to watch with the markets open so here's a replay link. We had so much positive feedback on the format that we want to do some shorter 15-20 minute ones that will cover more specific topics or markets. Yes we will be doing an educational DeMark Indicator webinar in the near future! Please let me know what you want to see.
As for today, it's another grind higher for the indexes making it six up in a row in the US from last Friday's
reversal off the 200 day moving average. Volume on the bounce has been lighter than the sharp down move which isn't any surprise. Breadth has started to build a little momentum. My call from Thursday/Friday that a bounce was imminent has moved the indexes up almost as fast as they went down. My takeaway is this is a sign of traders whipping it around rather than investors thinking longer term. With the proliferation of passive ETF's it's only going to get more pronounced. My call remains a lower high bounce is in progress and lower lows will be ahead. Below posted some big indexes with downside wave 3 price objectives since the move up qualified as 2/B wave (trading higher than 8 previous closes). I''ll discuss more of the nuances too including where the pattern fails.
One of the tools, I've used for many years to determine short term support and resistance levels after a significant move is calculating VWAP (Volume Weighted Average Price)
levels from an exact time. Recall, on February 1st with the record inflows in January inflows, I laid out the support levels to watch which were just 1.5% lower from the last price with the belief if these levels broke selling would accelerate to the downside as people would start to get underwater. It proved correct and now I am watching VWAP levels from last Friday 3:30pm exact bottom. Levels to watch on the SPY are 267.00, QQQ 161.00, IWM 149.50 and DIA 247.50 as first support. Yesterday late in the day I posted on Twitter, I was again buying puts on SPY and QQQ. I bought a 2.5% AUM size total in the SPY March 265 puts and QQQ March 165 puts. My cash levels still remain high and if you've made some gains in the bounce don't forget to ring the register.
Have a great long weekend (for those in the US) and thank
you for all your support.
Notable:
- US Markets - Wave 3 downside price objectives are now set
- Elliott Wave Personalities - print this and save
- Bitcoin - A new downside wave 5 price objective is set. Please sit down if you're long
- US Dollar Update
- Bond Update
- FANG's - Three Ways
- Copper Update - Near upside exhaustion
- DeMark Screens - Previous two days listed today.
|
|
|
|
|
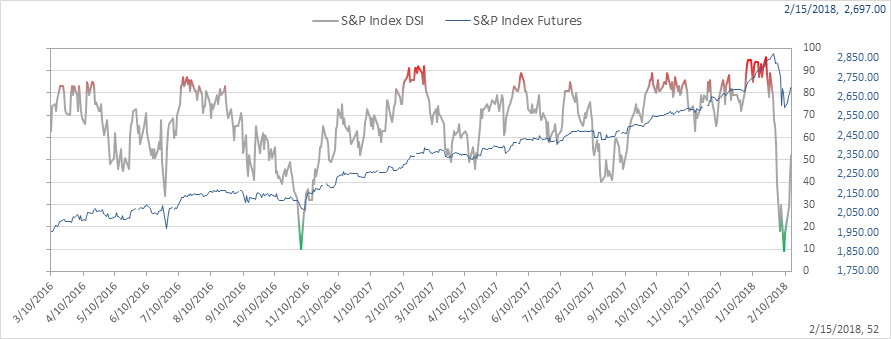
SPX bullish sentiment is at 52% up from last Thursday's low of 9%. Bounces in sentiment back to the mid point are common and now some consolidation of the recent bounce should be ahead
|
|
|
|
|
|
|
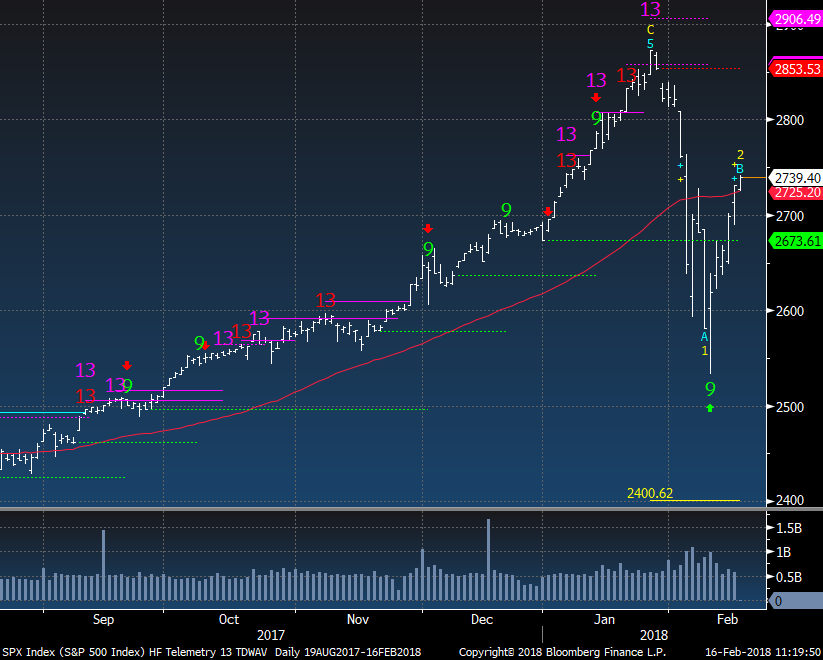
SPX Index daily now has the wave 2/B achieved as it's trading 8 previous closes. Here's two scenarios that could play out. First, what I expect is this a lower high bounce and it will fail to make a new high and break below the recent lows from last week. Second, if there is a new high made, the wave sequence reverts back to it being in the 5th wave. As a helpful guide, the
personality's for the waves are posted below. Might be worth printing and keeping handy.
|
|
|
|
|
|
|
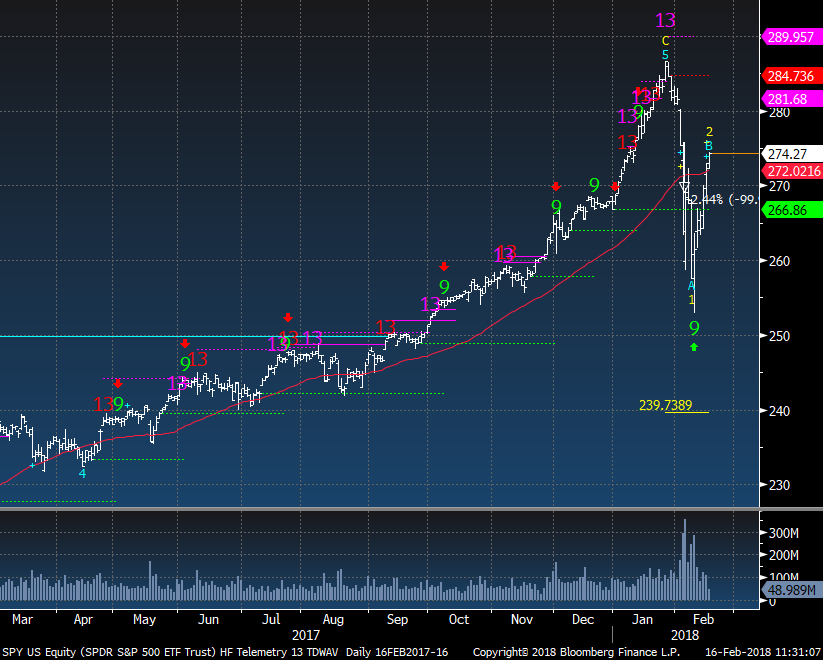
SPY has a downside wave 3 target of 239.73.
|
|
|
|
|
|
|
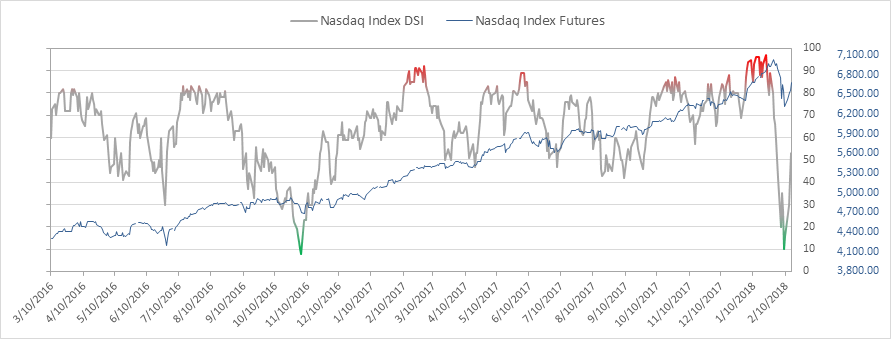
Nasdaq bullish sentiment is at 53% - same story as the the SPX
|
|
|
|
|
|
|
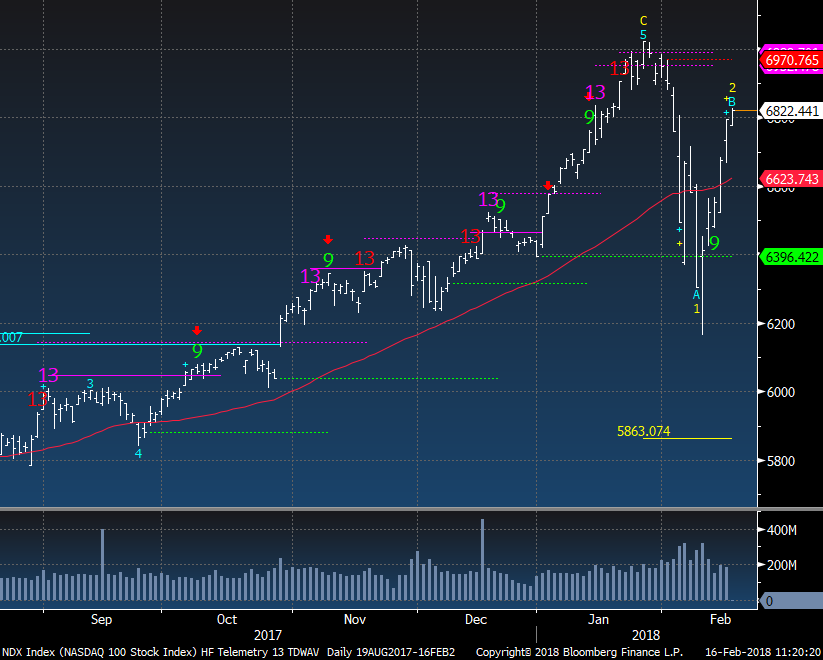
NDX Nasdaq 100 is a bit higher above the 50 day moving average and has a downside wave 3 price objective 1000 points lower. These do seem far fetched but I've watched them nail things so many times in the past.
|
|
|
|
|
|
|
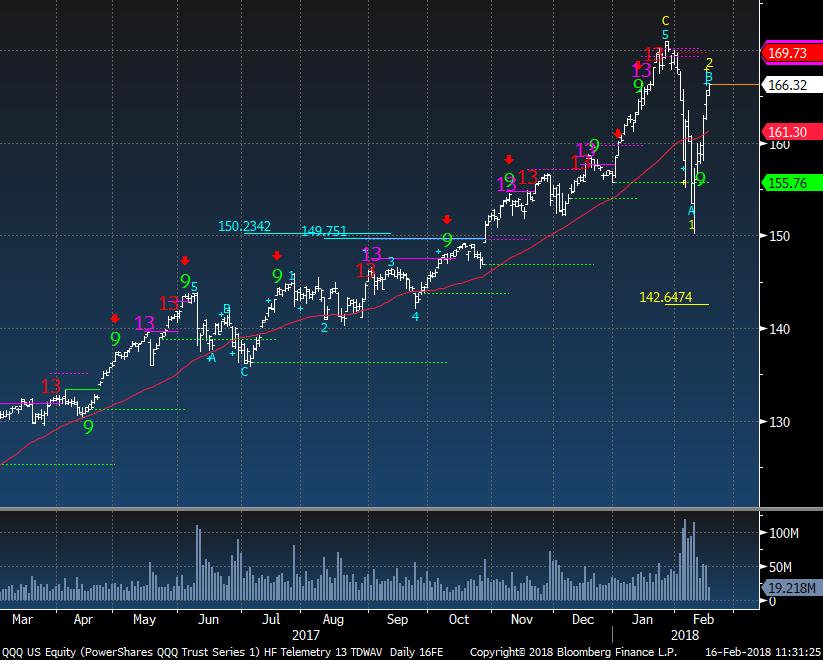
QQQ has a downside wave 3 price objective of 142.64.
|
|
|
|
|
|
|
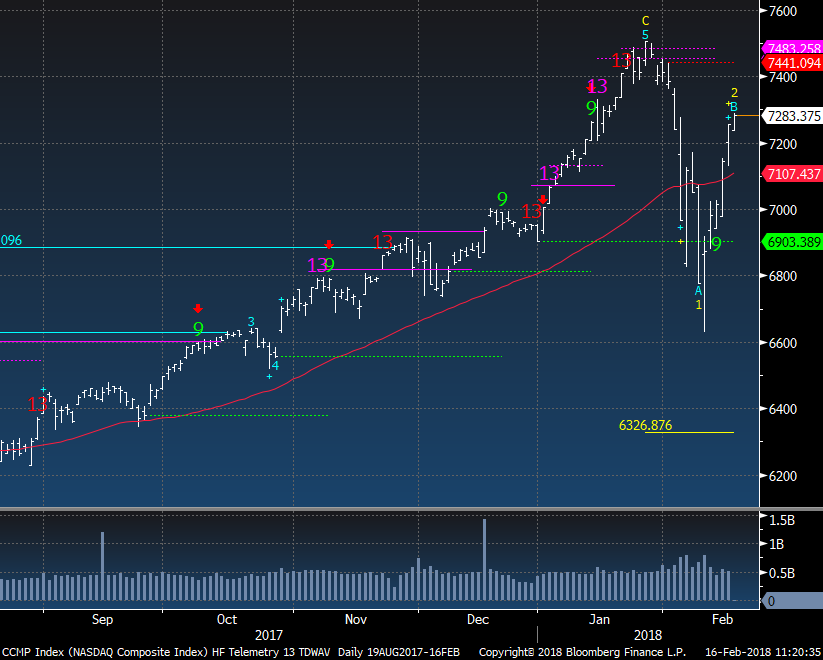
Nasdaq Composite has a downside wave 3 price objective of 6326.
|
|
|
|
|
|
|
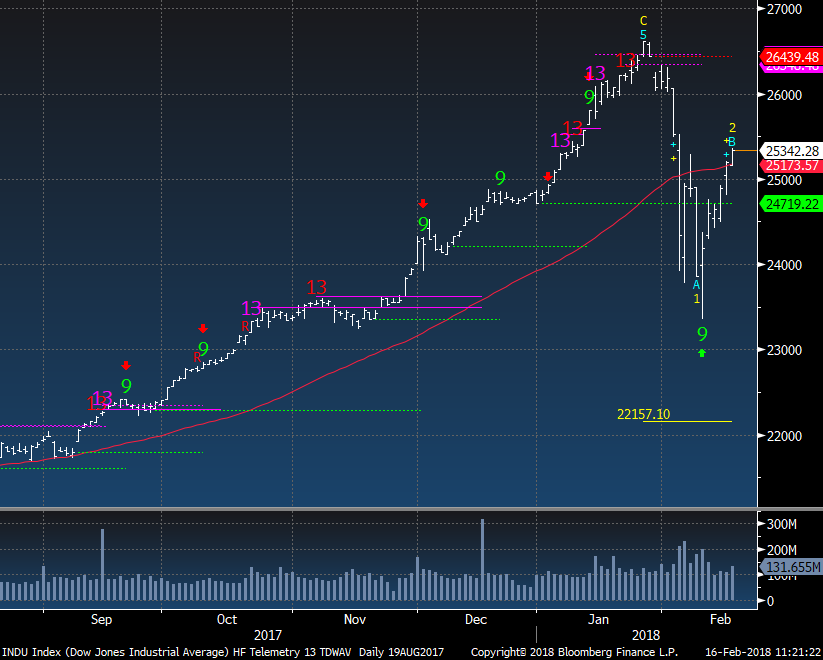
Dow Jones Industrial Average Index has a downside price of 22,157. Sound like a lot but it's only retracing back to last September levels.
|
|
|
|
|
|
|
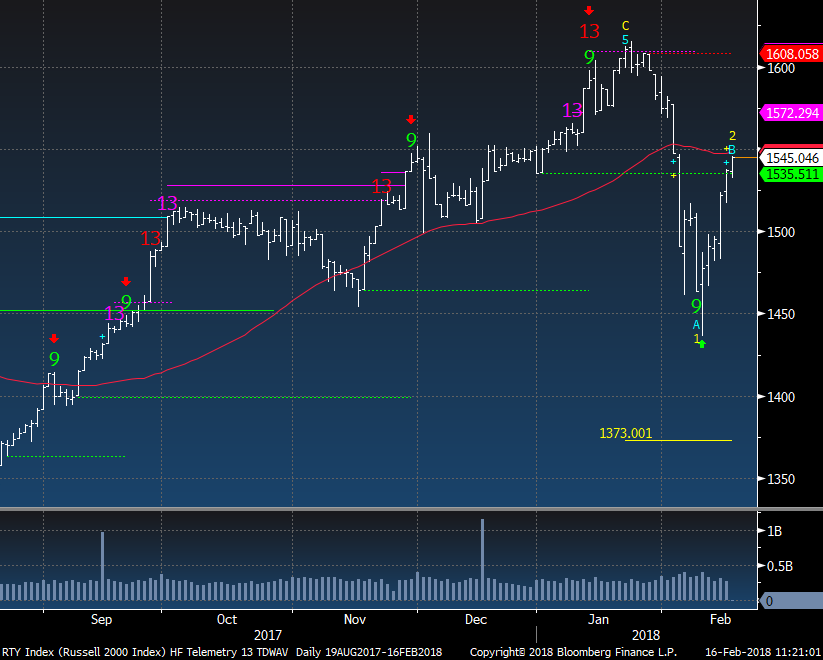
Russell 200 has a downside wave 3 target of 1373 also at last September levels. Note the Russell hasn't quite moved over the 50 day yet.
|
|
|
|
|
|
|
Elliott Wave Personalities
|
|
|
Elliott Wave Personalities
Wave 1: Wave one is rarely obvious at its inception. When the first wave of a new bull market begins, the fundamental news is almost universally negative. The previous trend is considered still strongly in force. Fundamental analysts continue to revise their earnings estimates lower; the economy probably does not look strong. Sentiment surveys are decidedly bearish, put options are in vogue, and implied volatility in the options market is high. Volume might increase a bit as prices rise, but not by enough to alert many technical analysts.
Wave 2: Wave two corrects wave one, but can never extend beyond the starting point of wave one.
Typically, the news is still bad. As prices retest the prior low, bearish sentiment quickly builds, and "the crowd" haughtily reminds all that the bear market is still deeply ensconced. Still, some positive signs appear for those who are looking: volume should be lower during wave two than during wave one, prices usually do not retrace more than 61.8% (see Fibonacci section below) of the wave one gains, and prices should fall in a three wave pattern.
Wave 3: Wave three is usually the largest and most powerful wave in a trend (although some research suggests that in commodity markets, wave five is the largest). The news is now positive and fundamental analysts start to
raise earnings estimates. Prices rise quickly, corrections are short-lived and shallow. Anyone looking to "get in on a pullback" will likely miss the boat. As wave three starts, the news is probably still bearish, and most market players remain negative; but by wave three's midpoint, "the crowd" will often join the new bullish trend. Wave three often extends wave one by a ratio of 1.618:1.
Wave 4: Wave four is typically clearly corrective. Prices may meander sideways for an extended period, and wave four typically retraces less than 38.2% of wave three (see Fibonacci relationships below). Volume is well below than that of wave three. This is a good place to buy a pull
back if you understand the potential ahead for wave 5. Still, fourth waves are often frustrating because of their lack of progress in the larger trend.
Wave 5: Wave five is the final leg in the direction of the dominant trend. The news is almost universally positive and everyone is bullish. Unfortunately, this is when many average investors finally buy in, right before the top. Volume is often lower in wave five than in wave three, and many momentum indicators start to show divergences (prices reach a new high but the indicators do not reach a new peak). At the end of a major bull market, bears may very well be ridiculed (recall how forecasts for a top in the stock
market during 2000 were received).
Wave A: Corrections are typically harder to identify than impulse moves. In wave A of a bear market, the fundamental news is usually still positive. Most analysts see the drop as a correction in a still-active bull market. Some technical indicators that accompany wave A include increased volume, rising implied volatility in the options markets and possibly a turn higher in open interest in related futures markets.
Wave B: Prices reverse higher, which many see as a resumption of the now long-gone bull market. Those familiar with classical technical analysis may see the peak as the right shoulder of a head and shoulders reversal pattern. The volume during wave B should be lower than in wave A. By this point, fundamentals are probably no longer improving, but they most likely have not yet turned negative.
Wave C: Prices move impulsively lower in five waves. Volume picks up, and by the third leg of wave C, almost everyone realizes that a bear market is firmly entrenched. Wave C is typically at least as large as wave A and often extends to 1.618 times wave A or beyond.
|
|
|
|
|
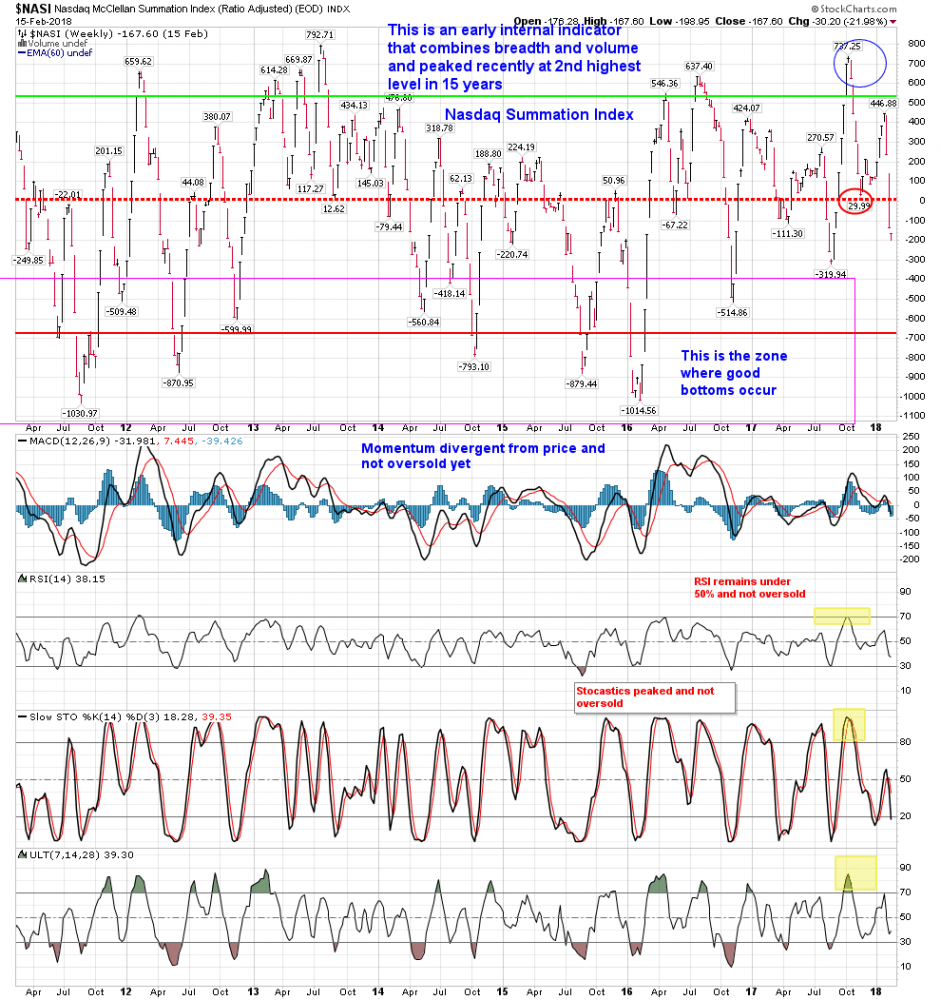
Breadth Surge and Nasdaq Summation - Conflicting
|
|
|
A subscriber sent me Stockcharts.com's Arthur Hill's chart of the recent breadth surge down and recovery. My bet is breadth will also make a lower high on this bounce.
|
|
|
|
|
|
|
I often show the Nasdaq Summation Index weekly time frame. This is an old chart which is essentially a mix of breadth and volume. When it's under 0, markets typically have a tough tough time. If you look close, the bar for this week is very small and it gapped down and didn't recover much despite the move in the market. The momentum indicators below also are not historically oversold.
|
|
|
|
|
|
|
|
|
|
|
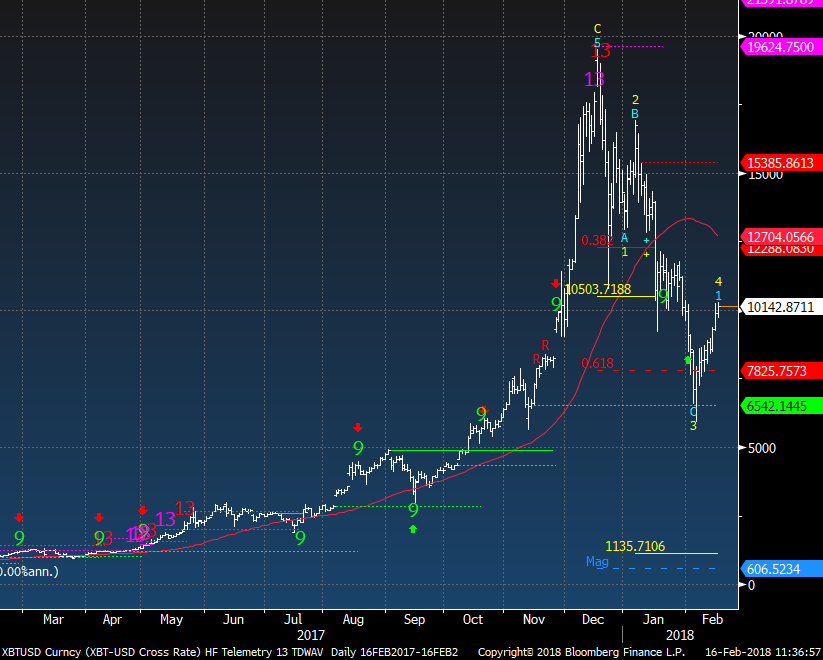
The daily chart of XBTUSD had very very good upside exhaustion signals on the highs. The wave 3 downside objective at 10,503 was achieved but continued lower without getting the upside wave 4. It held the DeMark TDST support line at 6,542 and the 0.618 retracement and now is a downside wave 4 given us now a downside wave 5 price objective of 1,135. Yeah whoa 90% lower from here! If a higher low pullback occurs it will be the 2nd wave of 5 up. And it must not break the recent lows or else the downside wave is dominant.
|
|
|
|
|
|
|
|
|
US Dollar bullish sentiment is at 24%. It failed to breakout above the 50% and now I will be watching for a higher low in sentiment as a positive divergence.
|
|
|
|
|
|
|
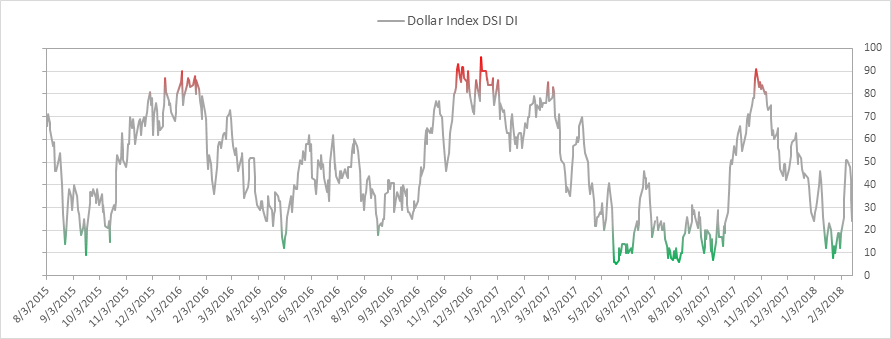
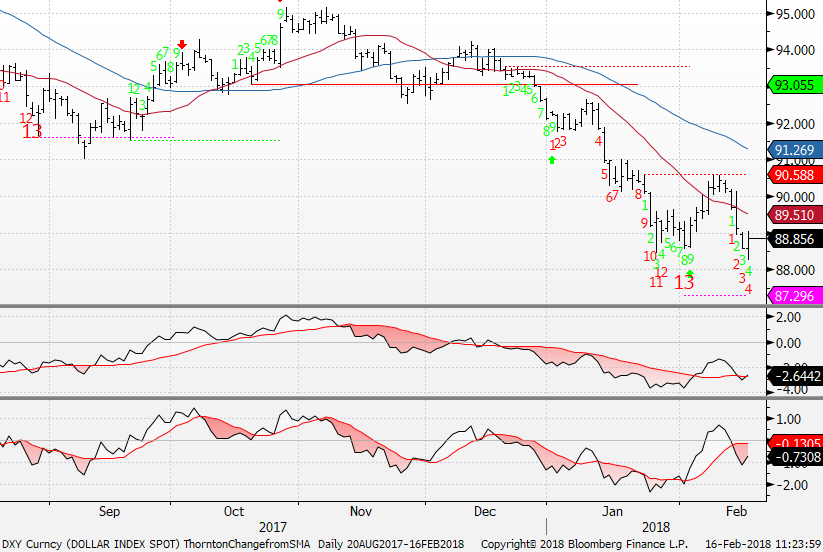
The daily of DXY is up today but there is a new downside red Countdown on day 4 of 13 which will be watched close on the daily note.
|
|
|
|
|
|
|
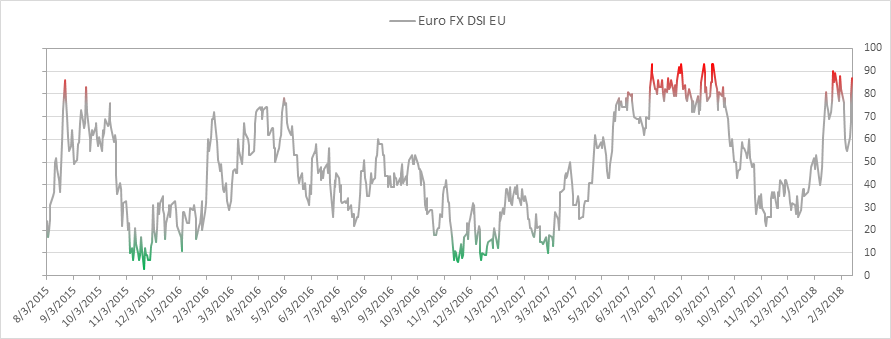
Euro bullish sentiment is at 87% and the mirror opposite naturally of the USD but remember positioning remains very long Euro.
|
|
|
|
|
|
|
|
|
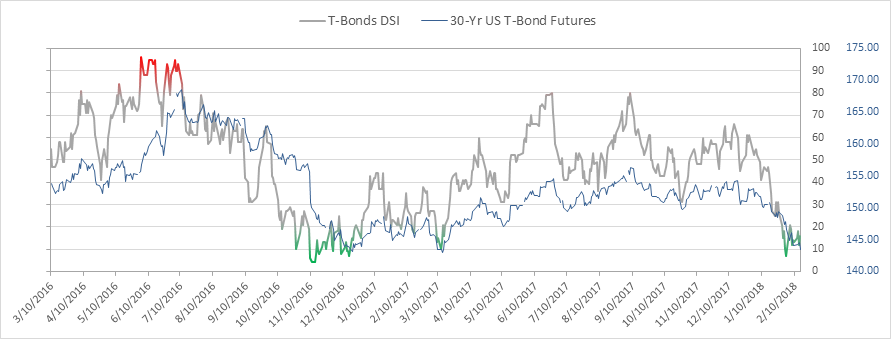
Bond bullish sentiment is at 16% and ticked up a little from the previous day.
|
|
|
|
|
|
|
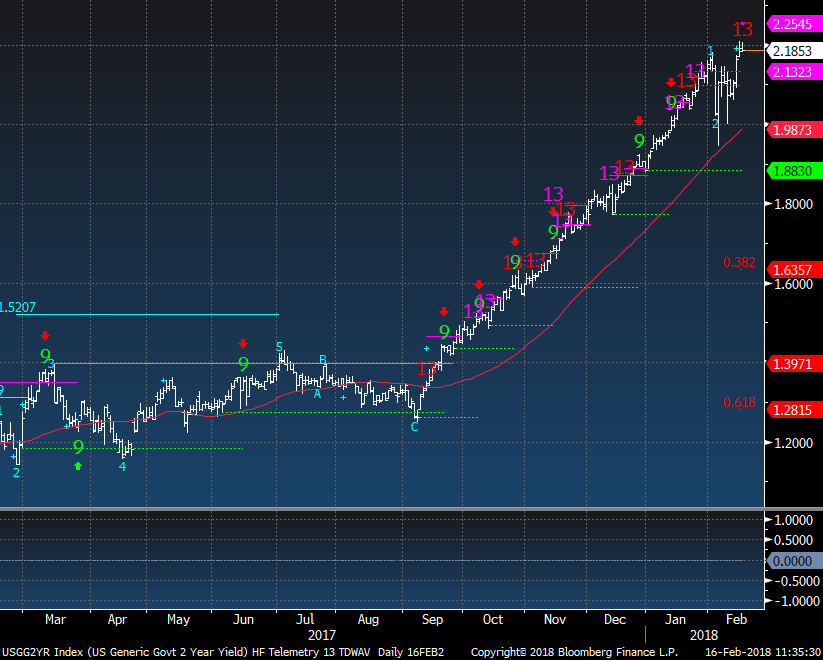
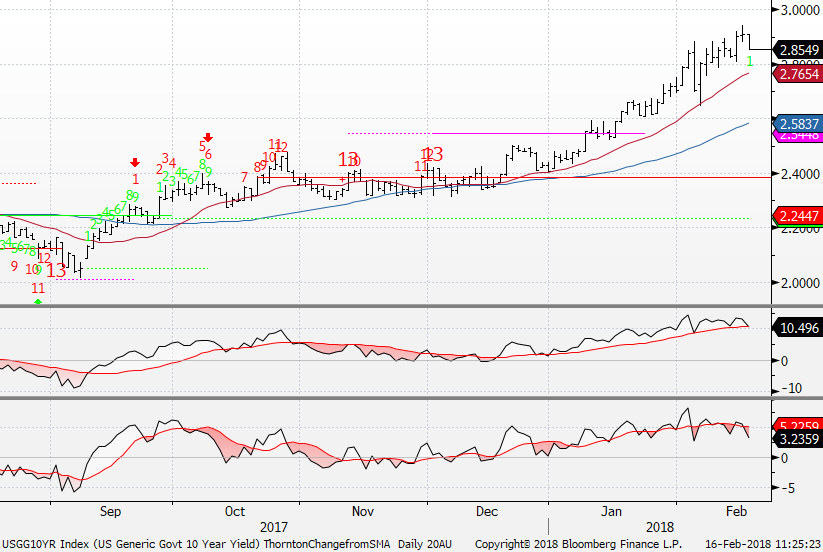
The US 2 year yield has been nothing but remarkable since September. It's ignored the upside exhaustion signals like my daughter does when I text her and ask her when she's coming home. It's indicative of such a strong trend. That being said there's a new one today and just 2 weeks ago there was a weekly. And the recent action leads me to believe there could be some buyers in bonds soon and this yield will pullback to the 0.382 levels around 1.63%
|
|
|
|
|
|
|
The US 10 Year Yield has a price flip down today which is interesting as it's trading lower than 4 previous closes. It's notable since the narrative is this is going to 3% and the equity markets now like higher rates (as of this week but not last week)
|
|
|
|
|
|
|
|
|
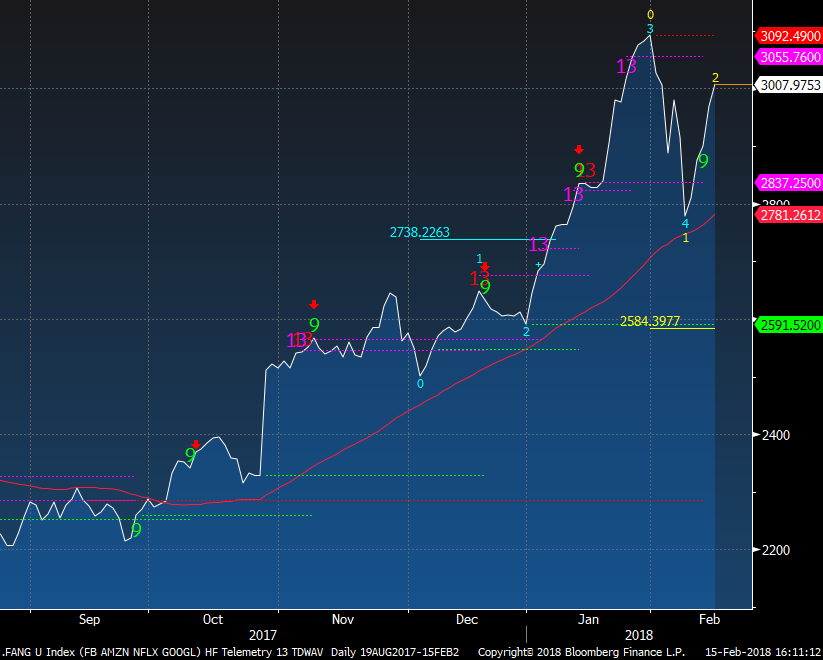
The original FANG custom index of FB, AMZN, NFLX, and GOOGL held the 50 day (vs the big indexes going to 200 day). A downside wave 3 price objective is now 2584
|
|
|
|
|
|
|
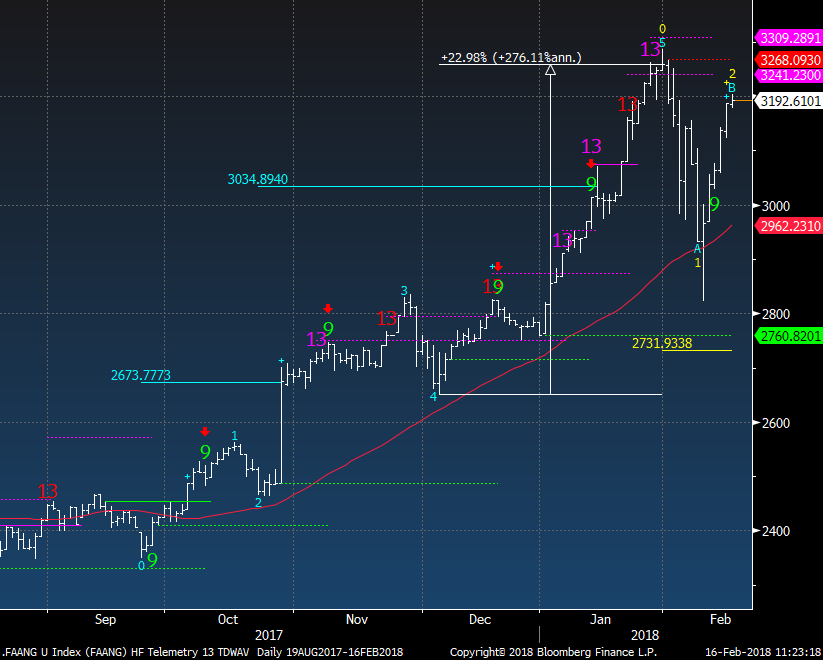
The FAANG custom index with the addition of AAPL also has a 2/B wave setup. The wave 3 downside price objective is 2731
|
|
|
|
|
|
|
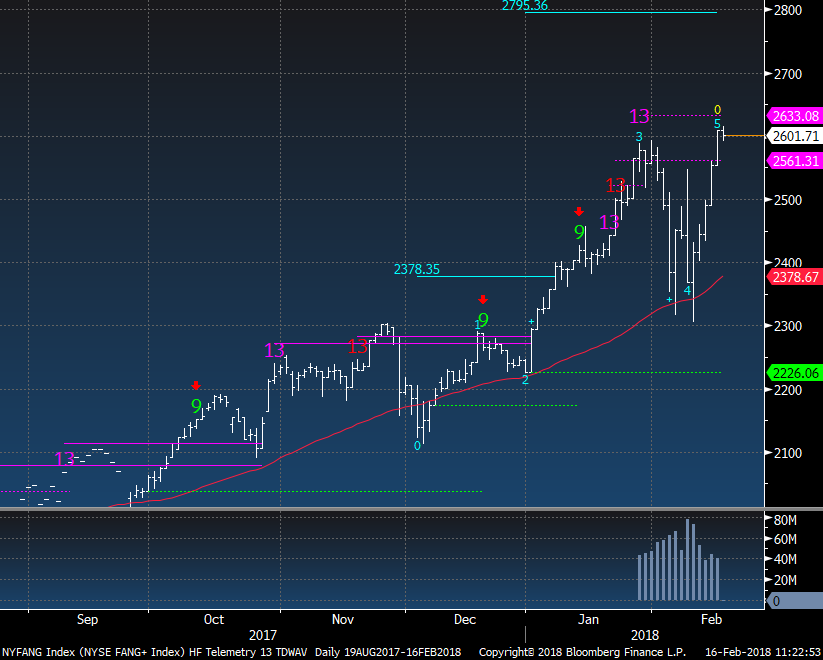
The NY FANG+ Index hit a new high and is now in wave 5 on the upside with a 2795 upside price objective. If it broke from here lower a new wave 1 would start.
|
|
|
|
|
|
|
|
|
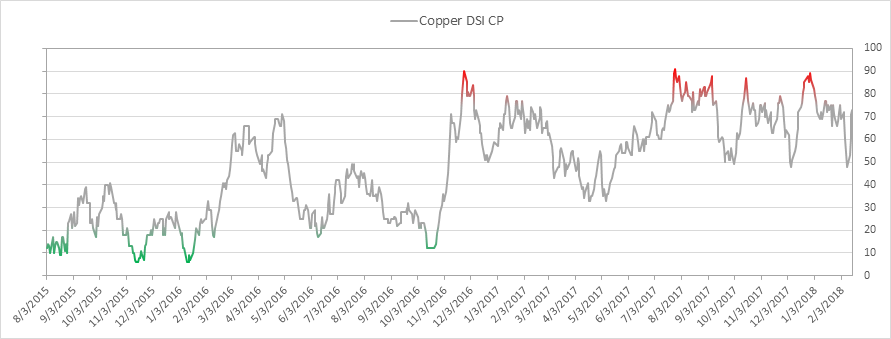
| Copper bullish sentiment is at 73%
|
|
|
|
|
|
|
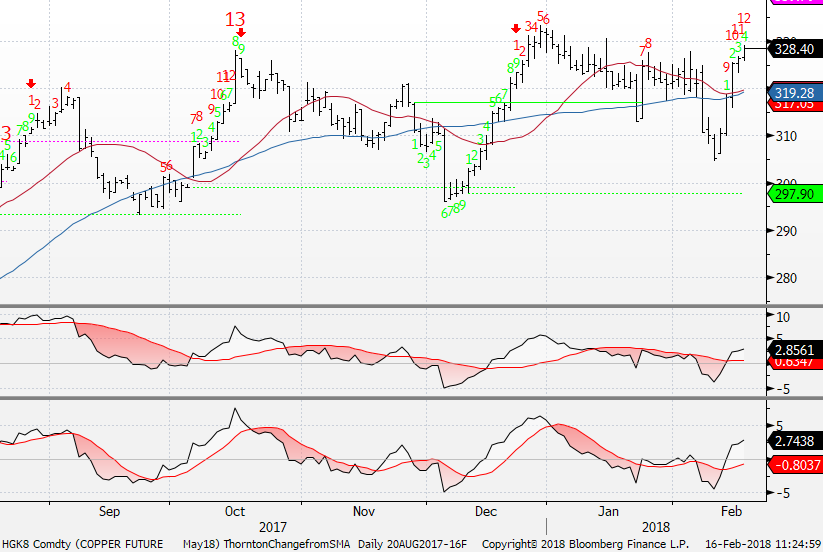
Copper daily now is on day 12 of 13 with an upside red Countdown. Careful if you hear breakout when there is an upside exhaustion present.
|
|
|
|
|
|
|
DEMARK SCREENS - Daily, Weekly, Monthly Upside/Downside Exhaustion Signals
|
|
|
Daily/Weekly DeMark upside/downside exhaustion signals (Sequential) Weekly updated on Monday's. Price flips occur when a stock closes higher/lower than four previous closes.
S&P 1500 Universe:
DAILY UPSIDE 13: ACXM, APEI, AVP, BCOR, CHE, DPZ, GNTX, HI, SSI, TYL, XYL, CATM, CBSH, GRMN, KAMN, MA, MATX, TXRH
DAILY DOWNSIDE 13: SBRA, GEOS, SJI
DAILY UPSIDE WITH PRICE FLIP REVERSAL DOWN: FORR, OI, SCSC, AEGN, AEIS, AIZ, BCPC, BELFB, CECO, CELG, CEVA, COLB, EIG, FNB, HAIN, HSC, KIM, KOP, LMNX, MET, MHO, NSIT, POWI, SDRX, TYPE, UEIC, UGI, WAGE, XRAY
DAILY DOWNSIDE WITH PRICE FLIP REVERSAL UP: BLKB, BLL, GPRE, HAS
Updated: 2/5/18
WEEKLY UPSIDE 13: ABMD, AON, AXE, BF/B, BIIB, BOFI, BR, CSCO, DGX, GD, LMT, MAR, RL, ROST, SGY, SPPI, STT, SYY, UFS, WAT, WSO
WEEKLY DOWNSIDE 13: BELFB, EGOV, FSP, INT, RRC
Updated: 2/1/1
MONTHLY UPSIDE 13: CHD, CLGX, CLX, CNMD, DVA, FICO, IDCC, MSCI, ORLY, PAYX, TFX, VMC, XYL
MONTHLY DOWNSIDE 13: GPOR
Euro Stoxx 600 Universe:
DAILY UPSIDE 13: BAV LN, BME LN, HAS LN, AMEAS FH
DAILY DOWNSIDE 13: BWY LN, VOD LN, BT/A LN, HMSO LN
DAILY UPSIDE WITH PRICE FLIP REVERSAL DOWN: NONE
DAILY DOWNSIDE WITH PRICE FLIP REVERSAL UP: AI FP, BN FP, GETIB SS, ILD FP, JMAT, KPN NA, MCRO LN, MMB FP, ORNBV FH, REE SM, SAN FP, SMDS LN, ASM NA, BVIC LN, DTE GR, ENEL IM, ENG SM, HIK LN, INDUA SS, INTU LN, INVEB SS, ITX SM, MRK GR, ORP FP, PHIA NA, SHBA SS, SOLB BB, TRN IM
Updated: 2/5/18
WEEKLY UPSIDE 13: ELM LN, JE/ LN, MC FP, TDC DC
WEEKLY DOWNSIDE 13: AA/ LN, NG/ LN, SGC LN
Updated: 2/1/18
MONTHLY UPSIDE 13: COFB BB, GAS SM, GKN LN, ING FP, KINVB SS, OML LN, VIS SM
MONTHLY DOWNSIDE 13: NONE
|
|
|
Unsubscribe me from Hedge Fund Telemetry
Hedge Fund Telemetry LLC, P.O. Box 4675, Greenwich, CT 06861, United States
CONFIDENTIALITY NOTE and DISCLAIMER: This message is for the named person's use only. It may contain confidential, proprietary or legally privileged material. No confidentiality or privilege is waived by any accidental or unintentional transmission. If you receive this message in error, please immediately delete it and all copies of it from your system, destroy any hard copies and notify the sender. You must not, directly or indirectly, use, disclose,
distribute, print or copy any part of this message if you are not the intended recipient. Hedge Fund Telemetry LLC. cannot guarantee the confidentiality of the material transmitted; therefore, information of a sensitive or confidential nature should not be transmitted. There is risk in trading markets. Hedge Fund Telemetry LLC reports are based on information gathered from various sources and believed to be reliable, but are not guaranteed as to accuracy and completeness. The information is subject to change without notice and Hedge Fund Telemetry LLC has no obligation to provide any updates or changes. Hedge Fund Telemetry LLC is providing this data for informational and educational purposes and does not believe that it is sufficient to base an investment decision on. This information should not be regarded as a solicitation or recommendation of any particular security or to engage in any trading strategy. One should always check with your licensed financial
advisor to determine suitability of any investments.
|
|
|
|
|
|
|