If you are having difficulty seeing this email, you can view in your browser or click here to
print.
|
|
|
|
|
04/16/2024
Thomas Thornton
info@hedgefundtelemetry.com
|
|
|
Markets love when the Fed speaks
|
|
|
There really isn't any definitive reason for today's strength in the market and I've asked quite a few desks and heard nothing substantial. There tends to be a positive reaction to when the Fed speaks - notably on Fed decision days but today they are releasing the Fed minutes at 2pm and perhaps this is the reason. Seems ridiculous but I heard it more than a few times today. Could there be some tidbits as the
focus will be on what "further" rate hikes means as they added that (twice) to the statement last month. Currently Fed Funds futures are calling for 3 hikes in 2018. As I pointed out yesterday the FANG stocks have been leading the market higher on this bounce and today it's pronounced with FANG and FAANG up 2% vs the S&P up 0.65%. I suppose it's hard to get investors to change and they gravitate back to what worked in the past year.
Today's note has a look at US several sectors, a few notable stocks, and a look at the Citi Economic Surprise Index from around the world.
Notable:
- US Markets - Recent spike in sentiment off lows moderating. Lot's of downside wave 3 targets
- US Sector Update
- Citi Economic Surprise Index
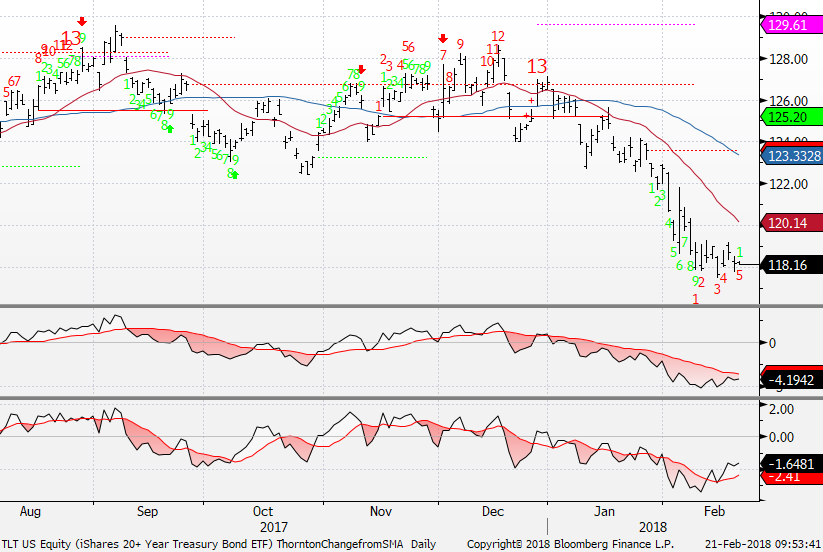
- Bond Update - TLT no downside exhaustion yet
- A few stocks with some DeMark action
- Bitcoin Update - Green Setup 9 today and reversal down
- DeMark Screens
|
|
|
|
|
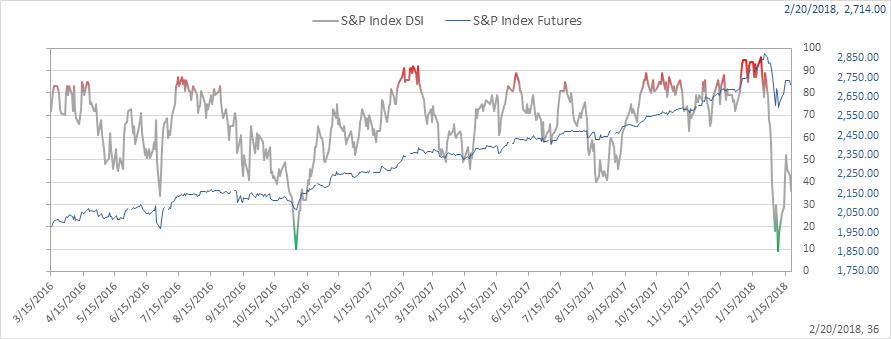
SPX bullish sentiment is at 36% and down from recent high of 52%
|
|
|
|
|
|
|
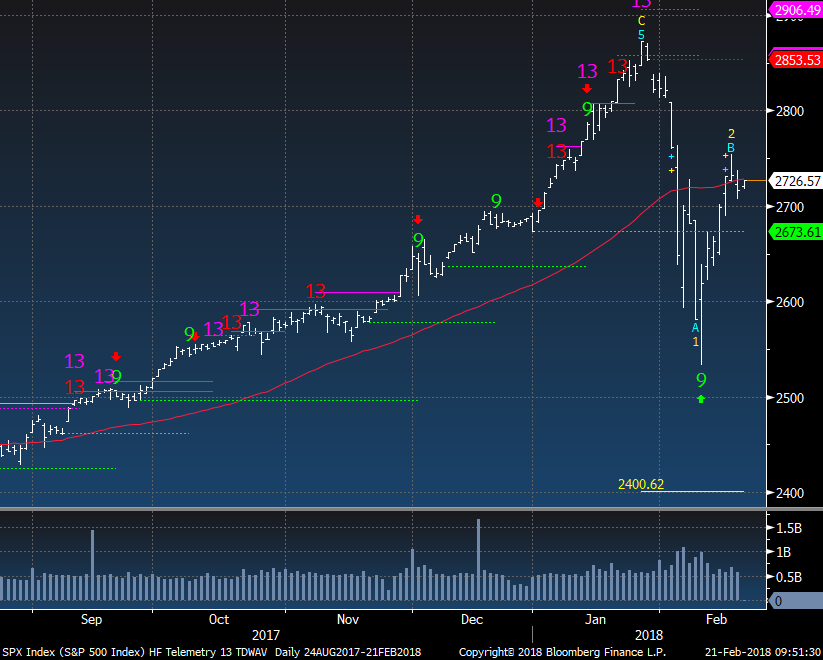
SPX daily chart is up today and it seems like people are watching the 2700 level
|
|
|
|
|
|
|
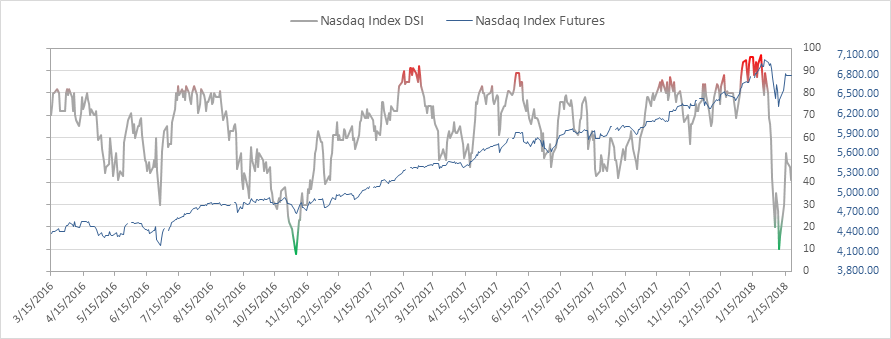
Nasdaq bullish sentiment is at 41% and also has down ticked from recent highs of 53%
|
|
|
|
|
|
|
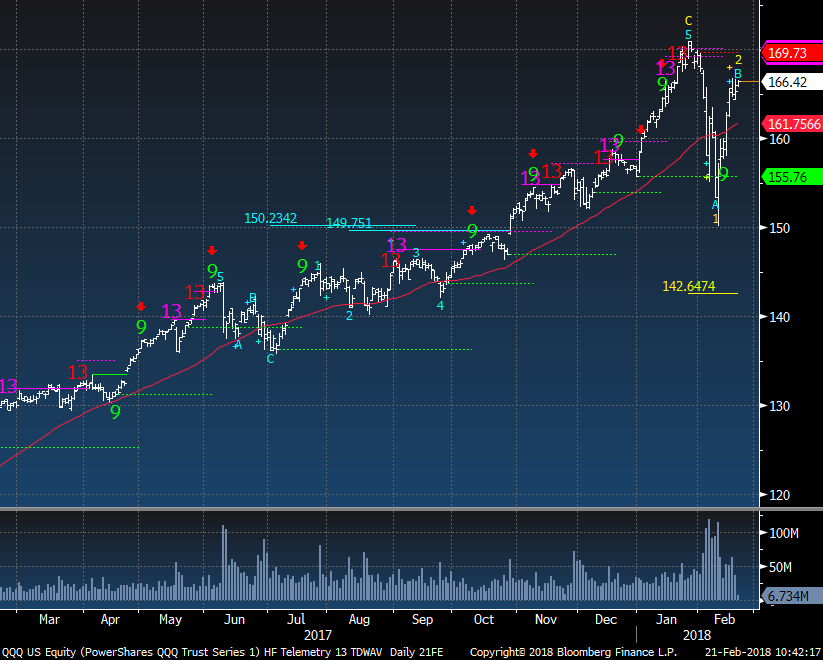
QQQ has been up above the 50 day due to the strength in the top 5 Nasdaq stocks. No new high yet on QQQ. The wave formation would be negated if a new closing high is achieved.
|
|
|
|
|
|
|
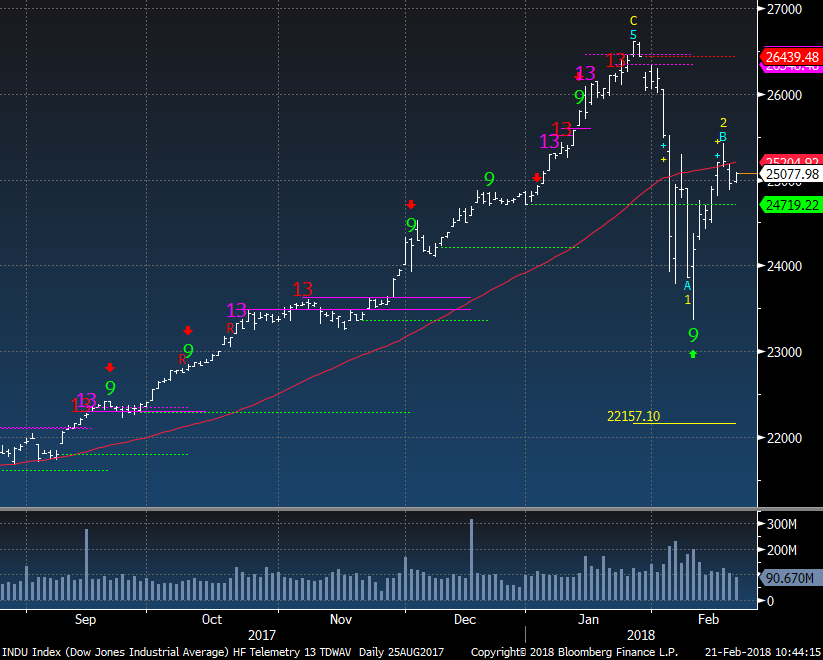
The Dow is back under the 50 day but up today. People are watching 25,000 as they generally gravitate at random round numbers with stops.
|
|
|
|
|
|
|
|
|
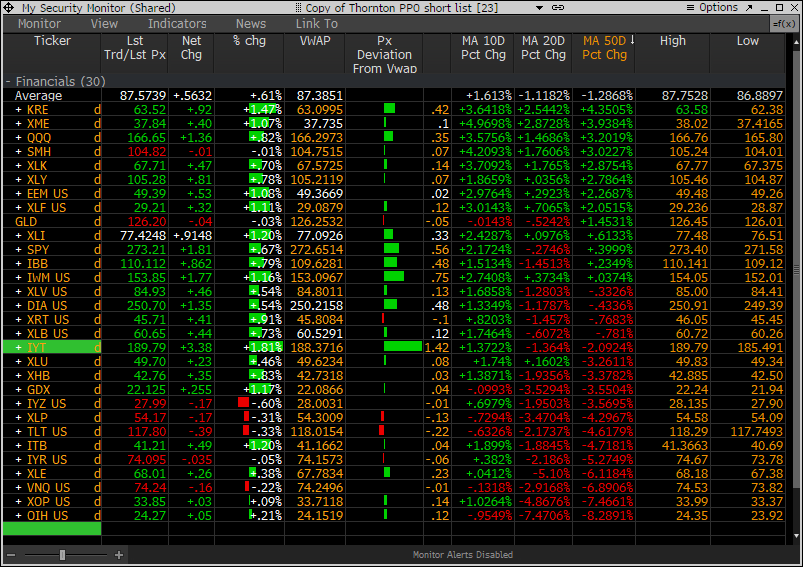
The PPO monitor (Percentage Price Oscillator) ranks sectors by +/- 50 day moving average. It's worked well spotting overbought and oversold readings in the last 30 days. If anyone on Bloomberg wants this IB me. Notable today is how gold which was at the top is moving lower and is now under the 10 and 20 day moving averages. Utilities which was at the lows is slowly moving up and is now above the 10 and 20 day moving averages. Regional banks still on top with naturally some tech focused sectors/indexes up there too. Energy is on the bottom and I feel energy stocks could
leg down from here.
|
|
|
|
|
|
|
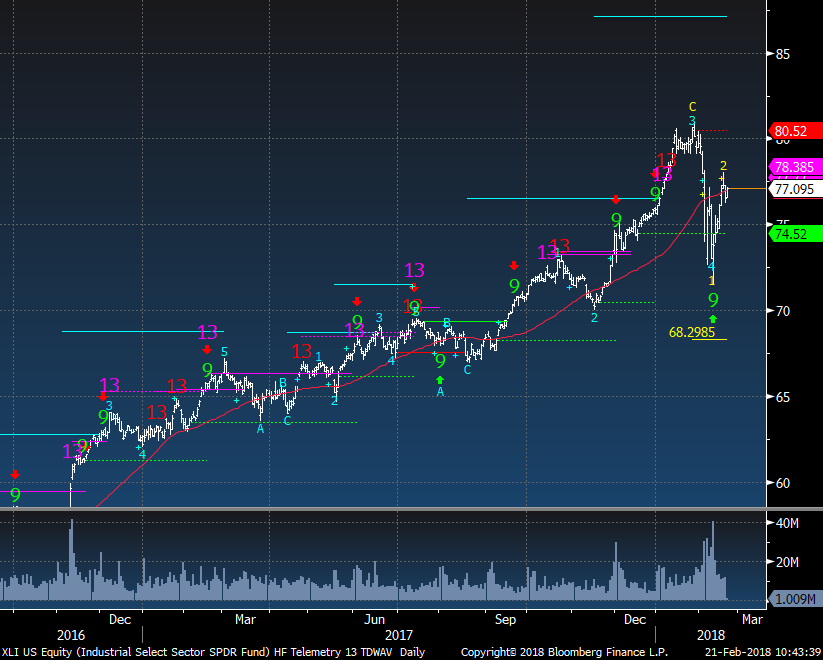
XLI Industrials is very important to the overall market. There are two wave scenarios happening here - First an upward wave 5 target above 85 but the recent high has to be surpassed. The second is a down wave 3 target of 68.29 and that would come into play if the recent low close breaks.
|
|
|
|
|
|
|
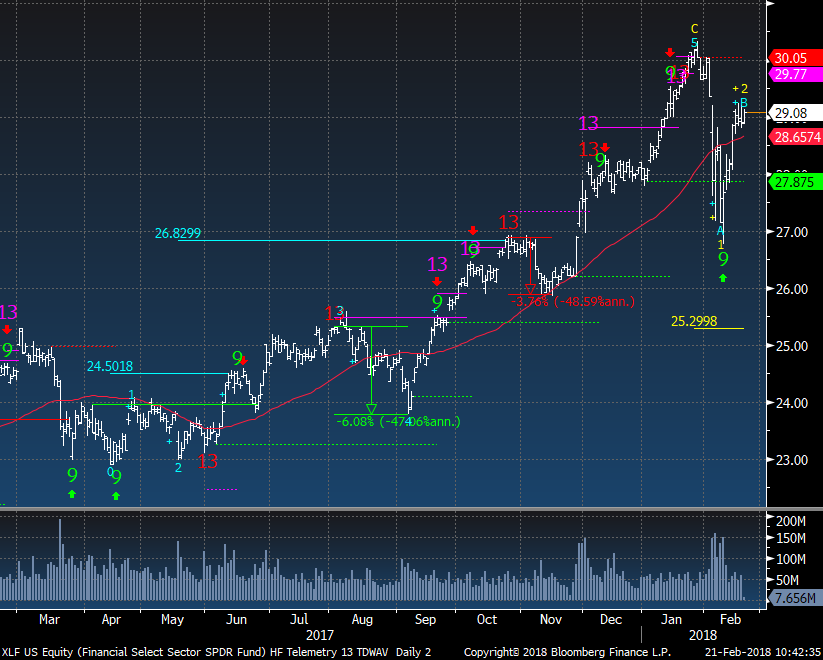
Financials XLF has a downside wave 3 target of 25.29. If the 50 day breaks, I would expect people will hit the sell button quickly
|
|
|
|
|
|
|
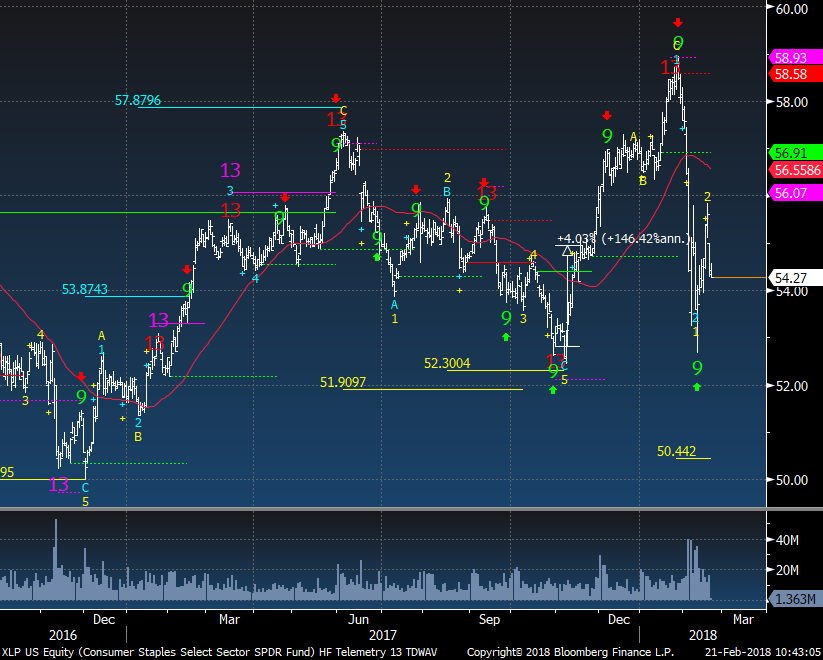
XLP Consumer Staples has a good record with the DeMark indicators after several good signals at tops and bottoms. I would avoid staples and selectively look for some shorts. Lots of overhead resistance.
|
|
|
|
|
|
|
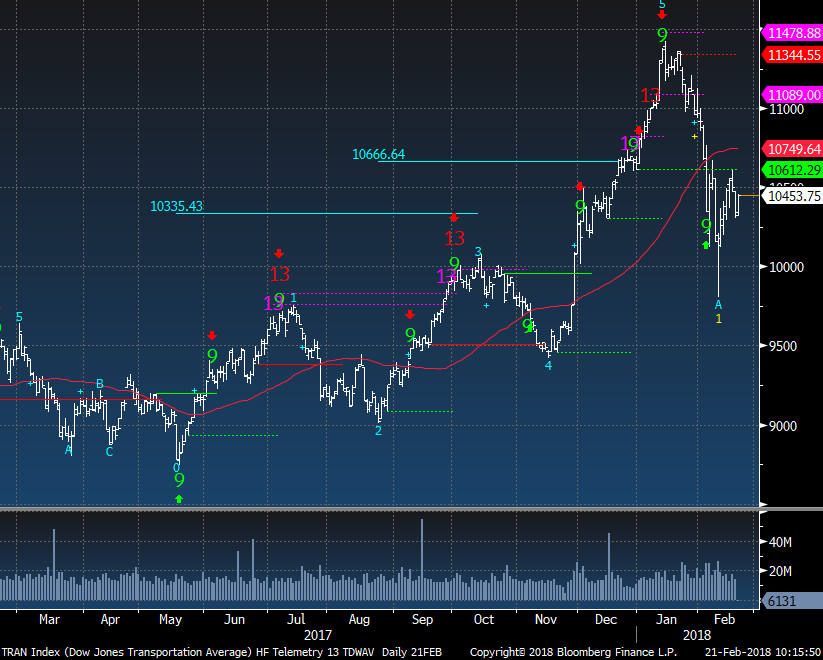
Transports are having a strong day today yet remains under the 50 day under performing most of the indexes. This will be an area I will start looking for short ideas
|
|
|
|
|
|
|
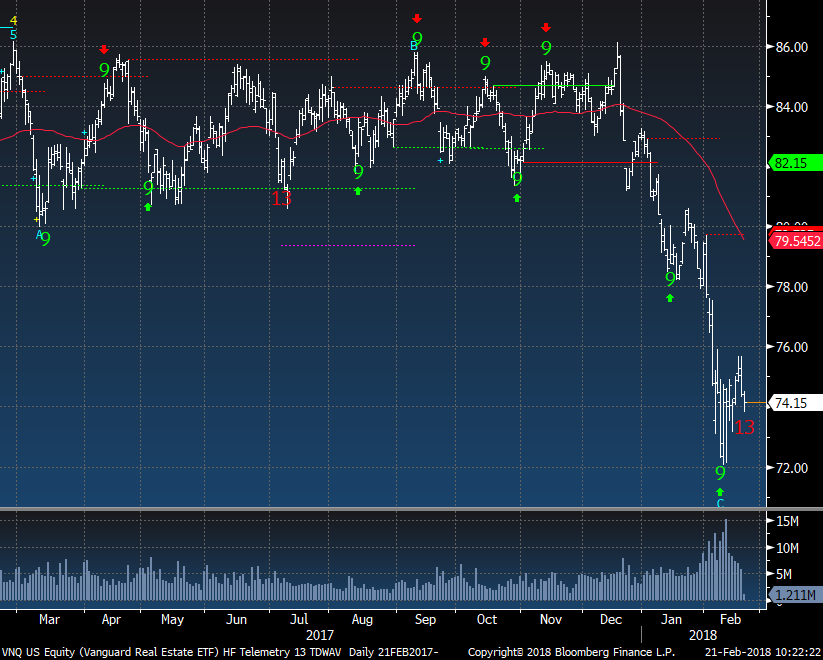
VNQ Real Estate finanaly had the downside red Countdown 13 trigger today. If looking for a defensive area, this could be a good spot to buy. You can define your risk by using a stop at the recent low.
|
|
|
|
|
|
|
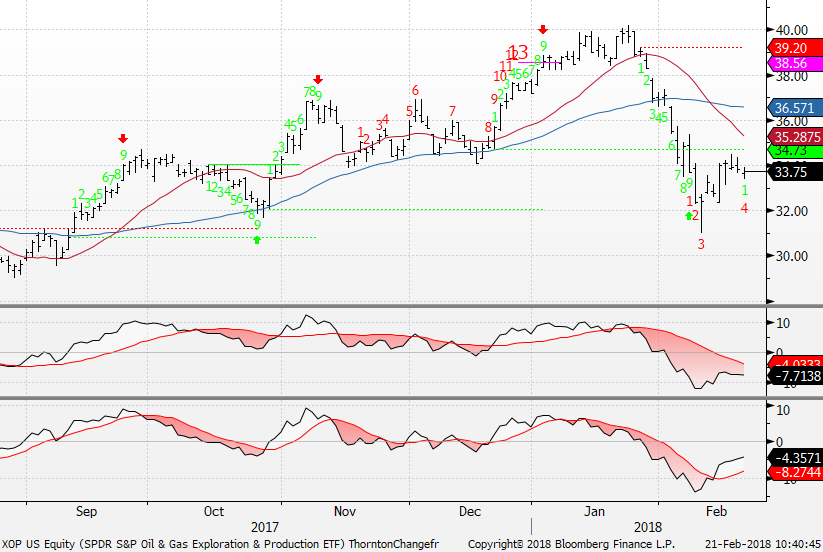
XOP Oil and Gas continues to under perform and is well under the 50 day and has a downside red Countdown on day 4 of 13.
|
|
|
|
|
|
|
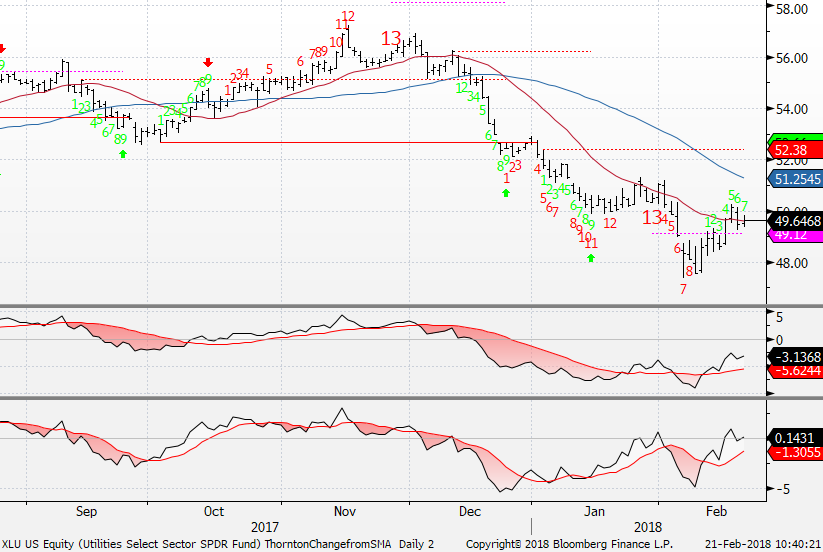
XLU Utilities is trying to base and is now back barely above the 20 day moving average. It's on day 7/9 with an upside green Setup and day 8 of 13 with a downside red Countdown. If this completes the upside green 9 (9 consecutive closes higher than 4 previous closes) then unfinished red Countdown is null.
|
|
|
|
|
|
|
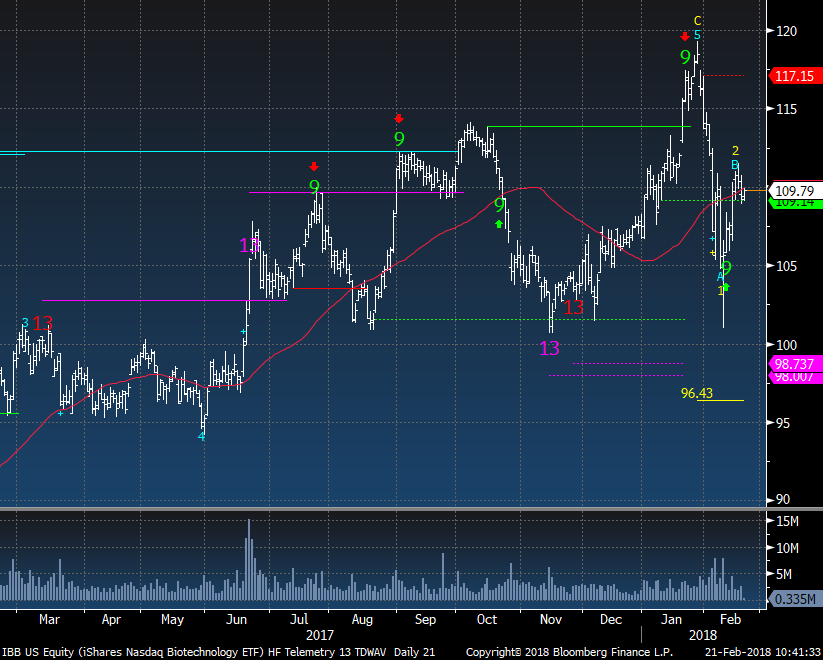
IBB Biotech is right at the 50 day moving average and in between the recent months range. If this breaks the recent closing low the downside wave 3 price objective comes into play at 96.43
|
|
|
|
|
|
|
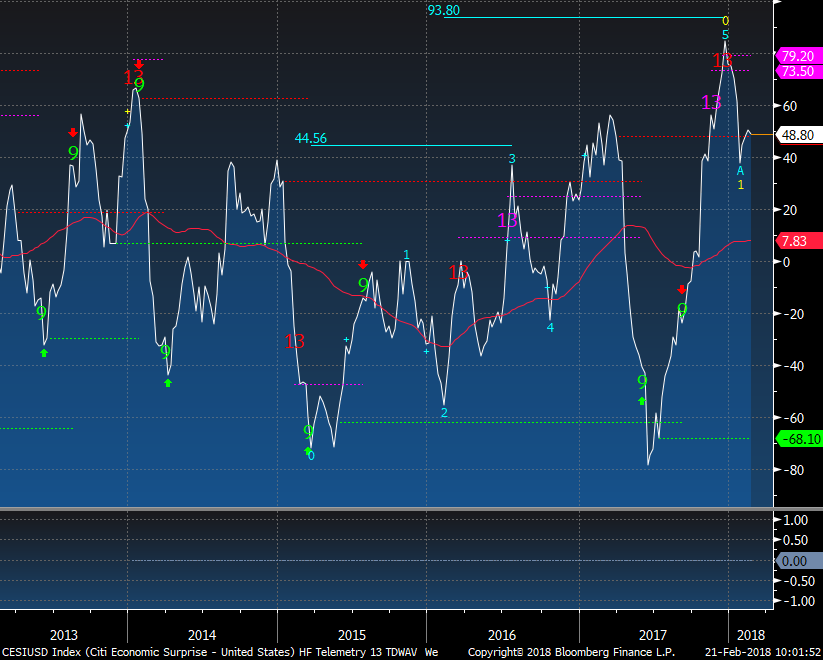
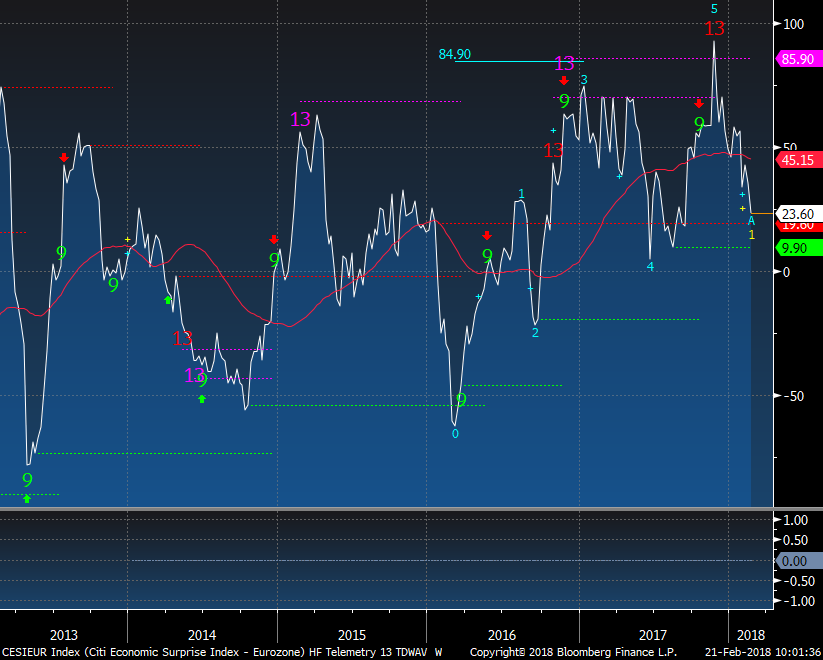
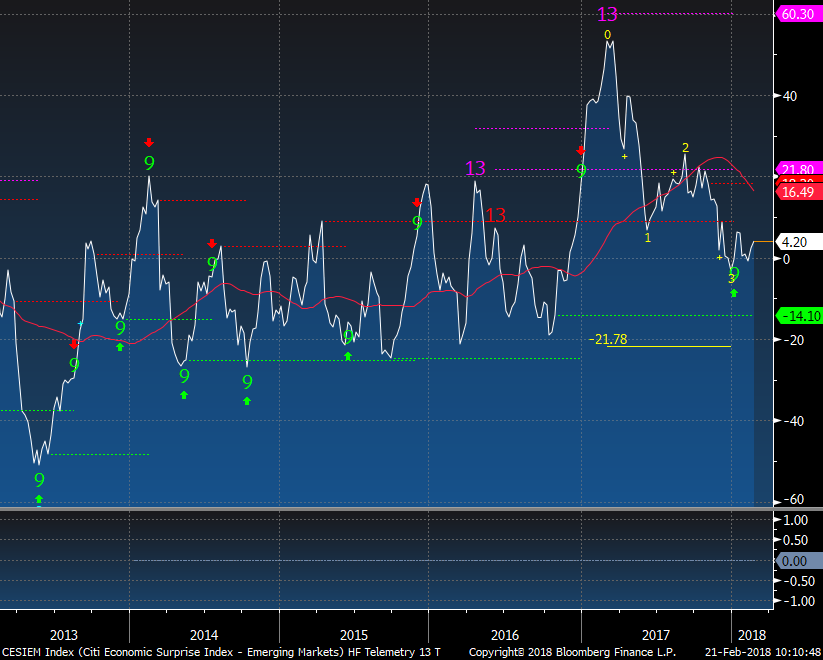
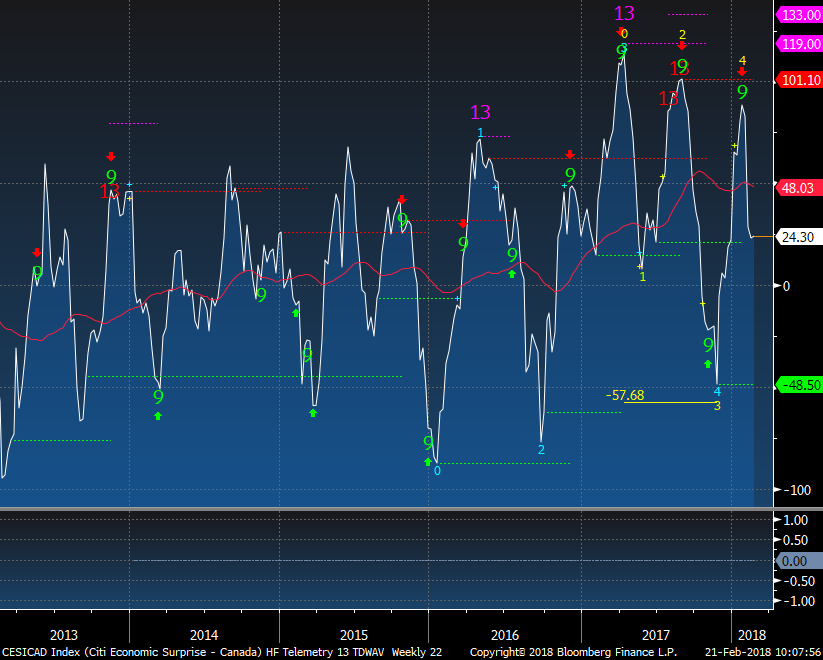
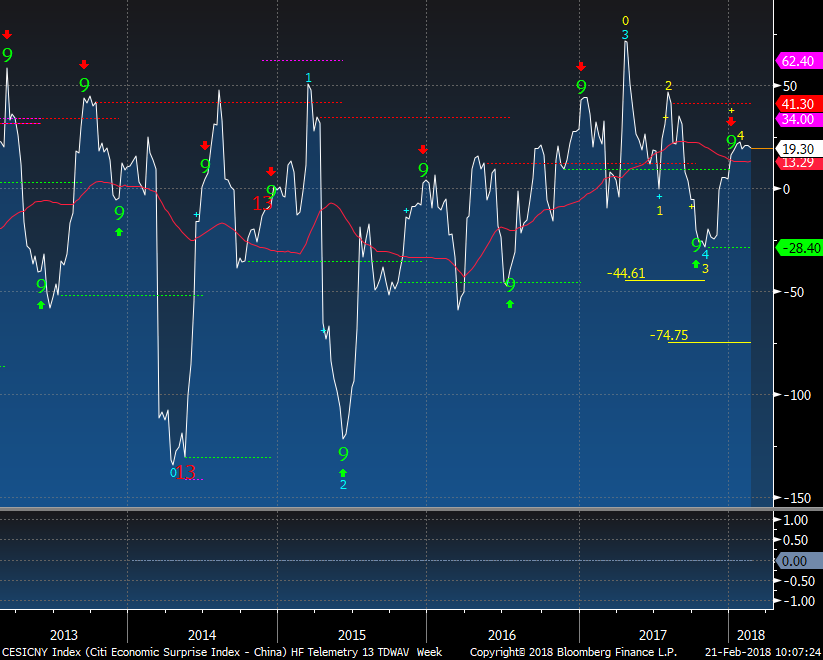
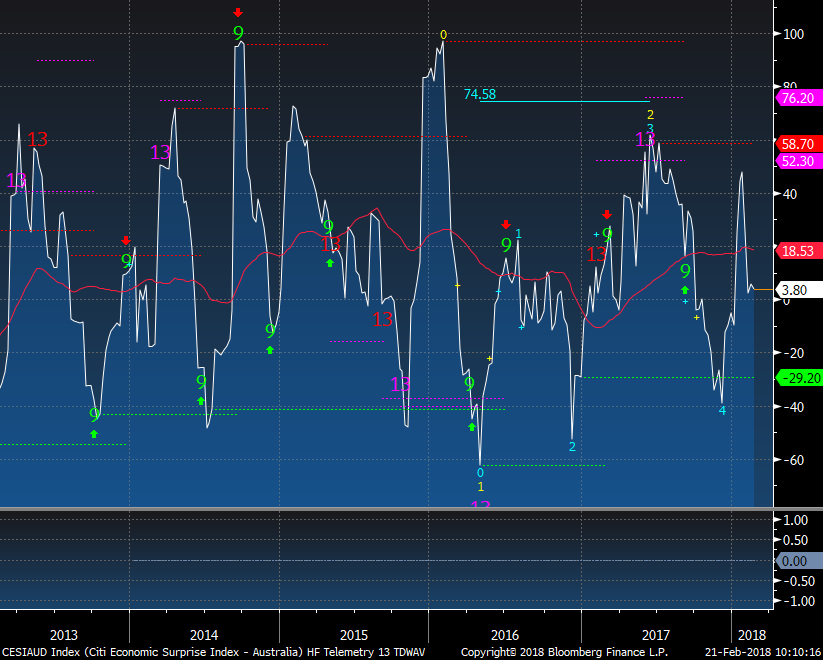
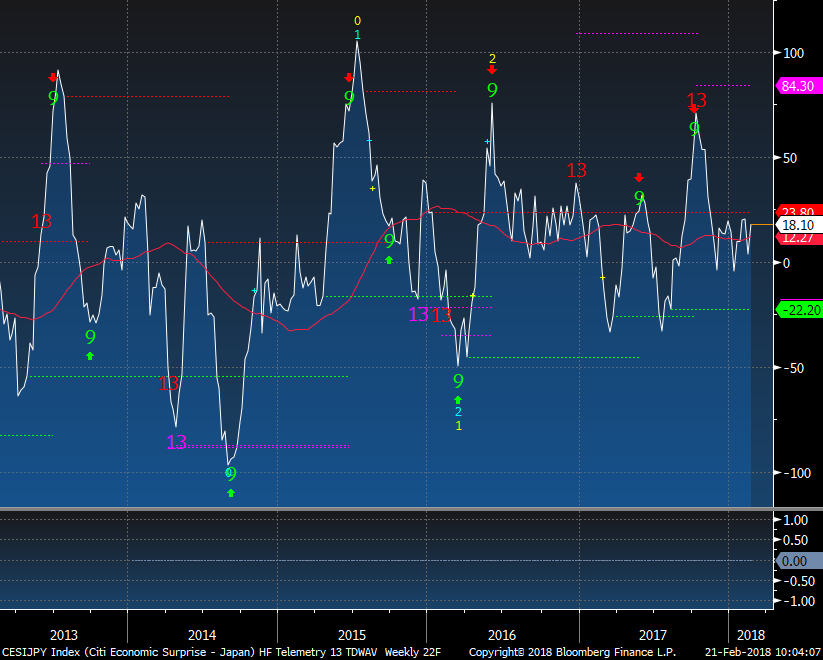
Citi Economic Surprise Indexes Around The World - Weekly Time Frame
|
|
|
US off the highs set in December with a slight bounce in the past couple weeks.
|
|
|
|
|
|
|
Eurozone continues lower suggesting estimates for Eurozone economic activity could be too high
|
|
|
|
|
|
|
Emerging Markets peaked in 2017 and estimates are in sync with economic activity
|
|
|
|
|
|
|
Canada peaked in early 2018 and typically bottoms at lower levels. Still too high of expectations
|
|
|
|
|
|
|
China seems like the economic reports beating expectations is starting to stall at a level where it's stalled in the past
|
|
|
|
|
|
|
Australia has been dropping and typically bottoms around -40
|
|
|
|
|
|
|
| Japan economic reports seem to be pretty in sync with estimates at the moment
|
|
|
|
|
|
|
|
|
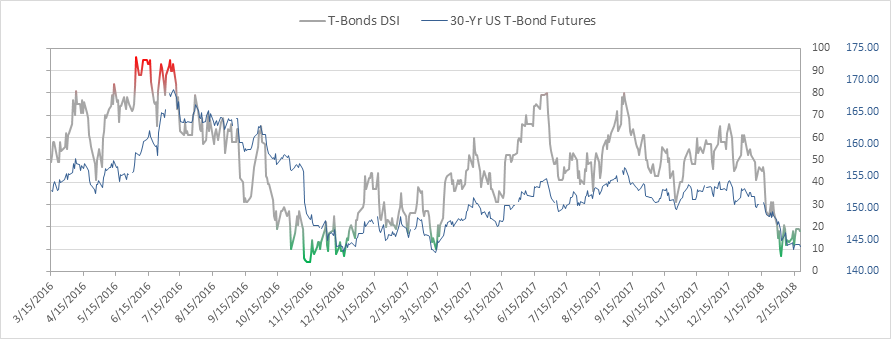
Bond bullish sentiment continues to grind at oversold levels at 18%.
|
|
|
|
|
|
|
TLT Bond ETF still is only on day 5 of 13 so no bond rally yet.
|
|
|
|
|
|
|
A few stocks with some DeMark signals
|
|
|
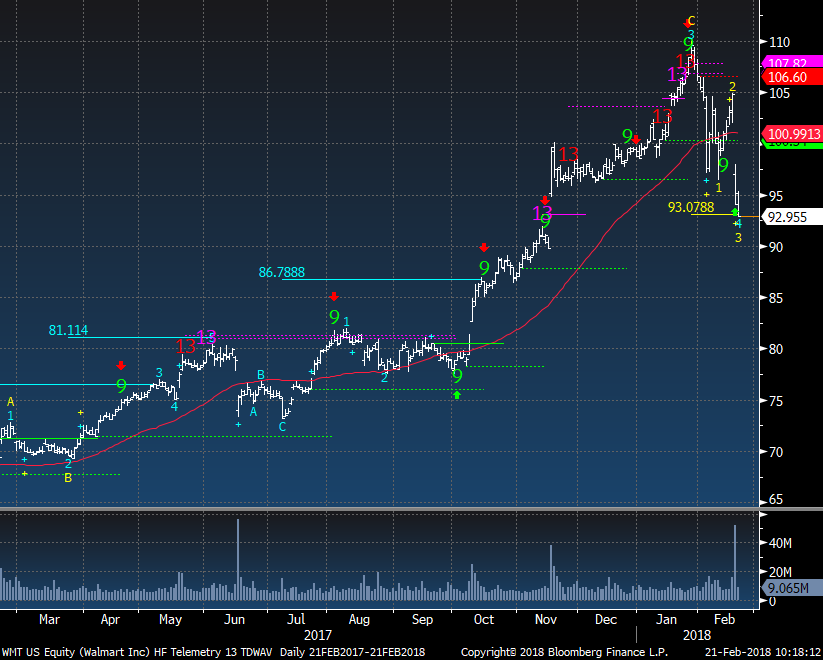
WMT Walmart yesterday's disaster dropping the most since 1998 after earnings. It's acheived the downside wave 3 downside price objective but I don't see support here yet so hold off on trying to catch this falling knife.
|
|
|
|
|
|
|
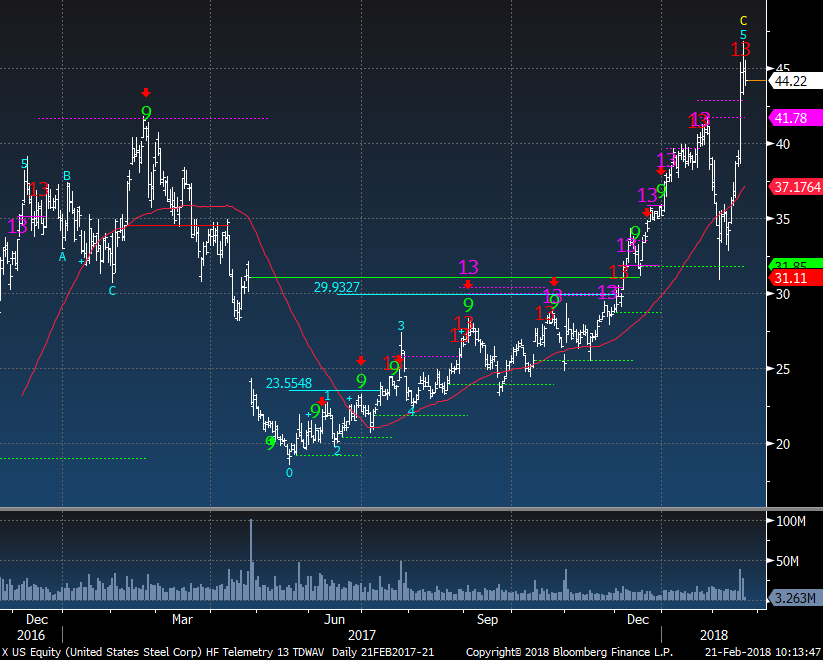
X US Steel has spiked in the past week and now has an upside red Countdown 13. It's 18% above the 50 day too which is overbought
|
|
|
|
|
|
|
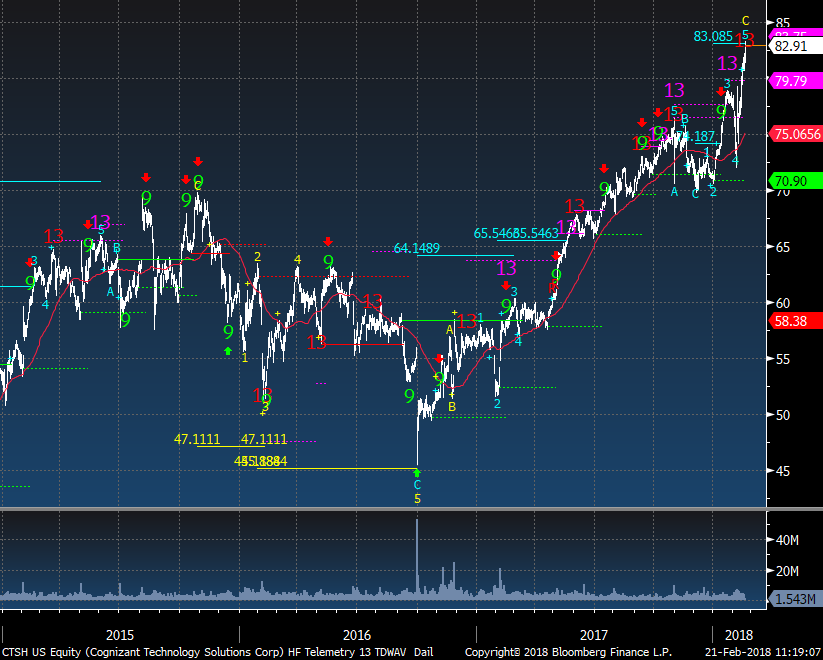
CTSH Cognizant Technology - aka as "Catshit" on trading desks has a new upside red Countdown 13 exhaustion at exactly the wave 5 upside price objective. I saw this on another note today talking about the breakout but I fade breakouts when there is an upside exhaustion signal
|
|
|
|
|
|
|
|
|
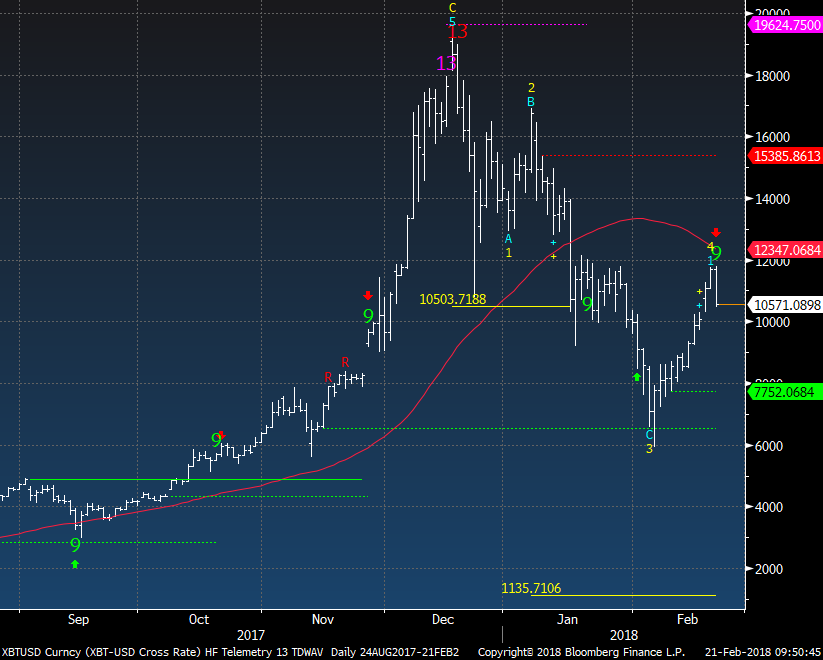
| XBTUSD has an upside green Setup 9 with a reversal down today. It's going to be very interesting to watch if this can break the recent lows and go for the wave 5 downside price objective of 1135.
|
|
|
|
|
|
|
DEMARK SCREENS - Daily, Weekly, Monthly Upside/Downside Exhaustion Signals
|
|
|
Daily/Weekly DeMark upside/downside exhaustion signals (Sequential) Weekly updated on Monday's. Price flips occur when a stock closes higher/lower than four previous closes.
S&P 1500 Universe:
DAILY UPSIDE 13: CTSH, FLS, IDXX, LH,
DAILY DOWNSIDE 13: CRVL, MHK, MSA
DAILY UPSIDE WITH PRICE FLIP REVERSAL DOWN: APEI, ETN, MATX
DAILY DOWNSIDE WITH PRICE FLIP REVERSAL UP: BBOX, PDCO
Updated: 2/20/18
WEEKLY UPSIDE 13: AOI
WEEKLY DOWNSIDE 13: ACN, ANDE, HWKN, MTSC, PSA
Updated: 2/1/1
MONTHLY UPSIDE 13: CHD, CLGX, CLX, CNMD, DVA, FICO, IDCC, MSCI, ORLY, PAYX, TFX, VMC, XYL
MONTHLY DOWNSIDE 13: GPOR
Euro Stoxx 600 Universe:
DAILY UPSIDE 13: HO FP
DAILY DOWNSIDE 13: NONE
DAILY UPSIDE WITH PRICE FLIP REVERSAL DOWN: KOMB CP
DAILY DOWNSIDE WITH PRICE FLIP REVERSAL UP: BWY LN, HMSO LN
Updated: 2/20/18
WEEKLY UPSIDE 13: AC FP, DB1 GR
WEEKLY DOWNSIDE 13: INTU LN, INVEB SS, ITV LN, MKS LN, NCCB SS, PFC LN, PROX BB, SESG FP, TELIA SS
Updated: 2/1/18
MONTHLY UPSIDE 13: COFB BB, GAS SM, GKN LN, ING FP, KINVB SS, OML LN, VIS SM
MONTHLY DOWNSIDE 13: NONE
|
|
|
Unsubscribe me from Hedge Fund Telemetry
Hedge Fund Telemetry LLC, P.O. Box 4675, Greenwich, CT 06861, United States
CONFIDENTIALITY NOTE and DISCLAIMER: This message is for the named person's use only. It may contain confidential, proprietary or legally privileged material. No confidentiality or privilege is waived by any accidental or unintentional transmission. If you receive this message in error, please immediately delete it and all copies of it from your system, destroy any hard copies and notify the sender. You must not, directly or indirectly, use, disclose,
distribute, print or copy any part of this message if you are not the intended recipient. Hedge Fund Telemetry LLC. cannot guarantee the confidentiality of the material transmitted; therefore, information of a sensitive or confidential nature should not be transmitted. There is risk in trading markets. Hedge Fund Telemetry LLC reports are based on information gathered from various sources and believed to be reliable, but are not guaranteed as to accuracy and completeness. The information is subject to change without notice and Hedge Fund Telemetry LLC has no obligation to provide any updates or changes. Hedge Fund Telemetry LLC is providing this data for informational and educational purposes and does not believe that it is sufficient to base an investment decision on. This information should not be regarded as a solicitation or recommendation of any particular security or to engage in any trading strategy. One should always check with your licensed financial
advisor to determine suitability of any investments.
|
|
|
|
|