If you are having difficulty seeing this email, you can view in your browser or click here to print.
|
|
|
|
|
09/06/2024
Thomas Thornton
|
|
|
Giving back the good employment report gains
|
|
|
Today's action is a continuation from yesterday's sell off. Nearly giving back the gains after the good employment report. As I mentioned yesterday, the VWAP levels from the employment report served as a good indicator for selling to accelerate. The good old FANG stocks are doing their part to try and hold things up with gains of nearly 1% while the S&P is down about .40%. Getting hit hard today are banks (including regional banks), transports, materials, retail and Boeing. As discussed often, the crazy narrow attribution within the Dow has seen BA attribute at the recent peak 6x the next largest attribute. It's still 1 1/2 greater than Goldman Sachs
despite BA pulling back pretty hard. The top 10 largest weights in the S&P equally weighted still remains 1.8% above pre employment report while the NDX is .88% above, and the S&P only .50% above that level.
Sentiment recently spiked rapidly back above 70% and some pullback was due from my experience using this data. The S&P is back down to the 50 day and many people will be watching that level too. Old resistance is now support. I still believe lower lows are ahead and don't be surprised if the selling picks up as we've seen the liquidity in the futures market remains thin. I would strongly advise raising cash if you haven't yet, tighten stops on longs, and to selectively own index puts with a small manageable size.
Notable:
- US Markets - Sentiment backed off from highs.
- European Markets - Still a little early to sound all clear
- Retail Sales - Today's big miss should not be a surprise
- Bloomberg World Index - Still more work to do on the downside
- US Market Capitalization - Looks like a major top is in place
- Bitcoin - A DeMark
lesson
- Financials
- Semiconductors
- Bonds
- DeMark Screens
|
|
|
|
|
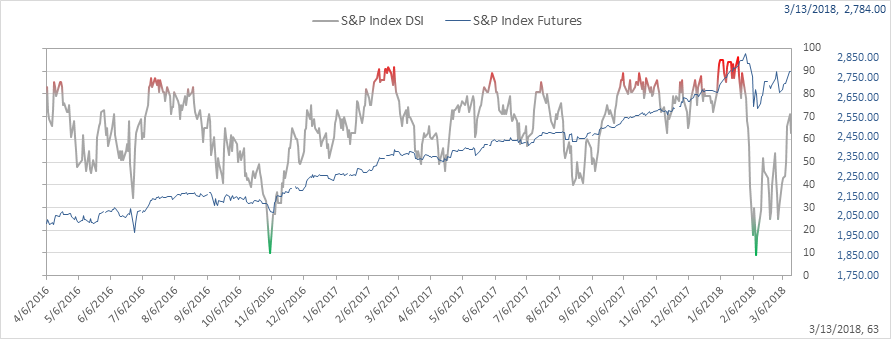
SPX bullish sentiment is at 63% down from 71% the previous day. Breaking 50% will likely see sellers head for the exits
|
|
|
|
|
|
|
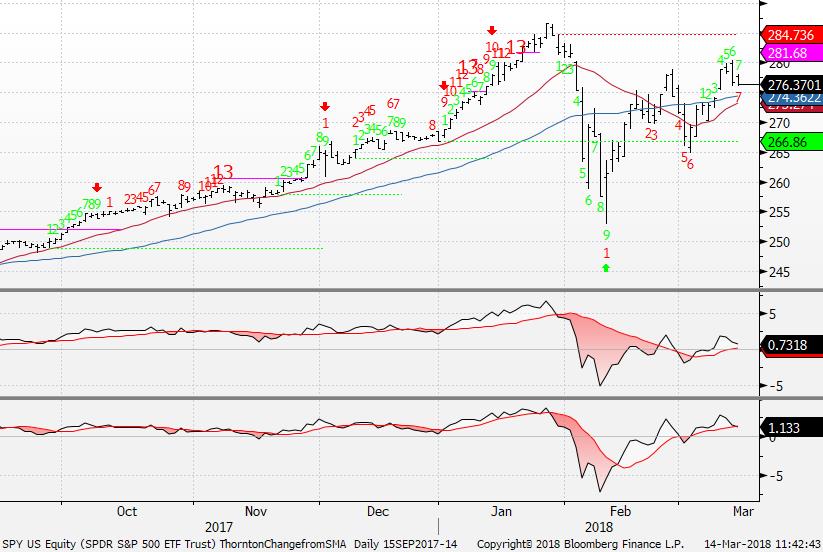
SPY daily with counts visible show this on day 7 of 13 with a downside red Countdown and a green Setup on day 7 of 9. Quite the battle. If the green Setup completes and closes 9 consecutive times above 4 previous closes then the red Countdown will be null. As of now the SPY will move higher in the next couple days. As usual I'm all over it.
|
|
|
|
|
|
|
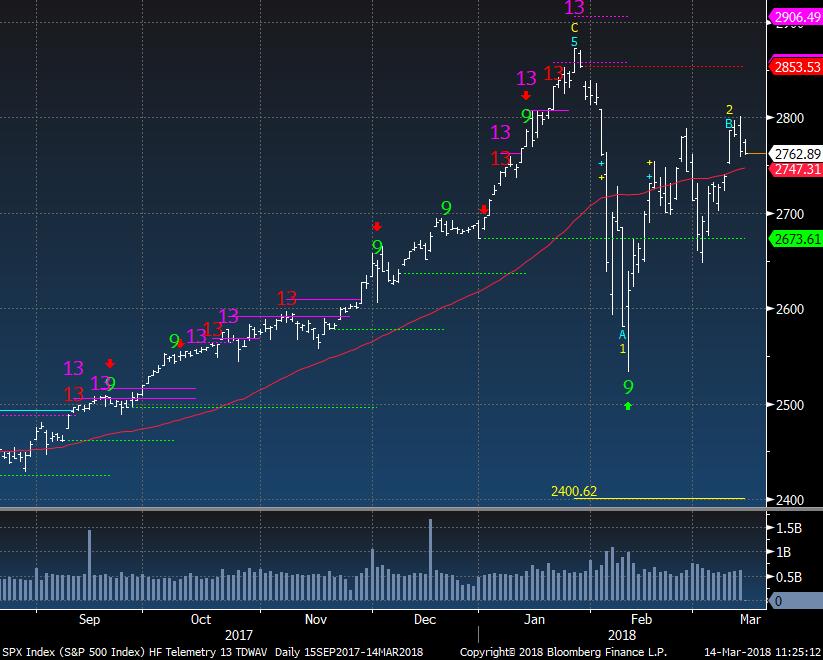
SPX wave pattern still is in play with a downside wave 3 price objective at 2400. The wave 3 would lock in with a close under the 2/8 close at 2581.
|
|
|
|
|
|
|
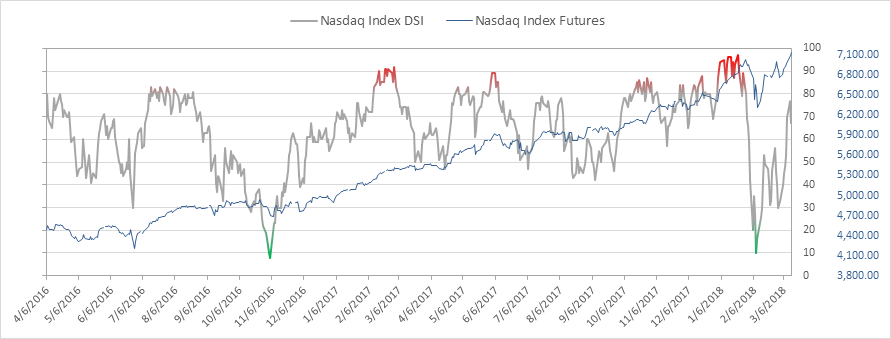
Nasdaq bullish sentiment is at 67% down from 77% the previous day.
|
|
|
|
|
|
|
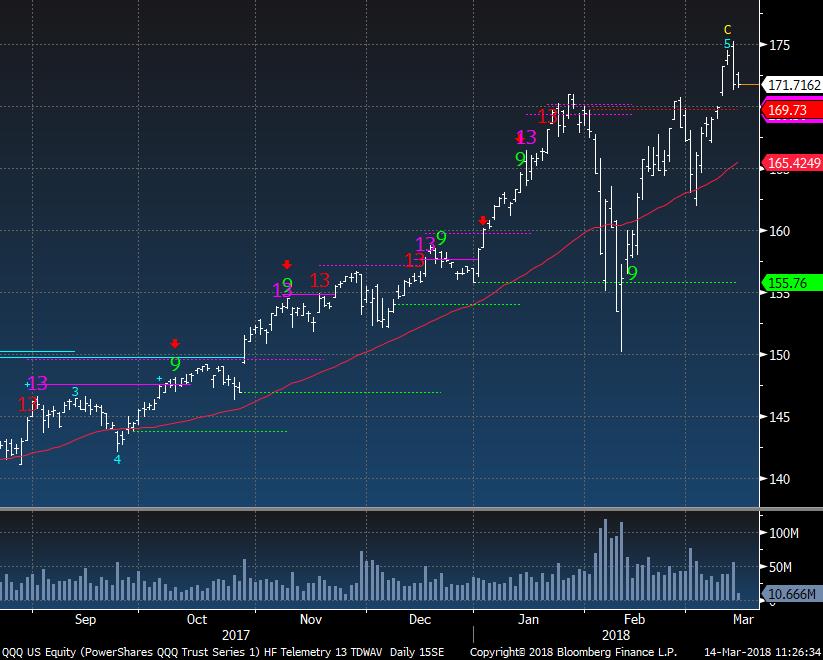
QQQ Nasdaq 100 has been the strongest of all the major US markets due to the concentration of mega weights. It's about 4% above the 50 day moving average and expect to see the 50 day touched again soon
|
|
|
|
|
|
|
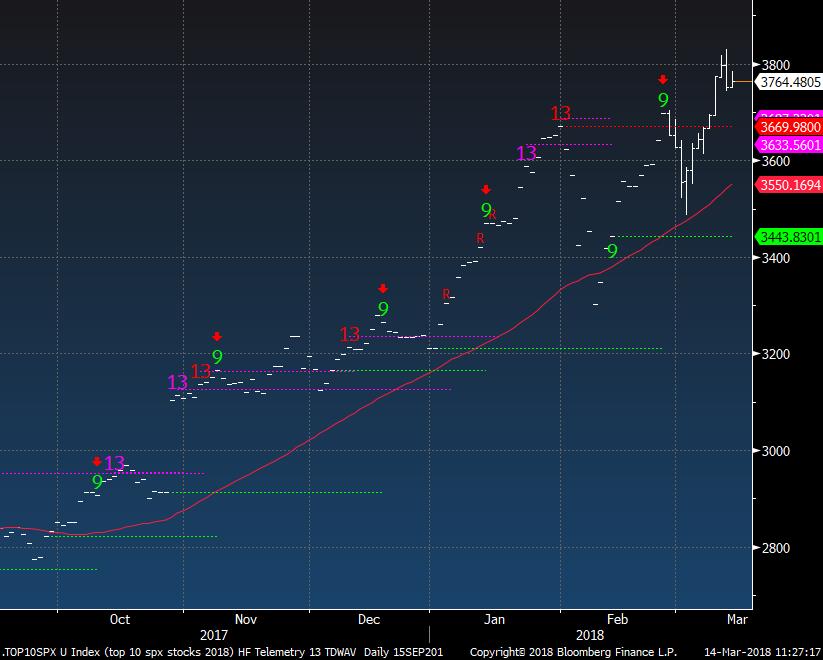
This is a custom index of the S&P top 10 weights (equally weighted) and it barely has retraced anything like other indexes. When these big weights give up, look out below! The S&P is nearly at the 50 day while this is 6% above the 50 day.
|
|
|
|
|
|
|
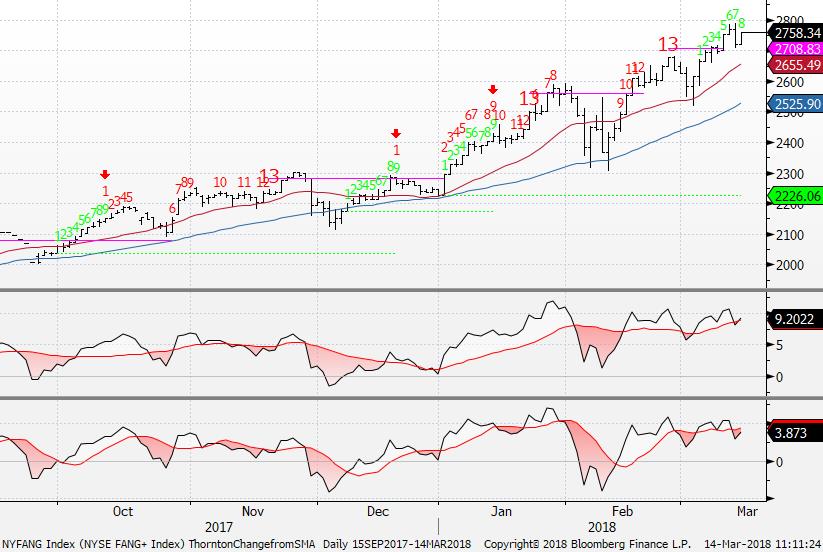
FANG+ is on day 8 of 9 with a green Setup count. It's 9.2% above the 50 day. People are hiding in these tech/consumer names and it's obvious.
|
|
|
|
|
|
|
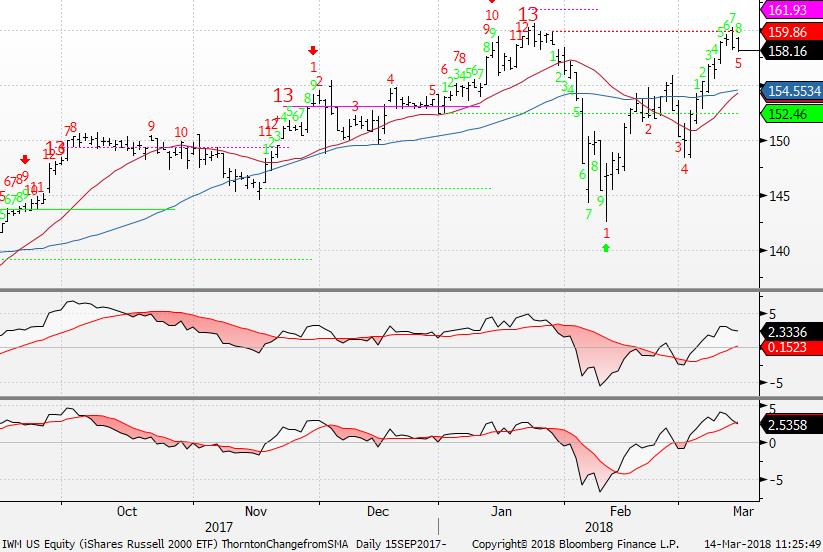
IWM Russell 2000 is on day 5 of 13 with a downside red Countdown but on day 8 of 9 with an upside green Setup. One of these counts will be gone tomorrow as the green Setup needs another day with it above 4 previous closes. That's going to take some muscle
|
|
|
|
|
|
|
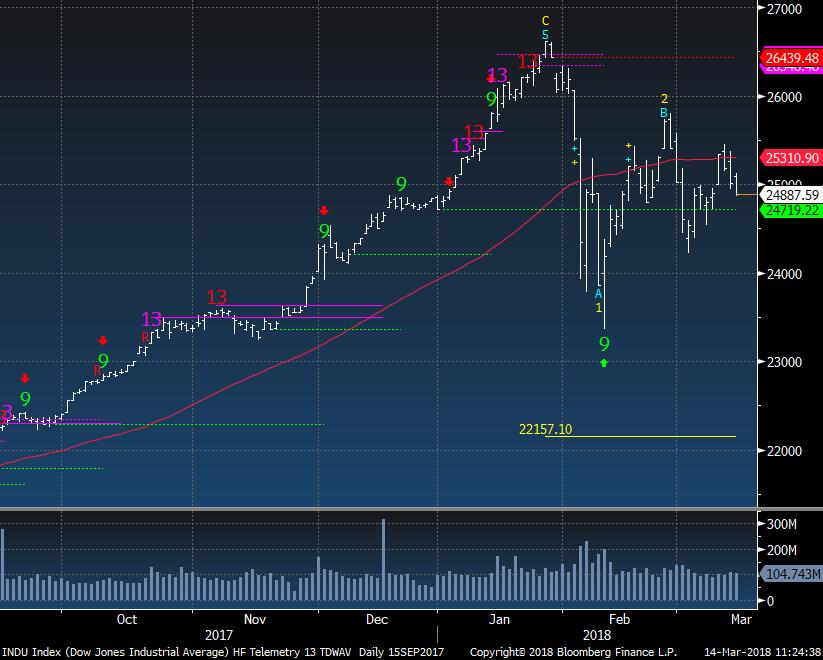
The Dow Jones Industrial Average is the weakest of all the major indexes. The downside wave 3 price objective is 22,157. I expect this index will hit circuit breakers -1800 soon.
|
|
|
|
|
|
|
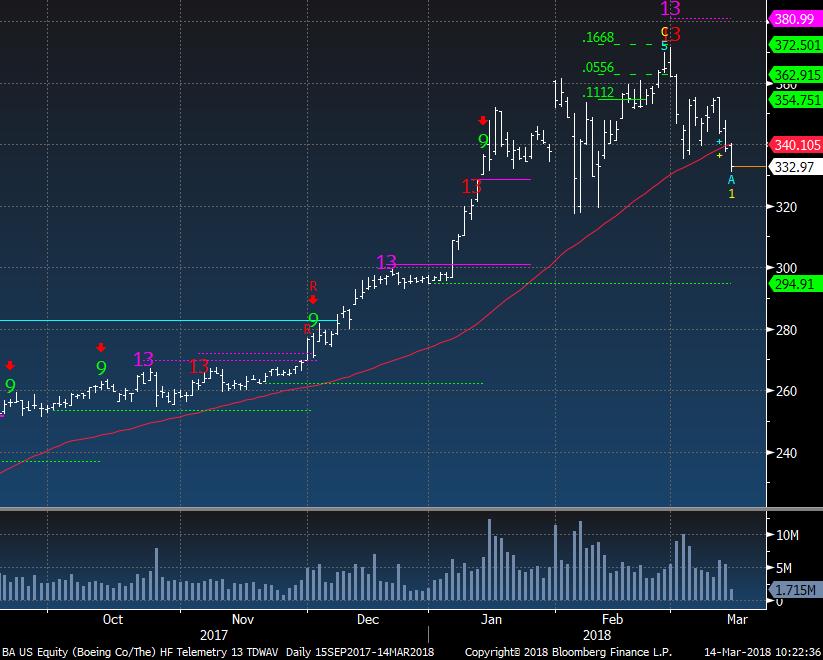
Boeing has broken the 50 day moving average today and could make a 9 week closing low this week. This was the reason the Dow went up so much and will also be the cause for it to go down too
|
|
|
|
|
|
|
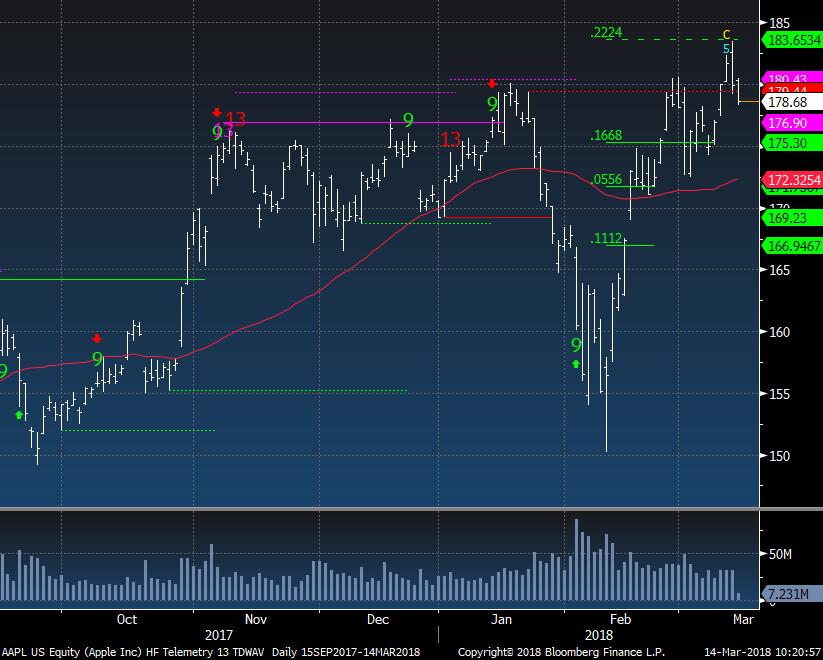
AAPL reached a DeMark Trend Factor target and reversed. So far this holds up OK and it's nearly 4% above the 50 day.
|
|
|
|
|
|
|
|
|
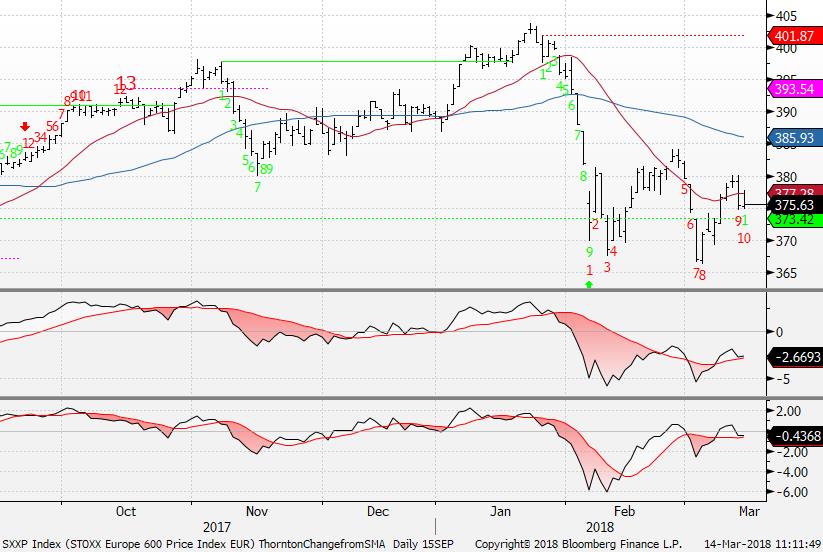
Euro Stoxx 600 still looks risky as it's on day 10 of 13 with a downside Countdown
|
|
|
|
|
|
|
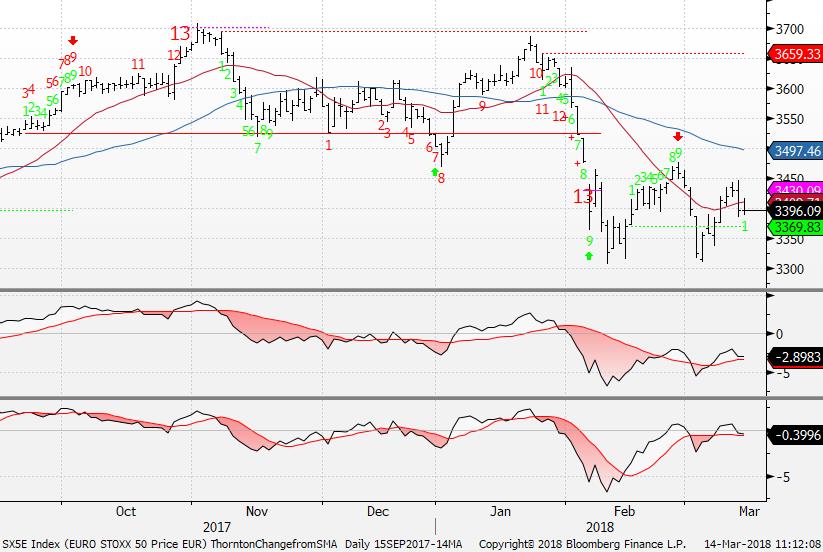
Euro Stoxx 50 doesn't have a count but continues to make lower highs. 3300 is important support
|
|
|
|
|
|
|
|
|
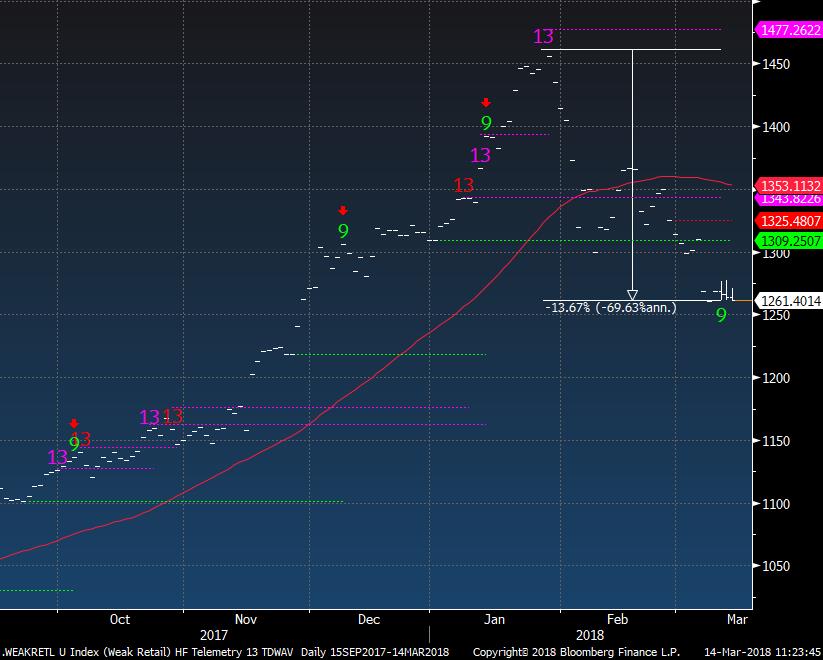
This is my basket of 14 big retail stocks that is below the February lows and most have reported weaker earnings or guided weak.
|
|
|
|
|
|
|
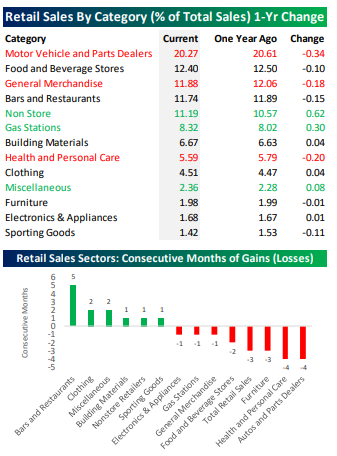
Today's retail sales number for February "surprised" missing espectations of +0.3% and reported -0.1%. Considering all of the companies have been talking about weakness, is anyone really surprised. Bars and Restaurants continue to lead while autos and parts dealers is very weak.
|
|
|
|
|
|
|
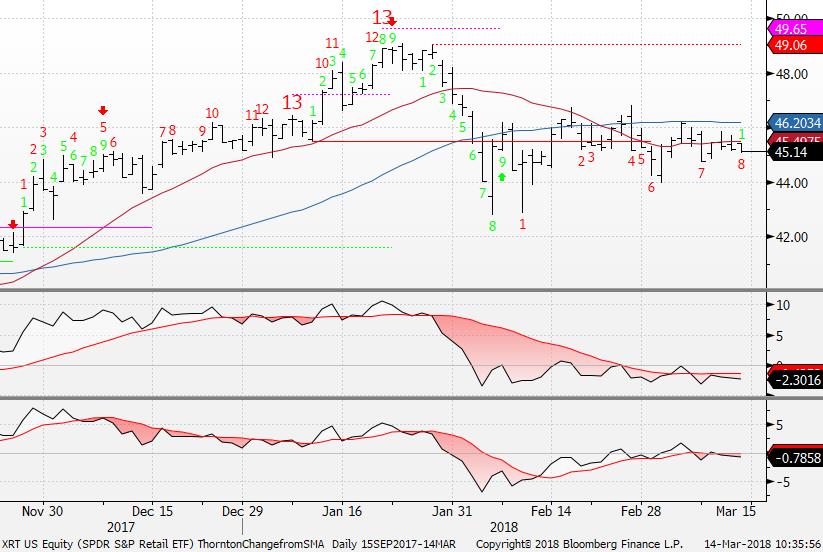
XRT Retail ETF was left for dead last Fall but had a "better" holiday season with such low expectations. It's currently on day 8 of 13 with a downside Countdown
|
|
|
|
|
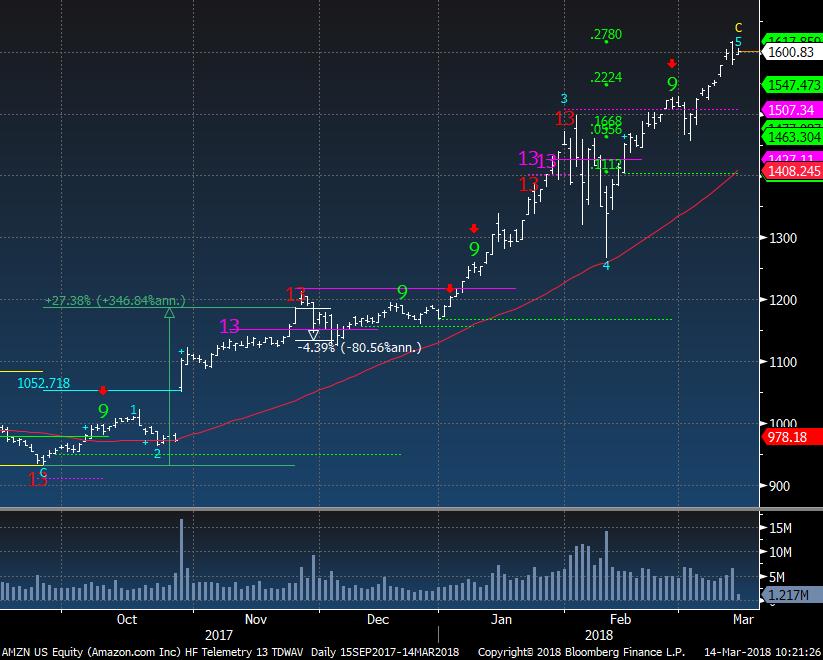
Amazon continues to move higher although it's now on day 8 of 13 with an upside red Countdown and green Setup on day 8 of 9. The green upside retracement Trend Factor hit top number was at 1617 right where it stalled the other day.
|
|
|
|
|
|
|
|
|
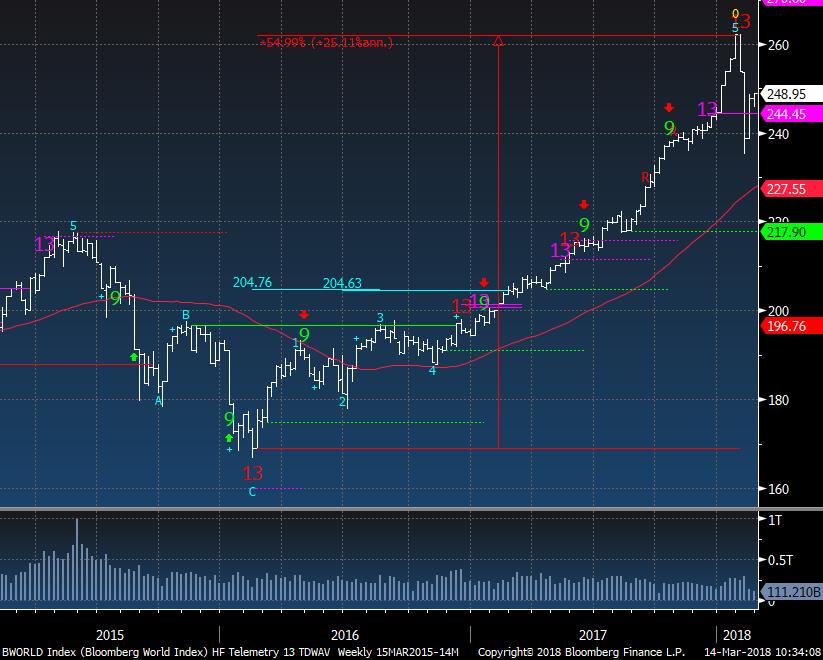
The weekly of the Bloomberg World Index still has more work to do on the downside
|
|
|
|
|
|
|
|
|
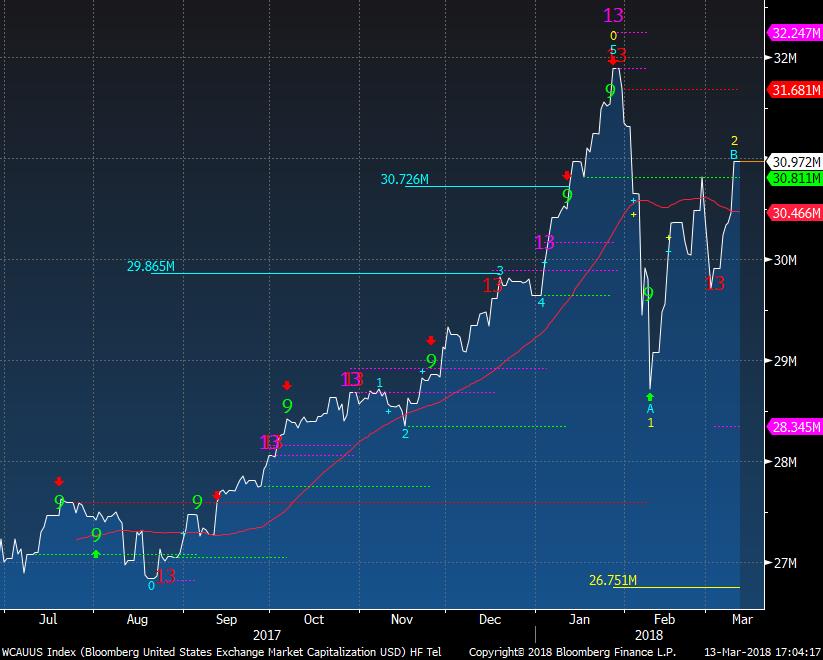
Here's the daily for the US market cap. Still well off the highs
|
|
|
|
|
|
|
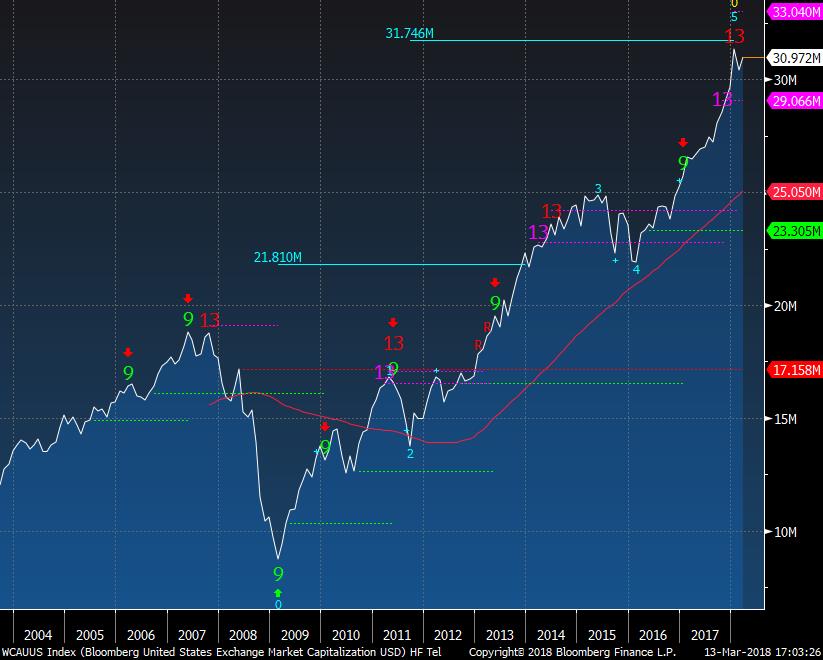
The monthly of the US market cap had an upside red Countdown 13 that has a decent record of turbulence ahead. Nearly hit the upside wave 5 price objective too
|
|
|
|
|
|
|
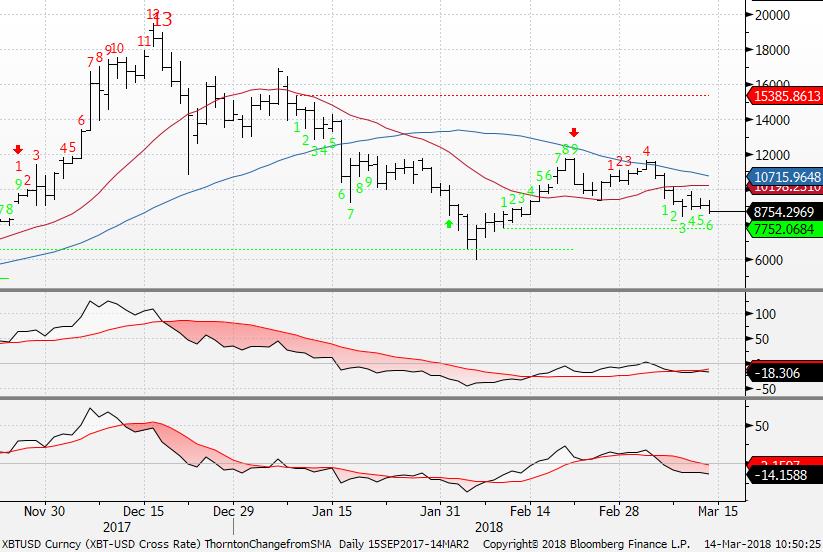
Bitcoin - A DeMark Lesson
|
|
|
The daily of XBT is a pretty good DeMark lesson. Setup 9's can be shorter term inflection points and most of the time cause a stall of the current trend. The red Countdowns are more powerful and signify important trend exhaustion. The current situation here shows an upside red Countdown on day 4 of 13 however there is a downside green Setup on day 6 of 9 and if this completes to 9 then the upside Countdown is null and it goes away. Watch the green TDST
dotted lines as those are created at the true low of the start of the counter trend (green 1's). These work as support as it did near 6000. 7752 is the next TDST to watch
|
|
|
|
|
|
|
|
|
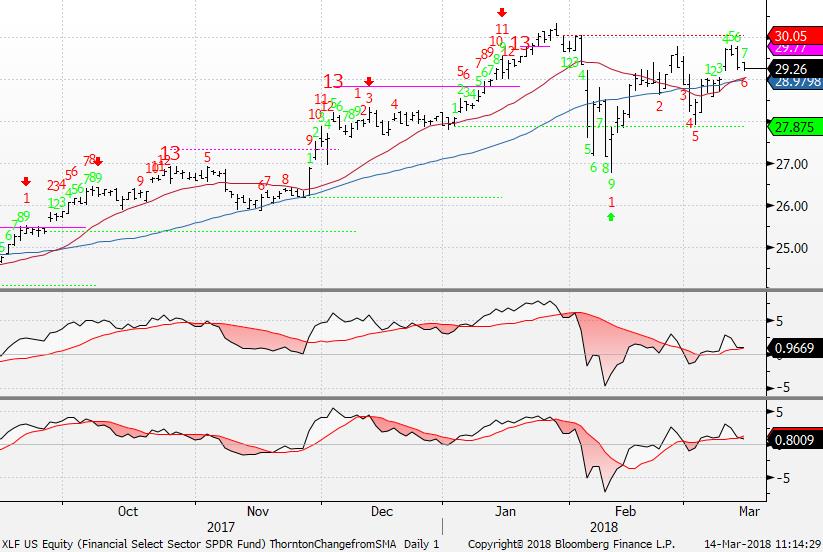
XLF ETF is holding the 50 day and also has the mixed DeMark picture.
|
|
|
|
|
|
|
|
|
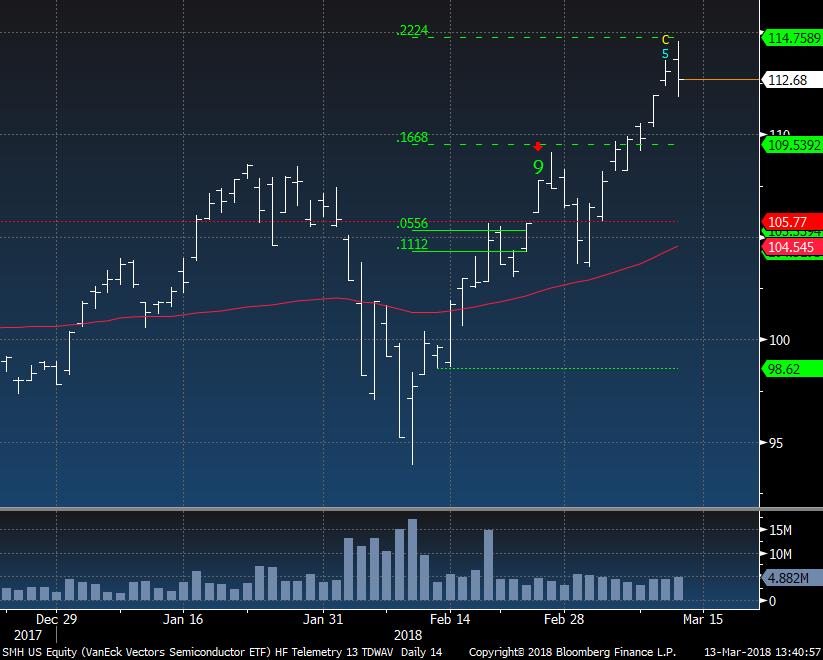
SMH ETF hit another upside Trend Factor and stalled.
|
|
|
|
|
|
|
|
|
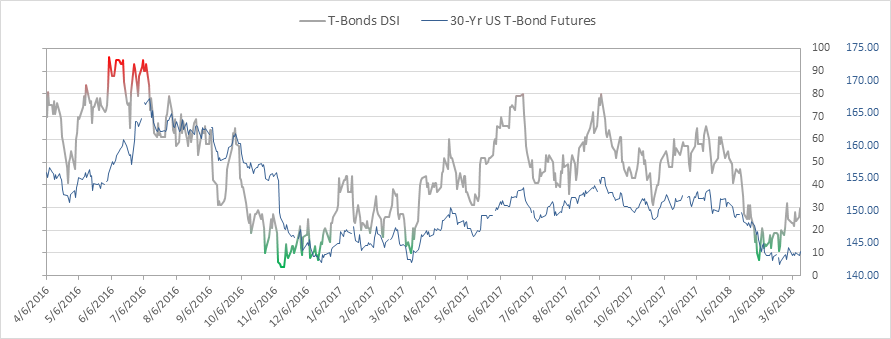
Bond bullish sentiment is at 30% and is quietly moving up.
|
|
|
|
|
|
|
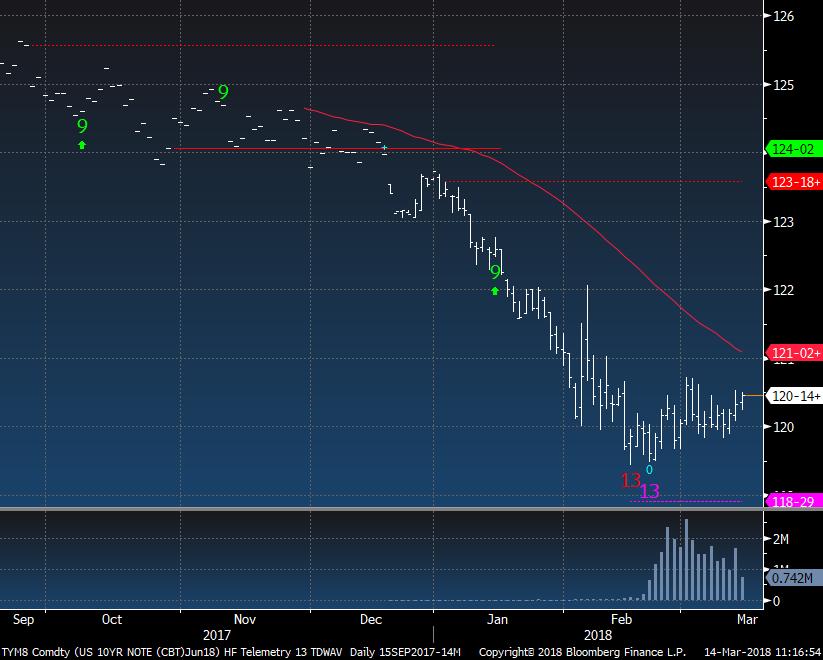
US 10 Year Futures is starting to interest me on the long side.
|
|
|
|
|
|
|
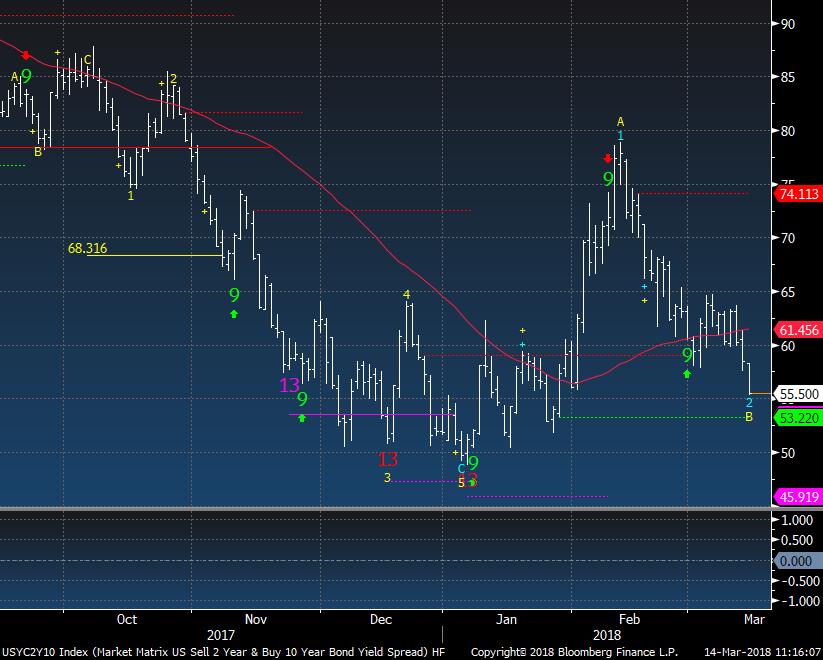
The daily of the US 2/10 spread continues to flatten. Note the weekly and monthly have seen downside exhaustion signals and those same signals were seen ahead of steepening - and recessions
|
|
|
|
|
|
|
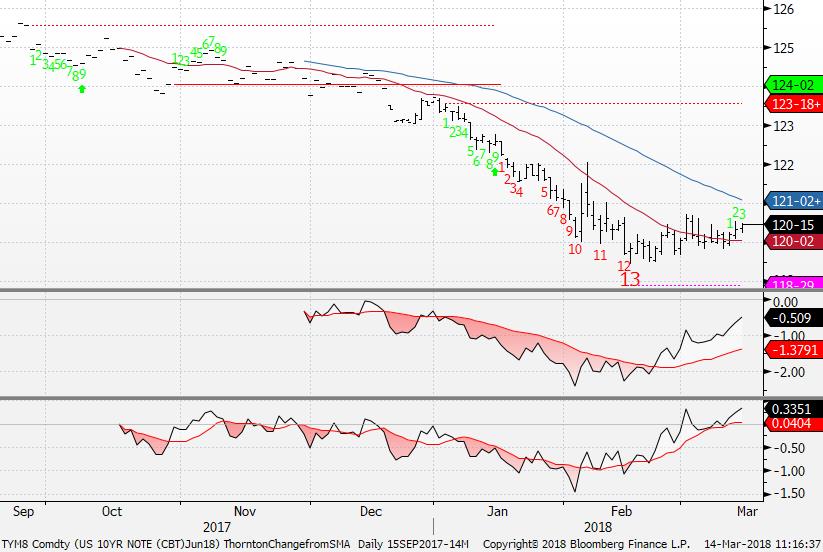
Another one of the 10 Year Futures show the new upside green Setup count.
|
|
|
|
|
|
|
DEMARK SCREENS - Daily, Weekly, Monthly Upside/Downside Exhaustion Signals
|
|
|
Daily/Weekly DeMark upside/downside exhaustion signals (Sequential) Weekly updated on Monday's. Price flips occur when a stock closes higher/lower than four previous closes.
S&P 1500 Universe:
DAILY UPSIDE 13: AMT, DXPE, EBAY, GHC, IART, JBT, SNV, WRB
DAILY DOWNSIDE 13: CDR
DAILY UPSIDE WITH PRICE FLIP REVERSAL DOWN: ANDE, CMA, EBAY, HCI, RF, SYNA, UHS
DAILY DOWNSIDE WITH PRICE FLIP REVERSAL UP: BBOX, ROSE, VVC
Updated: 3/12/18
WEEKLY UPSIDE 13: CNC, CRL, FDS, JBHT, LMNX, LPSN, MGLN, MSCI, PRFT, RHT, SRDX, TDS, TXN, WDC
WEEKLY DOWNSIDE 13: FSP, HOG, SAH
Updated: 3/1/1
MONTHLY UPSIDE 13: BDX, BMY, CAT, COL, CW, EBIX, GNCMA, IRBT, MMSI, NFLX
MONTHLY DOWNSIDE 13: CHK, SVU, WIN
Euro Stoxx 600 Universe:
DAILY UPSIDE 13: NONE
DAILY DOWNSIDE 13: MTX GR, TATE LN
DAILY UPSIDE WITH PRICE FLIP REVERSAL DOWN: EBS AV, HNR1 GR, INVP LN, SKG ID
DAILY DOWNSIDE WITH PRICE FLIP REVERSAL UP: NONE
Updated: 3/12/18
WEEKLY UPSIDE 13: COB LN, EBS AV, GET FP, MRL SM
WEEKLY DOWNSIDE 13: FGP LN, HMSO LN, MRK GR, ONTEX BB, SBMO NA, SIE GR
Updated: 3/1/18
MONTHLY UPSIDE 13: ASML NA, ENX FP, FI/N SW, INVP LN, SAB SM, SCR FP, US IM
MONTHLY DOWNSIDE 13: NONE
|
|
|
Unsubscribe me from Hedge Fund Telemetry
Hedge Fund Telemetry LLC, P.O. Box 4675, Greenwich, CT 06861, United States
CONFIDENTIALITY NOTE and DISCLAIMER: This message is for the named person's use only. It may contain confidential, proprietary or legally privileged material. No confidentiality or privilege is waived by any accidental or unintentional transmission. If you receive this message in error, please immediately delete it and all copies of it from your system, destroy any hard copies and notify the sender. You must not, directly or indirectly, use, disclose,
distribute, print or copy any part of this message if you are not the intended recipient. Hedge Fund Telemetry LLC. cannot guarantee the confidentiality of the material transmitted; therefore, information of a sensitive or confidential nature should not be transmitted. There is risk in trading markets. Hedge Fund Telemetry LLC reports are based on information gathered from various sources and believed to be reliable, but are not guaranteed as to accuracy and completeness. The information is subject to change without notice and Hedge Fund Telemetry LLC has no obligation to provide any updates or changes. Hedge Fund Telemetry LLC is providing this data for informational and educational purposes and does not believe that it is sufficient to base an investment decision on. This information should not be regarded as a solicitation or recommendation of any particular security or to engage in any trading strategy. One should always check with your licensed financial
advisor to determine suitability of any investments.
|
|
|
|
|