If you are having difficulty seeing this email, you can view in your browser or click here to
print.
|
|
|
|
|
04/25/2024
Thomas Thornton
|
|
|
|
|
It's Friday and it's been a long week. There seems to be a red 13 hovering over my head as I'm exhausted. Quite a lot of market action to discuss so I'll do it with the charts. Some real significant developments on some major indexes.
A few housekeeping notes: First, I sold half of my April puts on SPY, QQQ, IWM, and DIA yesterday late in the day and gave notice on Twitter. If you didn't see it, you can cut your half at much better prices today. On average the gains are about 2x so for
risk management and sizing purposes I wanted to reduce exposure. And considering the March puts in SPY and QQQ went to zero (2.5% size) I wanted to lock in some nice gains for March. Secondly, Dave Bergerson, my institutional sales guy has reached out to some of your receiving the Daily Note on trial. If you want to sign up, have any questions with payments via soft dollar brokers, he's the man to email dave@hedgefundtelemetry.com (Thank you for all of your support as we are excited about investing more into the platform). Finally, I am still working on a new DeMark Indicator Primer document and once it's done it will be sent to you. Have a great
weekend!
Notable:
- US Markets - Sentiment dropped hard but still not yet at Feb lows. Some downside exhaustion signals are starting and I am looking at a conservative setting that might work better for now
- Micron Technology - You can't always get what you want...
- Bloomberg World Index - Downside exhaustion yet the alternative setting might be better
- European Markets - Some more downside exhaustion signals but in wave 3
- Asian Markets -
Some more exhaustion signals too
- Smart Money Flow - Downside exhaustion signals here too
- Gold Update - I'm still neutral
- Copper - Now at my downside price level
- Soybean - Decent drop holding 50 day - take some profits
- Bonds - Sentiment increasing yet not quite there for me to buy
- DeMark Screens - Not enough downside exhaustion signals yet on individual
stocks relative to the indexes with exhaustion signals.
|
|
|
|
|
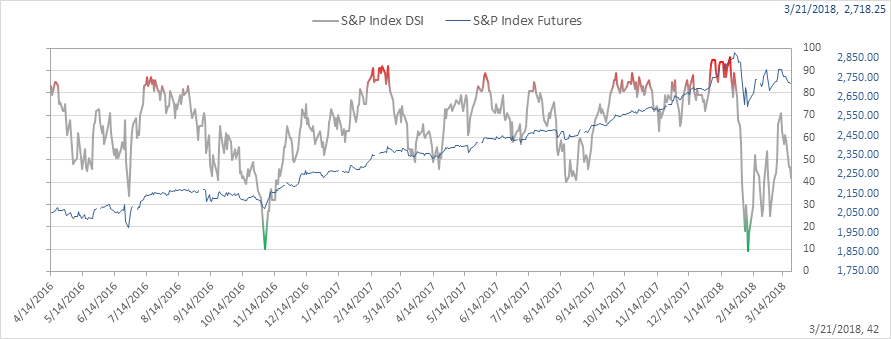
SPX bullish sentiment dropped to 26% from 42% which is also down from 59% in a week. The sentiment low in February was 9% and at the time I said expect a bounce but the volatility isn't done.
Here's a link to the Hedge Fund Telemetry website market sentiment page with 40 charts of sentiment with equities, bonds, commodities, and commodities updated each day.
|
|
|
|
|
|
|
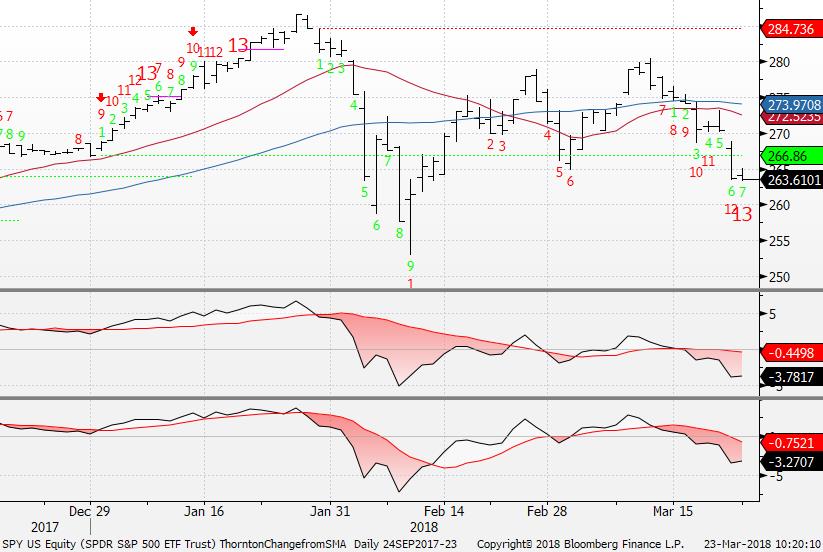
So here's a bit of a conundrum, this is the SPY daily with a downside red 13 exhaustion with standard settings. I always stick to the standard settings and this follows other indexes (Europe, Asia) with downside exhaustion 13's. This is a good thing right? Well considering the red Countdown stretched over a month (remember the red Countdowns don't have to come in exact order) there is another way to look at this...
|
|
|
|
|
|
|
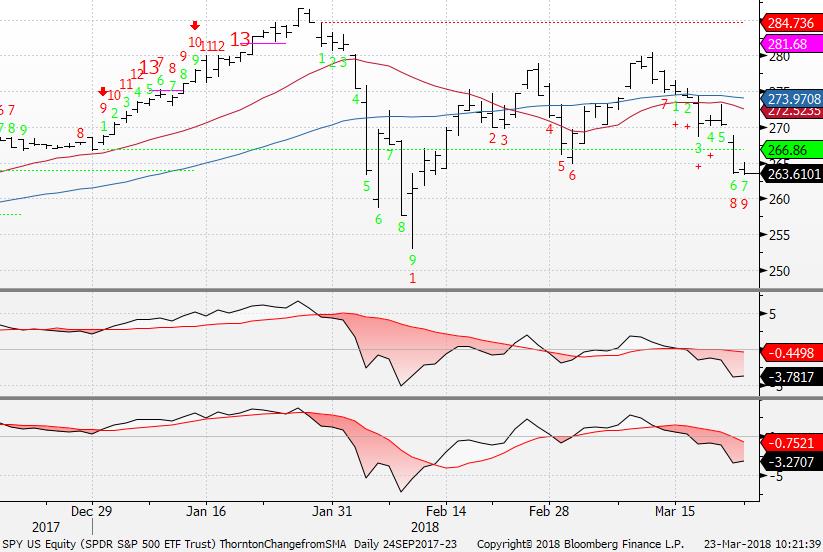
Below is the SPY but with a modified more conservative setting (5vs8) where the 8th red bar has to occur under the 5th red bar. We already have discussed how the 13th bar has to occur under the 8th red bar but this takes it a bit further and at this point it might be a better read. We will see.
|
|
|
|
|
|
|
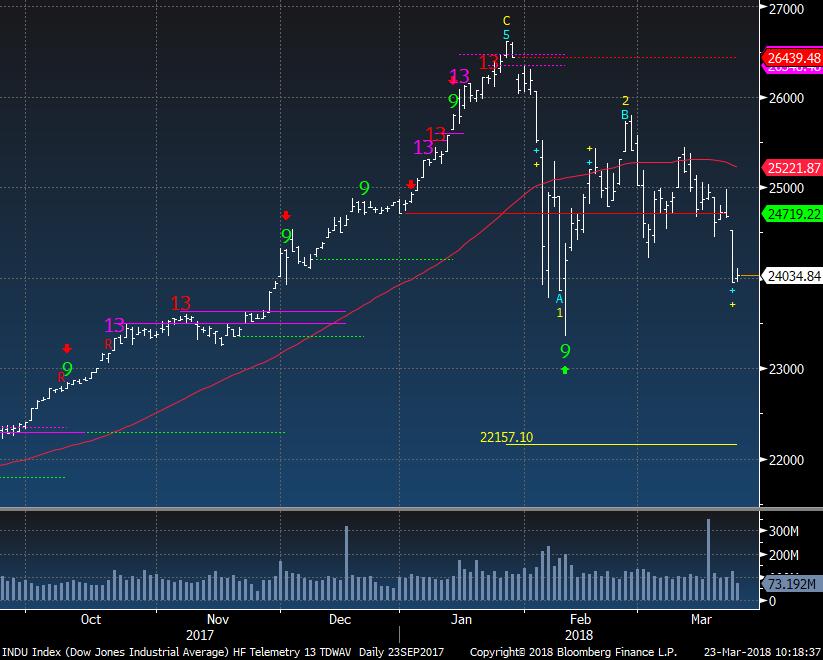
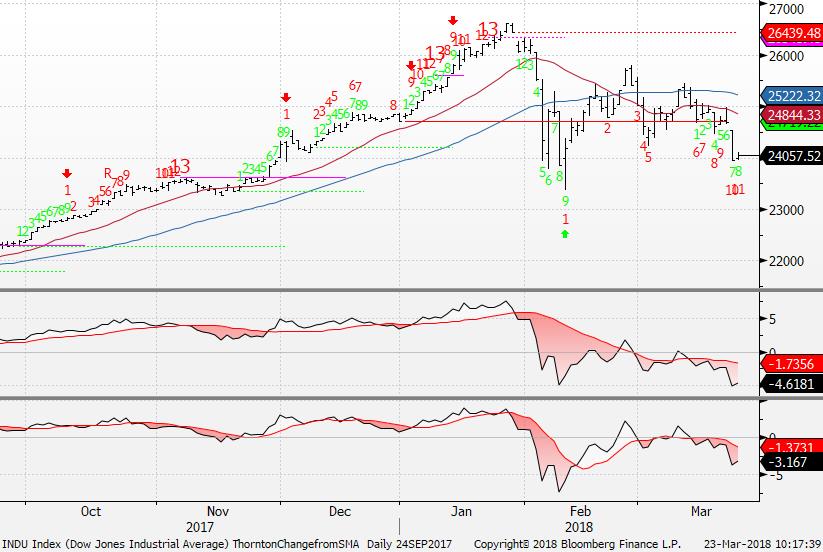
The Dow isn't too far from getting the downside wave 3 locked in and that would occur breaking the closing low on February 8th.
|
|
|
|
|
|
|
The Dow with the Countdowns visible is on day 11 of 13.
|
|
|
|
|
|
|
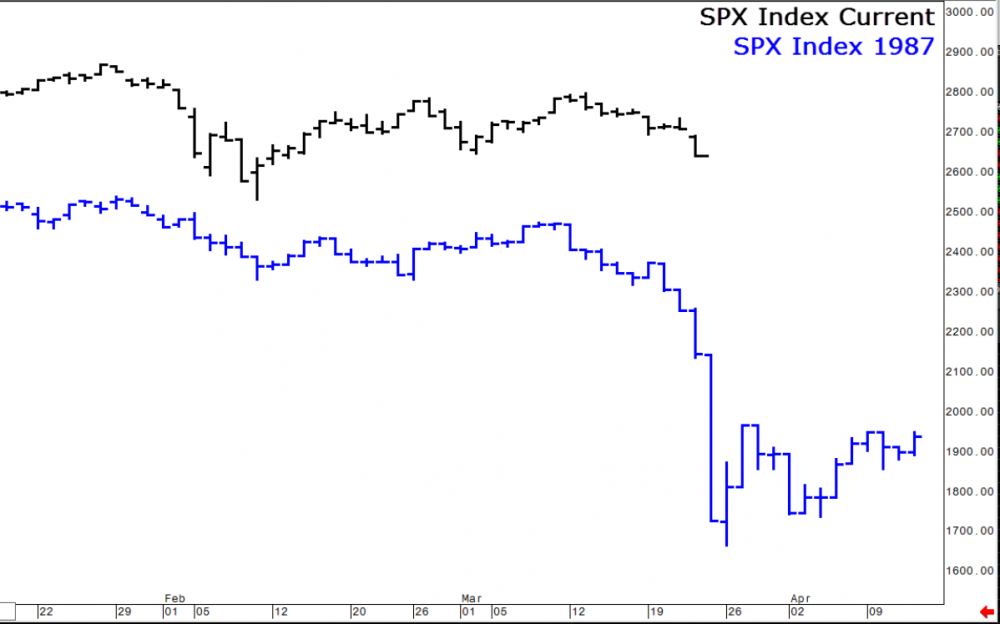
Tom DeMark created this chart of analog overlay of the SPX current pattern and 1987's pattern. One of the things he mentioned when he was on Bloomberg TV at the lows in February is that he was following the 1929/1987 patterns as a low was set in February - implying a lower high bounce then lower low. We'll see how this plays out but it's been the pattern (wave 2 to 3) I've been going over since early February. Thanks to Tom DeMark and his team. I KINDLY ASK
PLEASE DO NOT SHARE THIS CHART.
|
|
|
|
|
|
|
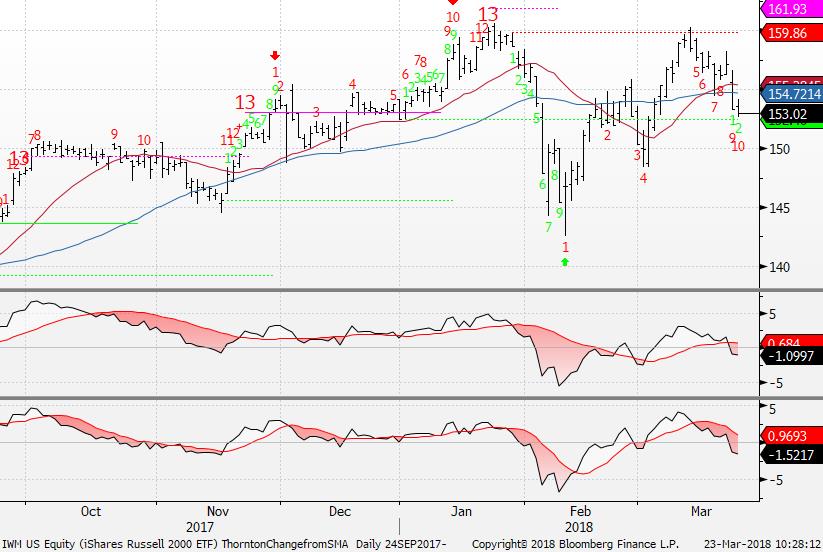
IWM Russell 2000 also is breaking below the 50 day and is on day 10 of 13.
|
|
|
|
|
|
|
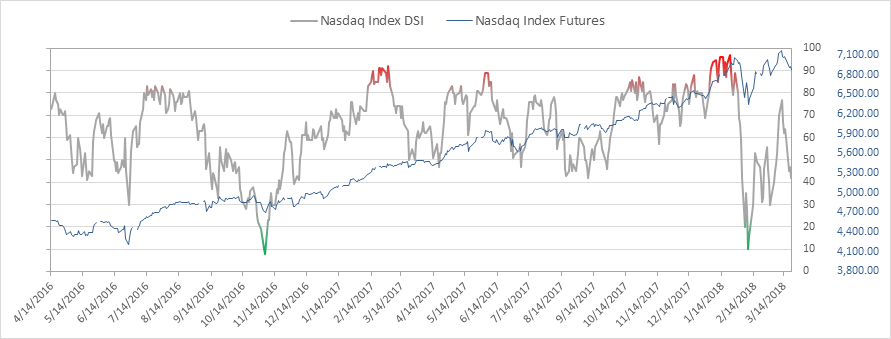
Nasdaq bullish sentiment is at 25% and has also fallen hard from the 3/12 recent high in sentiment of 77% (elevated)
|
|
|
|
|
|
|
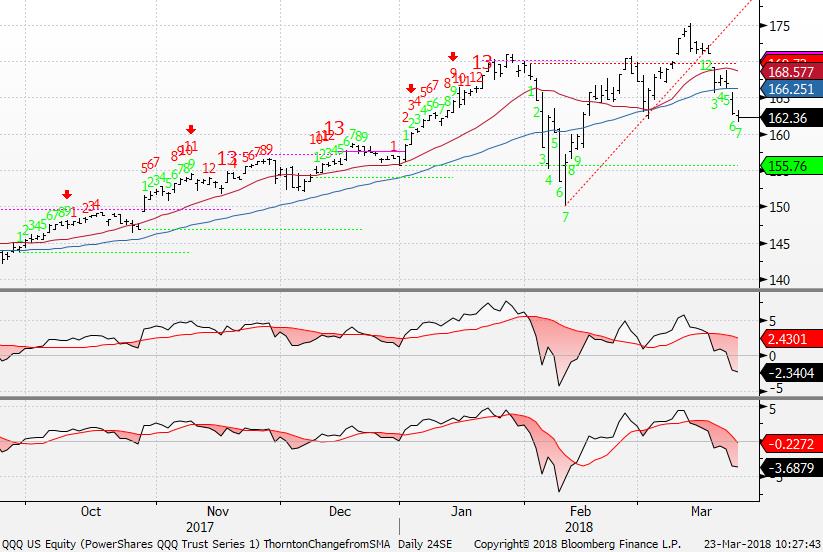
QQQ after making a new ATH getting everyone all excited about Tech has been breaking down and the VWAP support of 166.50 from the exact low on 2/9 has also been broken. That means people are generally trapped higher
|
|
|
|
|
|
|
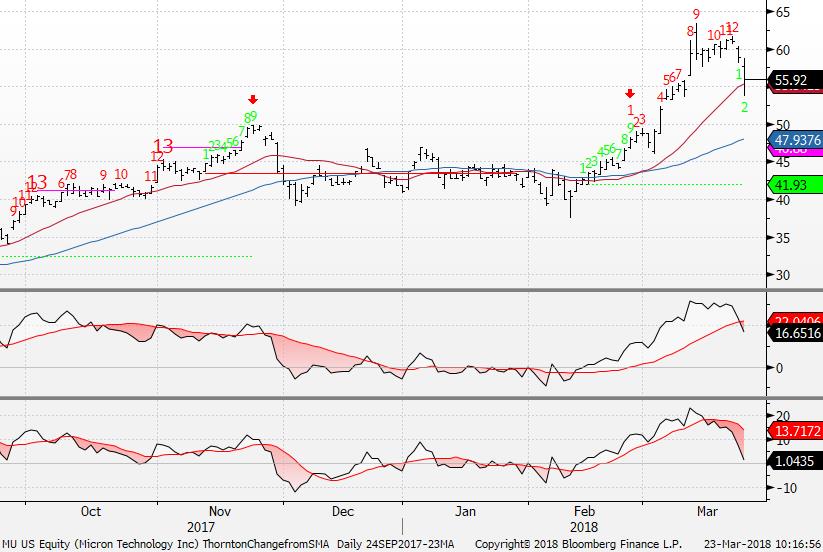
Micron - You can't always get what you want...
|
|
|
Micron was the most overbought stock in the S&P as it was 30% above the 50 day moving average (this is the middle MACD like indicator on this chart). It also was on day 12 of 13 and I was hoping to get the 13 ahead of earnings yesterday but as you see they reported and slipped on a banana peel.
|
|
|
|
|
|
|
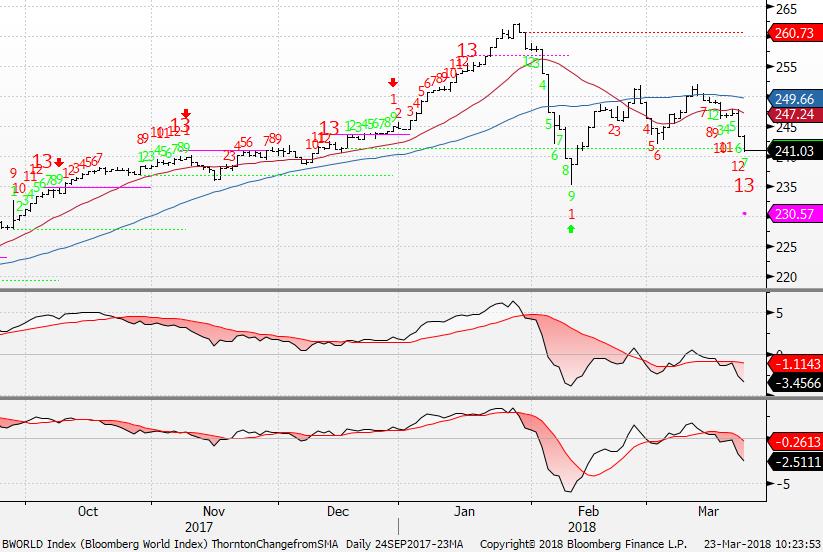
Bloomberg World Index - Another one using the 8 vs 5 setting
|
|
|
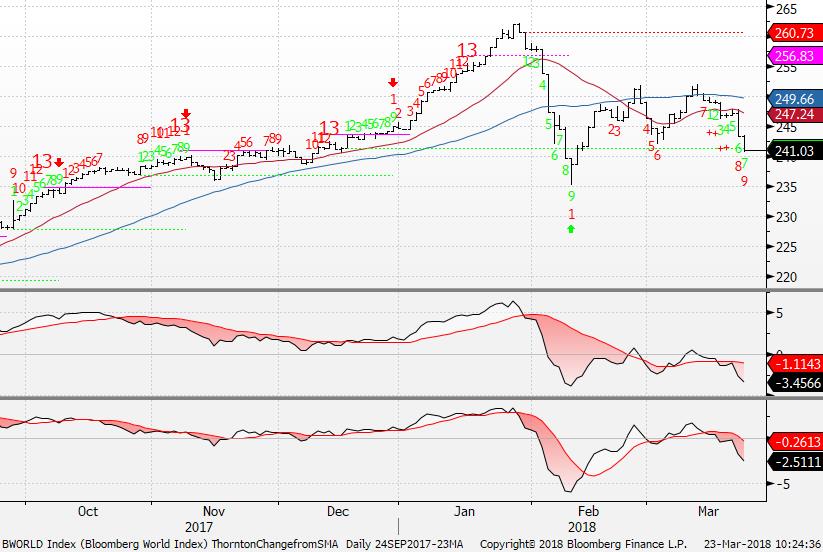
Bloomberg World Index with the standard settings has a downside red 13 Countdown
|
|
|
|
|
|
|
|
|
|
|
|
|
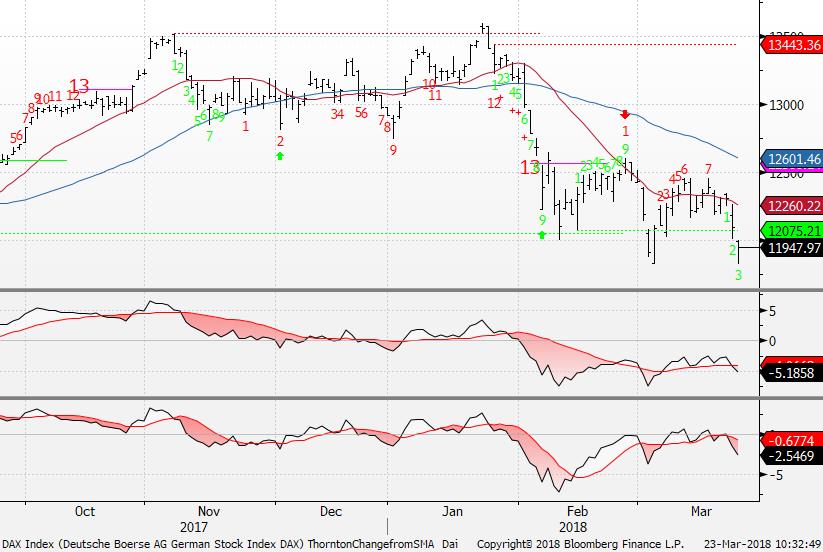
DAX Index has an upside Countdown stuck on day 7 of 13 yet as I've said a few times this doesn't look promising without making a new higher high and not lower lows! It broke the stop level of 12,075 two days ago
|
|
|
|
|
|
|
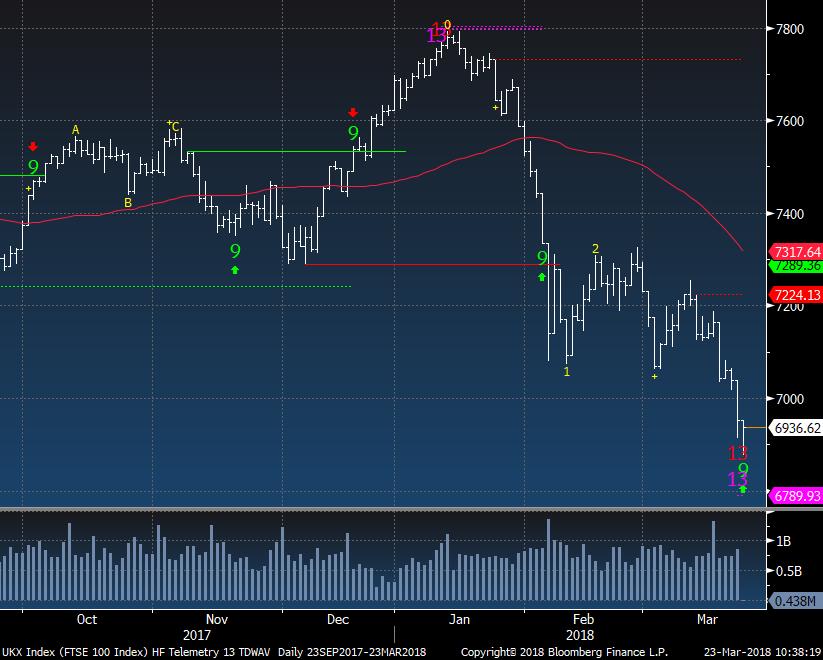
UK FTSE had very good upside exhaustion signals with both the pink Combo and red Sequential and now we see them both together on the downside. Keep in mind 13's happening in wave 3's are less reliable for as the corrective 4th wave is usually short lived and not a big move so if you're short take some profits and look to reshort a little higher
|
|
|
|
|
|
|
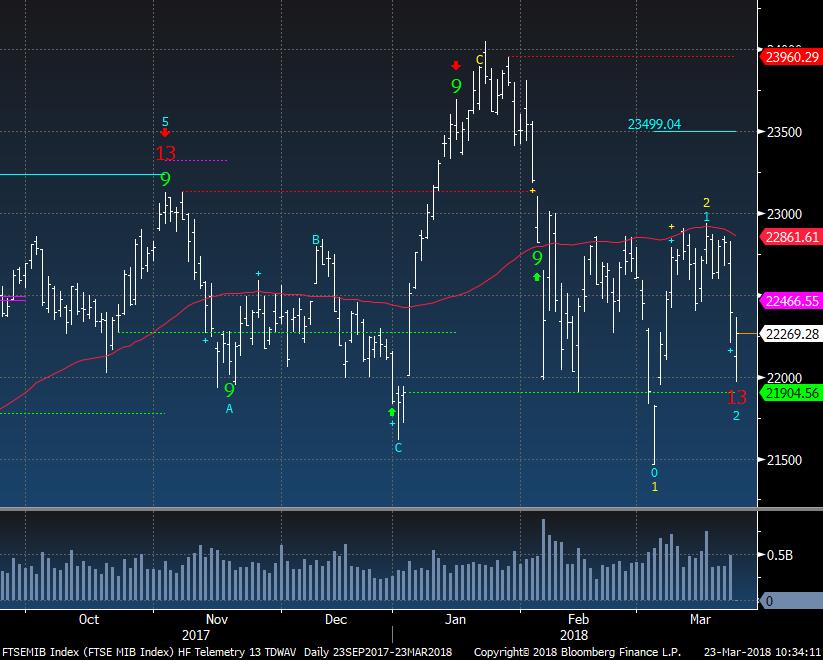
Italy's FTSE also has a downside red Countdonwn exhaustion and also looks rather sloppy without a trend.
|
|
|
|
|
|
|
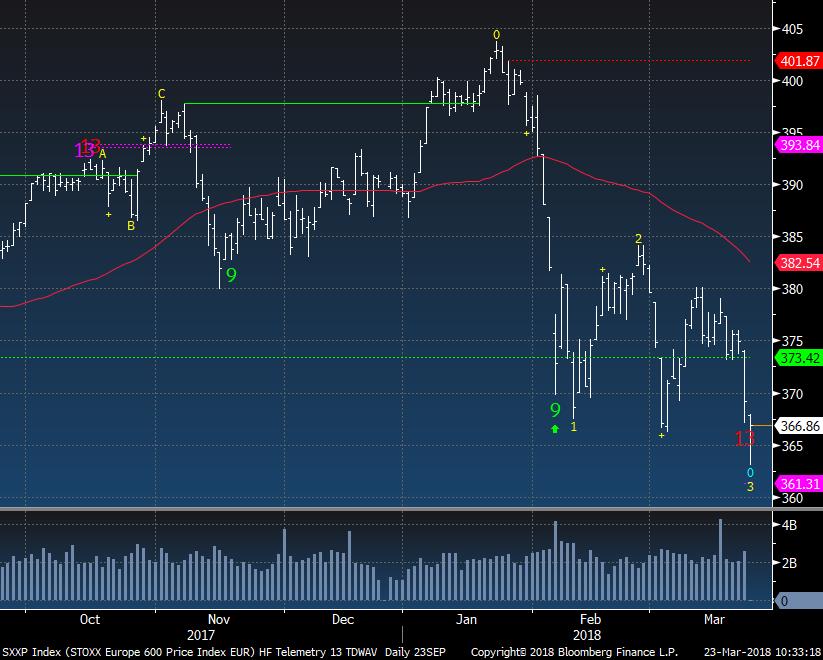
Euro Stoxx 600 also has a downside red Countdown 13 but it's in wave 3
|
|
|
|
|
|
|
|
|
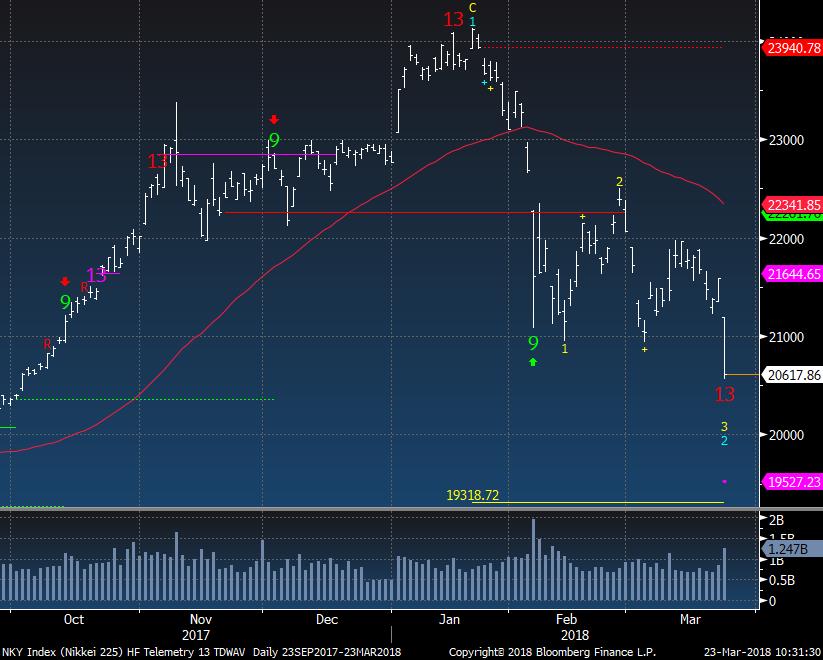
Nikkei broke the 21,000 support and February lows locking in wave 3 while the downside red Countdown 13 triggered too.
|
|
|
|
|
|
|
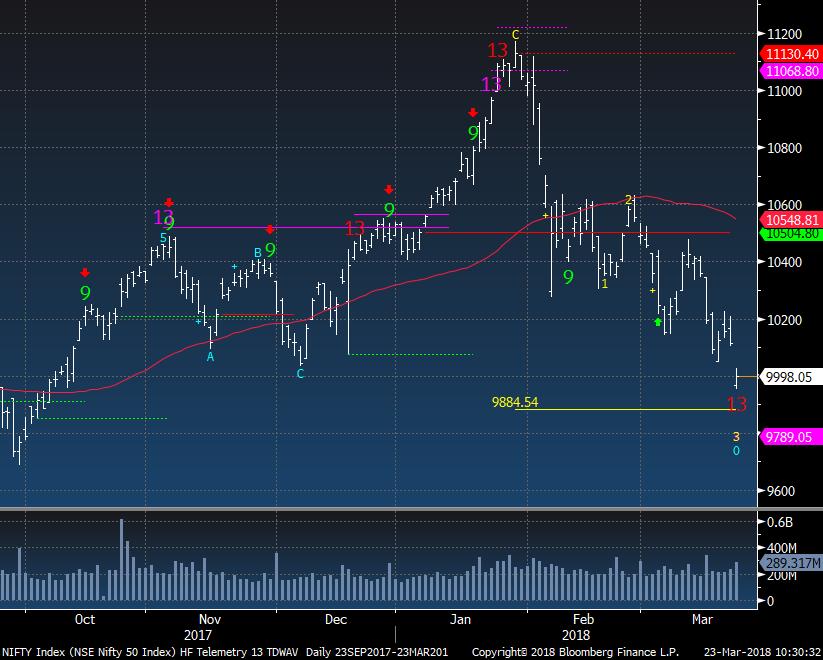
India's Nifty 50 Index broke to new 6 month lows and also had a downside red Countdown 13 trigger but in wave 3.
|
|
|
|
|
|
|
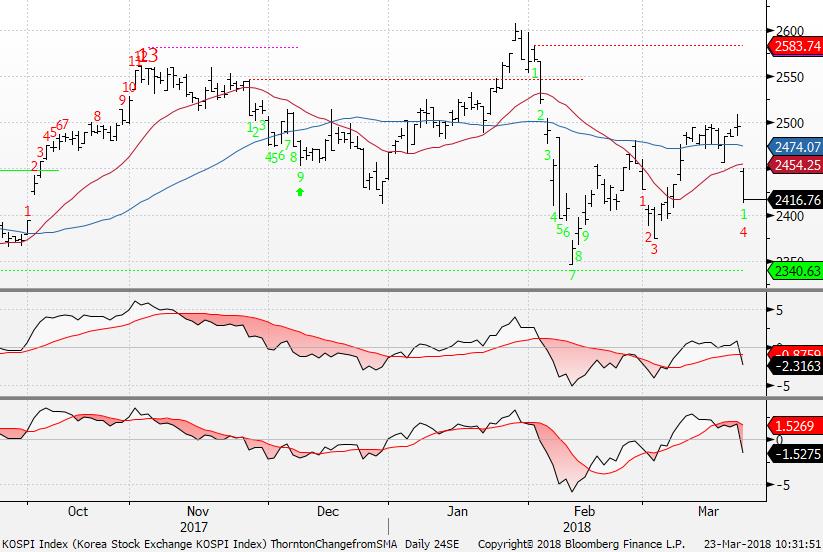
Korean Kospi is on day 4 of 13 with its downside Countdown. 2340 support
|
|
|
|
|
|
|
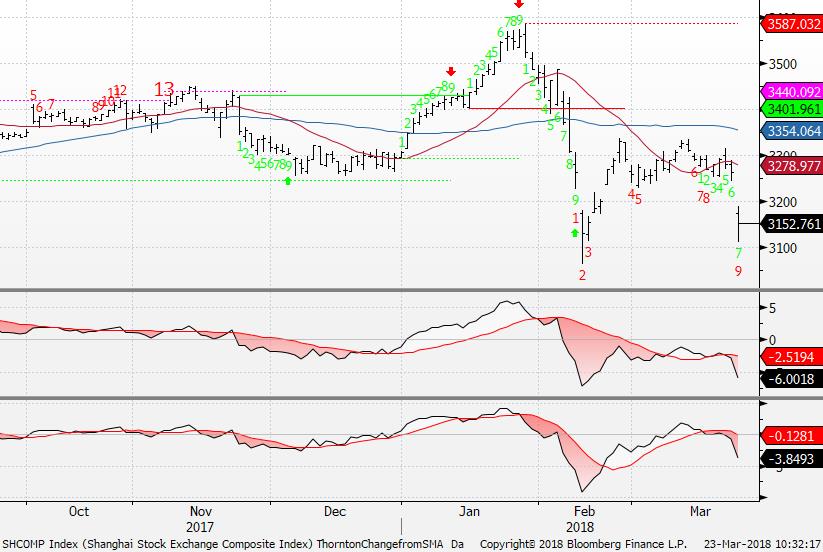
Shanghai gapped down and is on day 9 of 13
|
|
|
|
|
|
|
|
|
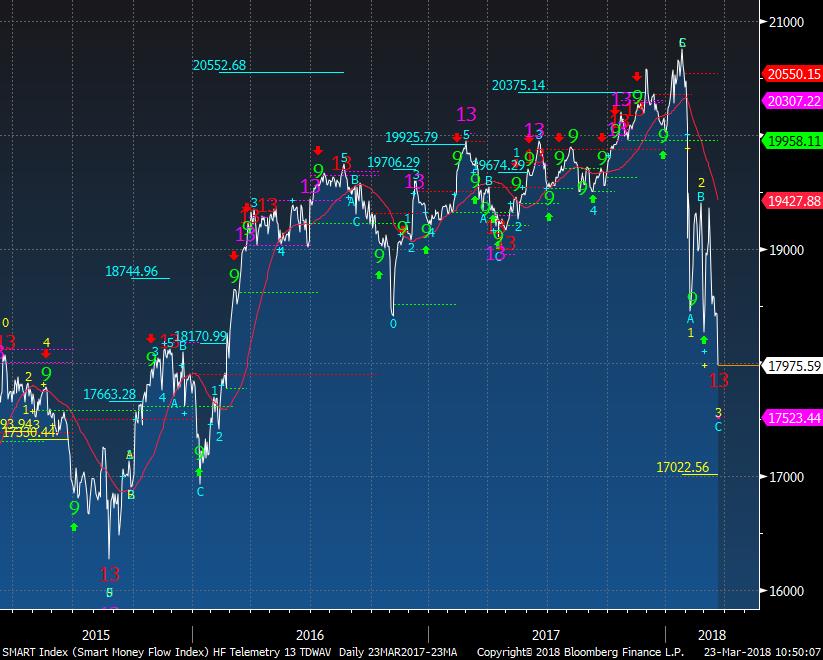
I've shown this a lot and it's a great read on smart money late day, dumb money early day. Smart money is active late in the day and they have been selling. Like a broken record, new downside red Countdown 13 today but in wave 3....
|
|
|
|
|
|
|
|
|
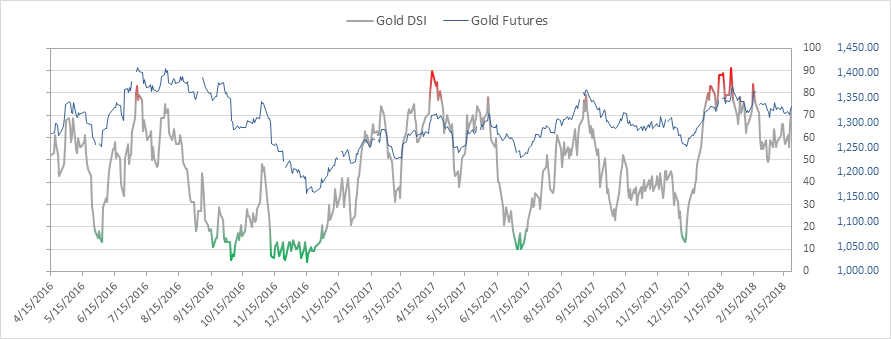
Gold bullish sentiment is at 71% and should continue higher with today's action. Unlike Silver, Gold held a decent bid with sentiment.
|
|
|
|
|
|
|
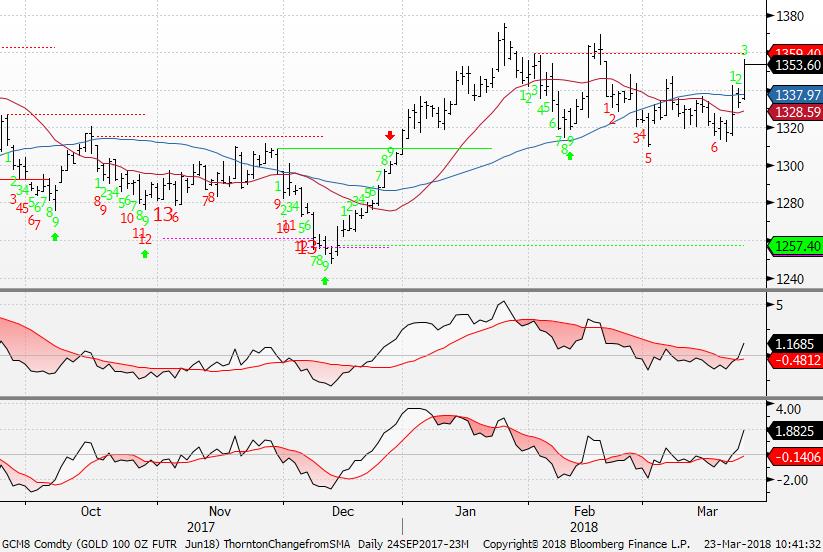
Gold futures has had a downside red Countdown stuck on day 6 of 13. I haven't had a bias here
|
|
|
|
|
|
|
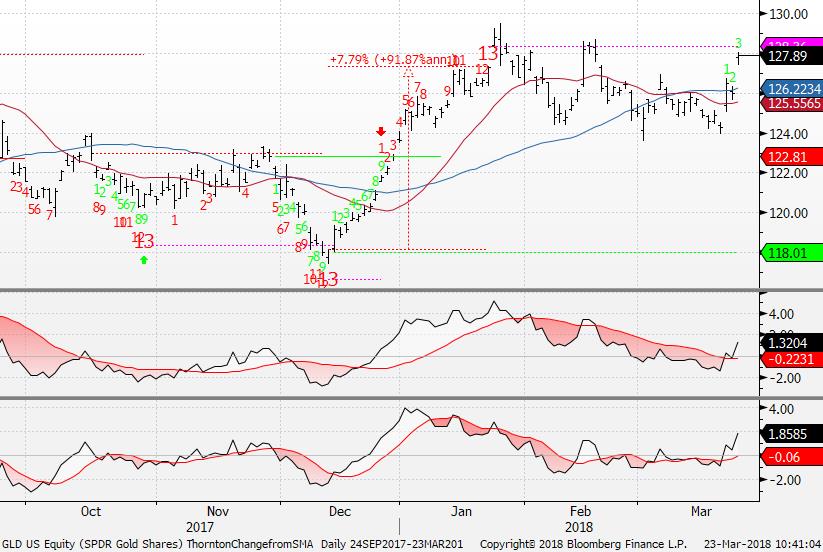
GLD didn't have a downside Countdown like the futures but the last trade I did was December - January 13-13 long trade. And at the time I sold my long, I went neutral and did not recommend shorting it
|
|
|
|
|
|
|
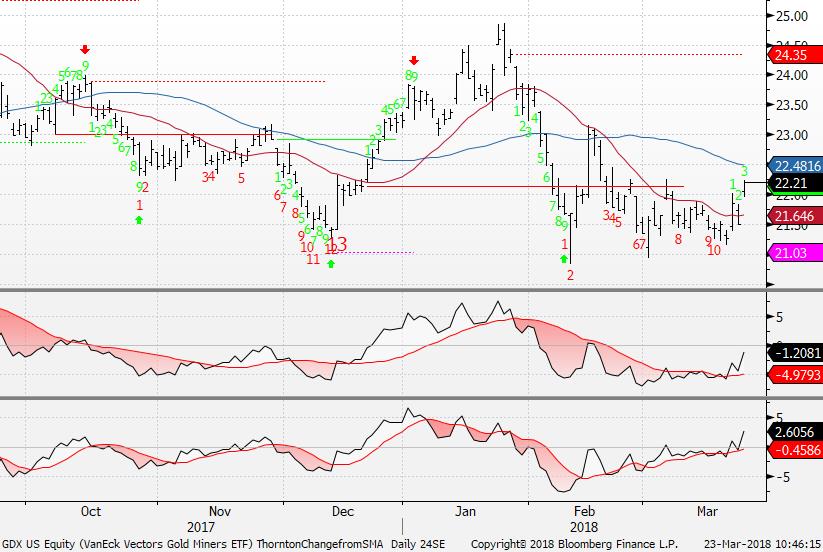
GDX Gold Miners has been stuck on day 10 of 13 and popped recently too. I'm still on the sidelines.
|
|
|
|
|
|
|
|
|
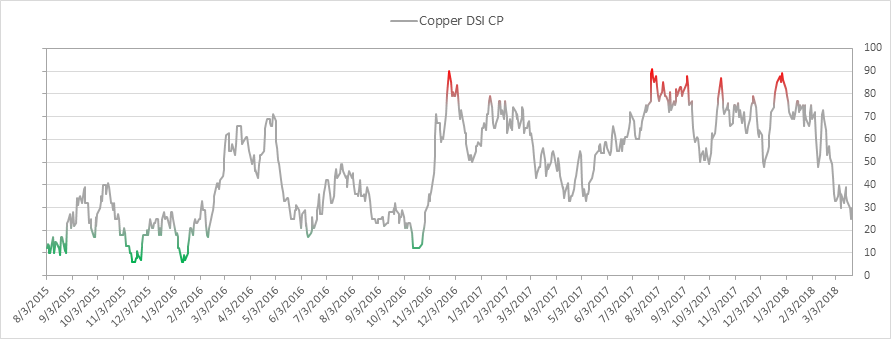
Copper bullish sentiment is at 26% down from the 90% peak level
|
|
|
|
|
|
|
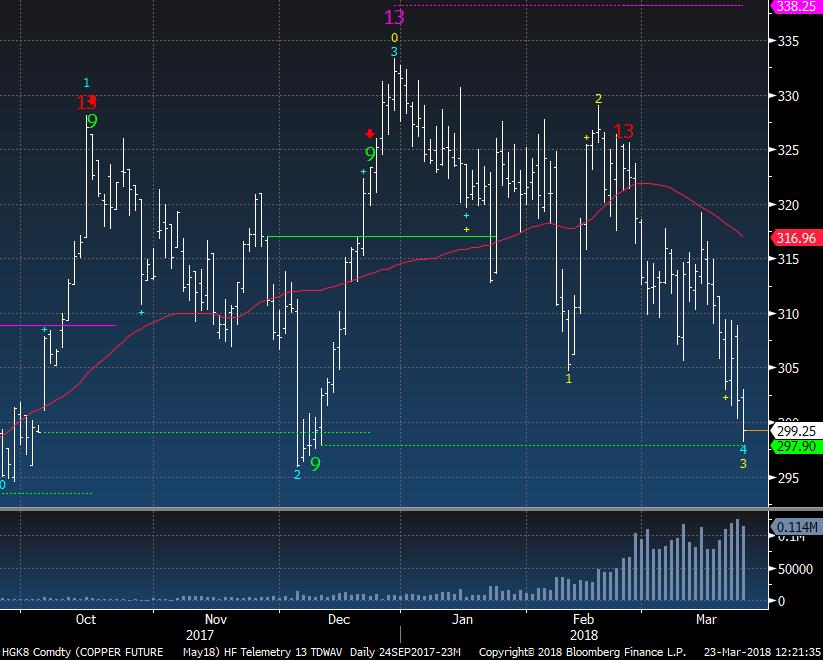
Copper daily is at my downside target of ~300.
|
|
|
|
|
|
|
|
|
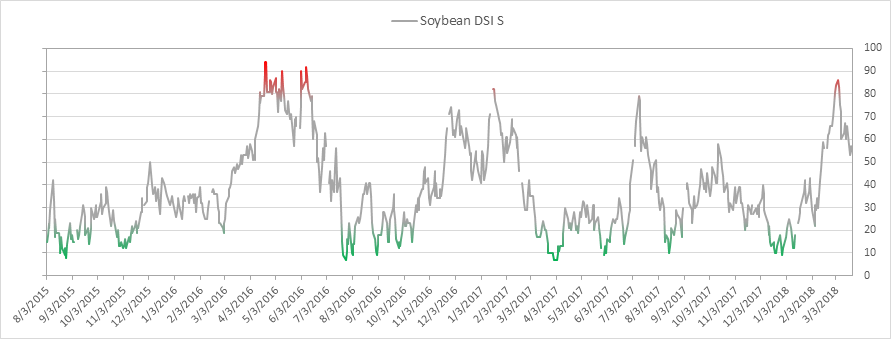
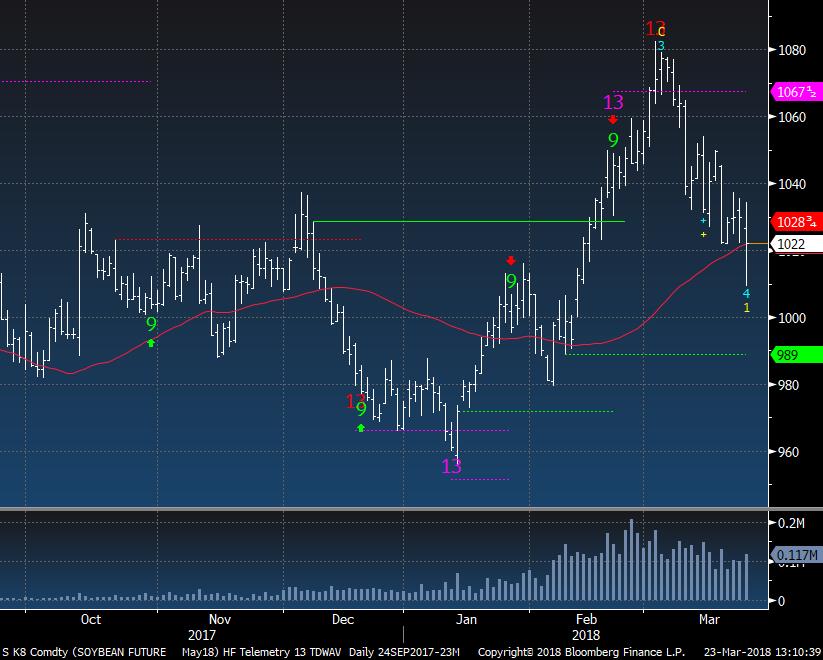
Soybean bullish sentiment is at 55% and down from 86%
|
|
|
|
|
|
|
Soybean's have pulled back substantially from the recent upside exhaustion combined with the extreme sentiment. It's holding the 50 day and if short, take a little profit.
|
|
|
|
|
|
|
|
|
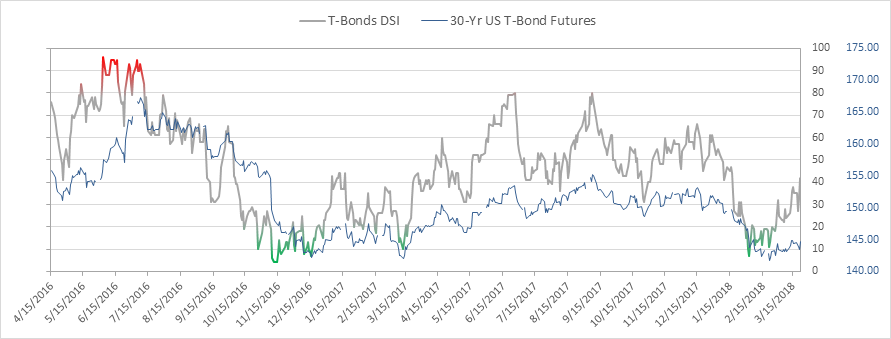
Bond bullish sentiment is at 42% and new recent high
|
|
|
|
|
|
|
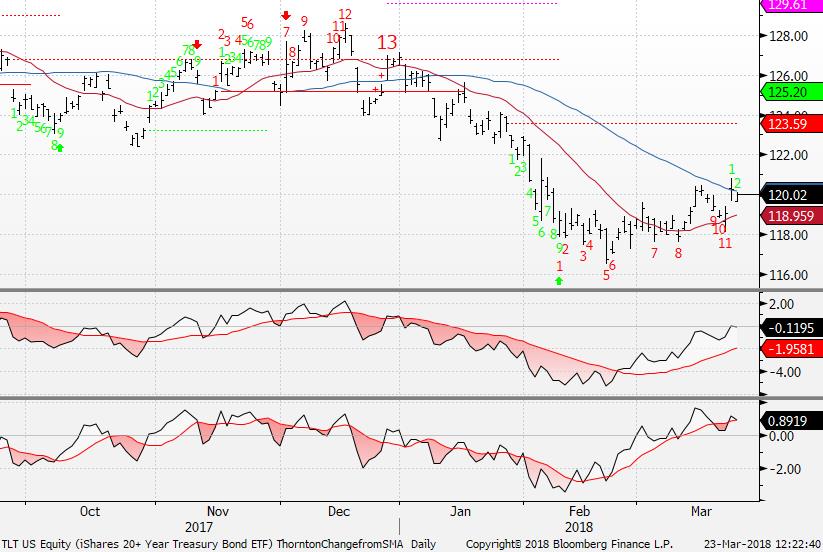
TLT Bond ETF isn't quite there yet for me as I'd one more down move to get the downside red 13
|
|
|
|
|
|
|
DEMARK SCREENS - Daily, Weekly, Monthly Upside/Downside Exhaustion Signals
|
|
|
Daily/Weekly DeMark upside/downside exhaustion signals (Sequential) Weekly updated on Monday's. Price flips occur when a stock closes higher/lower than four previous closes.
S&P 1500 Universe:
DAILY UPSIDE 13: NONE
DAILY DOWNSIDE 13: MO, PH, ROK, SNA, TRMB, TTEC
DAILY UPSIDE WITH PRICE FLIP REVERSAL DOWN: IART, TECH, THG
DAILY DOWNSIDE WITH PRICE FLIP REVERSAL UP: PSEC, SENEA
Updated: 3/19/18
WEEKLY UPSIDE 13: ASGN, DIOD, DSPG, ETFC, EZPW, GDOT, HAE, ICUI, IGT, INTU, JBL, LDOS, LGND, MTRN, ODFL, RHI, SCI, THG, TILE
WEEKLY DOWNSIDE 13: NONE
Updated: 3/1/1
MONTHLY UPSIDE 13: BDX, BMY, CAT, COL, CW, EBIX, GNCMA, IRBT, MMSI, NFLX
MONTHLY DOWNSIDE 13: CHK, SVU, WIN
Euro Stoxx 600 Universe:
DAILY UPSIDE 13: NONE
DAILY DOWNSIDE 13: NONE
DAILY UPSIDE WITH PRICE FLIP REVERSAL DOWN: NONE
DAILY DOWNSIDE WITH PRICE FLIP REVERSAL UP:
NONE
Updated: 3/19/18
WEEKLY UPSIDE 13: AALB NA, AGS BB, AKZA NA, GFTU LN, WDH DC
WEEKLY DOWNSIDE 13: ISAT LN
Updated: 3/1/18
MONTHLY UPSIDE 13: ASML NA, ENX FP, FI/N SW, INVP LN, SAB SM, SCR FP, US IM
MONTHLY DOWNSIDE 13: NONE
|
|
|
Unsubscribe me from Hedge Fund Telemetry
Hedge Fund Telemetry LLC, P.O. Box 4675, Greenwich, CT 06861, United States
CONFIDENTIALITY NOTE and DISCLAIMER: This message is for the named person's use only. It may contain confidential, proprietary or legally privileged material. No confidentiality or privilege is waived by any accidental or unintentional transmission. If you receive this message in error, please immediately delete it and all copies of it from your system, destroy any hard copies and notify the sender. You must not, directly or indirectly, use, disclose,
distribute, print or copy any part of this message if you are not the intended recipient. Hedge Fund Telemetry LLC. cannot guarantee the confidentiality of the material transmitted; therefore, information of a sensitive or confidential nature should not be transmitted. There is risk in trading markets. Hedge Fund Telemetry LLC reports are based on information gathered from various sources and believed to be reliable, but are not guaranteed as to accuracy and completeness. The information is subject to change without notice and Hedge Fund Telemetry LLC has no obligation to provide any updates or changes. Hedge Fund Telemetry LLC is providing this data for informational and educational purposes and does not believe that it is sufficient to base an investment decision on. This information should not be regarded as a solicitation or recommendation of any particular security or to engage in any trading strategy. One should always check with your licensed financial
advisor to determine suitability of any investments.
|
|
|
|
|