If you are having difficulty seeing this email, you can view in your browser or click here to
print.
|
|
|
|
|
04/27/2024
Thomas Thornton
|
|
|
|
|
A well known hedge fund manager once told me "Tom, positioning trumps sentiment." As you know, my focus is on sentiment and for my process, I see it working better when there are daily sentiment changes vs. weekly reports. I have looked at positioning using the Commitment of Traders reports for years and it's a great tool. I've been more in the belief that when both positioning and sentiment are aligned it's even more powerful. On today's note I am looking at positioning and sentiment together on various markets. Stocks, Currencies, Gold, Crude,
Bonds.The strong performance with technology in the US has also been a frequent question from many and I believe the trend is nearing an end and a correction of 20% or more is ahead. Micron Technology, a chip maker has been the poster boy for tech exuberance several times in my career and this time is no different.
Stay focused on short term support using VWAP levels from the 8:30am payroll report from Friday. SPY 278.30, QQQ 173.25, IWM 158.80, DIA 252.80. Breaking these levels could see sellers accelerate the down move.
Notable
- US Markets - Sentiment is getting overbought again
- Euro and US Dollar
- Gold
- Crude
- Tech Thoughts - Not the time to be getting long tech. NVDA daily upside exhaustion
- Bonds
- Lumber and Soybeans - Follow up from recent
short recommendations
- DeMark Screens
|
|
|
|
|
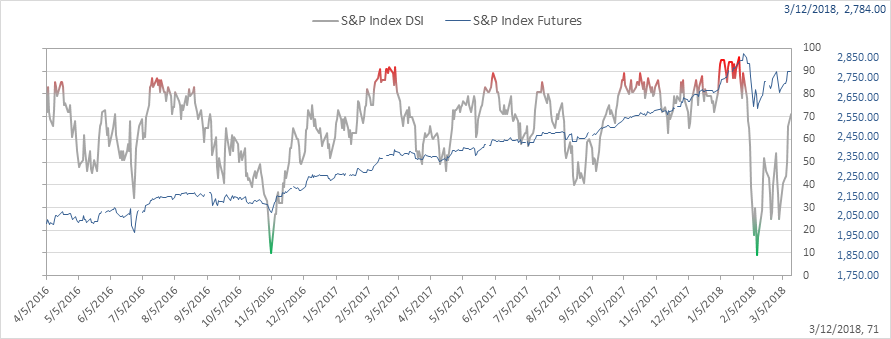
SPX bullish sentiment is at 71% and back in the elevated zone (70-80%)
|
|
|
|
|
|
|
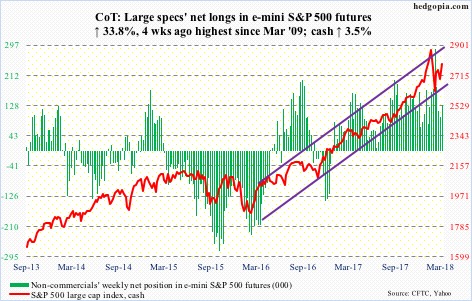
SPX speculators remain bullish and despite the correction in February exposure has not decreased much. And by the way, back in January when bullish sentiment was hitting 96% and the COT data here was shockingly high, it played a significant factor in my recommendation to have a larger than usual cash position.
|
|
|
|
|
|
|
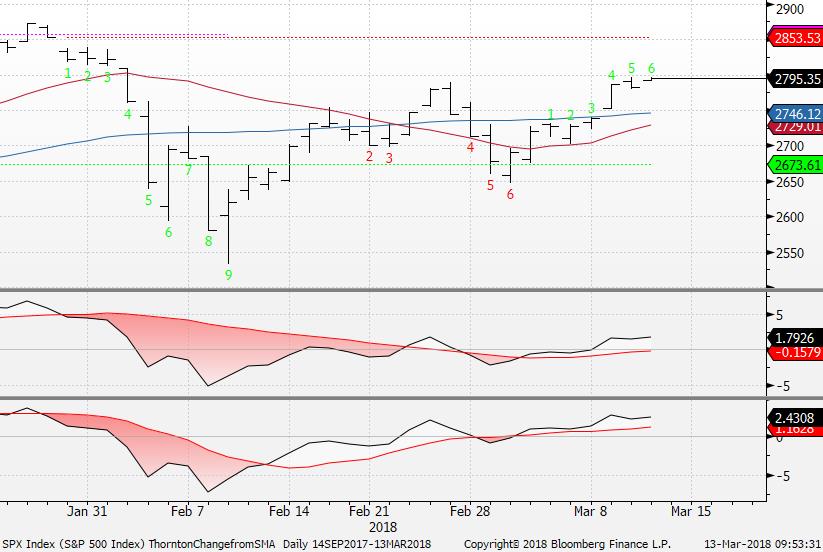
Here's a close up of the SPX daily with the conundrum with downside red Countdown on day 6 of 13 and an upside green Setup on day 6 of 9. If the green Setup completes the sequence to 9 by closing higher than 4 previous closes 9 times in a row then the red Countdown will be null. With that in mind it could also signal a top like it did at the lows in February. I will be all over this and if you have questions reach out.
|
|
|
|
|
|
|
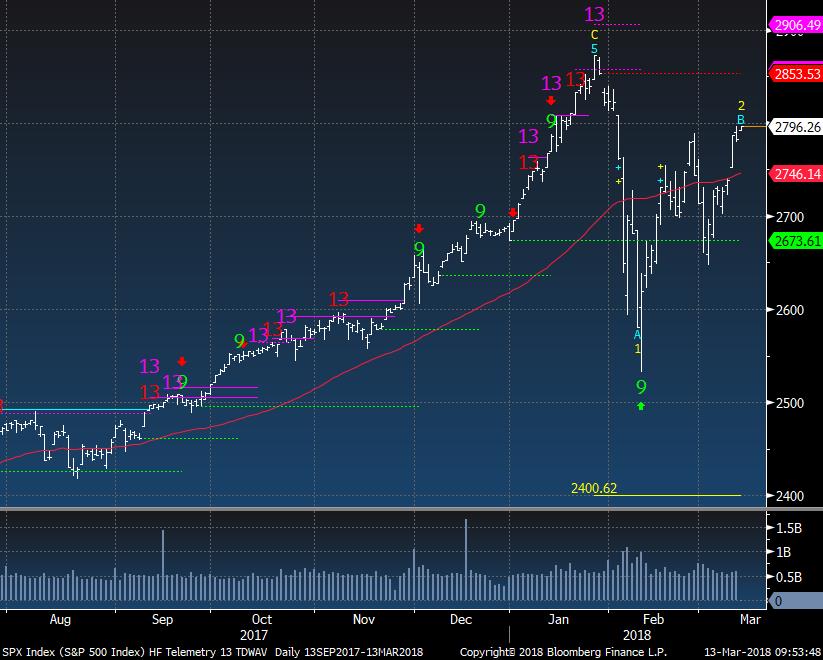
The SPX wave pattern is still valid in a 2/B wave
|
|
|
|
|
|
|
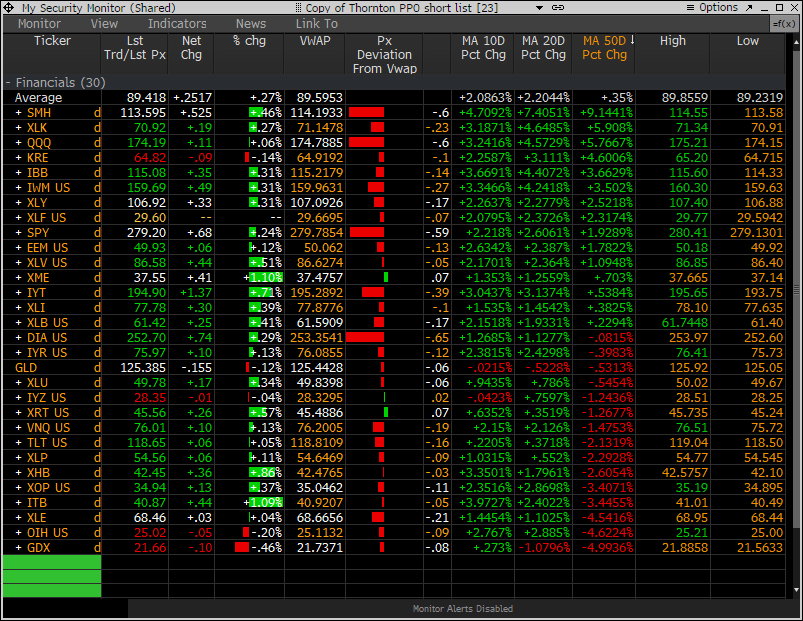
My PPO Monitor (Percentage Price Oscillator) was grabbed for a little after the peak this morning and the takeaway was how most sectors were up on the day but they were below today's VWAP as a sign of sellers entering the market. A lot of new 20 day highs but few are making new highs above January. What is most notable today is they are selling stuff at the top of the monitor - stuff that has been working.
|
|
|
|
|
|
|
|
|
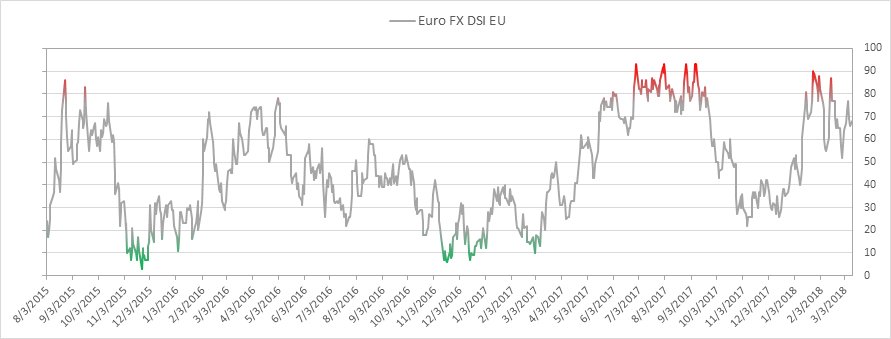
Euro bullish sentiment is at 68% and has held above the 50% level for several months now. Breaking that level would be a red flag
|
|
|
|
|
|
|
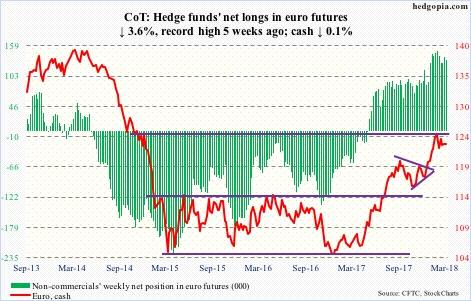
Positioning with speculators shows continued bullishness somewhat of a concern if the Euro drops further as it's very crowded on the long side
|
|
|
|
|
|
|
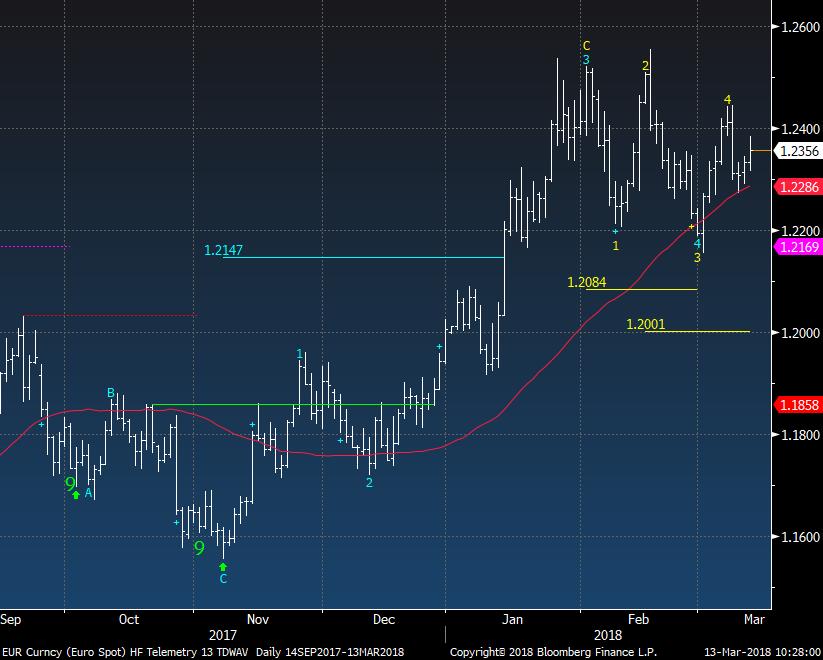
Euro daily has seen several recent lower highs with support at 1.22
|
|
|
|
|
|
|
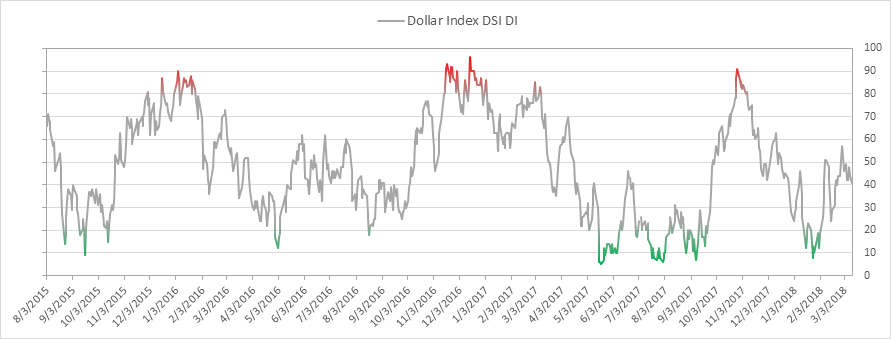
US Dollar sentiment is at 41% and can't seem to break out and hold above 50%
|
|
|
|
|
|
|
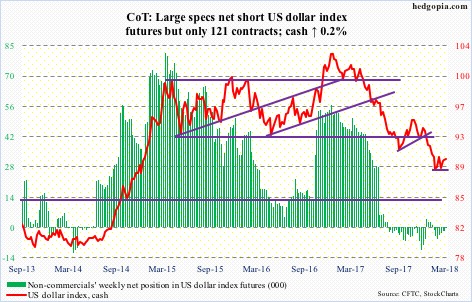
Positioning with large speculators is set up slightly short and for the USD it typically doesn't get that short.
|
|
|
|
|
|
|
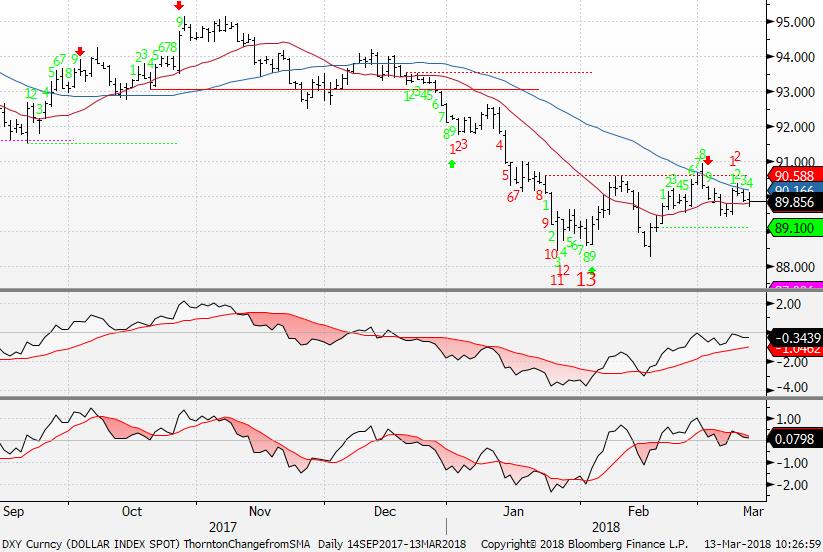
DXY US Dollar index has been holding these levels for several months and there is red Countdown on day 2 of 13 and I believe the USD could start to move higher clearing 91
|
|
|
|
|
|
|
|
|
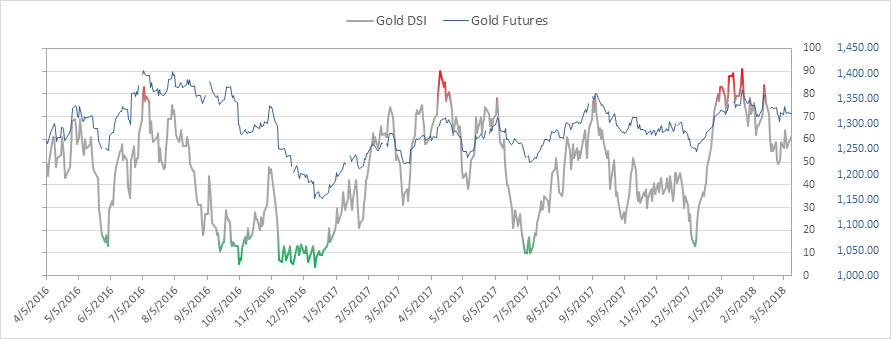
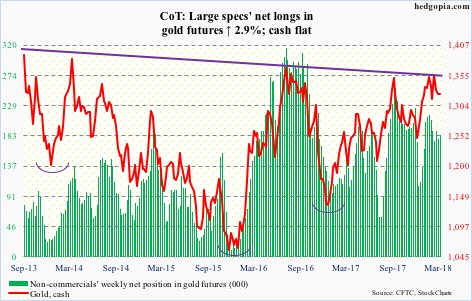
Gold bullish sentiment is at 61% and has held the 50% level despite the recent pullback
|
|
|
|
|
|
|
Positioning in Gold remains to set up bullish yet not at extremes
|
|
|
|
|
|
|
|
|
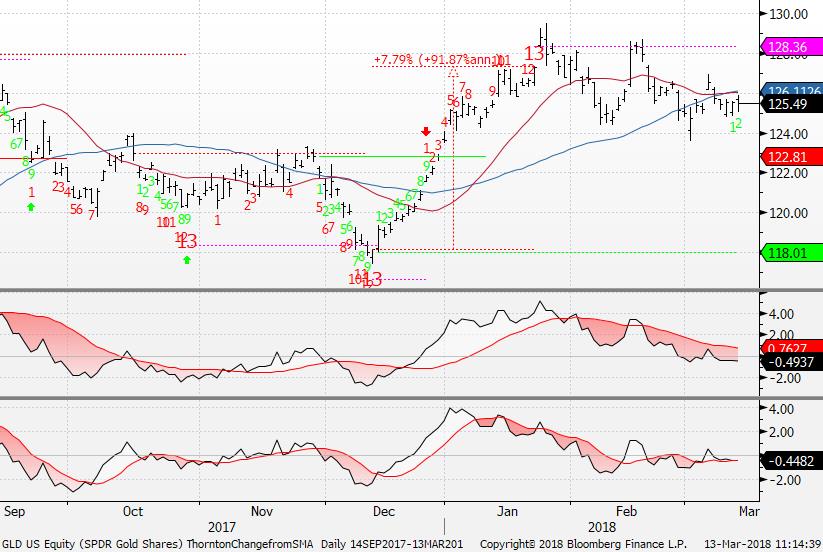
Gold GLD has been trading sideways under the 20 and 50 day moving average. I have no position in gold as I rode the downside 13 to the upside 13 recently and have remained neutral
|
|
|
|
|
|
|
|
|
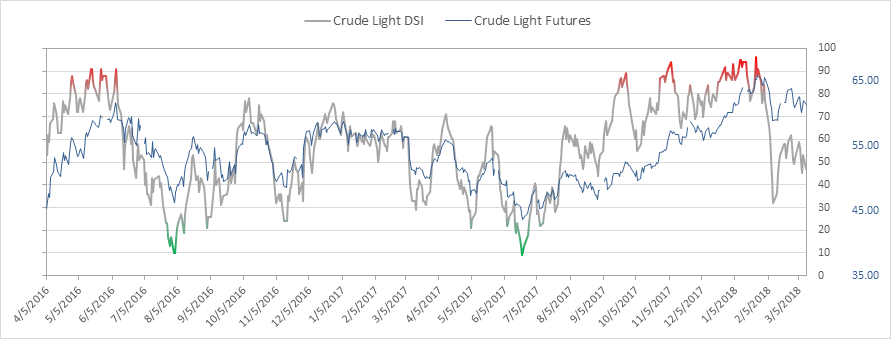
Crude bullish sentiment is at 47% and at the lowest level in a month.
|
|
|
|
|
|
|
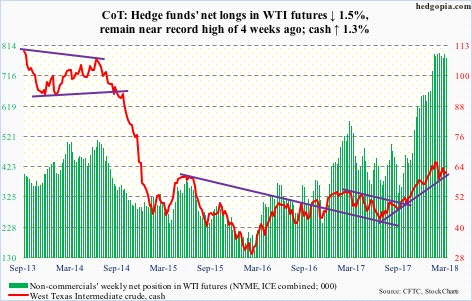
Positioning with Crude shows speculators set up very bullish and these levels are quite extreme. This is not what you want to see if you're long Crude
|
|
|
|
|
|
|
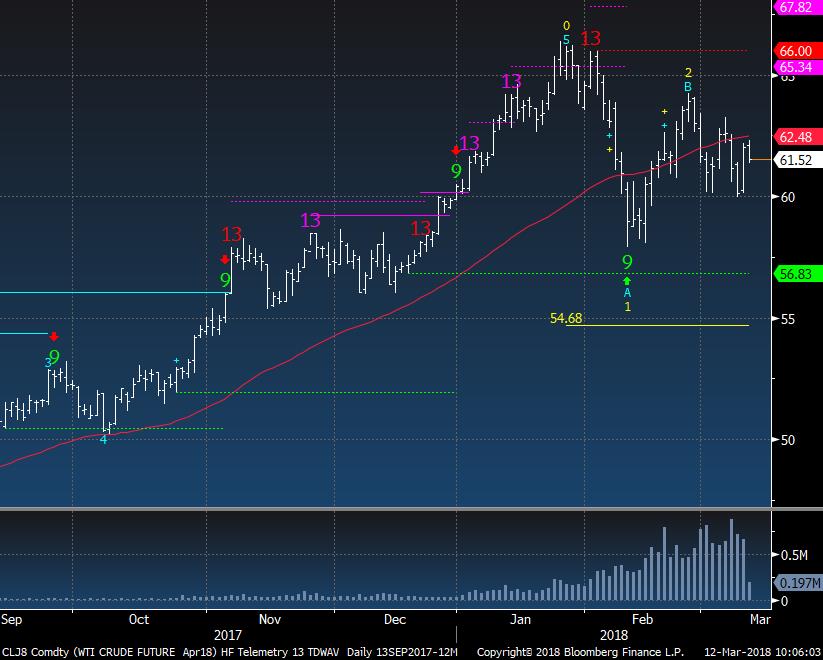
Crude daily has a downside wave 3 target of 54.68 but the 60 level has been defended several times.
|
|
|
|
|
|
|
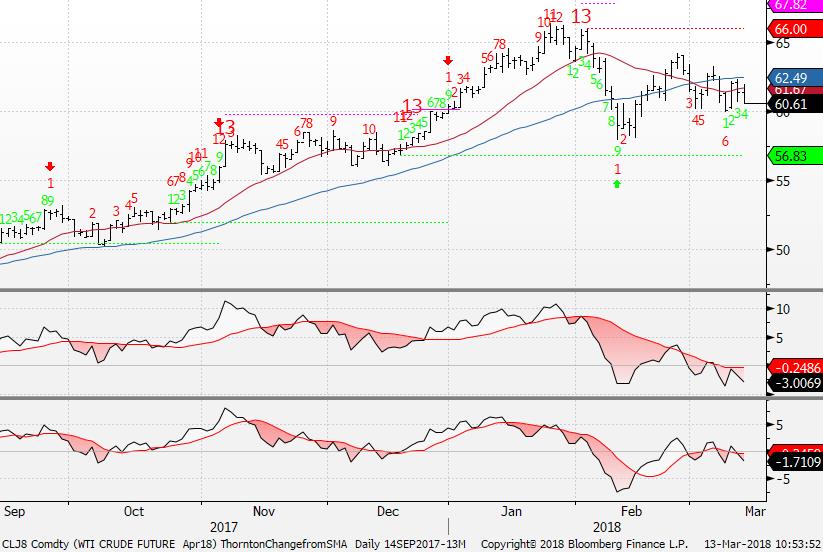
Crude daily with the Countdowns visible show it on day 6 of 13 with a downside count
|
|
|
|
|
|
|
|
|
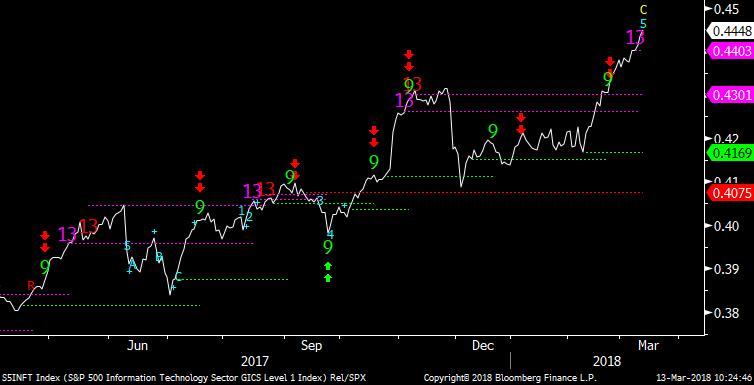
S&P Info Tech Index on a daily time frame has a pink Combo upside exhaustion. The parabolic move is also in the 5th wave.
|
|
|
|
|
|
|
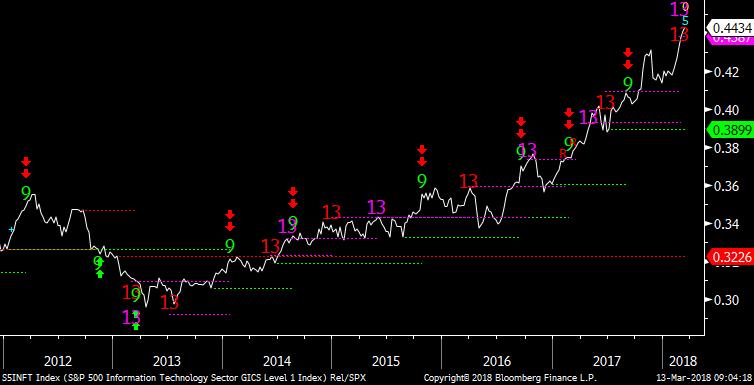
S&P Info Tech Index on a monthly time frame shows upside exhaustion signals
|
|
|
|
|
|
|
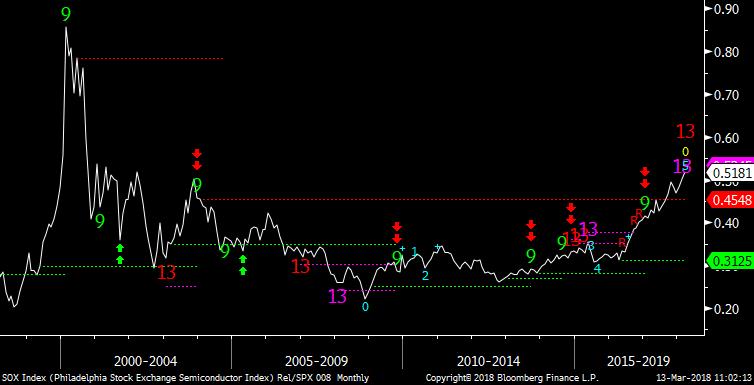
SOX (Semi) Index relative to the SPX on a monthly time frame shows upside exhaustion signals
|
|
|
|
|
|
|
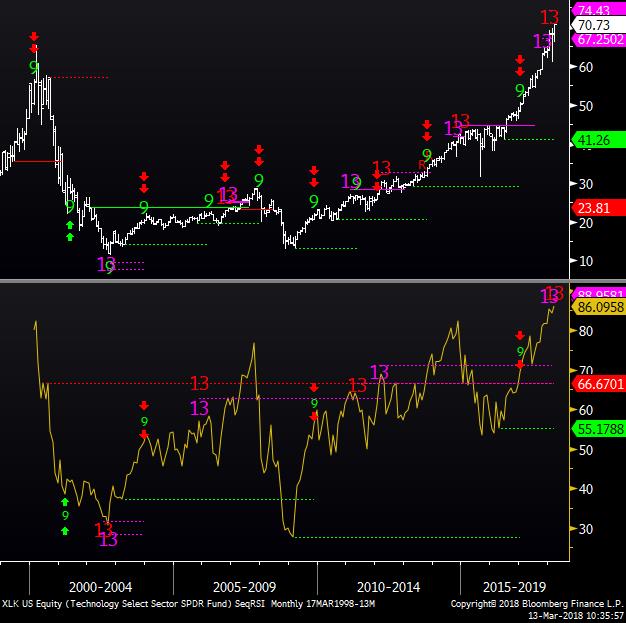
XLK monthly shows the upside exhaustion signals on the price as well upside exhaustion signals on the RSI indicator at 86%. That's dangerously high for people putting money to work in technology
|
|
|
|
|
|
|
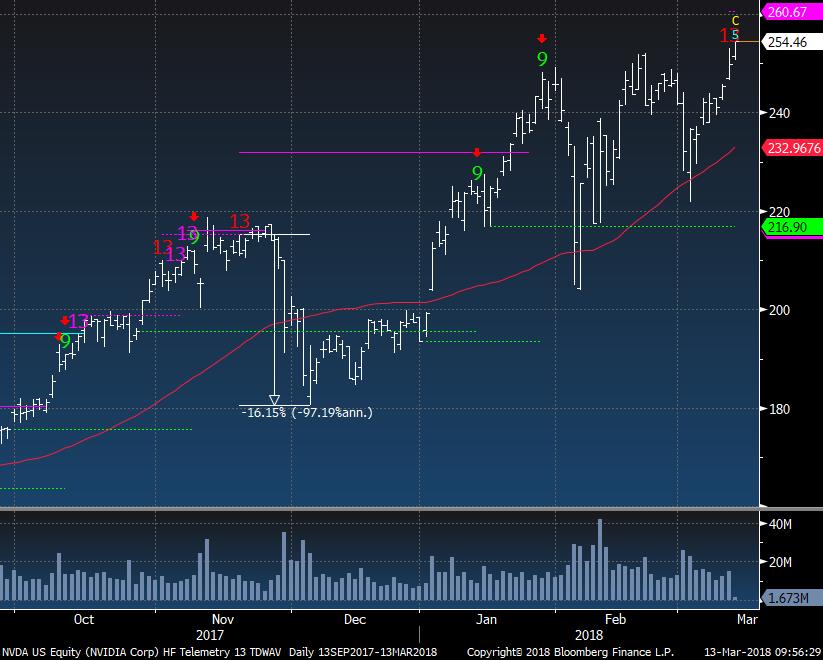
Nvidia daily has another upside red Countdown exhaustion today. The last cluster of exhaustion signals back in November saw this drop 16%.
|
|
|
|
|
|
|
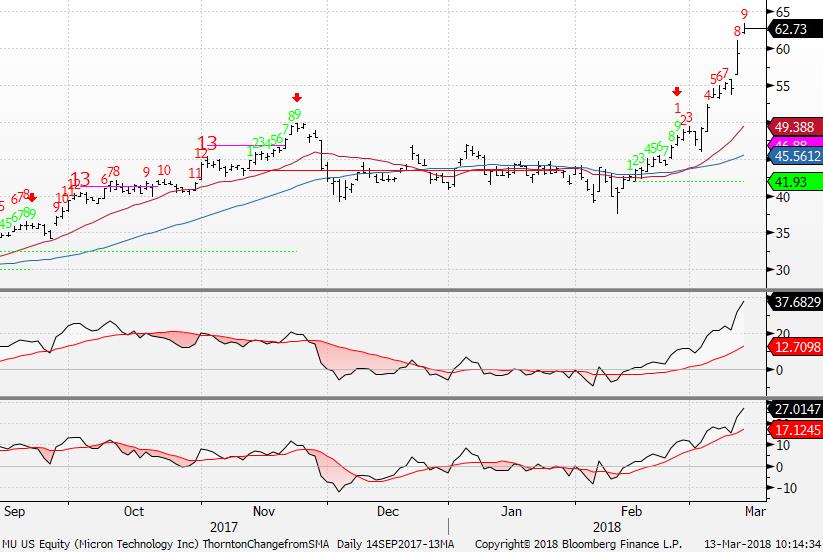
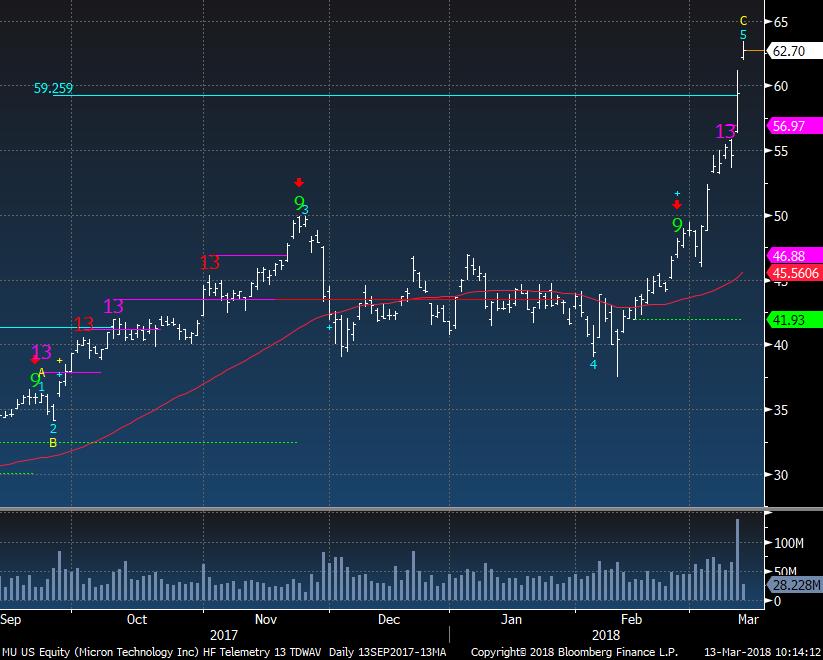
MU daily with Countdowns visible show it on day 9 of 13 so there's potential for a little more upside action. I would not chase this especially with it 37% above the 50 day moving average.
|
|
|
|
|
|
|
The daily shows the upside wave 5 price objective met and exceeded.
|
|
|
|
|
|
|
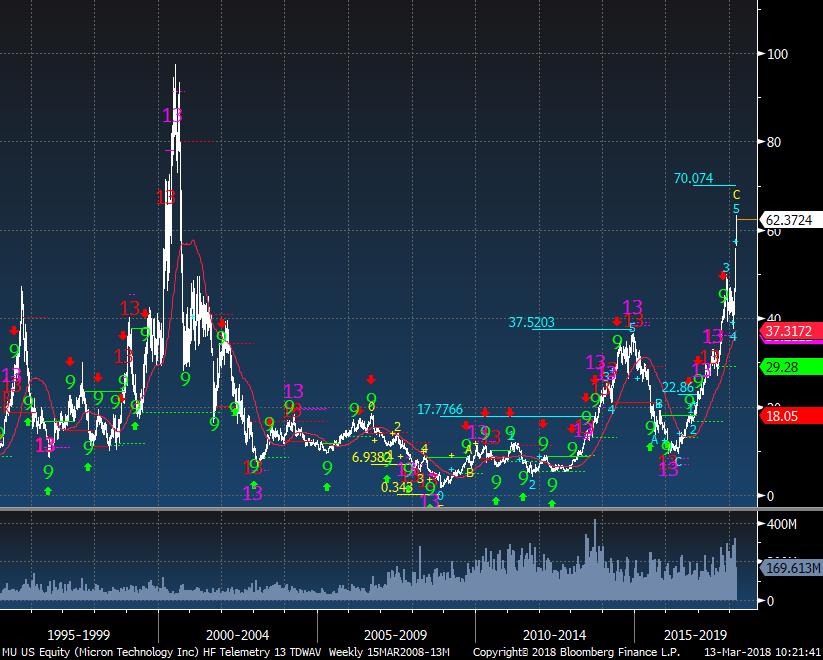
Micron has seen a lot of boom and busts over the years. This is the monthly chart and the pink Combo is on month 12 of 13 and the red Sequential is on month 11 of 13. The upside wave 5 price objective is at 70 and the last wave 5 was spot on at 37.52
|
|
|
|
|
|
|
|
|
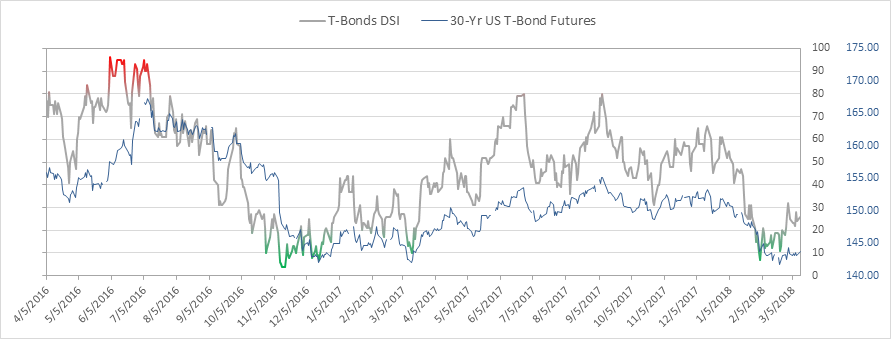
Bond bullish sentiment is at 26%. Look back at when sentiment was at 80% in September and there was a downside DeMark exhaustion on the 10 year yield at 2.05% and positioning was set up very long in bonds. It was a perfect scenario
|
|
|
|
|
|
|
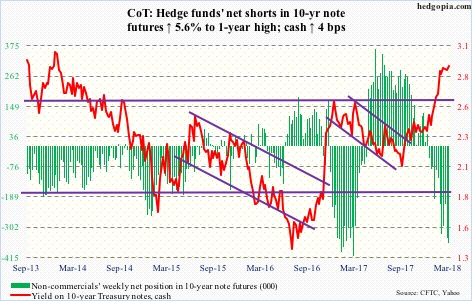
Positioning in US 10 year is set up short with speculators
|
|
|
|
|
|
|
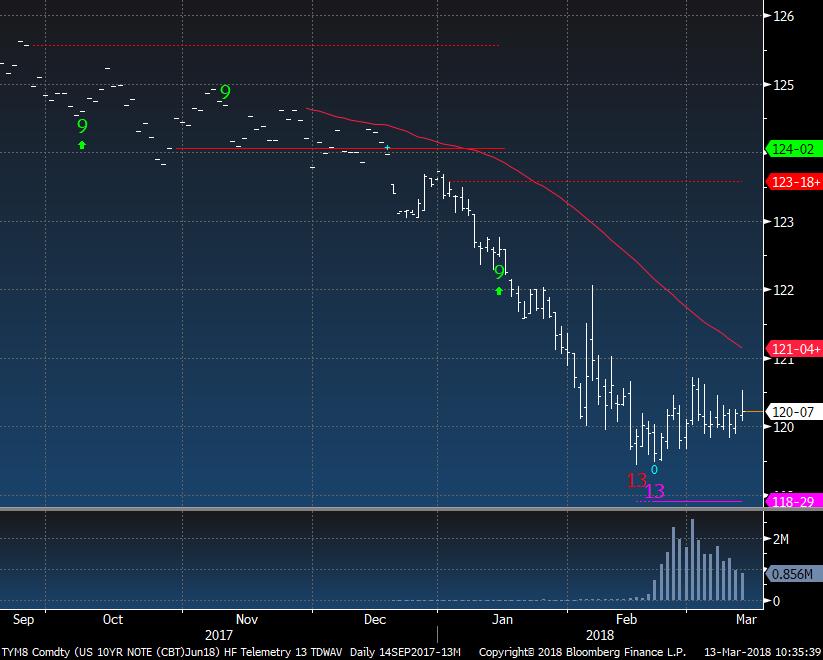
10 Year Bond Futures had a couple daily downside exhaustion signals but the price just hasn't turned yet. I see some potential for a bond bounce or even a rally.
|
|
|
|
|
|
|
Lumber and Soybean Follow Up
|
|
|
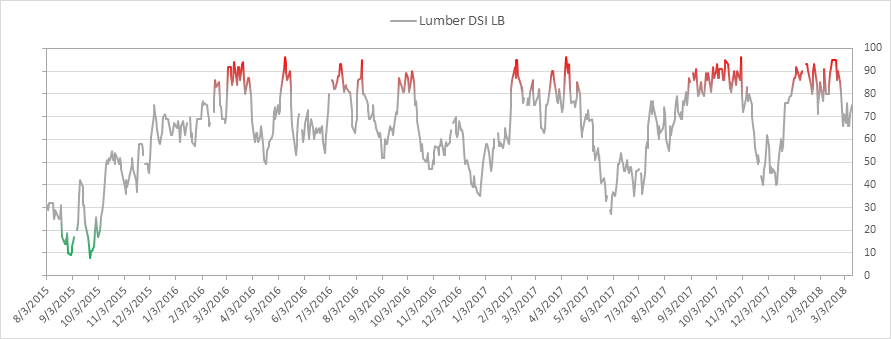
Lumber bullish sentiment is at 75% and down from the recent highs of 95%
|
|
|
|
|
|
|
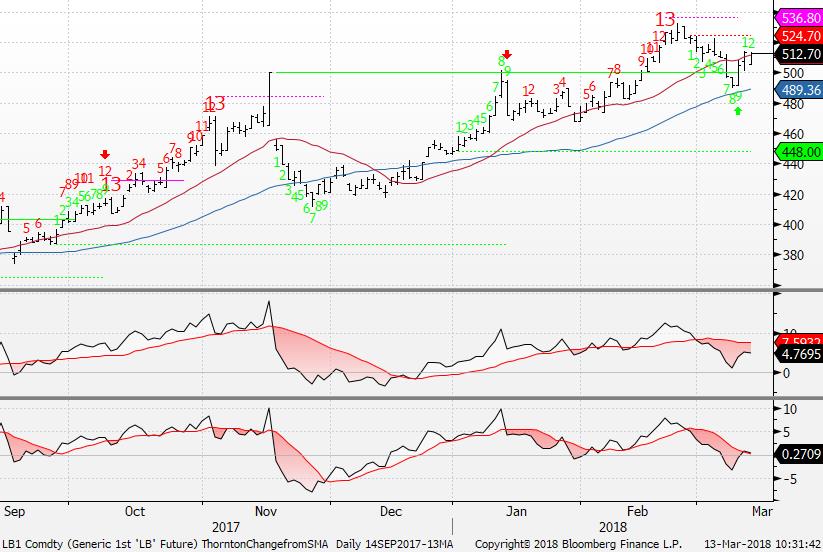
Lumber Futures had an upside exhaustion red Countdown 13 and pulled back and completed a downside green Setup 9 and has bounced also off the 50 day moving average. I'm watching this close to see if this makes a lower high.
|
|
|
|
|
|
|
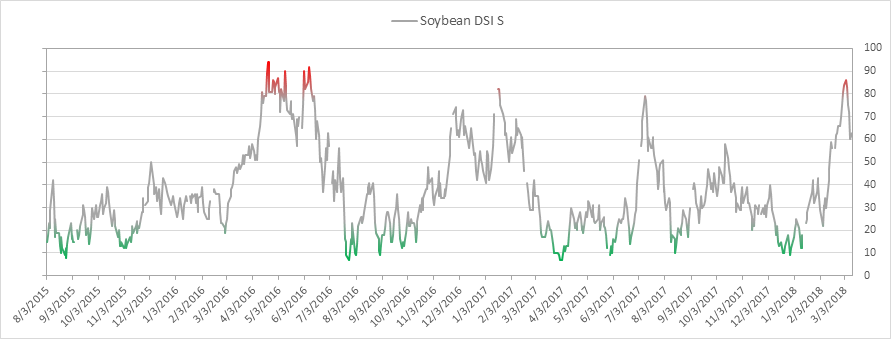
Soybean bullish sentiment is at 63% down from the recent high of 86%
|
|
|
|
|
|
|
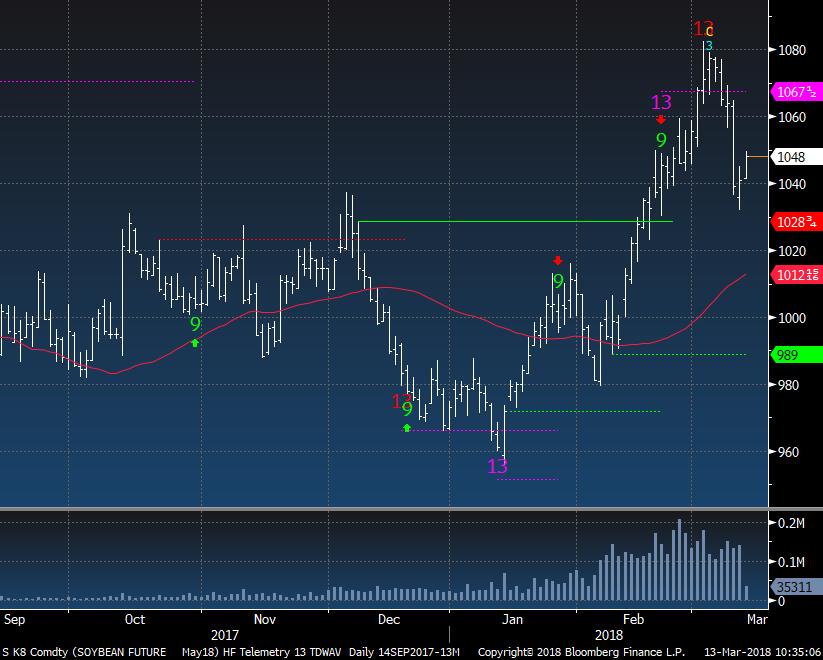
Soybean daily had a good upside exhaustion with the peak in sentiment. I still see this moving lower despite the strong bounce today
|
|
|
|
|
|
|
DEMARK SCREENS - Daily, Weekly, Monthly Upside/Downside Exhaustion Signals
|
|
|
Daily/Weekly DeMark upside/downside exhaustion signals (Sequential) Weekly updated on Monday's. Price flips occur when a stock closes higher/lower than four previous closes.
S&P 1500 Universe:
DAILY UPSIDE 13: AJG, AON, BBT, CHRW, CMA, FITB, KEX, LSTR, NVDA, PRAA, SF, TECH, TWX
DAILY DOWNSIDE 13: BBOX, PSEC, ROSE
DAILY UPSIDE WITH PRICE FLIP REVERSAL DOWN: MTB
DAILY DOWNSIDE WITH PRICE FLIP REVERSAL UP: AEE, AVA, HE, XEC
Updated: 3/12/18
WEEKLY UPSIDE 13: CNC, CRL, FDS, JBHT, LMNX, LPSN, MGLN, MSCI, PRFT, RHT, SRDX, TDS, TXN, WDC
WEEKLY DOWNSIDE 13: FSP, HOG, SAH
Updated: 3/1/1
MONTHLY UPSIDE 13: BDX, BMY, CAT, COL, CW, EBIX, GNCMA, IRBT, MMSI, NFLX
MONTHLY DOWNSIDE 13: CHK, SVU, WIN
Euro Stoxx 600 Universe:
DAILY UPSIDE 13: CNP FP, DMGT LN
DAILY DOWNSIDE 13: NONE
DAILY UPSIDE WITH PRICE FLIP REVERSAL DOWN: NONE
DAILY DOWNSIDE WITH PRICE FLIP REVERSAL UP: DIA SM, GNK LN
Updated: 3/12/18
WEEKLY UPSIDE 13: COB LN, EBS AV, GET FP, MRL SM
WEEKLY DOWNSIDE 13: FGP LN, HMSO LN, MRK GR, ONTEX BB, SBMO NA, SIE GR
Updated: 3/1/18
MONTHLY UPSIDE 13: ASML NA, ENX FP, FI/N SW, INVP LN, SAB SM, SCR FP, US IM
MONTHLY DOWNSIDE 13: NONE
|
|
|
Unsubscribe me from Hedge Fund Telemetry
Hedge Fund Telemetry LLC, P.O. Box 4675, Greenwich, CT 06861, United States
CONFIDENTIALITY NOTE and DISCLAIMER: This message is for the named person's use only. It may contain confidential, proprietary or legally privileged material. No confidentiality or privilege is waived by any accidental or unintentional transmission. If you receive this message in error, please immediately delete it and all copies of it from your system, destroy any hard copies and notify the sender. You must not, directly or indirectly, use, disclose,
distribute, print or copy any part of this message if you are not the intended recipient. Hedge Fund Telemetry LLC. cannot guarantee the confidentiality of the material transmitted; therefore, information of a sensitive or confidential nature should not be transmitted. There is risk in trading markets. Hedge Fund Telemetry LLC reports are based on information gathered from various sources and believed to be reliable, but are not guaranteed as to accuracy and completeness. The information is subject to change without notice and Hedge Fund Telemetry LLC has no obligation to provide any updates or changes. Hedge Fund Telemetry LLC is providing this data for informational and educational purposes and does not believe that it is sufficient to base an investment decision on. This information should not be regarded as a solicitation or recommendation of any particular security or to engage in any trading strategy. One should always check with your licensed financial
advisor to determine suitability of any investments.
|
|
|
|
|