If you are having difficulty seeing this email, you can view in your browser or click here to
print.
|
|
|
|
|
04/20/2024
Thomas Thornton
info@hedgefundtelemetry.com
|
|
|
|
|
Yesterday was a difficult day for me as I'm set up net short and throughout the day I was staring at my screens in disbelief. I call it staring at the Sun and I've done it when I've had a hard day. If you find yourself doing this, force yourself to shut down, get away, go workout, take a walk, hang out with significant other and kids, and if that doesn't work open a great bottle of wine like you crushed it. You'll go blind staring at the Sun and insane if you stare at your screens to too long.
Besides the bounce from the political news, the gains were focused around small/midcap indexes with good action in regional banks (the tariff free trade) I
couldn't believe how the average of the largest 10 weights in each US sector was as follows: Financials -40 bps, Materials -25 bps, Consumer Goods -50 bps, Consumer Services - 105 bps, Utilities -94 bps, Industrials -43 bps, Energy -84 bps, Telecom flat, Healthcare +13 bps, AND Tech + 98 bps. I've discussed the crazy narrow attribution with the big weights quite a bit but it's the market we have and as much as I cringe when I hear people say it's a "stock pickers market" it's true. Those that have outperformed have owned Amazon, Apple, Netflix, Microsoft, Nvdia, Intel, Boeing, and Goldman. I am asked often "How long can this last?" I don't know the exact day but I am assured that stocks like these, that dramatically outperform, come back down to earth. They run into tough comps, earnings growth rates and technological changes and habits. Some run into regulatory issues with governments when they get too big and powerful.
Stay nimble right
now and I would advise against chasing some of the names mentioned above. I'm still in the puts I bought for March and April. March are only SPY and QQQ (2.5% allocated) and April I have SPY, QQQ, and IWM (5% allocated). They are not working and could lose on the March but have plenty of time for April.
Notable:
- US Markets - Choppy action with Nasdaq 100 leading but others still vulnerable to more downside
- European Markets - I like the DAX long but am still cautious on the Euro Stoxx 600
- US Dollar Update - Potential for more upside but need another day or two to confirm
- Bonds - Trying but just can't seem to turn yet
- Crude Thoughts - A lot of evidence that Crude continues lower
- The most important US sectors I'm watching today
- Brick and mortar is dead again and the online retail/consumer is OVERBOUGHT
- DeMark Screens
|
|
|
|
|
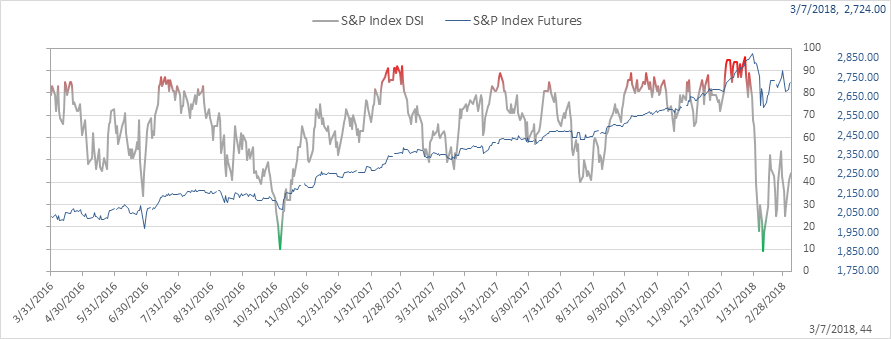
SPX bullish sentiment is at 44% up a point from the previous day.
|
|
|
|
|
|
|
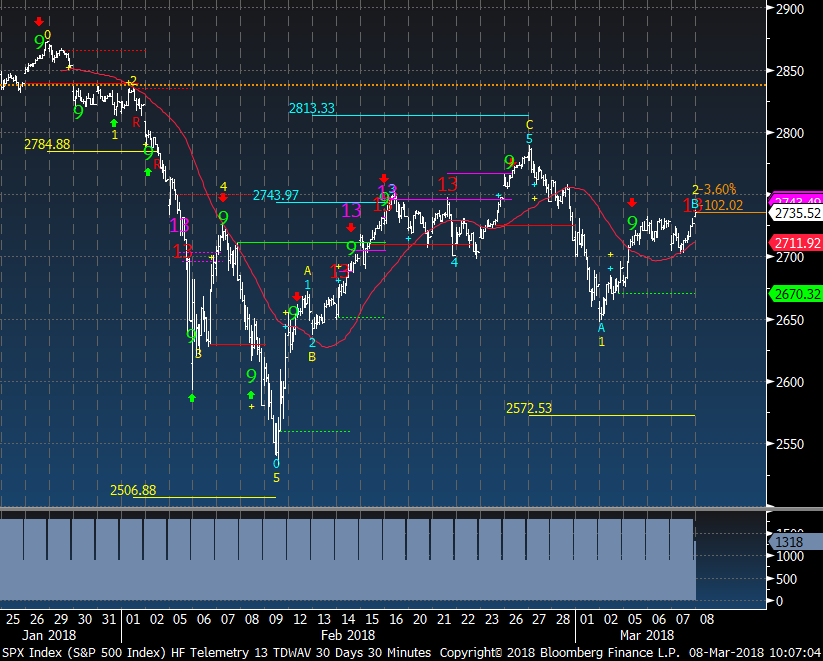
SPX tactical 30 minute time frame just had an upside red Countdown while potentially making another lower high. The wave 3 downside price objective is 2572
|
|
|
|
|
|
|
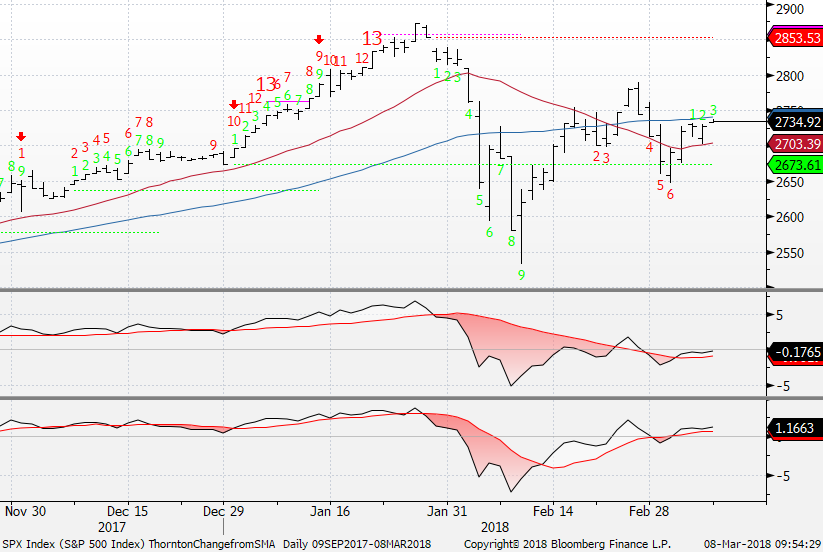
SPX daily still is under the 50 day moving average. It's a bit of a tug of war but a downside red Countdown remains on day 6 of 13. If the green upside Setup count can make 9 consecutive closes higher than 4 previous closes the downside red Countdown will be nullified.
|
|
|
|
|
|
|
|
|
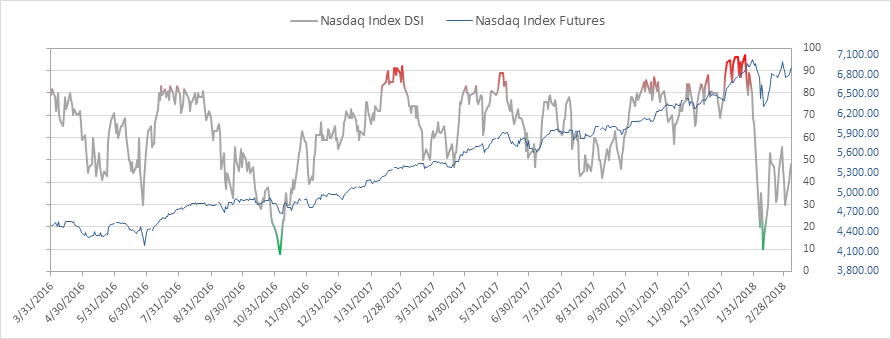
Nasdaq bullish sentiment is at 48%
|
|
|
|
|
|
|
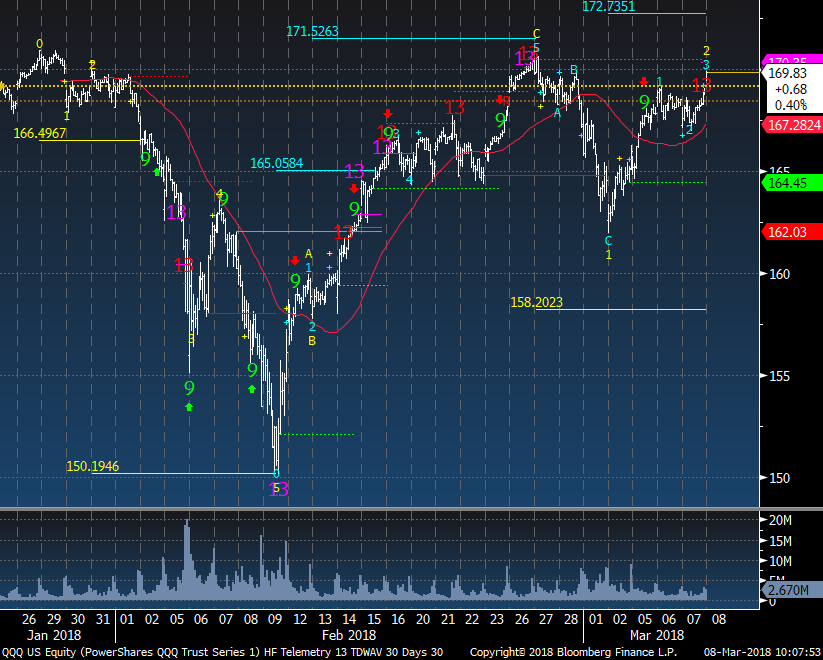
QQQ Nasdaq 100 has unquestionably been the strongest of all the US indexes and maybe in the world. It's up at resistance and has not made a new closing high yet. There is also a downside red Countdown on day 3 and a green Setup on day 3.
|
|
|
|
|
|
|
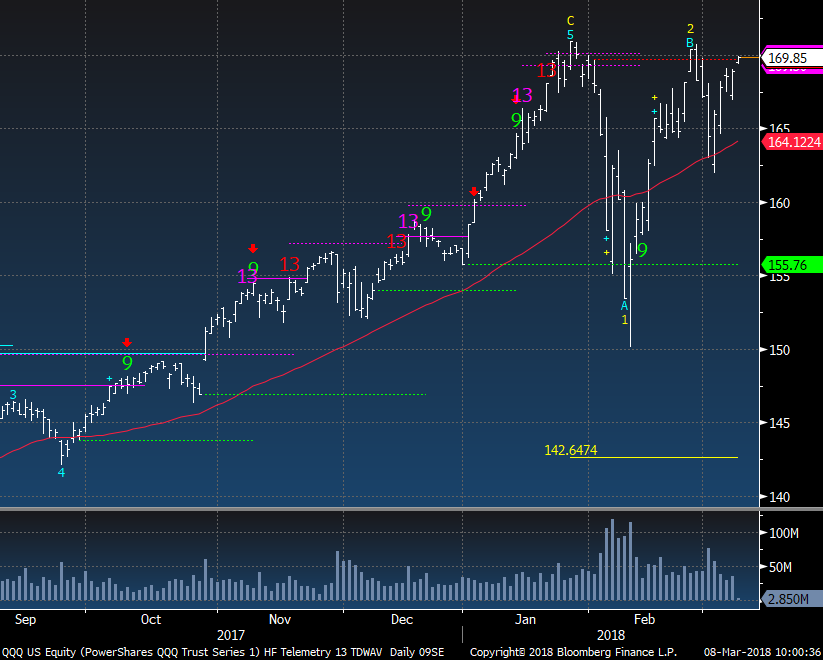
QQQ with the wave setup is close to reverting back to the 5th wave if a new closing high is achieved. I would not call this bullish in the sense of it being timely or with low risk because it remains overbought longer term and just had a monthly upside DeMark exhaustion (as did the FANG+ index). In February 2016 - that was an optimum buying opportunity with downside exhaustion signals and very low sentiment 4% bulls.
|
|
|
|
|
|
|
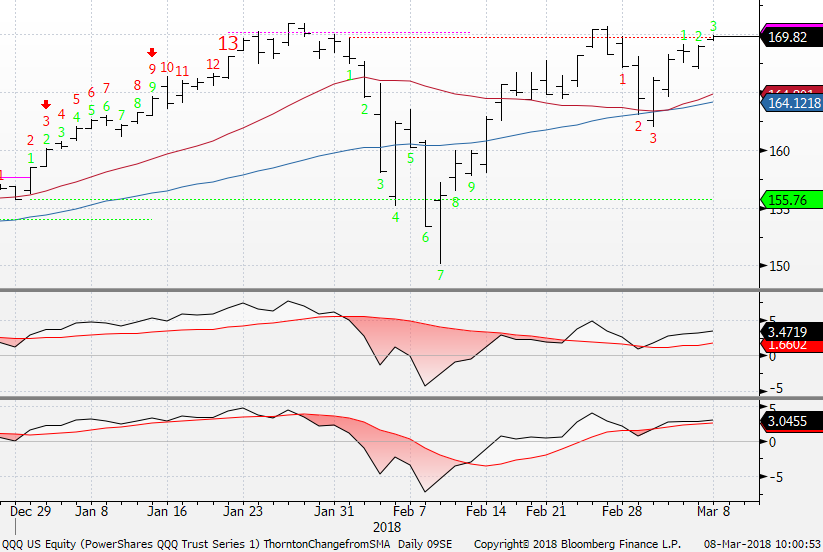
QQQ tactical 30 minute time frame also had an exhaustion earlier . This will either go up further to 172ish or break the recent March lows.
|
|
|
|
|
|
|
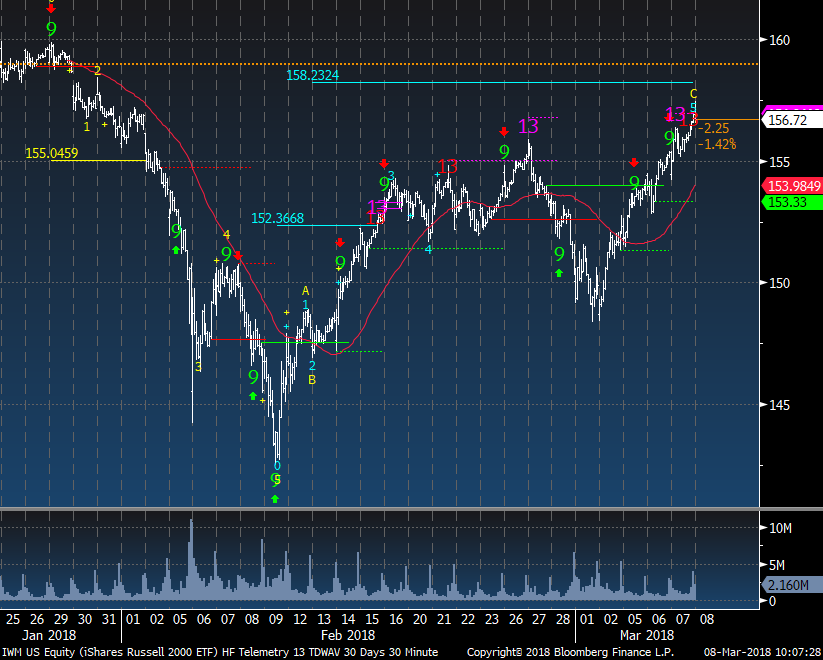
IWM Russell 2000 has been very strong in the past week but is likely to stall with the recent upside exhaustion in wave 5. Perhaps the upside wave 5 price objective will be challenged.
|
|
|
|
|
|
|
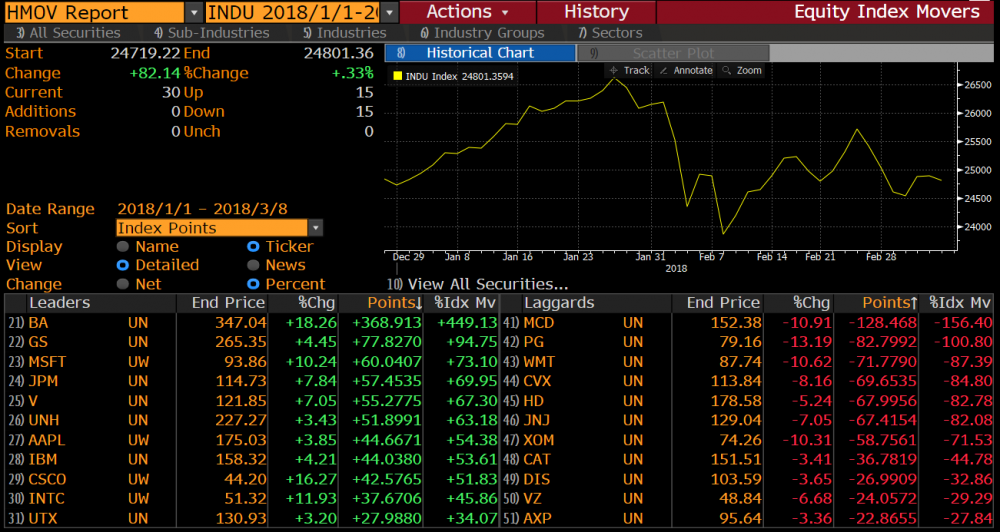
Here's the YTD attribution with the Dow Jones. BA is 4.5x the attribution from the next best attribute. If any of these stocks split the market will be confirmed at a top.
|
|
|
|
|
|
|
|
|
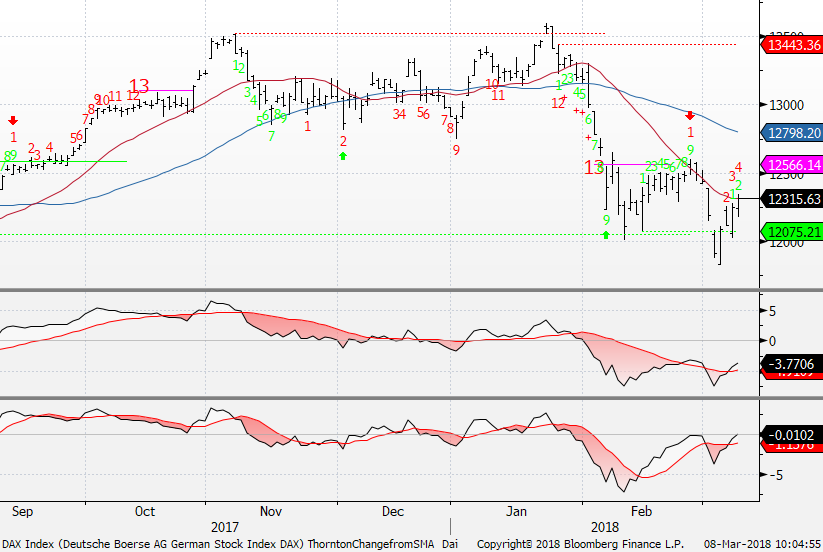
As I mentioned yesterday, I have been looking at a few European markets a little more constructively. Notably the DAX with now has an upside red Countdown 4 on the upside. I like it long here and would only allocate a small percentage for now. 12,075 stop
|
|
|
|
|
|
|
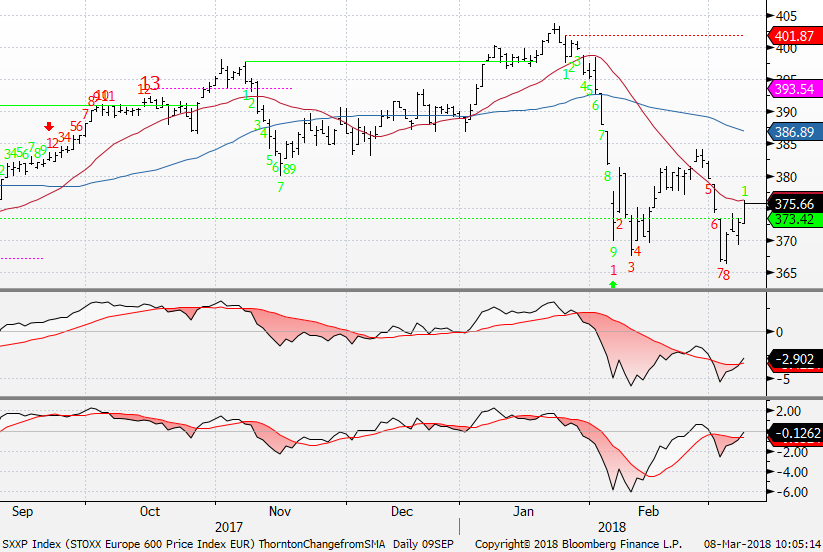
The broader SXXP Euro Stoxx 600 still has a downside red Countdown on day 8 of 13. Pattern looks like a double bottom with some positive divergence however I am still not convinced downside is complete
|
|
|
|
|
|
|
|
|
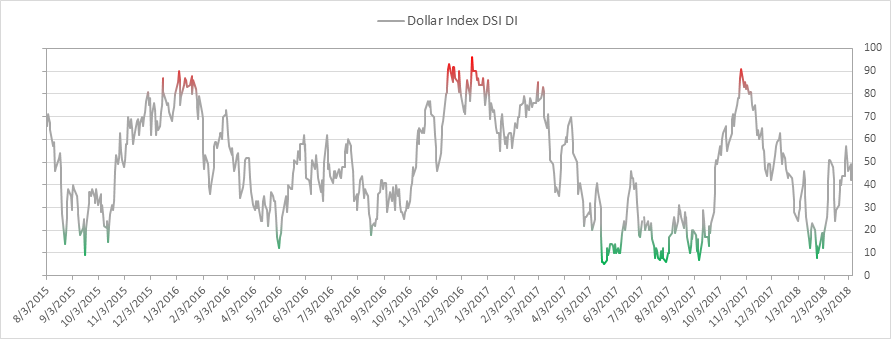
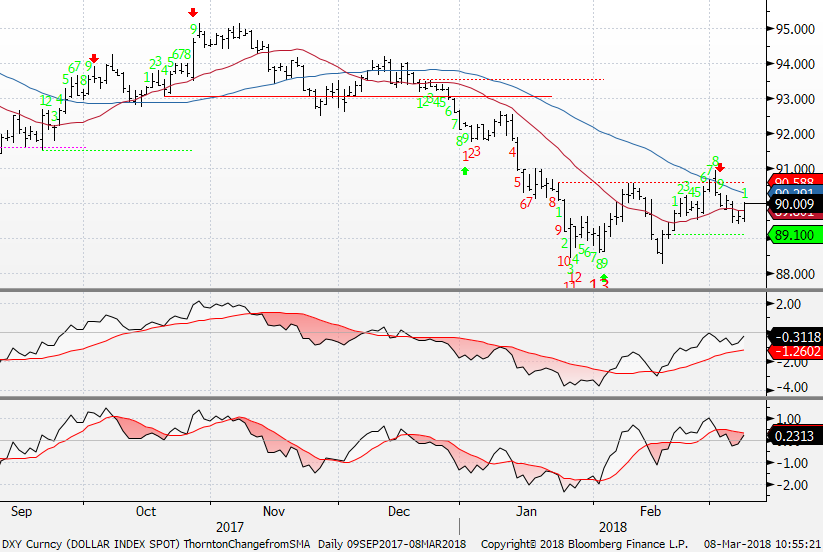
US Dollar bullish sentiment is at 42% and needs to clear 50% to really make a move higher
|
|
|
|
|
|
|
DXY US Dollar index just price flipped (green 1 with it trading higher than 4 previous closes). It needs to clear the 50 day then the recent high. There is potential soon for a new red upside Countdown in the coming days.
|
|
|
|
|
|
|
|
|
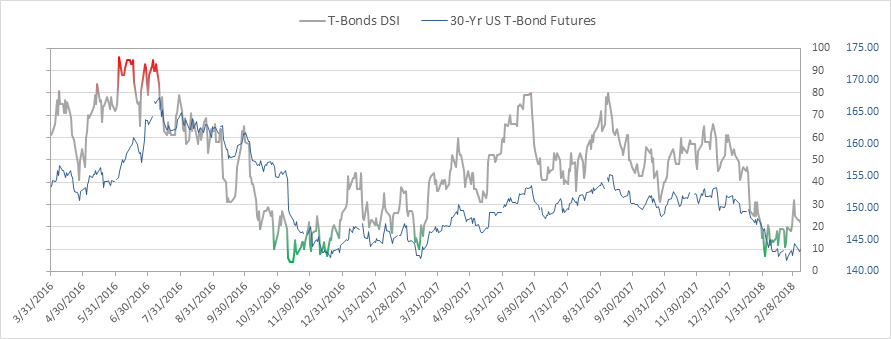
Bond bullish sentiment is at 22% and remains in the low 20's. Recall it hit 7% on 2/2/18
|
|
|
|
|
|
|
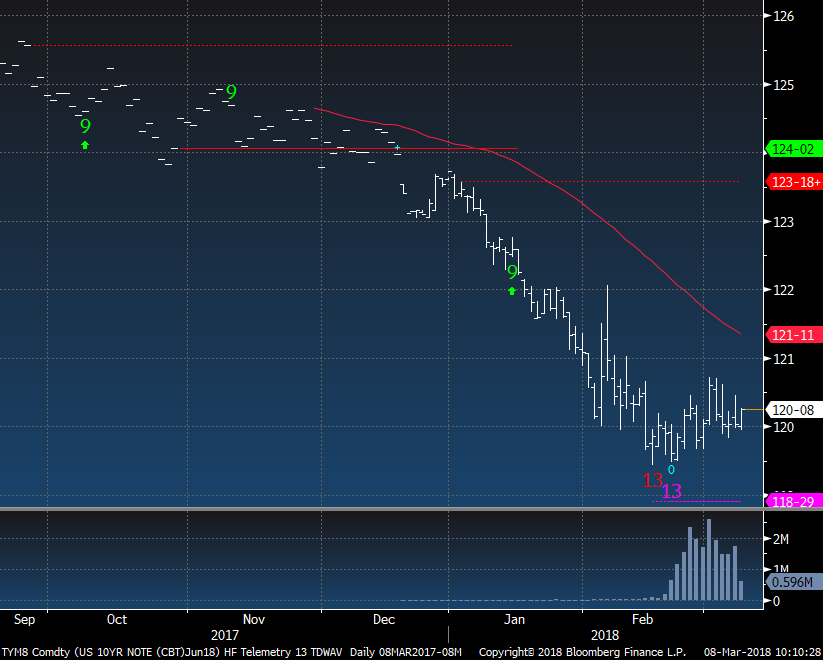
US 10 year futures has some downside exhaustion but just hasn't been able to turn up enough to get the long bond trade moving
|
|
|
|
|
|
|
|
|
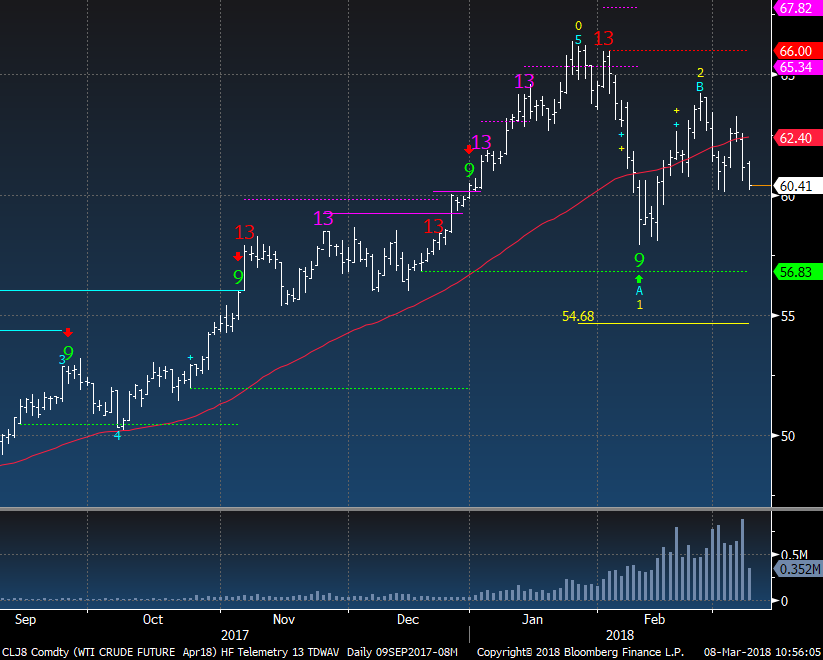
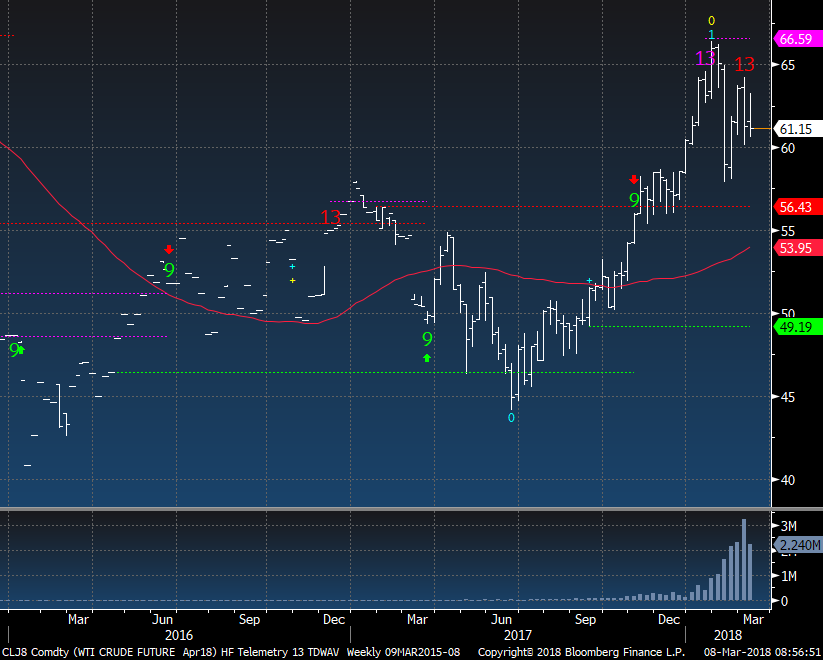
Crude sentiment is at 50% and it's make or break for Crude too with the price at 60. There is a downside wave 3 price objective at 54.68. Considering positioning remains setup overly bullish with speculators, there is real risk to the downside.
|
|
|
|
|
|
|
Crude on a weekly time frame had an upside exhaustion too last week.
|
|
|
|
|
|
|
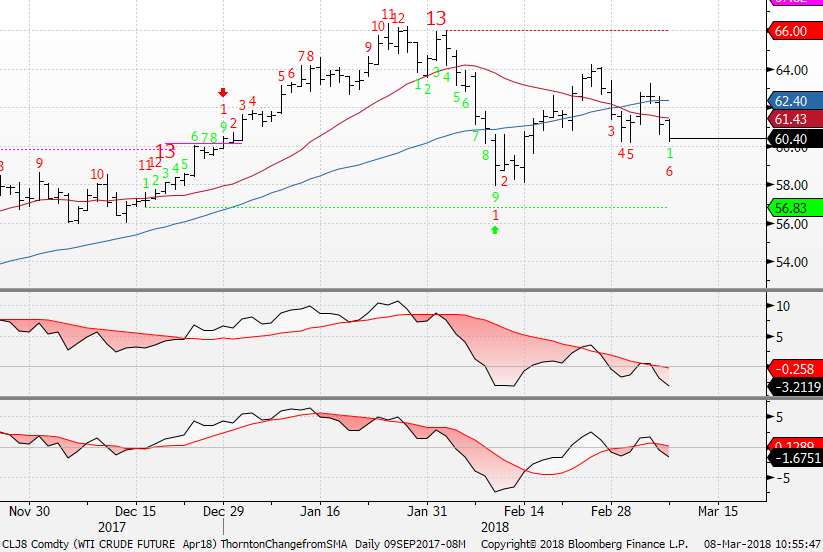
Here's the daily with the Countdowns visible and you see it's on day 6 of 13
|
|
|
|
|
|
|
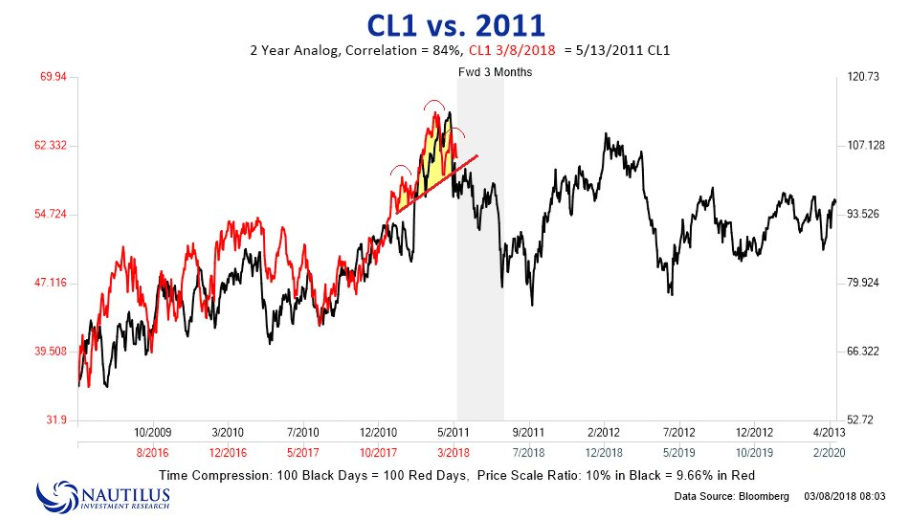
My friends at Nautilus Research do great work and they did an analog with 2011 when crude was hit pretty hard. On the other hand there tends to be positive seasonality in the spring.
|
|
|
|
|
|
|
The most important sectors in the US I'm watching
|
|
|
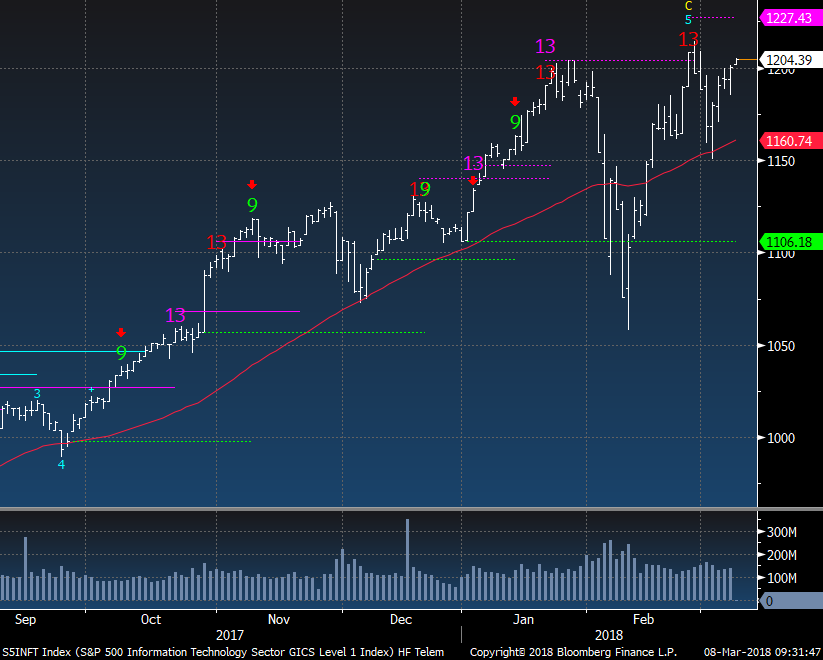
Tech is on the verge of making a new high. It's already in the 5th wave so there would be no changes to the wave structure
|
|
|
|
|
|
|
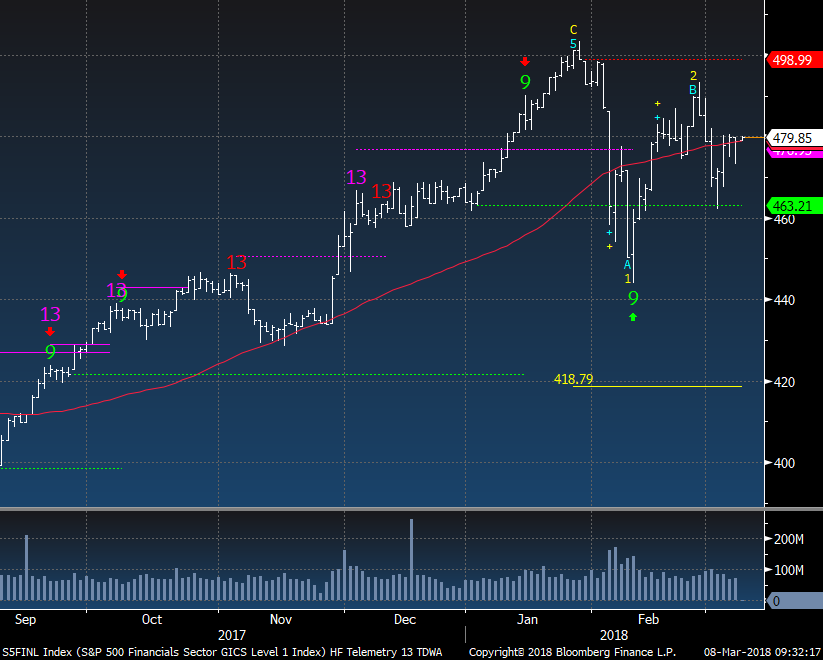
Financials is stuck at the 50 day but well off January highs and late February highs. Breaking 463 support and it's not stopping there
|
|
|
|
|
|
|
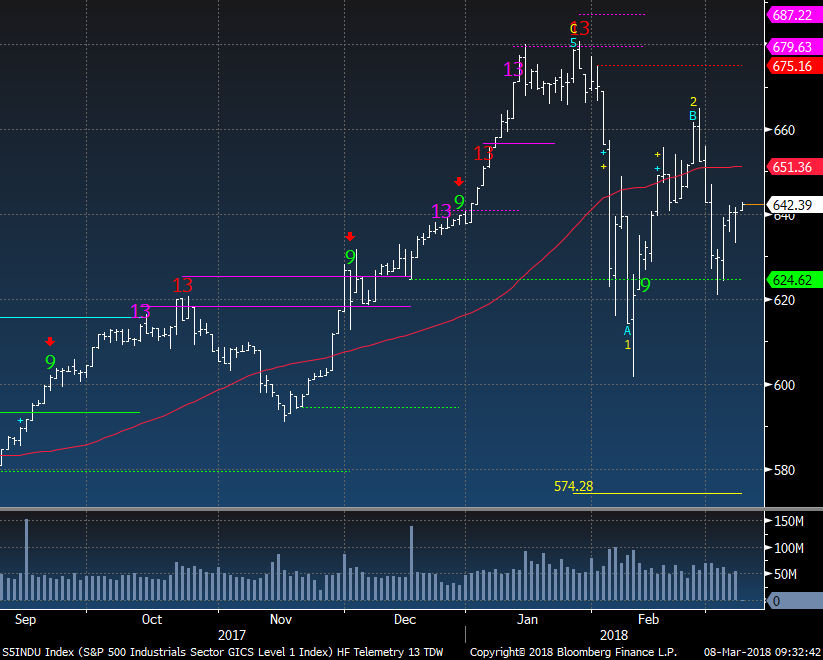
Industrials continues to struggle. This is a real problem for the overall market health in my view
|
|
|
|
|
|
|
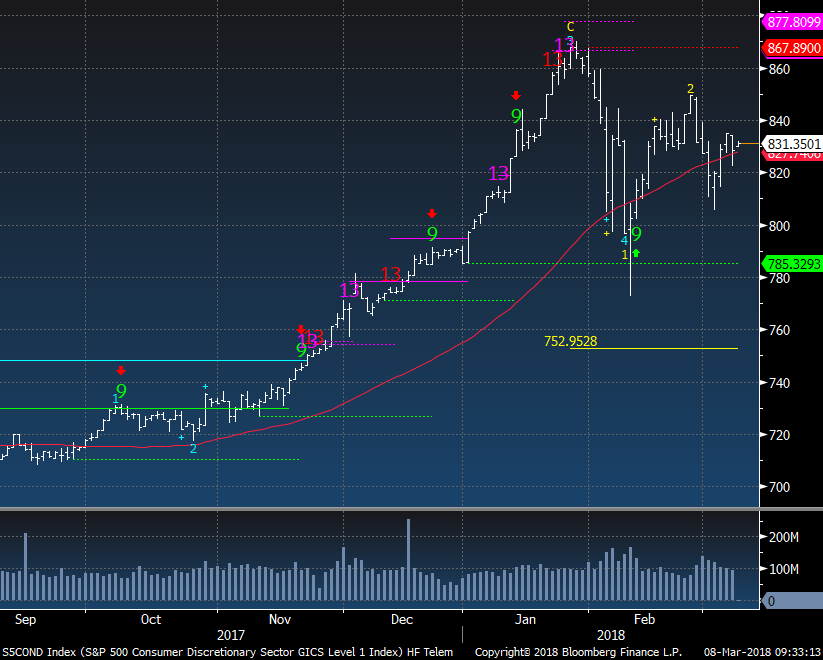
Consumer Discretionary is holding the 50 day today but still feels like it's in no man's land. In the sector there are only 27% above the 50 day moving average. NOTE - When the new Cons Disc sector reweighting happens later this year (CMCSA, DIS, NFLX, and CHTR are moving to the Telecom sector) AMZN will grow in weight from 20% to 30%. This is a big deal.
|
|
|
|
|
|
|
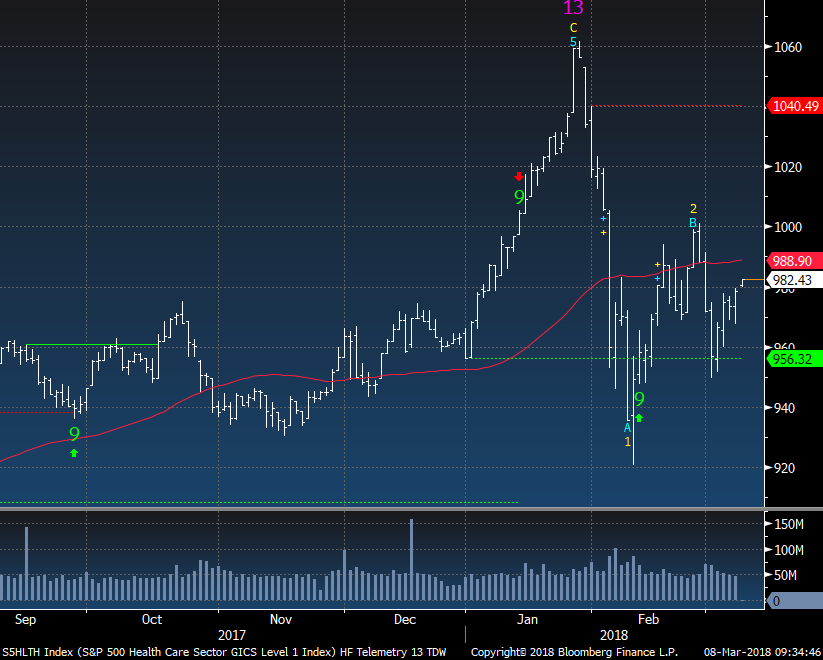
Healthcare potentially will make another lower high too
|
|
|
|
|
|
|
Brick and mortar retail is once again dead and and online retail/consumer is OVERBOUGHT
|
|
|
|
|
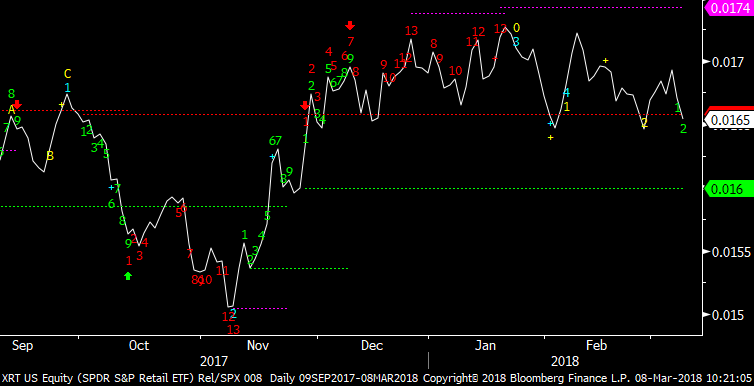
| Brick and mortar retail death watch last year was all the talk (there was also an ETF created on retail's doom) but back in November the XRT Retail ETF vs the SPX had a downside red Countdown exhaustion. The peak happened in late December/January on a relative basis. Below I am posting a bunch of big retailers who probably should be having good earnings reports with the new found wealth for consumers with low unemployment, gains in the markets, tax reform, or whatever. This should be a real warning that the consumer isn't spending inline with the bullish economic narrative
|
|
|
|
|
|
|
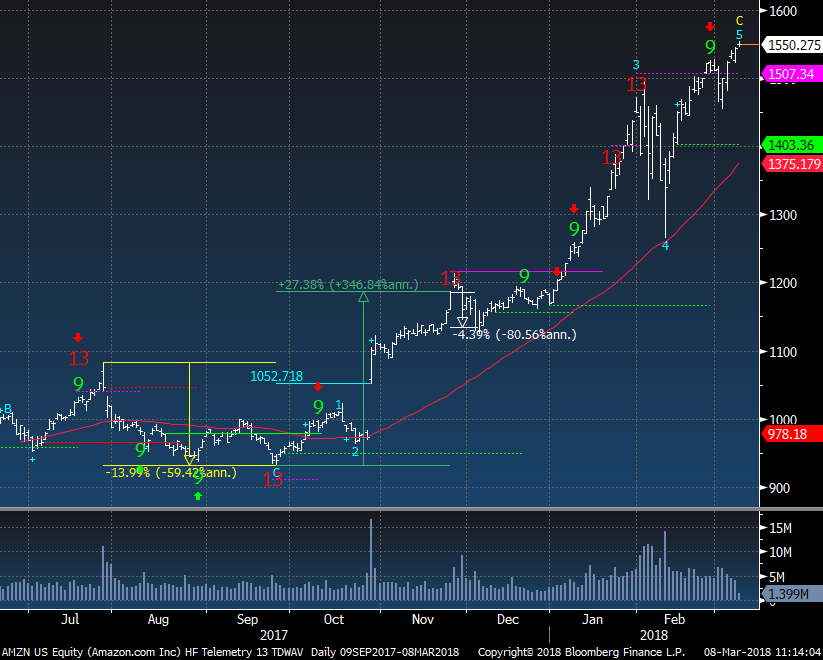
Before I get into what's dying, AMZN continues it's steep climb higher. I expect a top ahead of April. I'm not short but it feels like I am looking at this chart
|
|
|
|
|
|
|
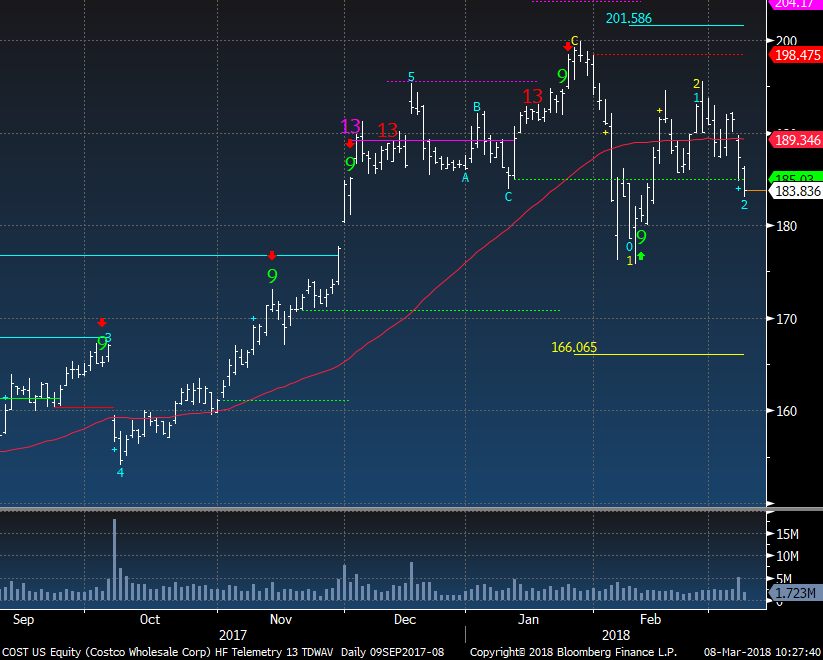
Costco - wholesale - sells everything from food to electronics to jewelry
|
|
|
|
|
|
|
|
|
|
|
|
|
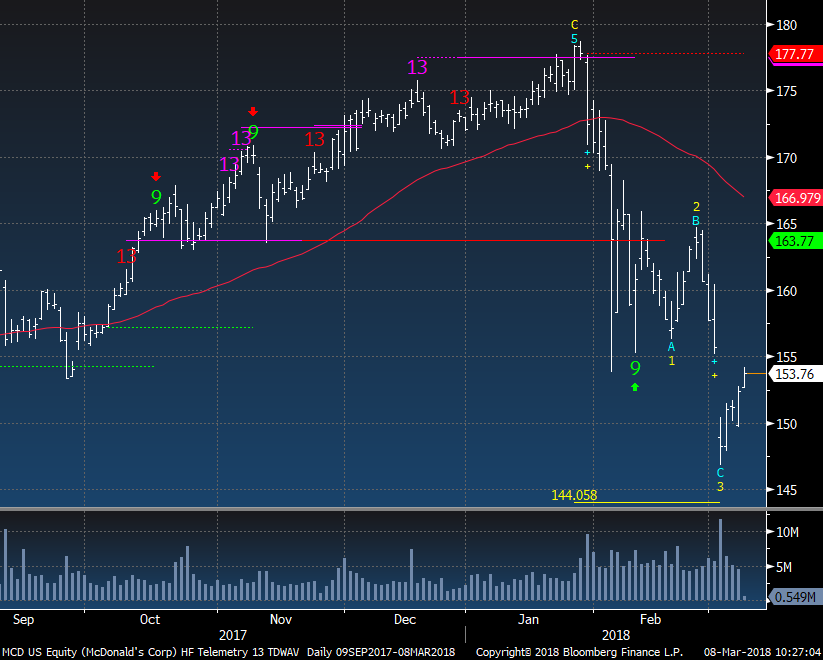
McDonalds - Fast food losing appeal?
|
|
|
|
|
|
|
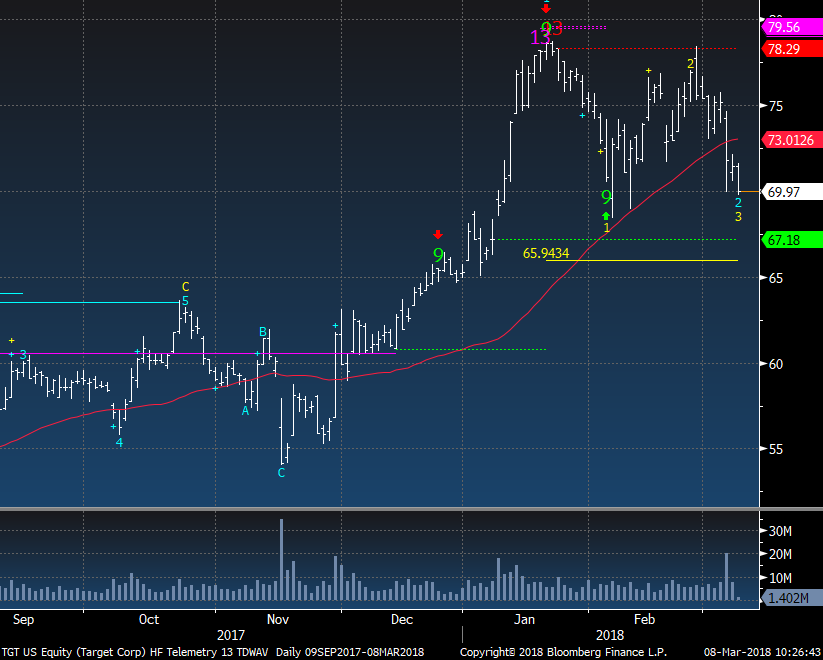
Target - diversified with food, clothing, electronics and the CEO has been on CNBC lately saying how great they are doing. He's got a job at the White House waiting for him...
|
|
|
|
|
|
|
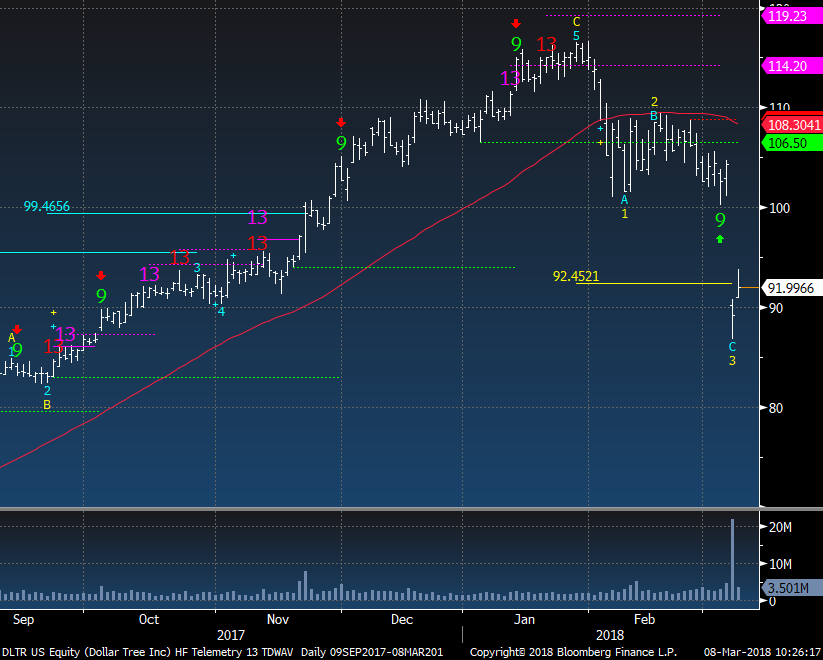
Dollar Tree - Discount stores. The lower income shoppers have left the building
|
|
|
|
|
|
|
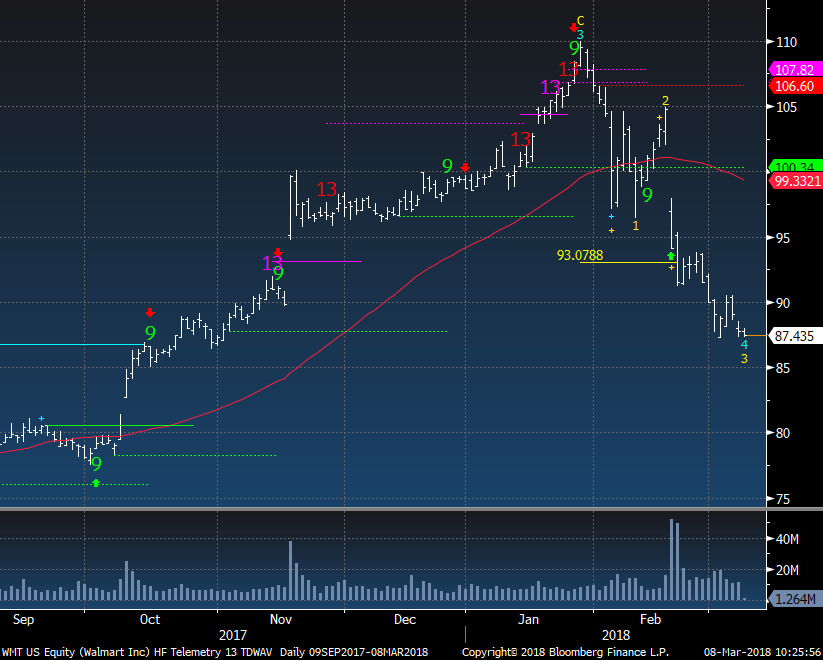
Walmart - The biggest diversified retailer in the world.
|
|
|
|
|
|
|
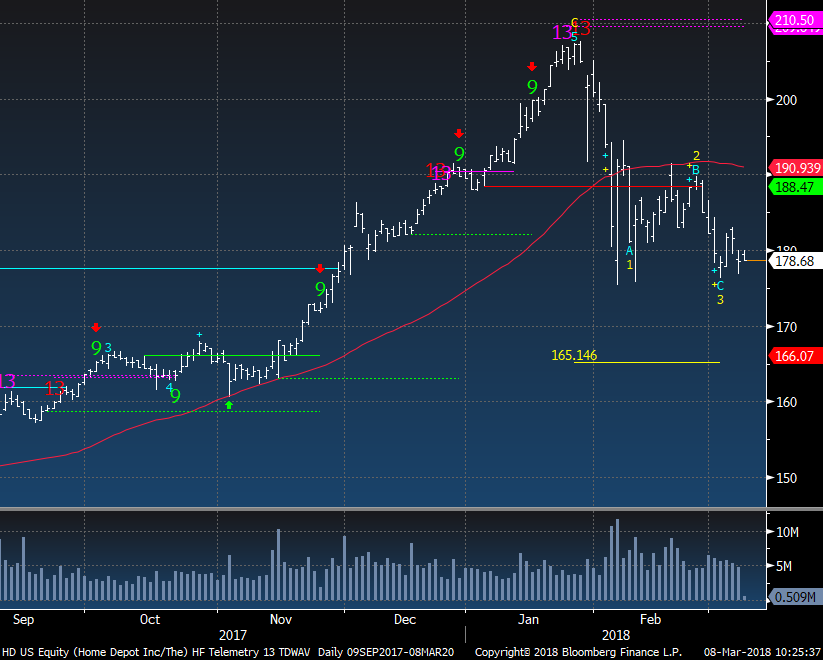
Home Depot - The move up last year was likely do to all of the hurricane spending. Tough comps for 2018 unless there are more natural disasters.
|
|
|
|
|
|
|
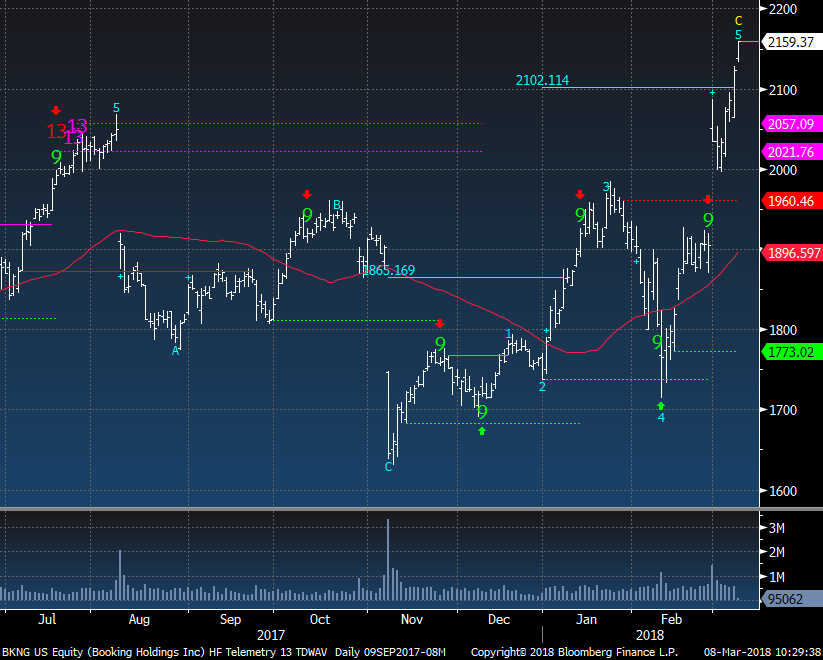
Priceline changed their name to Booking Holdings and it's been straight up. But if the consumer is starting to pull back with the retailers shouldn't we start to wonder how spending on travel will be in 6 months?
|
|
|
|
|
|
|
|
|
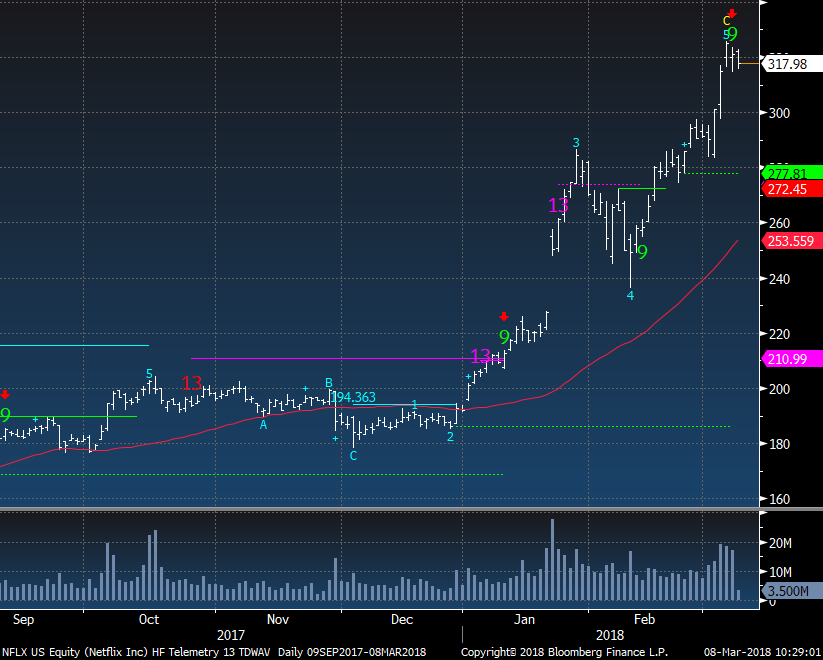
| Netflix has been unstoppable gaining 64% this year alone. Out of all of the consumer names it's the most overbought at 28% above the 50 day moving average within the SPX. If long, take profits and if looking to go short - buy a very small amount of OTM puts a quarter or two out. Lotto time.
|
|
|
|
|
|
|
DEMARK SCREENS - Daily, Weekly, Monthly Upside/Downside Exhaustion Signals
|
|
|
Daily/Weekly DeMark upside/downside exhaustion signals (Sequential) Weekly updated on Monday's. Price flips occur when a stock closes higher/lower than four previous closes.
S&P 1500 Universe:
DAILY UPSIDE 13: BRK/B, BXS, GWW, HBAN, HRS, HSII, MINI, MSCI, RF, SBNY
DAILY DOWNSIDE 13: AIV, AVAV, CMS, DRE, EGP, EPR, RBCN, RDC, TTEC, WTR
DAILY UPSIDE WITH PRICE FLIP REVERSAL DOWN: NONE
DAILY DOWNSIDE WITH PRICE FLIP REVERSAL UP: AVA, CPT, EPR, GOV
Updated: 3/5/18
WEEKLY UPSIDE 13: AFG, APH, BBT, EL, HSC, ISRG, HW/A, MCO, MINI, MSFT, VRTU, WEX, ZBRA
WEEKLY DOWNSIDE 13: CRZO, HR, MSTR, RNR, SUP
Updated: 3/1/1
MONTHLY UPSIDE 13: BDX, BMY, CAT, COL, CW, EBIX, GNCMA, IRBT, MMSI, NFLX
MONTHLY DOWNSIDE 13: CHK, SVU, WIN
Euro Stoxx 600 Universe:
DAILY UPSIDE 13: ADP FP, ENX FP, HNR1 GR, INDV LN, TRELB SS
DAILY DOWNSIDE 13: NONE
DAILY UPSIDE WITH PRICE FLIP REVERSAL DOWN: NONE
DAILY DOWNSIDE WITH PRICE FLIP REVERSAL UP: BDEV LN, ENEL IM, FDR FP, HMB SS, MRK GR, RPC LN, RTN LN, TPK LN
Updated: 3/5/18
WEEKLY UPSIDE 13: BKT SM, LSE LN, RMS FP
WEEKLY DOWNSIDE 13: SNH GR, TCH FP
Updated: 3/1/18
MONTHLY UPSIDE 13: ASML NA, ENX FP, FI/N SW, INVP LN, SAB SM, SCR FP, US IM
MONTHLY DOWNSIDE 13: NONE
|
|
|
Unsubscribe me from Hedge Fund Telemetry
Hedge Fund Telemetry LLC, P.O. Box 4675, Greenwich, CT 06861, United States
CONFIDENTIALITY NOTE and DISCLAIMER: This message is for the named person's use only. It may contain confidential, proprietary or legally privileged material. No confidentiality or privilege is waived by any accidental or unintentional transmission. If you receive this message in error, please immediately delete it and all copies of it from your system, destroy any hard copies and notify the sender. You must not, directly or indirectly, use, disclose,
distribute, print or copy any part of this message if you are not the intended recipient. Hedge Fund Telemetry LLC. cannot guarantee the confidentiality of the material transmitted; therefore, information of a sensitive or confidential nature should not be transmitted. There is risk in trading markets. Hedge Fund Telemetry LLC reports are based on information gathered from various sources and believed to be reliable, but are not guaranteed as to accuracy and completeness. The information is subject to change without notice and Hedge Fund Telemetry LLC has no obligation to provide any updates or changes. Hedge Fund Telemetry LLC is providing this data for informational and educational purposes and does not believe that it is sufficient to base an investment decision on. This information should not be regarded as a solicitation or recommendation of any particular security or to engage in any trading strategy. One should always check with your licensed financial
advisor to determine suitability of any investments.
|
|
|
|
|