If you are having difficulty seeing this email, you can view in your browser or click here to
print.
|
|
|
|
|
04/26/2024
Thomas Thornton
info@hedgefundtelemetry.com
|
|
|
No change to lower low thesis
|
|
|
As I mentioned on Friday, bounces are expected and one has to manage risk appropriately for there own risk tolerance. The bounce today is continuing from Friday has a lot of bullish people excited yet the lower low thesis remains. Today I will run through why the lower low thesis remains. Running late as I picked off too many markets and charts as usual. A few left on cutting room floor including currencies, a sector run down that I will take up tomorrow. Please pardon some of my charts were grabbed before the 11am move up started.
Notable:
- US Markets - Bounce continues but will be running into resistance today
- European Markets - Many new lows today
- Asian Markets - Many with downside Countdowns
- Bloomberg World Index and Emerging Markets
- Bonds and Libor - Libor blowing out should have anyone bullish concerned
- Bitcoin Update - Upside Countdown in
progress
- DeMark Screens - Daily, Weekly, and February Monthly now updated
|
|
|
|
|
SPX bullish sentiment is at 30% up from 25% on Thursday. Today's bounce continuation if it holds will lift it again yet it should stay under 50%
|
|
|
|
|
|
|
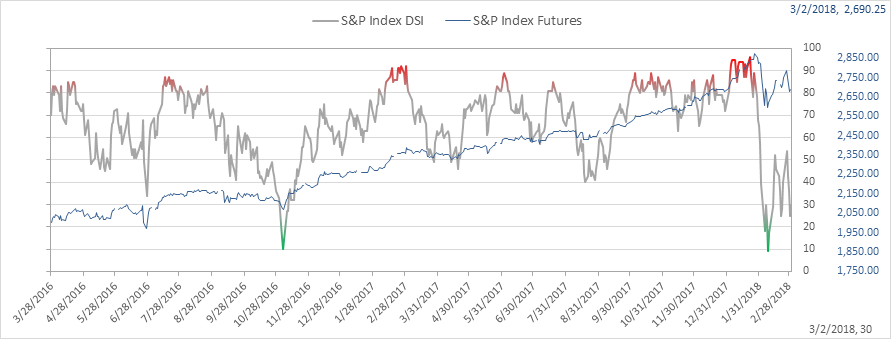
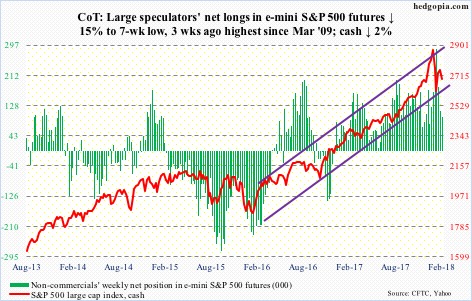
SPX bullish positioning dropped again moderately and despite the recent correction the speculators remain bullish which isn't lining up with bullish sentiment. I want to see bullish sentiment and positioning lining up together bearish.
|
|
|
|
|
|
|
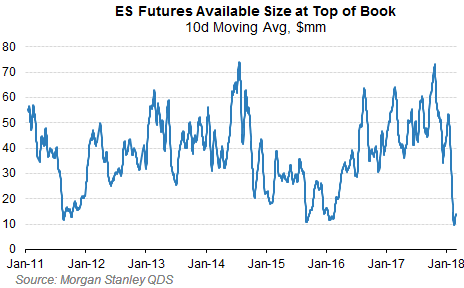
Morgan Stanley's Prime Brokerage puts out incredible research and data. This was brought to my attention this weekend with liquidity in the ES Futures market. What this is showing is available size at the top of the book in the US equity futures market - i.e. how many futures can trade without impacting price - has deteriorated sharply and has
remained depressed since Feb 5th. In fact as shown in the chart below, using that metric, market liquidity is now the worst since the financial crisis. There are similar signs of reduced size / wider spreads in cash and options markets as well. Hat Tip (T.H. and Zero Hedge)
|
|
|
|
|
|
|
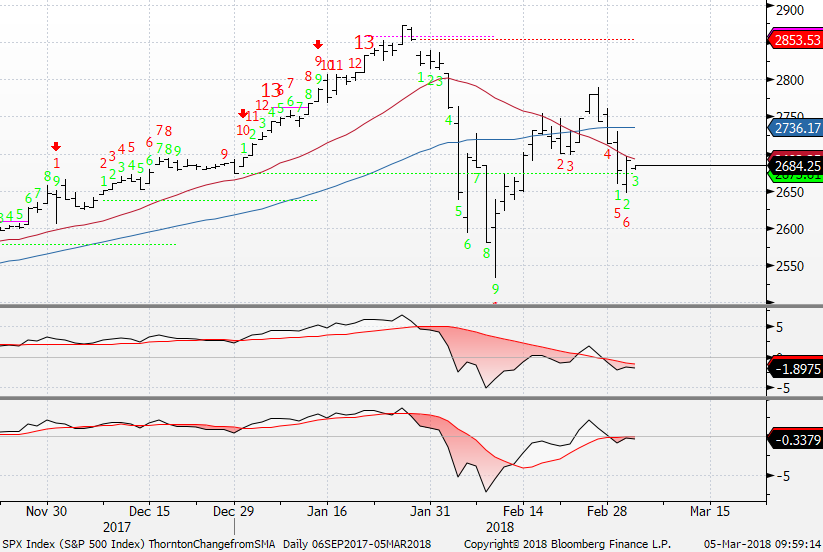
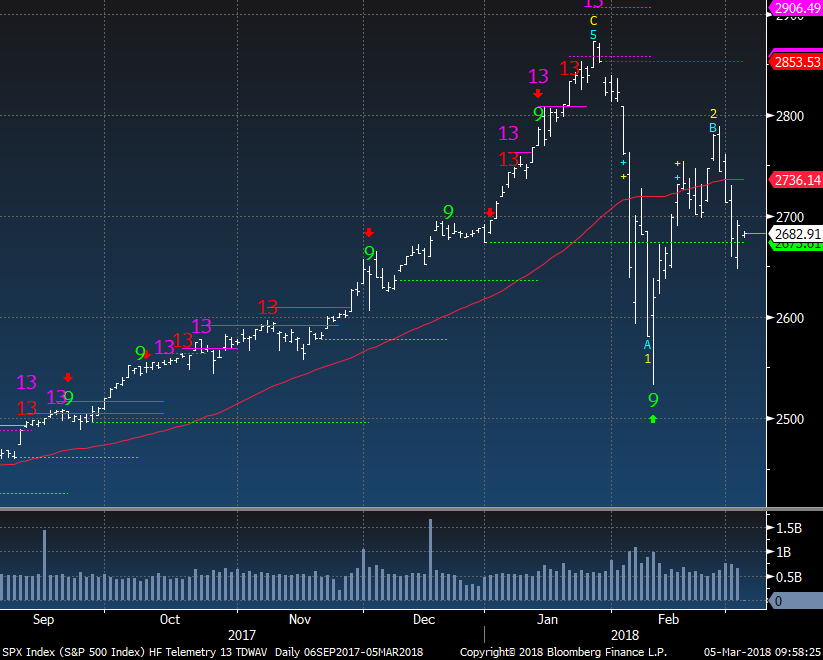
SPX daily still under the 50 day (blue line) at 2736 and has a downside red Countdown still on day 6 of 13.
|
|
|
|
|
|
|
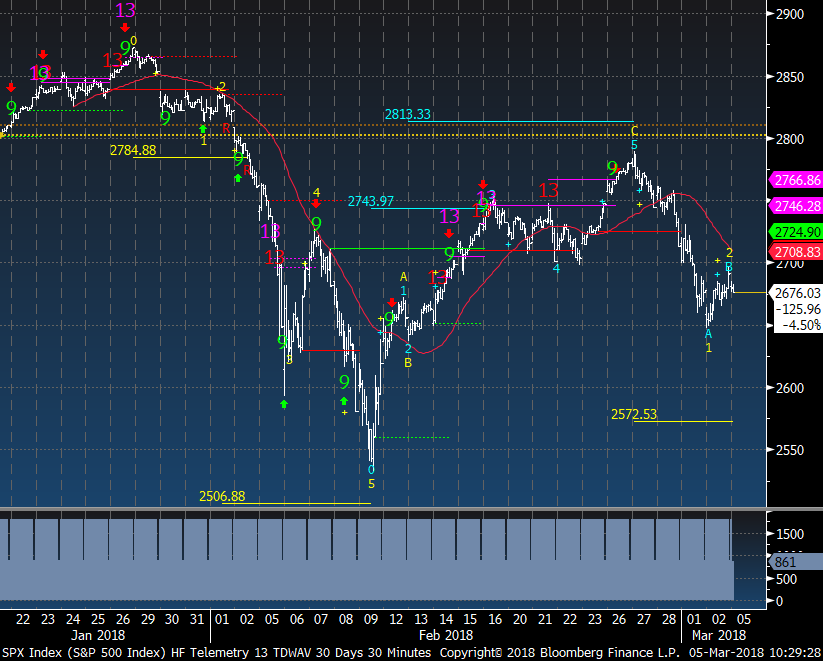
SPX wave set up remains intact and a break of the February lows will lock in wave 3 on the downside.
|
|
|
|
|
|
|
Tactically it's worth looking at the short term 30 minute had a wave 1 down move from the up 5 wave ending in late February. There is a lot of room to move up that would negate this wave setup and that's the late February highs. Breaking the lows from Friday would lock in wave 3.
|
|
|
|
|
|
|
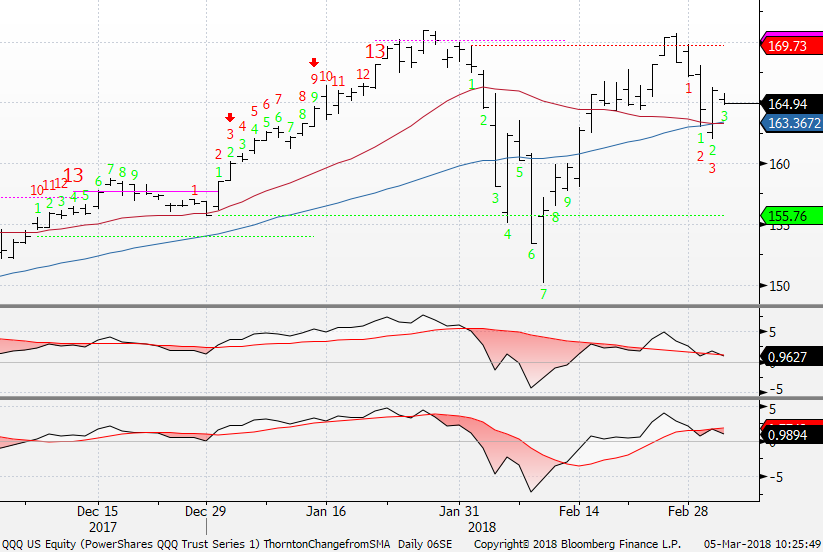
QQQ still has a daily downside red Countdown on day 3 of 13
|
|
|
|
|
|
|
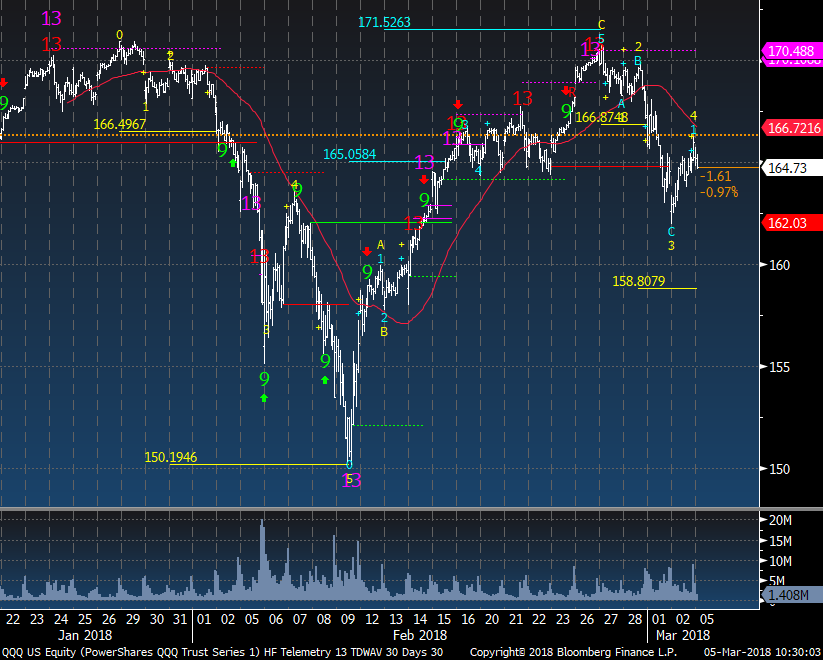
QQQ tactical 30 minute chart also has a downside wave pattern but on wave 4 with a downside wave 5 at 158.80
|
|
|
|
|
|
|
|
|
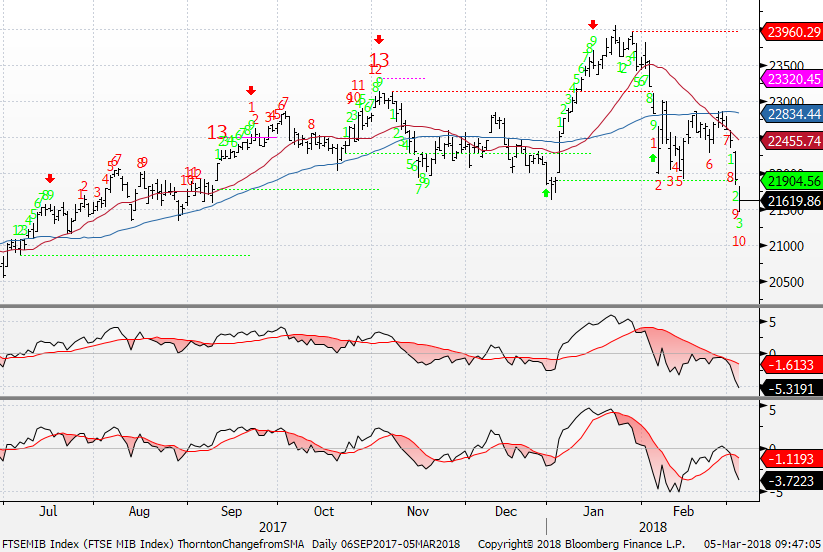
Italy broke support post election and is on day 10 of 13 with a downside Countdown
|
|
|
|
|
|
|
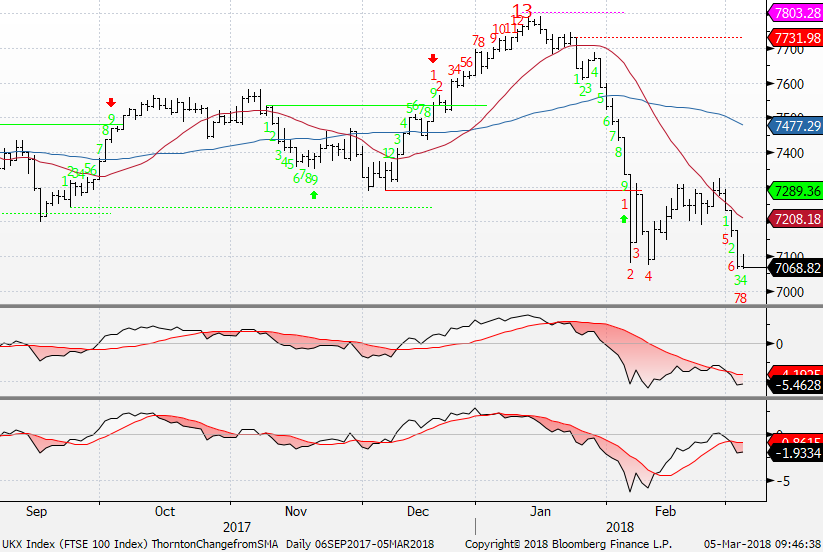
UK FTSE 100 making new lows too on day 8 of 13 with it's downside Countdown
|
|
|
|
|
|
|
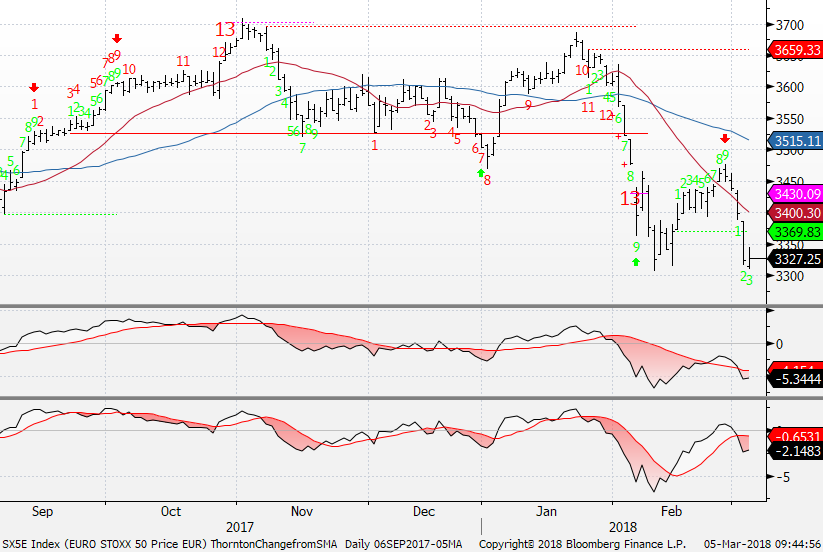
SX5E Euro Stoxx 50 does not have a red Countdown but it also make a new low
|
|
|
|
|
|
|
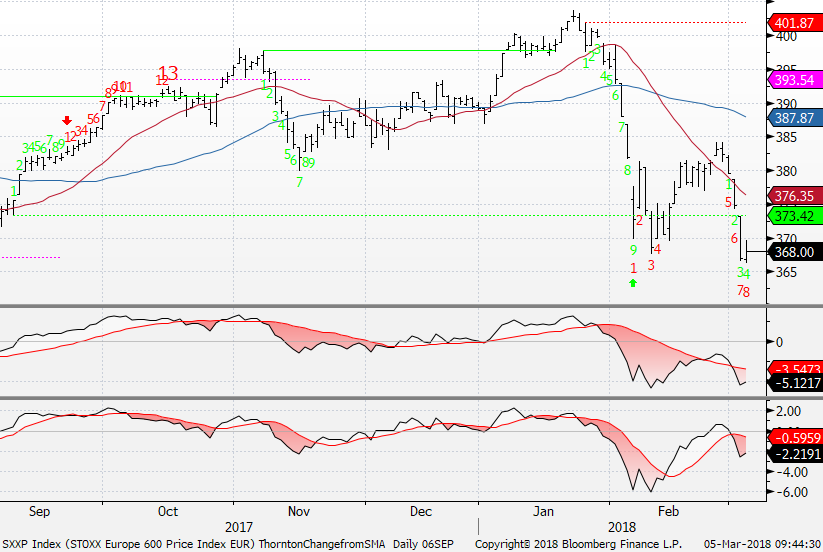
Euro Stoxx 600 does have a red Countdown on day 8 of 13
|
|
|
|
|
|
|
|
|
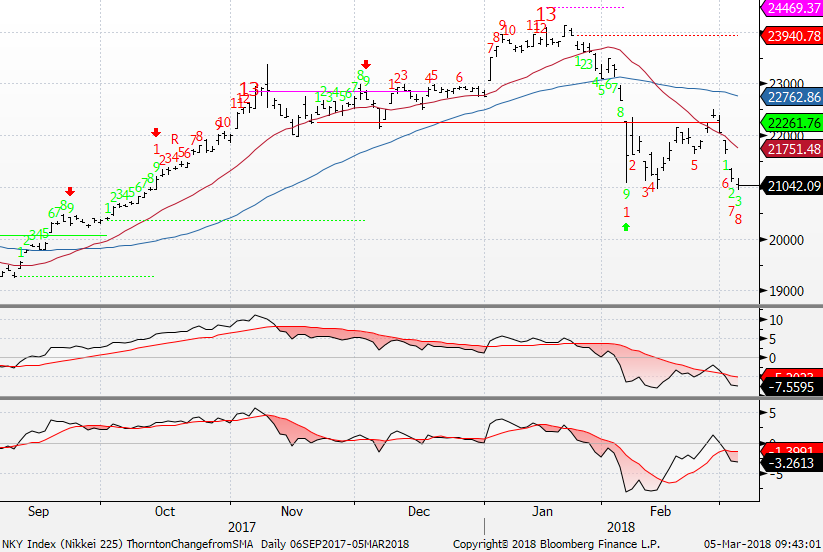
Nikkei made a new closing low and is on day 8 of 13 with it's Countdown
|
|
|
|
|
|
|
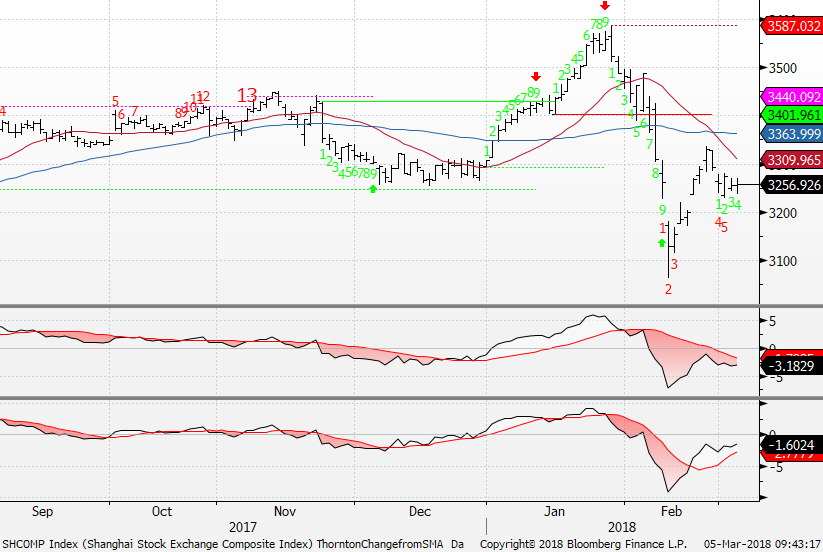
Shanghai Composite Index is on day 5 of 13 with it's Countdown
|
|
|
|
|
|
|
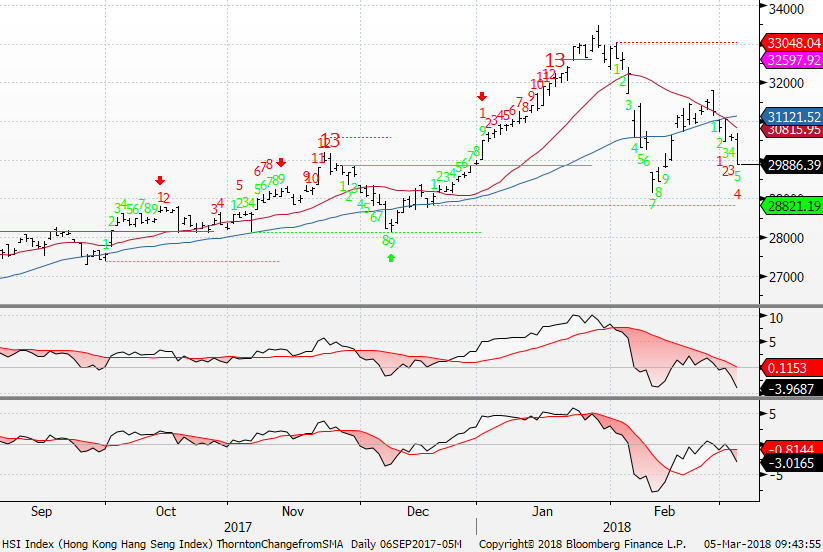
Hong Kong Hang Seng had a bad day yesterday and is on day 4 of 13 with it's Countdown
|
|
|
|
|
|
|
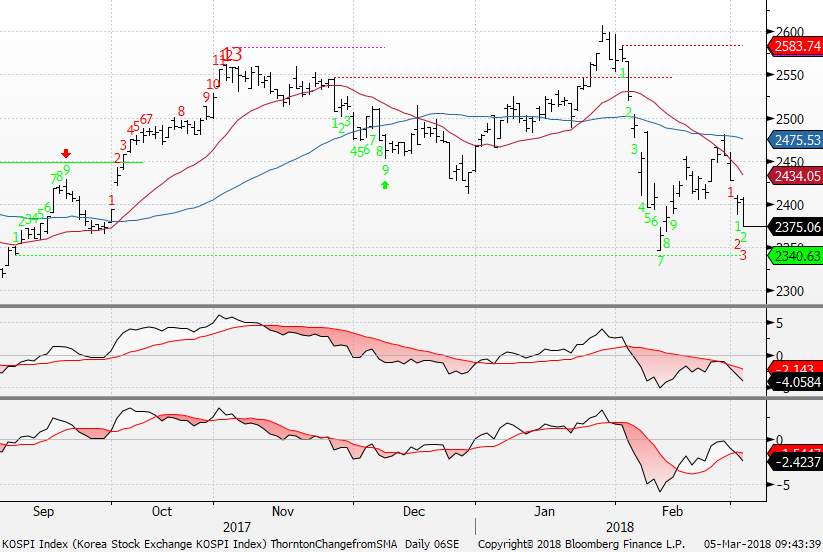
Korean Kospi is on day 3 of 13 with it's downside Countdown
|
|
|
|
|
|
|
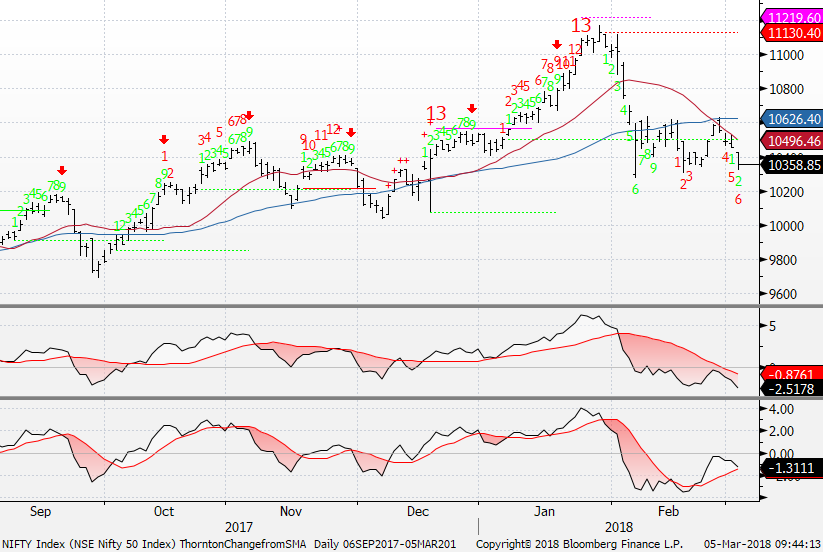
India Nifty 50 Index is on day 6 of 13 with it's downside Countdown and at important support
|
|
|
|
|
|
|
Bloomberg World Index and Emerging Markets
|
|
|
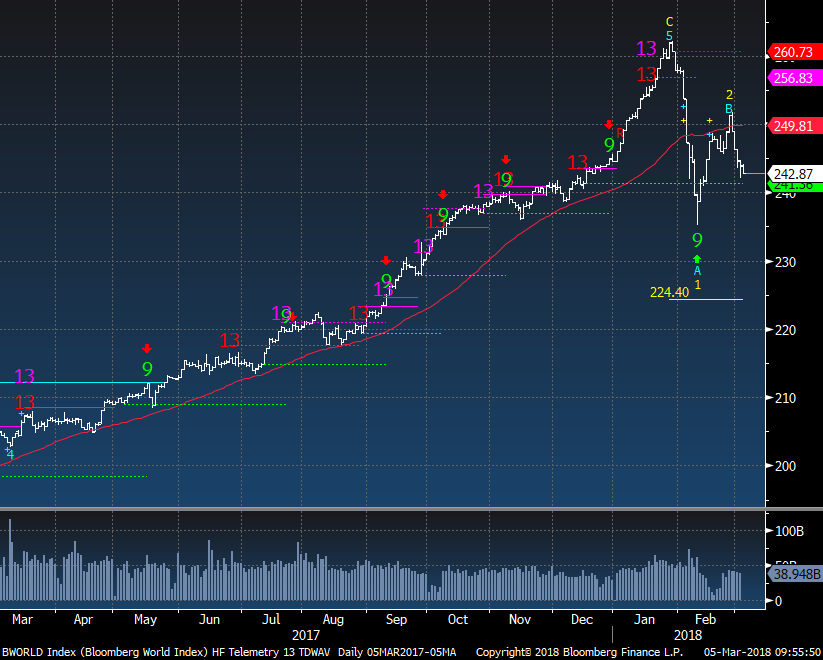
Bloomberg World Index still has daily wave pattern in place.
|
|
|
|
|
|
|
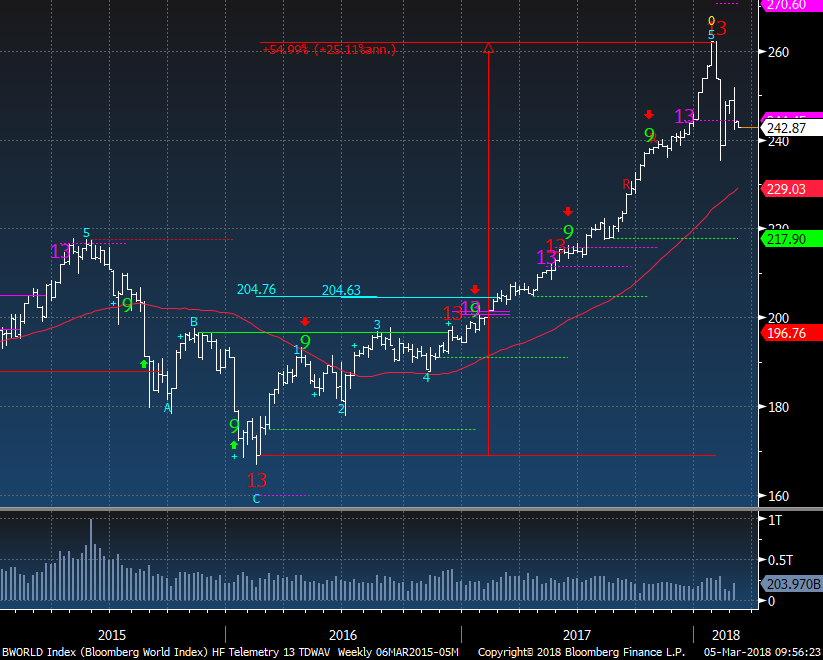
Bloomberg World on weekly time frame also looks vulnerable to further downside especially when the February lows break
|
|
|
|
|
|
|
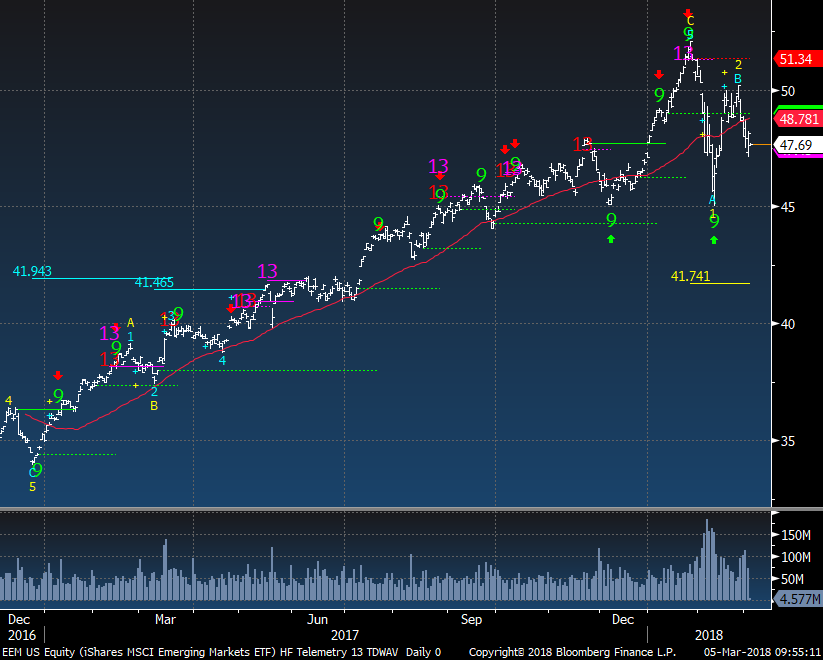
EEM still has the daily wave pattern in place.
|
|
|
|
|
|
|
|
|
|
|
|
|
| Bond bullish sentiment is at 25% and nearly equal with stocks.
|
|
|
|
|
|
|
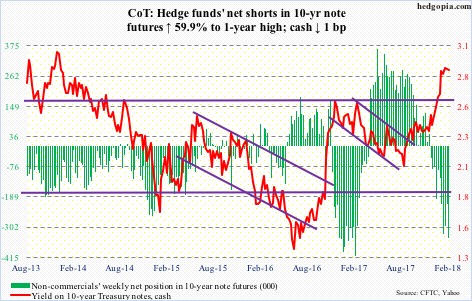
Bond positioning in the 10 year increased more bearish bets last week.
|
|
|
|
|
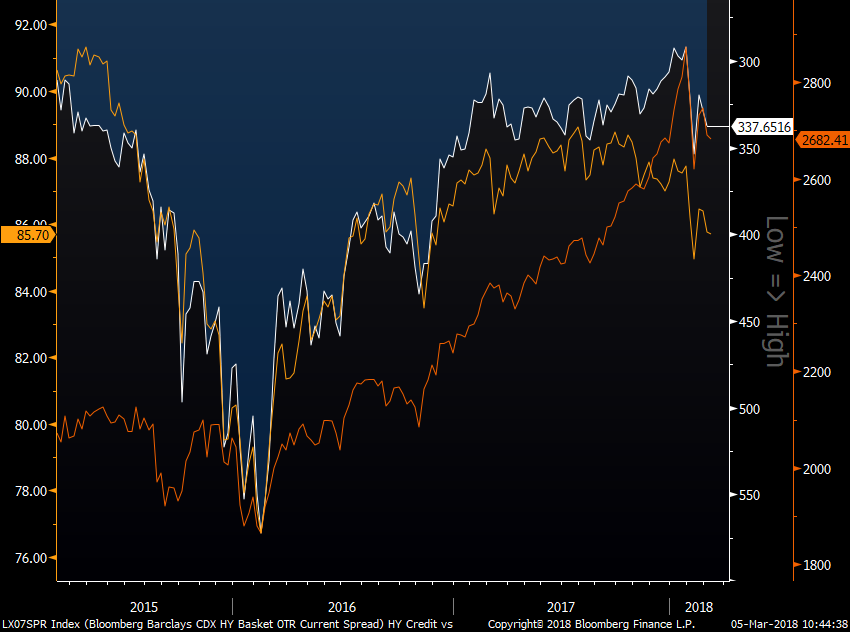
This chart has the SPX, Barclays High Yield CDX basket (inverted) and High Yield ETF HYG. What is important here is the High Yield ETF and HY CDX basket were correlated until Q4 2017 and HYG has dropped while the HY CDX hasn't caught up. White line is HY CDX, Light Orange is HYG, Darker orange is SPX
|
|
|
|
|
|
|
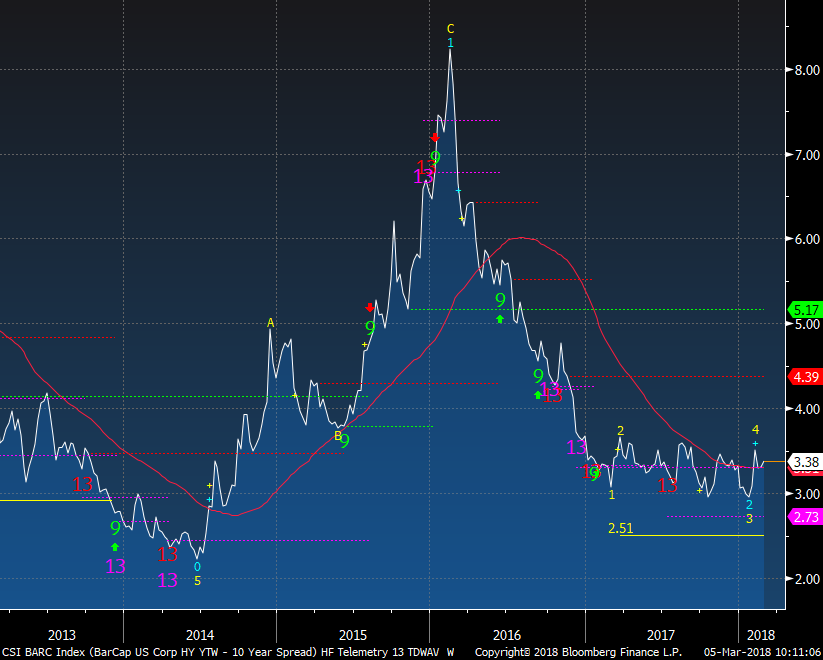
Barclays High Yield / 10 year spread could widen quite fast (higher)
|
|
|
|
|
|
|
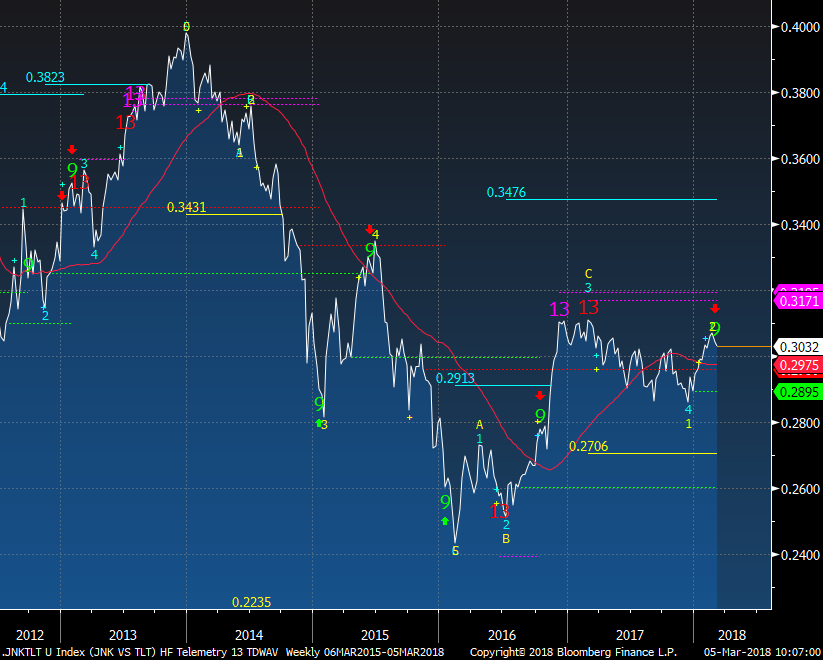
JNK vs TLT weekly chart has been referenced from some as positive for risk appetite yet this ratio is deceiving since both JNK and TLT have been going down together. Other periods when this ratio dropped saw a move into TLT and out of JNK.
|
|
|
|
|
|
|
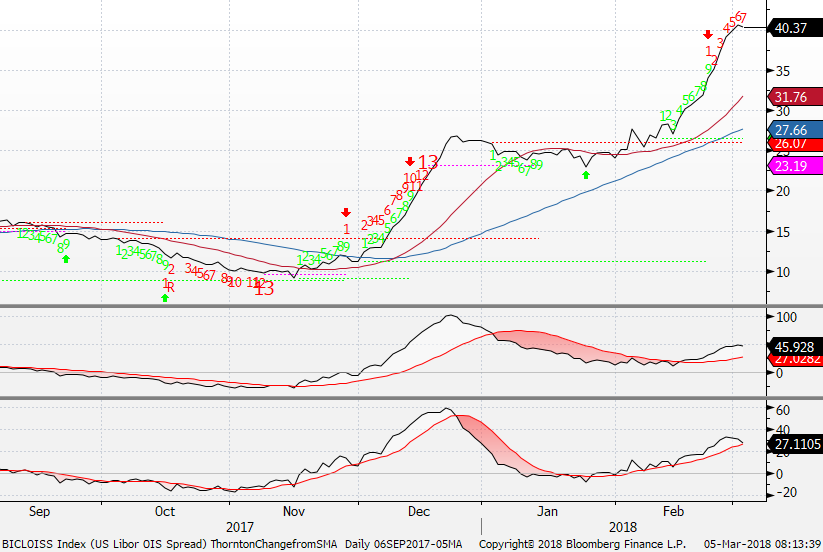
Libor OIS spread on a daily is blowing out which is quite concerning or should be for anyone who has a bullish thesis
|
|
|
|
|
|
|
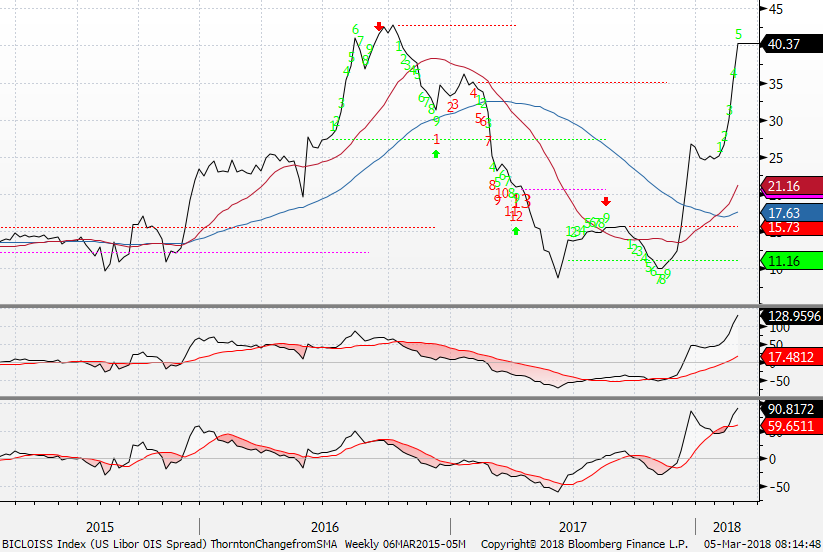
The weekly shows the move that has not let up
|
|
|
|
|
|
|
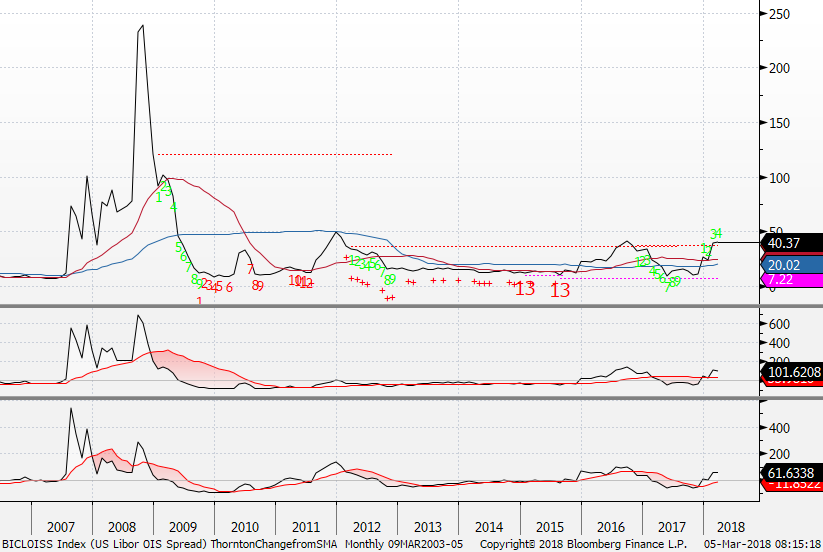
The monthly shows what it looks like when things get out of control
|
|
|
|
|
|
|
|
|
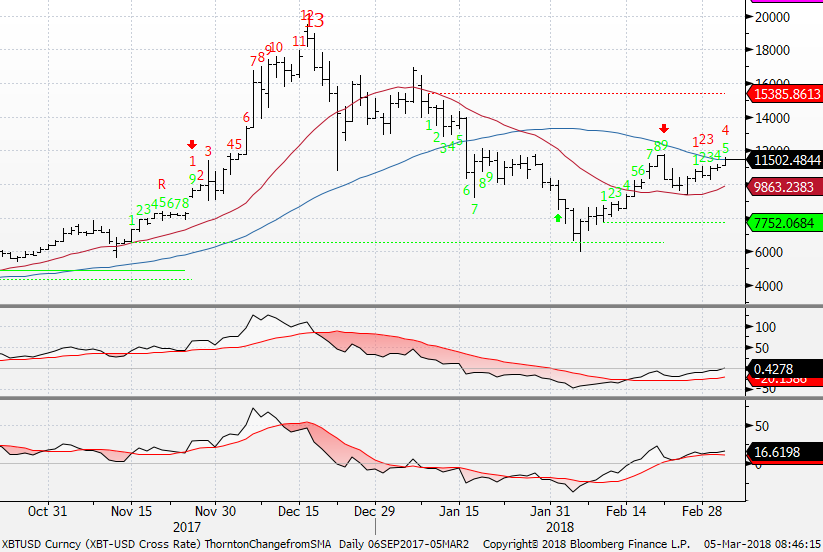
Bitcoin XBTUSD has moved above the 50 day and is on day 4 of 13 with an upside Countdown. After having the perfect upside exhaustion at the highs and holding the TDST green dotted line at 6500 this could lift to the red dotted line at 15,385. I'm more interested in watching the Countdown vs watching the TDST level by the way
|
|
|
|
|
|
|
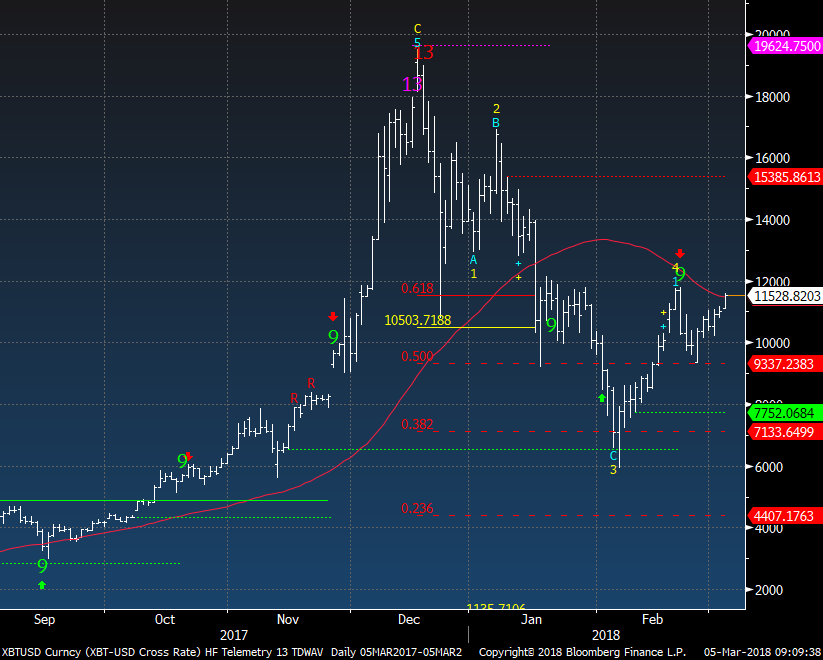
Same daily of XBTUSD without the Countdown but with the waves shows this with wave 5 downside potential still in play. The wave 4 would be null moving above the wave 2/B. Fibonacci levels on the downside worked well along the way at many levels.
|
|
|
|
|
|
|
DEMARK SCREENS - Daily, Weekly, Monthly Upside/Downside Exhaustion Signals
|
|
|
Daily/Weekly DeMark upside/downside exhaustion signals (Sequential) Weekly updated on Monday's. Price flips occur when a stock closes higher/lower than four previous closes.
S&P 1500 Universe:
DAILY UPSIDE 13: BH
DAILY DOWNSIDE 13: AIV, AVAV, CMS, DRE, EGP, EPR, RBCN, RDC, TTEC, WTR
DAILY UPSIDE WITH PRICE FLIP REVERSAL DOWN: MON
DAILY DOWNSIDE WITH PRICE FLIP REVERSAL UP: ADC, JJSF
Updated: 3/5/18
WEEKLY UPSIDE 13: AFG, APH, BBT, EL, HSC, ISRG, HW/A, MCO, MINI, MSFT, VRTU, WEX, ZBRA
WEEKLY DOWNSIDE 13: CRZO, HR, MSTR, RNR, SUP
Updated: 3/1/1
MONTHLY UPSIDE 13: BDX, BMY, CAT, COL, CW, EBIX, GNCMA, IRBT, MMSI, NFLX
MONTHLY DOWNSIDE 13: CHK, SVU, WIN
Euro Stoxx 600 Universe:
DAILY UPSIDE 13: SKY LN
DAILY DOWNSIDE 13: ACS SM, ENGI FP, IMB LN, ORNBV FH, TPK LN
DAILY UPSIDE WITH PRICE FLIP REVERSAL DOWN: DSY FP, SBRY LN, SOBI SS, STERV FH, TSCO LN, ULE LN
DAILY DOWNSIDE WITH PRICE FLIP REVERSAL UP: ESNT LN
Updated: 3/5/18
WEEKLY UPSIDE 13: BKT SM, LSE LN, RMS FP
WEEKLY DOWNSIDE 13: SNH GR, TCH FP
Updated: 3/1/18
MONTHLY UPSIDE 13: ASML NA, ENX FP, FI/N SW, INVP LN, SAB SM, SCR FP, US IM
MONTHLY DOWNSIDE 13: NONE
|
|
|
Unsubscribe me from Hedge Fund Telemetry
Hedge Fund Telemetry LLC, P.O. Box 4675, Greenwich, CT 06861, United States
CONFIDENTIALITY NOTE and DISCLAIMER: This message is for the named person's use only. It may contain confidential, proprietary or legally privileged material. No confidentiality or privilege is waived by any accidental or unintentional transmission. If you receive this message in error, please immediately delete it and all copies of it from your system, destroy any hard copies and notify the sender. You must not, directly or indirectly, use, disclose,
distribute, print or copy any part of this message if you are not the intended recipient. Hedge Fund Telemetry LLC. cannot guarantee the confidentiality of the material transmitted; therefore, information of a sensitive or confidential nature should not be transmitted. There is risk in trading markets. Hedge Fund Telemetry LLC reports are based on information gathered from various sources and believed to be reliable, but are not guaranteed as to accuracy and completeness. The information is subject to change without notice and Hedge Fund Telemetry LLC has no obligation to provide any updates or changes. Hedge Fund Telemetry LLC is providing this data for informational and educational purposes and does not believe that it is sufficient to base an investment decision on. This information should not be regarded as a solicitation or recommendation of any particular security or to engage in any trading strategy. One should always check with your licensed financial
advisor to determine suitability of any investments.
|
|
|
|
|