|
|
|
|
|
|
"Just Below" is just enough
|
|
|
Today's big news is Fed Chairman Powell's speech in NYC. The big takeaway is the comment that rates are "just below" the neutral range from his past "long way from neutral." This is about as good as it gets for market participants who were hopeful for some tempering in his hawkish tone as he's continued to say the economic outlook is solid and above pace. People now expect a couple more hikes to 2.75% from 2.25% and then the Fed is done hiking rates. What should be perhaps more concerning is that the Fed continues QT as they roll off more on the Fed's balance sheet. But today's action is all about a dovish Powell. I figured this could happen as was one of the reasons I
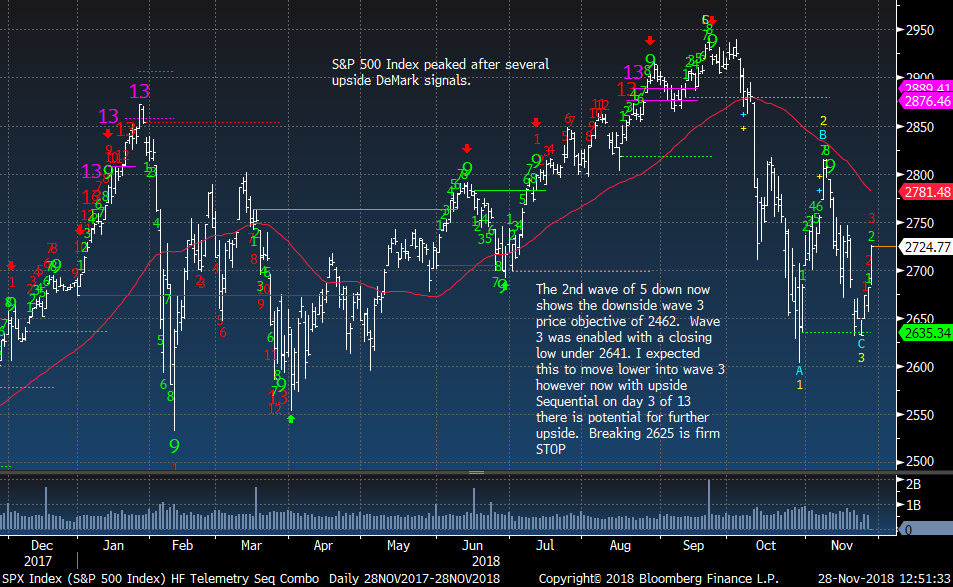
took down a lot short exposure and added some higher beta longs that were the likely to be go to names when people see green. Next big catalyst is this weekend's G20 meeting with President Trump and President Xi. I expect similar positive market comments to come from the meetings with a commitment to work together and Trump will likely back off of his recent comments where he said he was ready to add more tariffs. This cease fire will take the pressure off and the market can continue to bounce. If I am wrong, and the market drops all bets are off under S&P 2625. The underlying problem coming in the next few months is that economic growth is slowing and Q4 earnings will likely disappoint as earnings growth expectations still are too high. Keep an eye on the USD as sentiment has been extremely high and we now have upside DeMark exhaustion signals.
This isn't a time to get very bullish as THE low has not been set in my view as I continue to see the
market in a 5 wave downward sequence that will go into 2019. These bounces can be exploited but keep in mind risks remain as I have laid out in recent notes. Stay flexible and tight with stops.
|
|
|
|
|
This will be posted on the site soon.
|
|
|
|
|
|
|
|
|
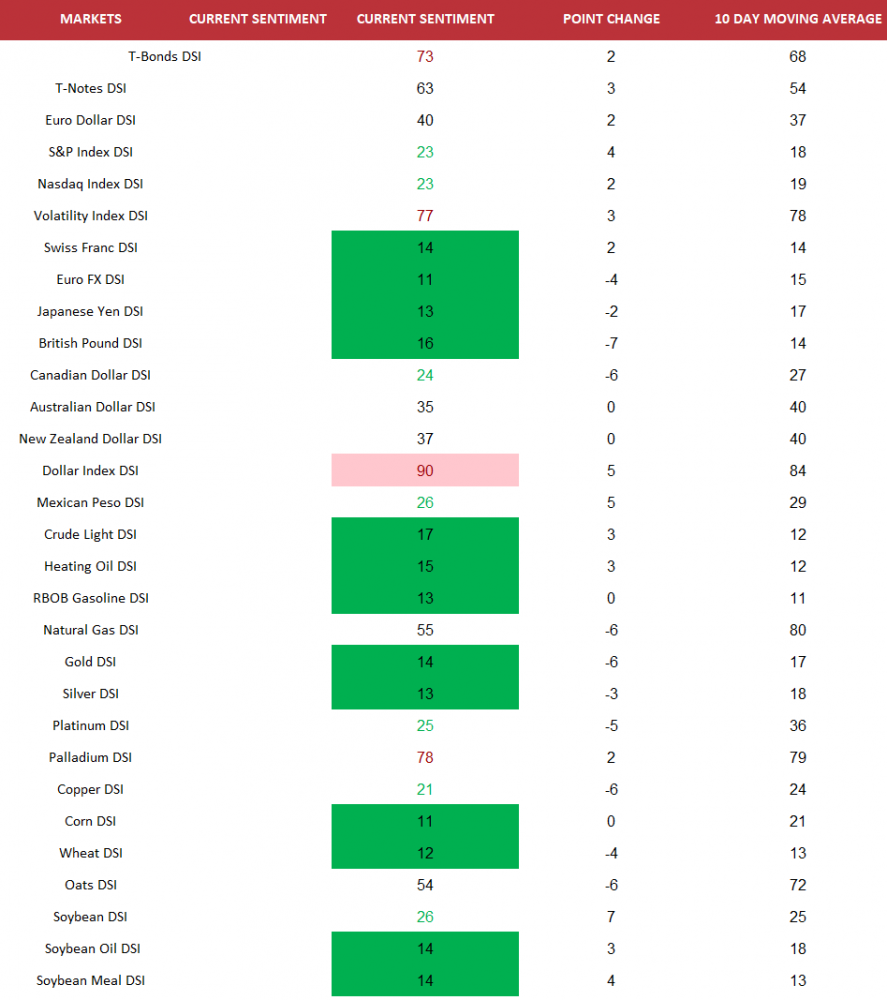
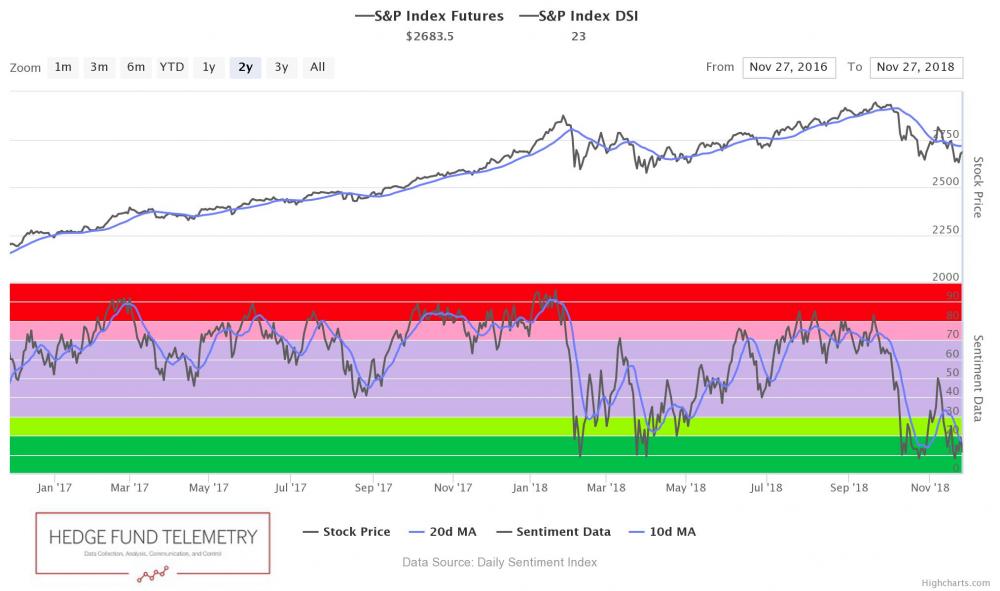
SPX bullish sentiment is at 23% and increasing
|
|
|
|
|
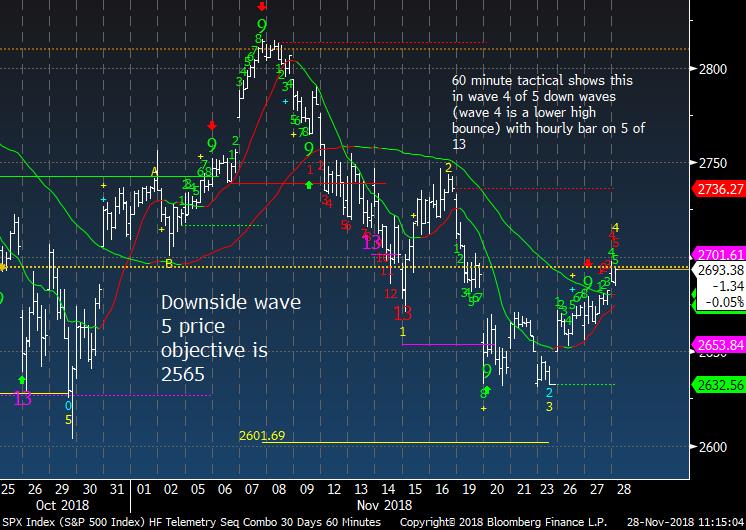
SPX daily potential for more upside
|
|
|
|
|
SPX 60 minute tactical time frame will change the wave sequence over 2750
|
|
|
|
|
Nasdaq bullish sentiment is at 23%
|
|
|
|
|
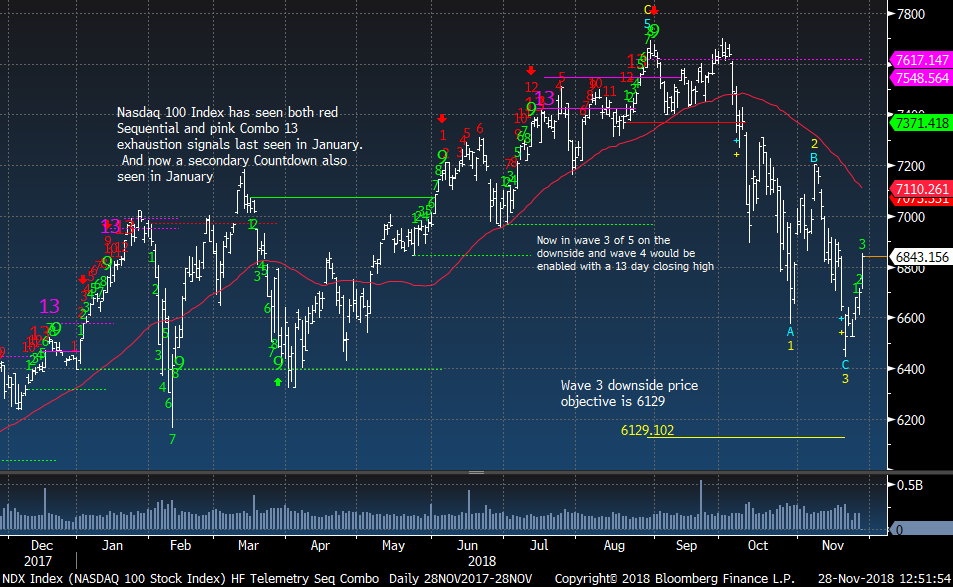
NDX Index expect a lower high bounce
|
|
|
|
|
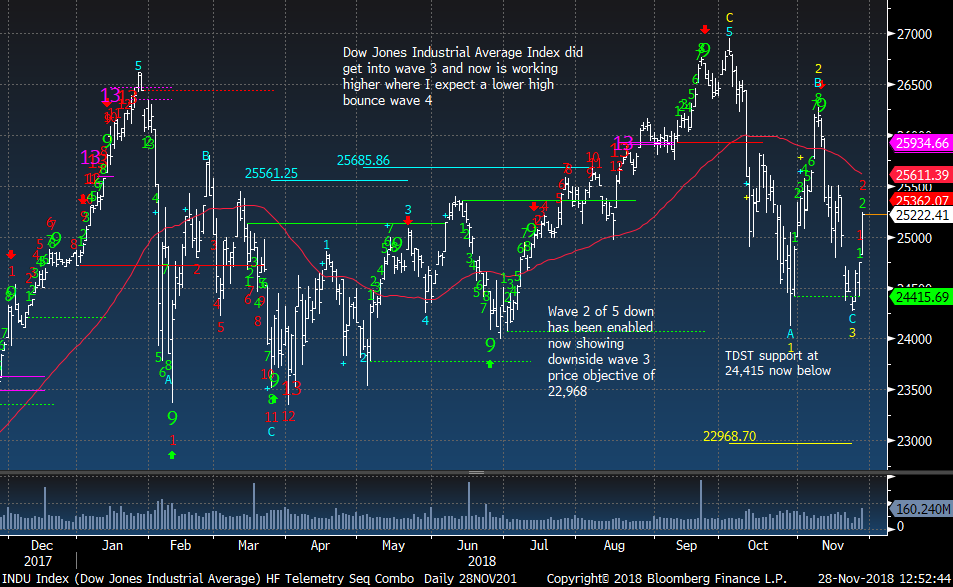
Dow Jones Industrial Average also has upside Countdown
|
|
|
|
|
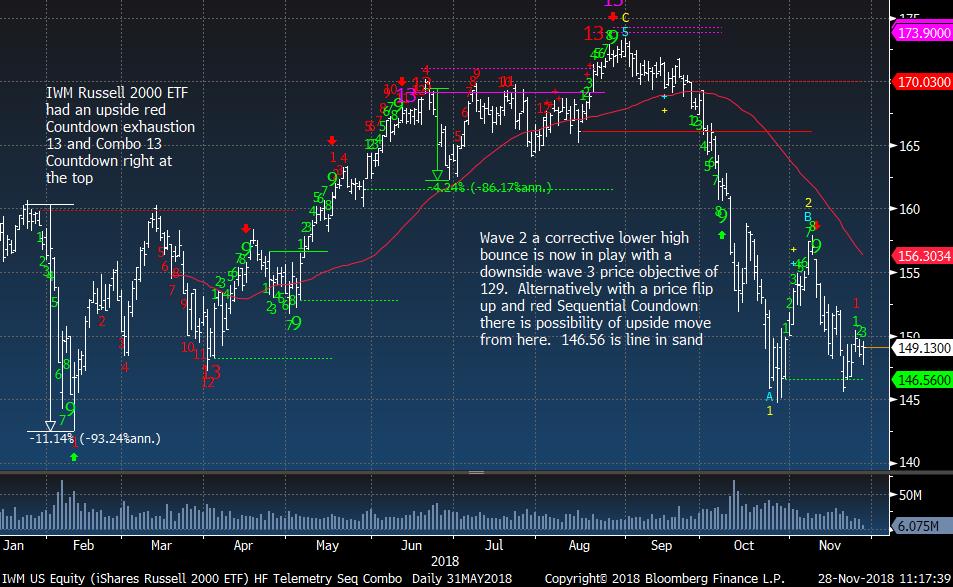
IWM Russell 2000 bouncing but 146.56 is line in sand
|
|
|
|
|
|
|
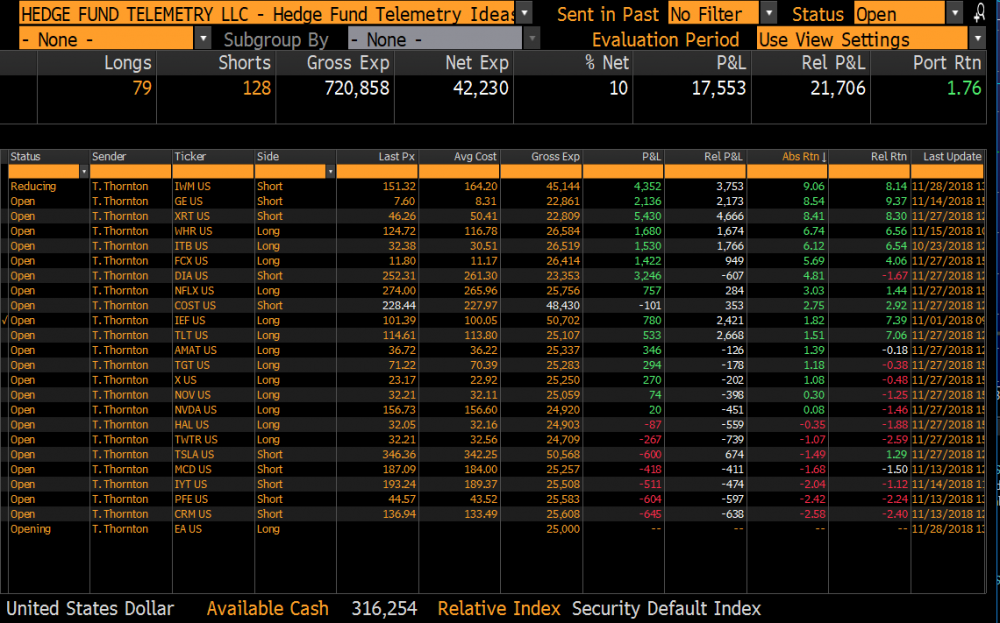
Hedge Fund Telemetry Trade Ideas
|
|
|
Trade Ideas Sheet - REMOVED SHORTS: AMD -5% (STOPPED ON EARLY WEAKNESS) MSFT -2.4%, BRK/B +1.5%, XLF -1%, QQQ +2.5%, SPY +1.5%, REDUCED SHORT IWM to 2.5% +9%
ADDED NEW LONG EA 2.5% ALL HAVE STOPS BETWEEN 5-10% FROM INCEPTION
|
|
|
|
|
|
|
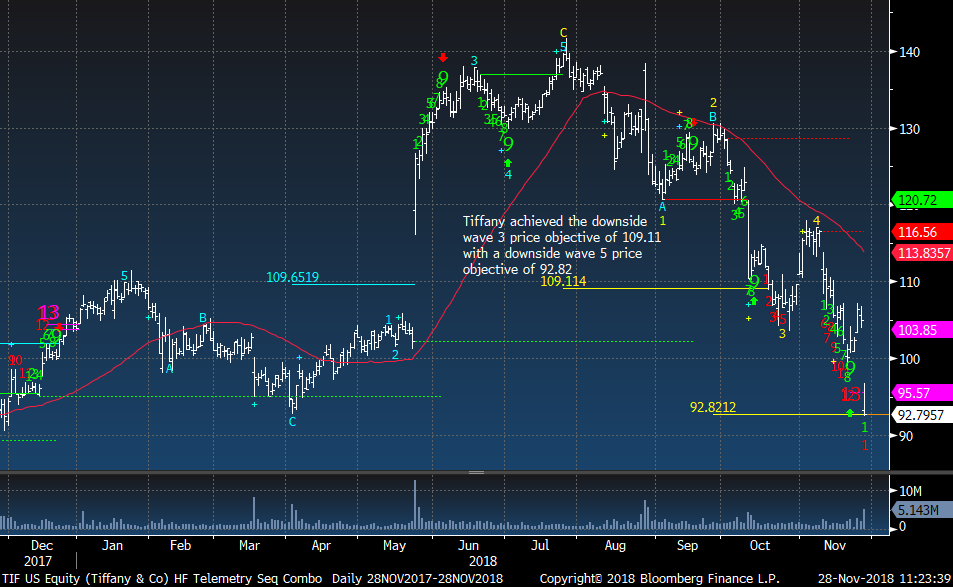
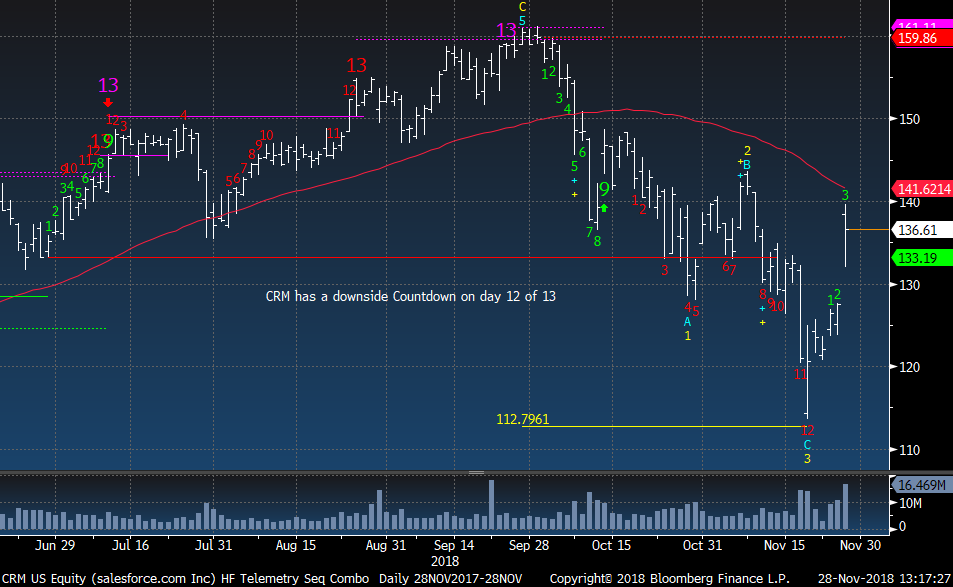
Tiffany and Salesforce - Sh_t happens
|
|
|
TIF was a recent short which I covered making 3.78% with the downside 13 knowing there was a downside price objective lower. I made the judgement call with the Countdown signal knowing the risk was still lower.
|
|
|
|
|
CRM didn't get the downside 13 as it only went to 12 of 13 but it nearly hit the downside wave 3 price objective. I made the call to hold through earnings but it delivered good bookings and the stock that I had a profit in is now down 2.5%. Going to hold a few more day as it is trading under the open.
|
|
|
|
|
|
|
|
|
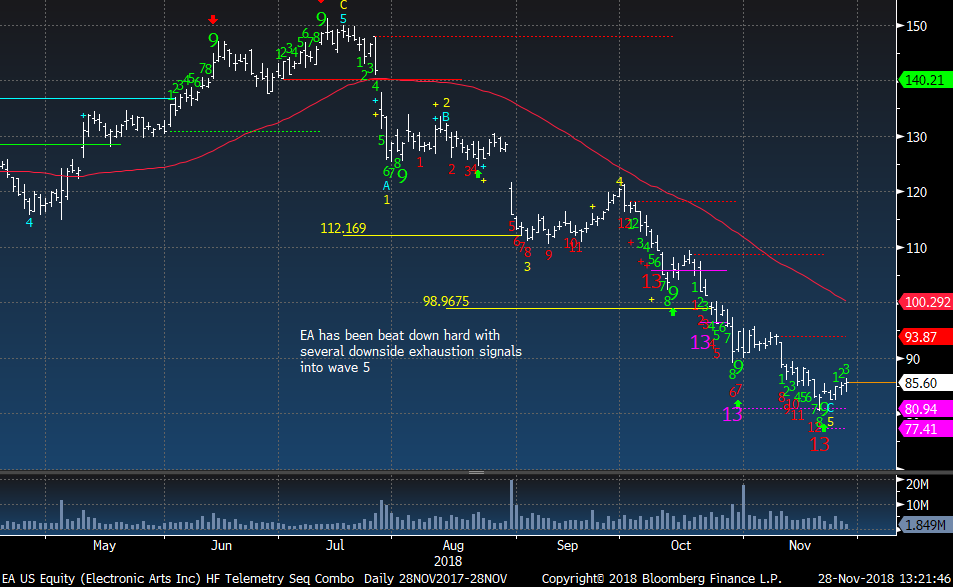
EA has been nearly cut in half. Adding a 2.5% sized position
|
|
|
|
|
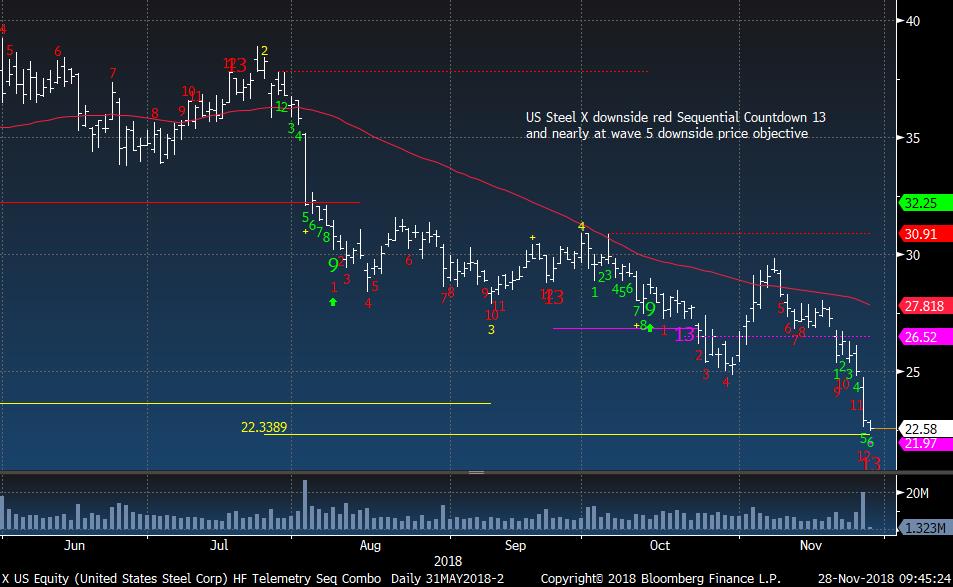
US Steel - has the downside Countdown 13 today. I added it yesterday
|
|
|
|
|
|
|
|
|
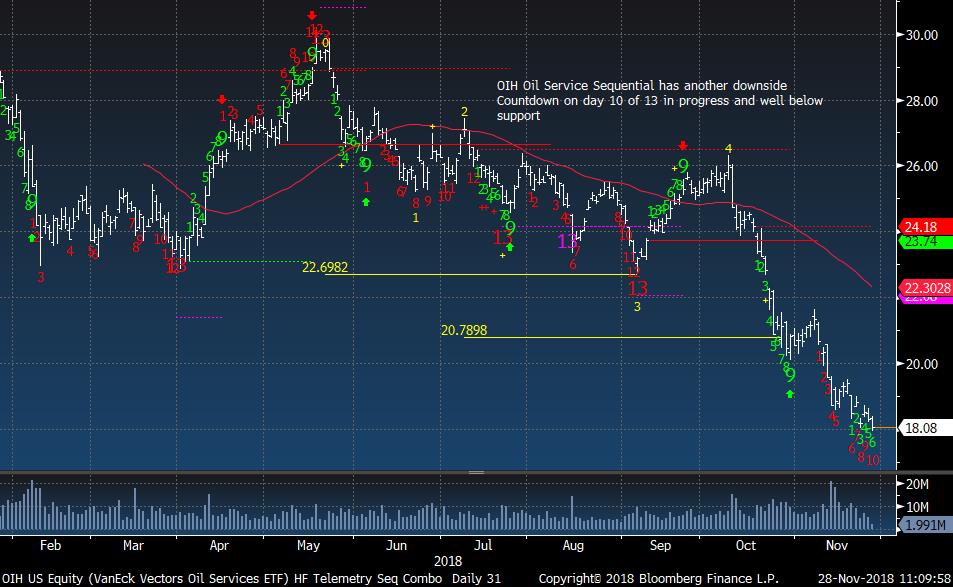
Energy ETF's OIH (below) and XOP still have downside Countdowns while XLE did get the downside Countdown 13 exhaustion.
|
|
|
|
|
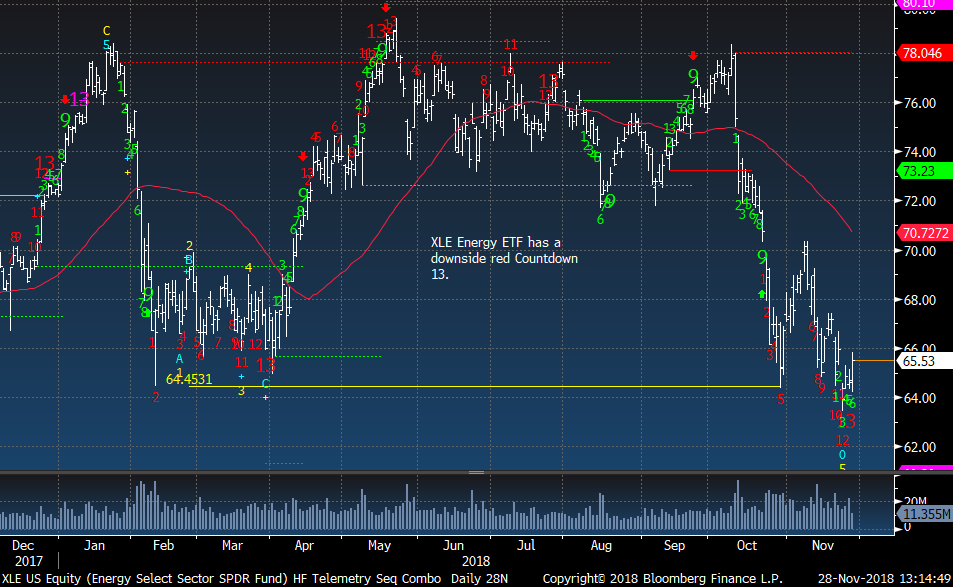
XLE tends to trigger ahead of OIH and XOP and it did get a downside Countdown 13. That is why I went long a few energy stocks that also had downside exhaustion signals
|
|
|
|
|
|
|
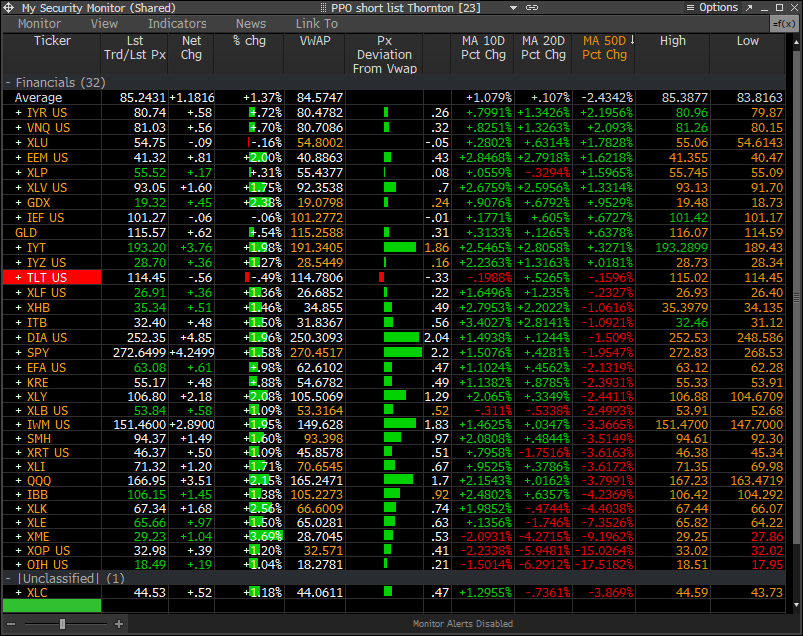
PPO Monitor - Percentage Price Oscillator
|
|
|
The PPO Monitor is a proprietary monitor developed to force rank Indexes, Sectors, and Stocks. It ranks top down by strongest to weakest by percentage above/below the 50 day moving average. Shorter term signals can be seen when the 10 and 20 day moving averages turn up (green) or down (red) which often are followed by the 50 day moving average. This is useful to watch for historically overbought/oversold percentage above/below the 50 day moving
average. It is non correlated with the DeMark Indicators however we have found upside/downside exhaustion signals often occur when something rises to the top or drifts to the bottom of the monitor - increasing the timing aspect. We share this monitor with clients with Bloomberg Terminals. An added feature is that each market/ETF can be expanded with each component force ranked in the same way. A couple other features include price deviation from intraday VWAP (useful for intraday reversals) and new 20 day highs/lows on right side. Please inquire if you would like to be permissioned to use the PPO Monitor.
Today's highlights: seeing a lot of ETF's now over the 10 day and 20 day moving average. Bounce potential is there
|
|
|
|
|
|
|
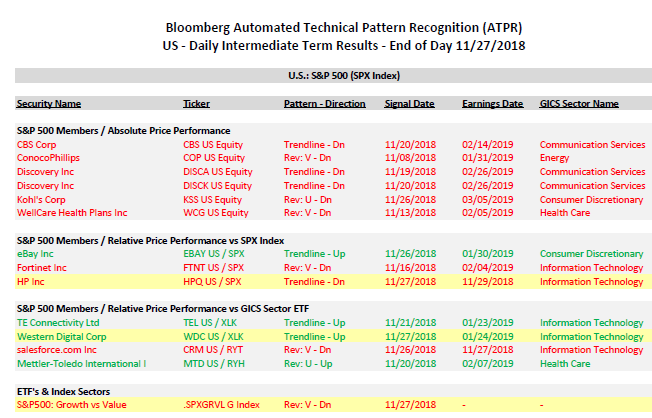
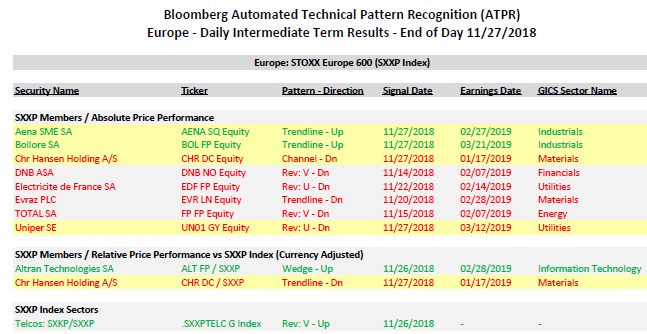
Bloomberg Automated Technical Pattern Recognition Screens
|
|
|
S&P 500 Members/Absolute Price Performance and Relative Price Performance vs S&P 500 and Sector ETF's. ETF's vs Index Sectors. Pair Trades. Long side is first symbol, short side is second symbol. If you would like a PDF from Bloomberg with full details of how this is formulated, please email. We will be doing a webinar in the coming weeks specifically on this system.
|
|
|
|
|
|
|
|
|
|
|
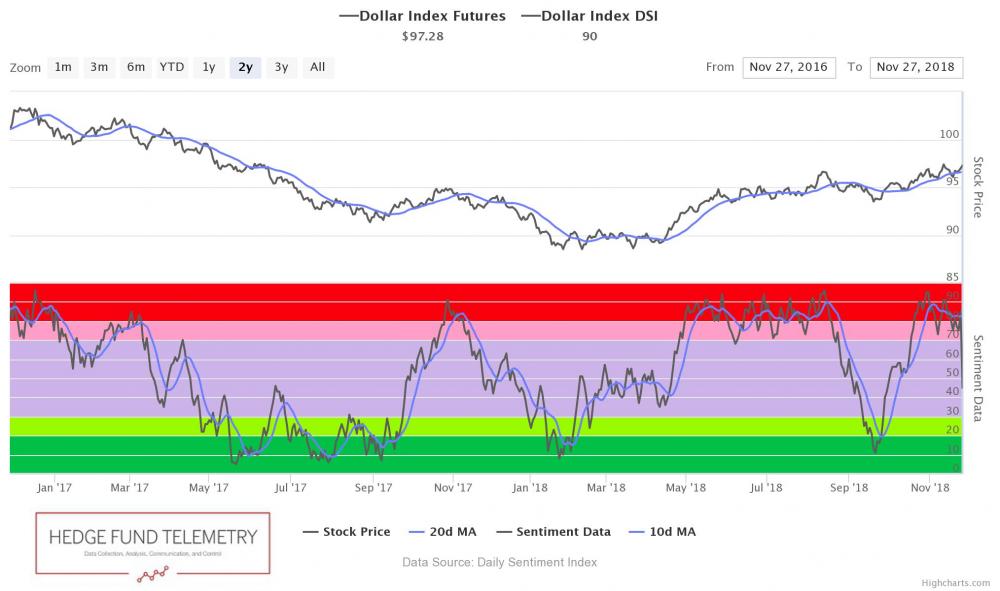
US Dollar bullish sentiment is at 90% and this is extreme
|
|
|
|
|
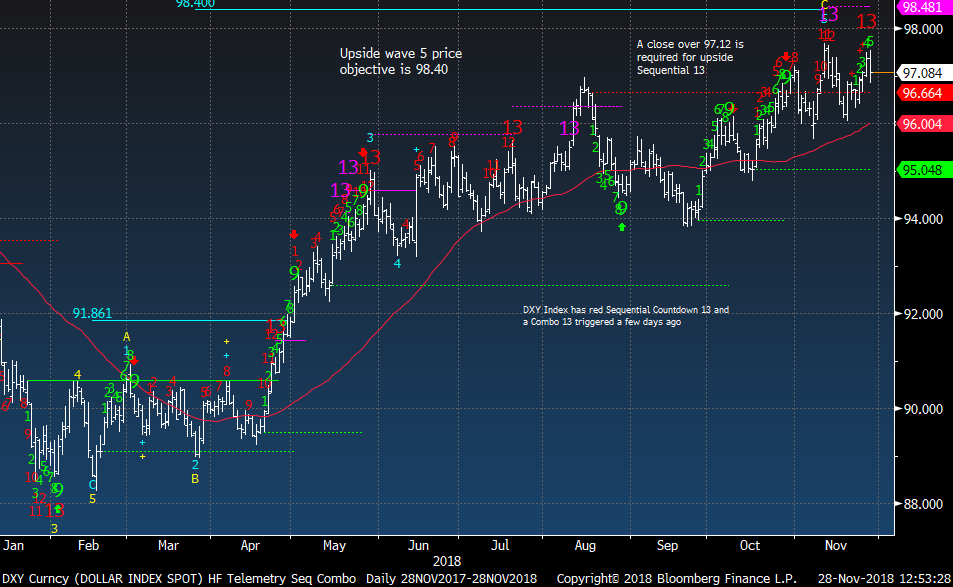
US Dollar Index with important upside exhaustion Countdown 13
|
|
|
|
|
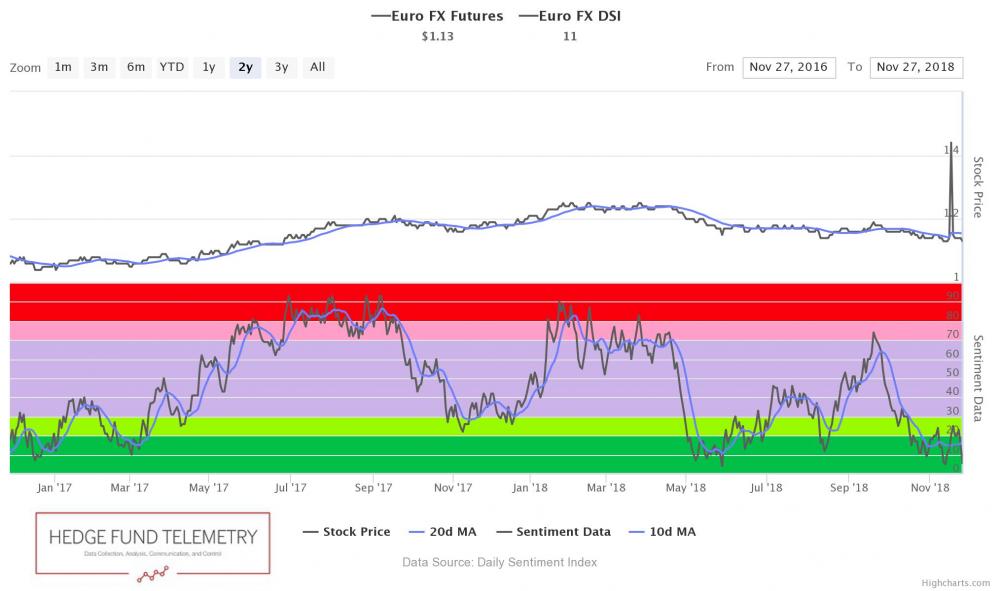
Euro bullish sentiment is at 11%
|
|
|
|
|
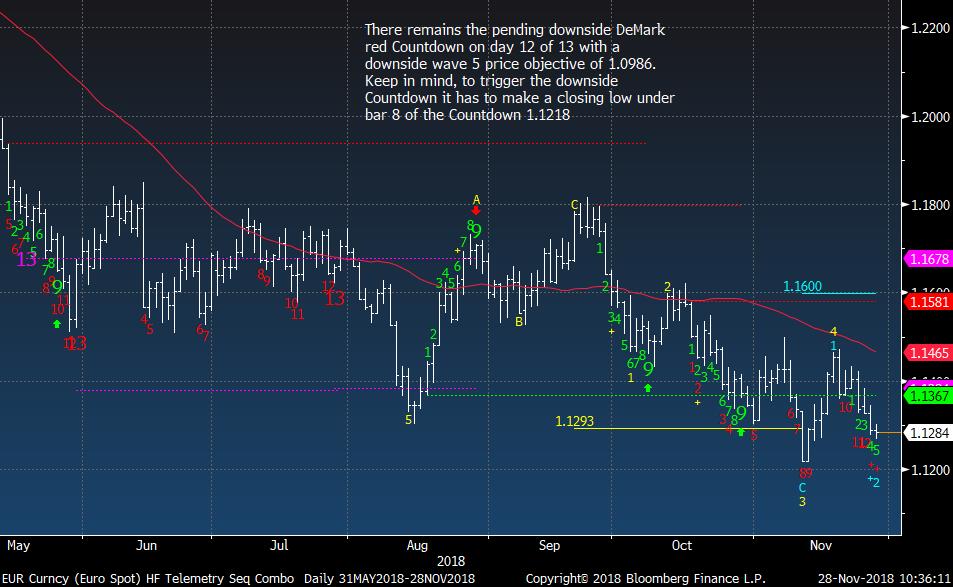
Euro Spot still needs a little lower to get the Countdown 13
|
|
|
|
|
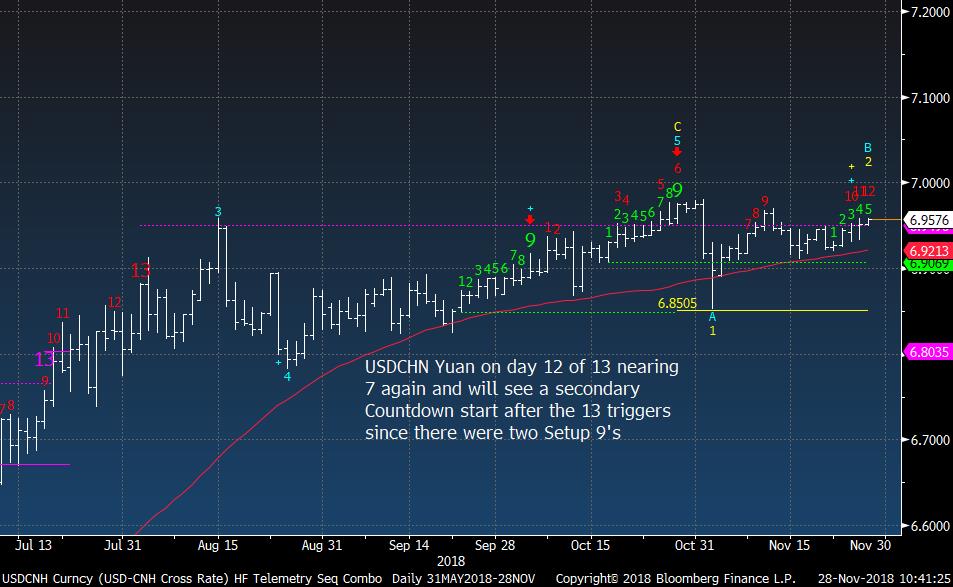
Yuan nearing 7 but with it on day 12 of 13 it's unlikely it will break it
|
|
|
|
|
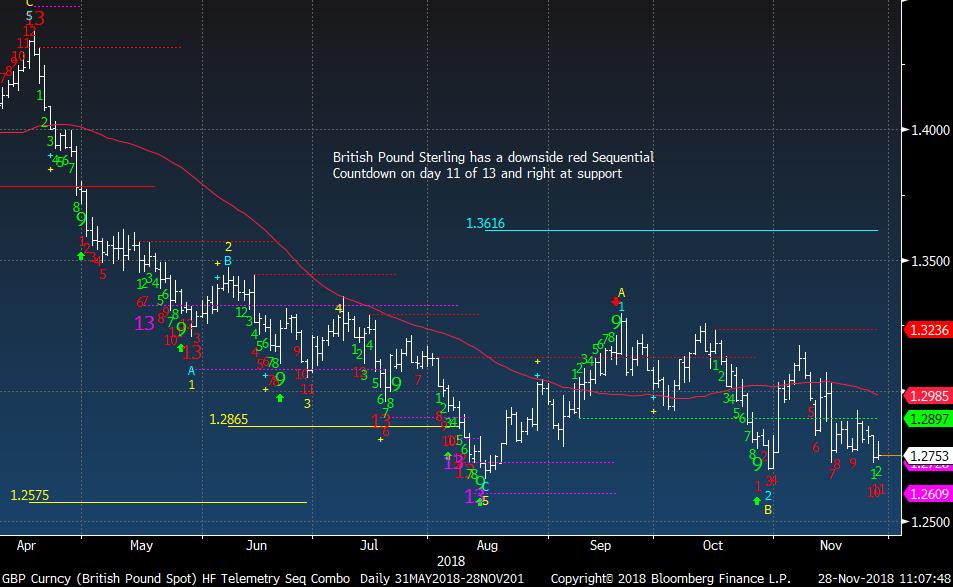
UK Pound Sterling needs a few more days lower to get the Countdown 13
|
|
|
|
|
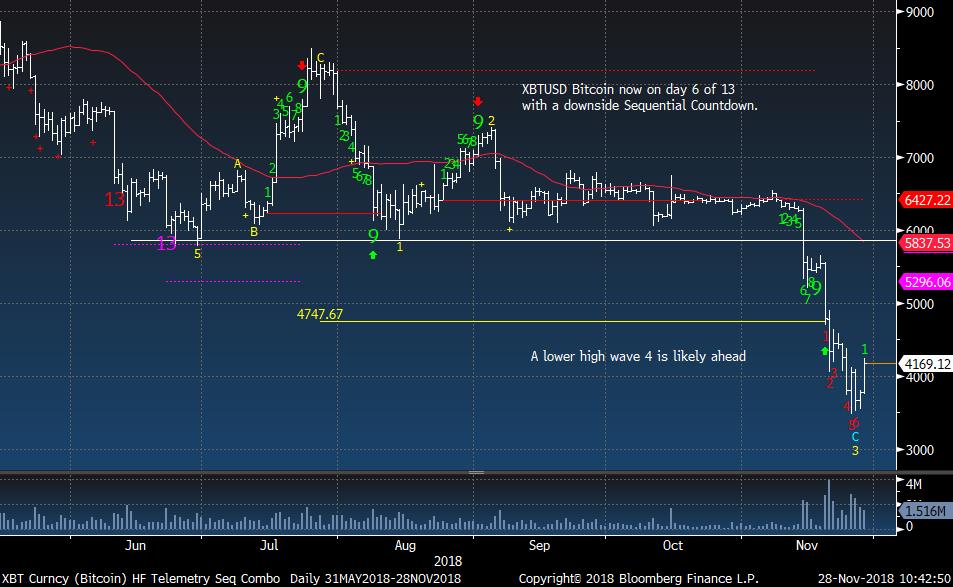
Bitcoin fans will be happy to see this bounce.
|
|
|
|
|
|
|
|
|
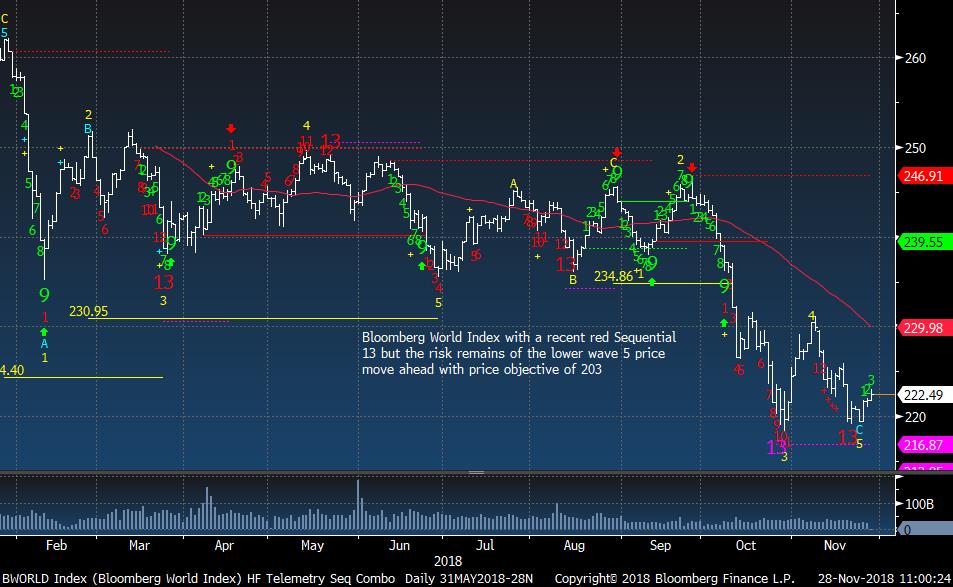
Bloomberg World Index trying to bottom and barely qualified the 5th wave (made a closing low under low close in wave 3)
|
|
|
|
|
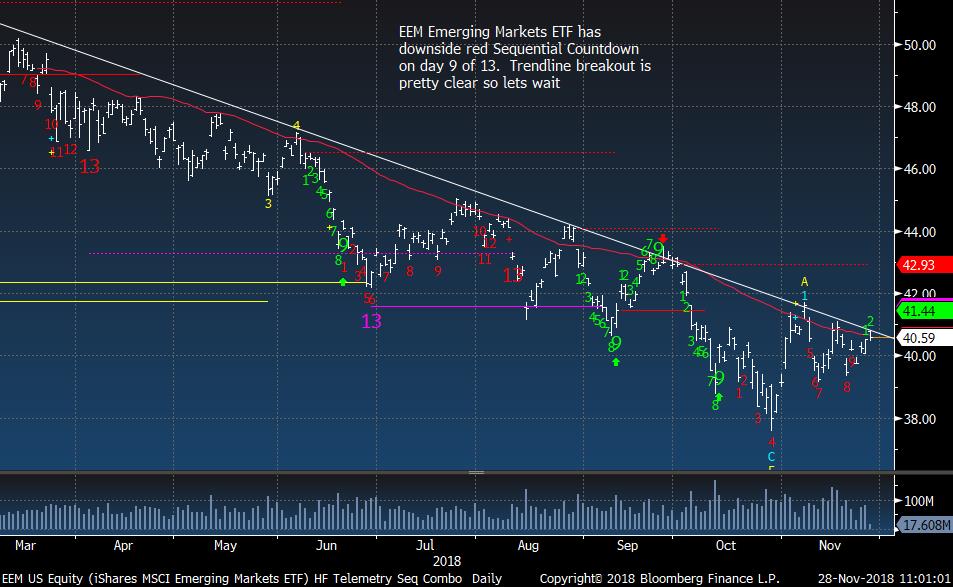
EEM Emerging Markets ETF still a little early to go long
|
|
|
|
|
|
|
|
|
|
|
|
|
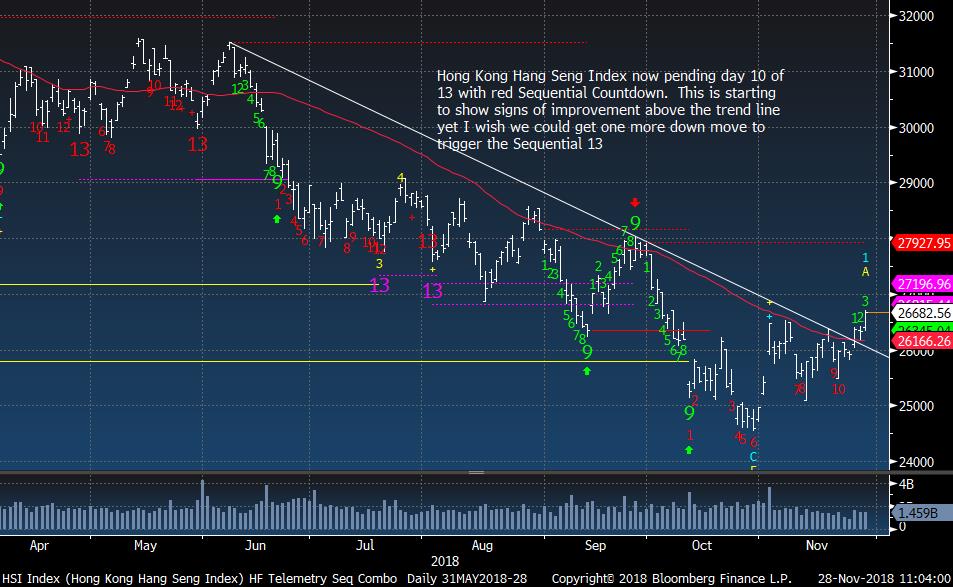
Hong Kong nearly a 2 month high
|
|
|
|
|
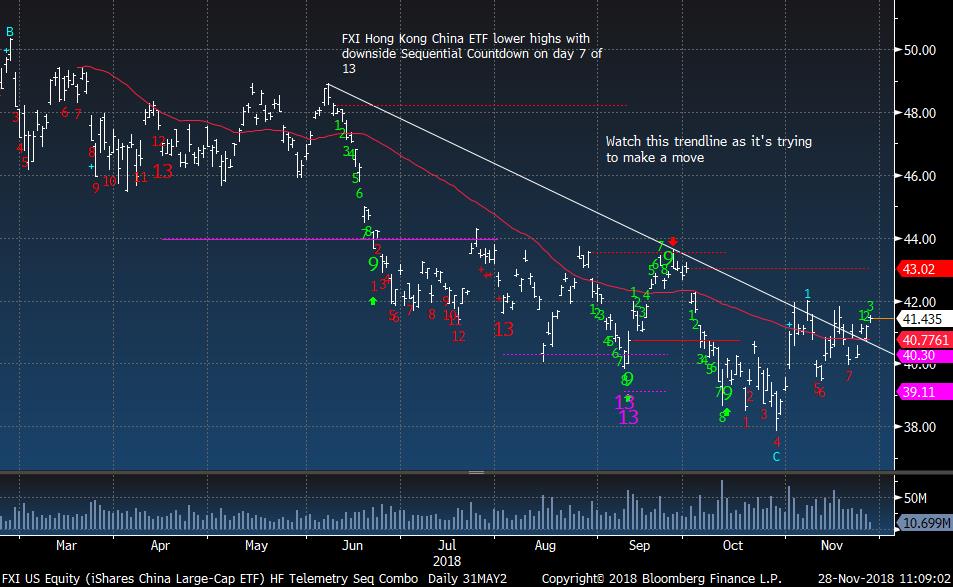
China / Hong Kong FXI ETF looking a little better
|
|
|
|
|
|
|
|
|
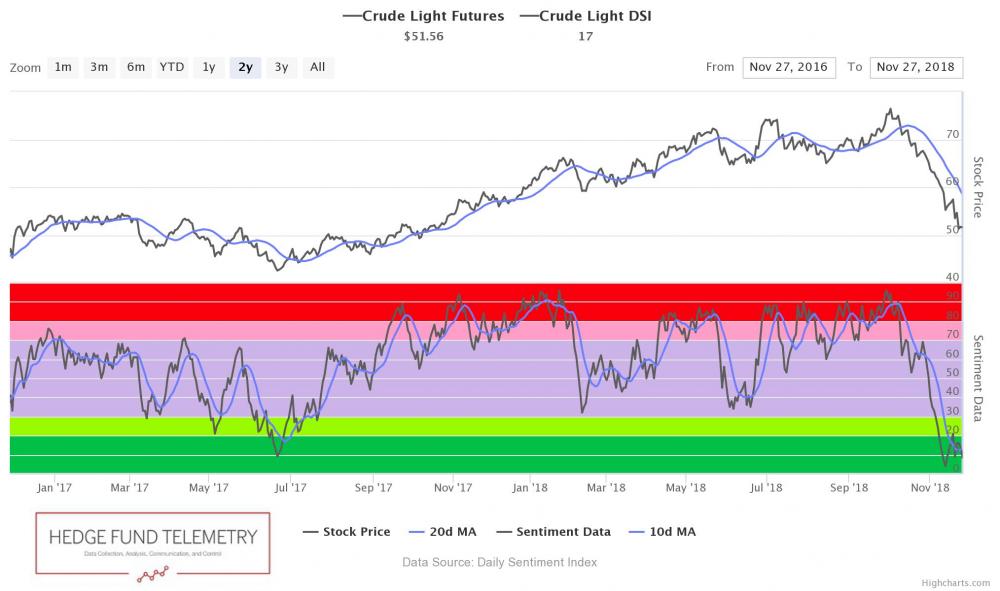
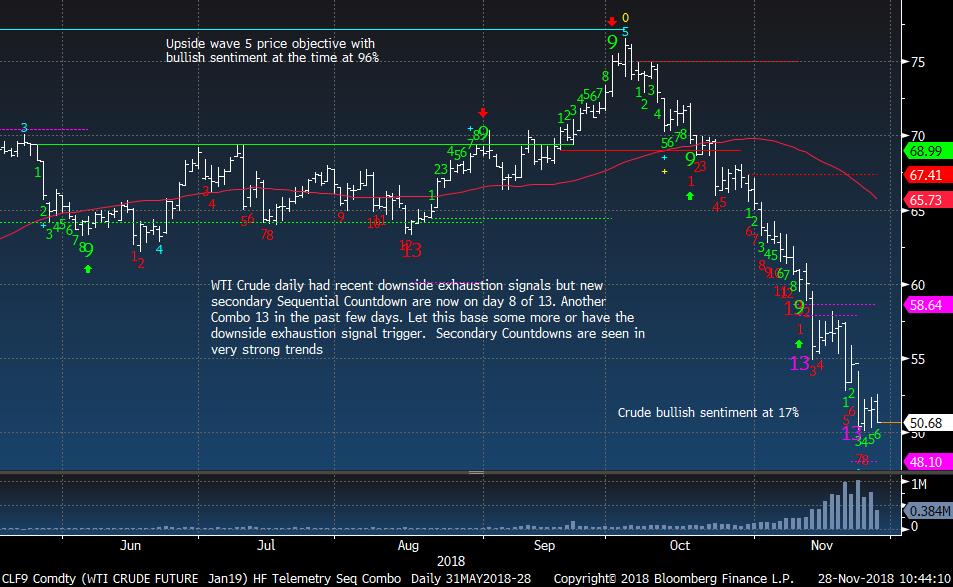
Crude bullish sentiment is at 17%
|
|
|
|
|
WTI Crude Futures still could work a little lower but a bounce could happen this weekend at the G20
|
|
|
|
|
|
|
|
|
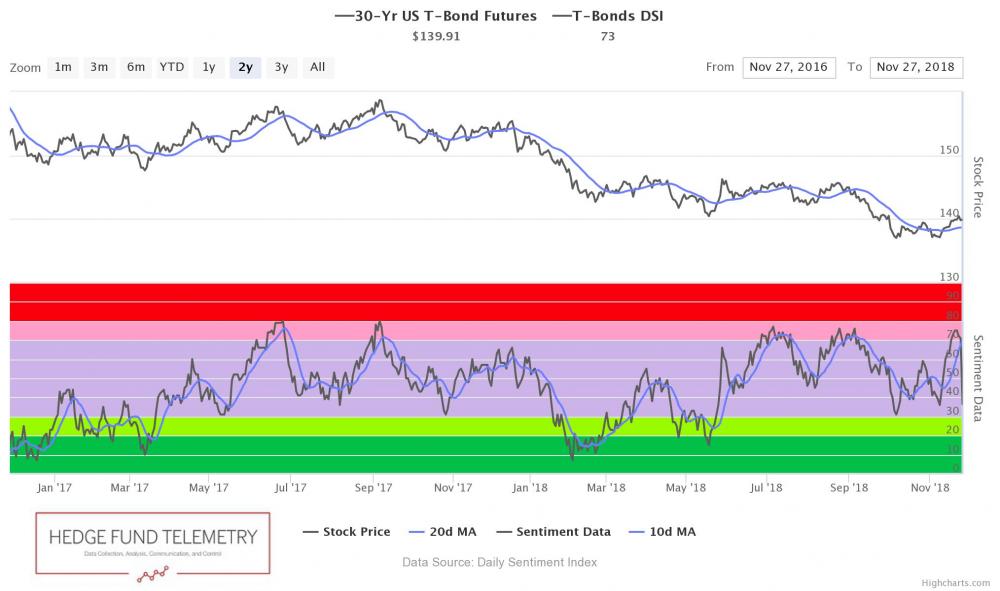
Bond bullish sentiment is at 73% and is elevated
|
|
|
|
|
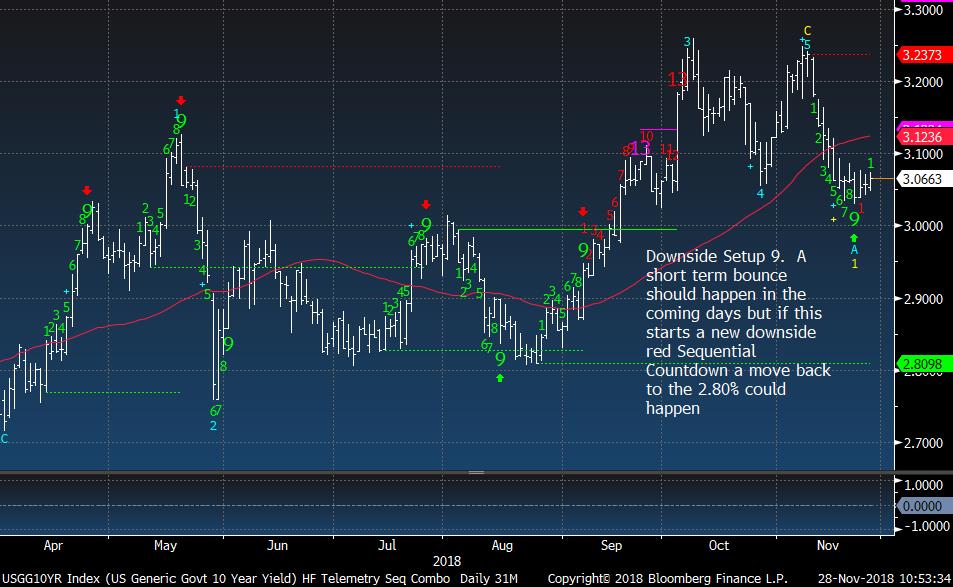
US 10 Year Yield holding these levels
|
|
|
|
|
|
|
|
|
|
|
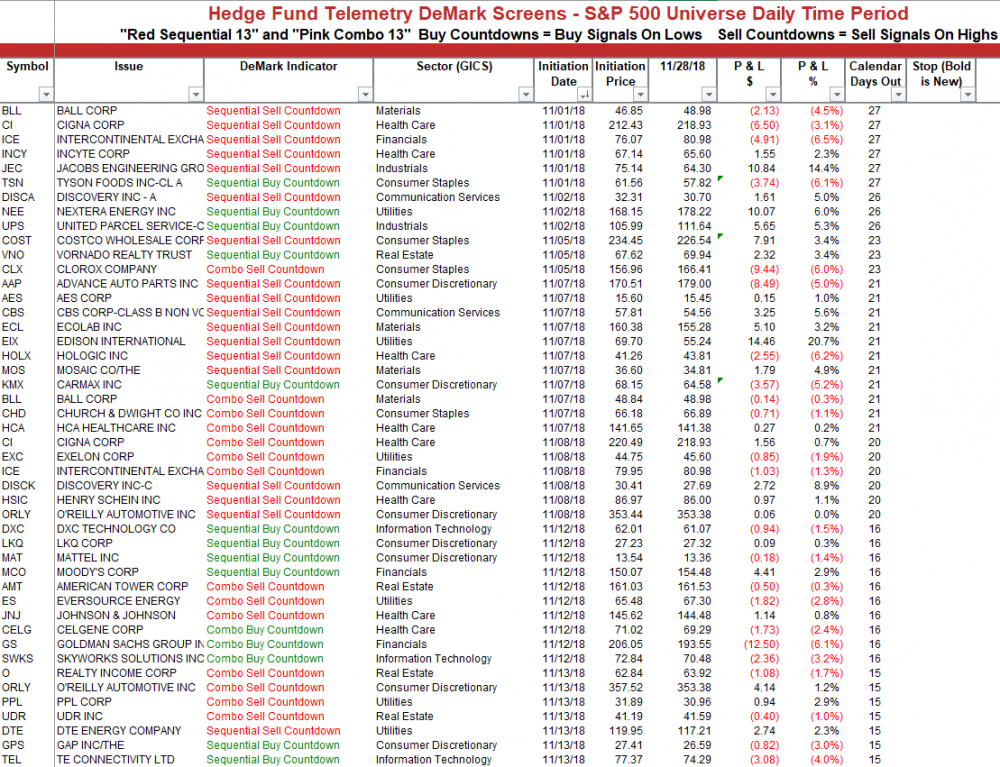
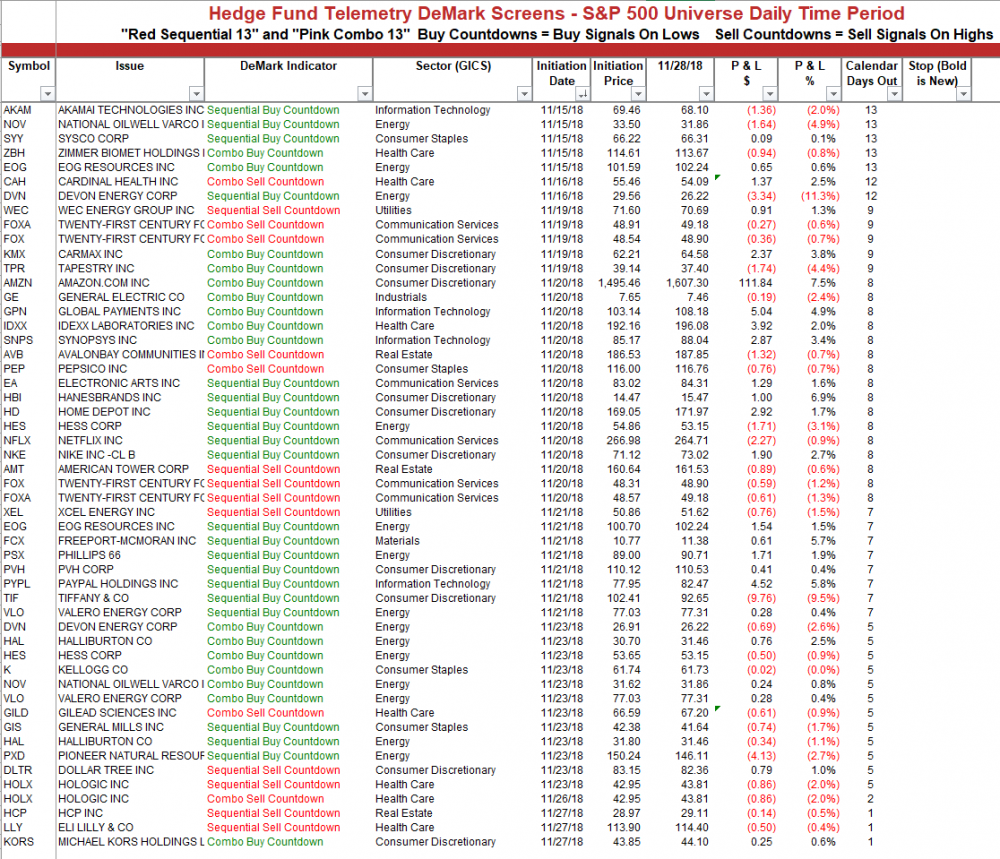
DEMARK SCREENS - Daily, Weekly, Monthly Upside/Downside Exhaustion Signals
|
|
|
Daily/Weekly DeMark upside/downside exhaustion signals (Sequential and Combo) updated daily for November
|
|
|
|
|
|
|
Unsubscribe me from Hedge Fund Telemetry
Hedge Fund Telemetry LLC, P.O. Box 4675, Greenwich, CT 06861, United States
CONFIDENTIALITY NOTE and DISCLAIMER: This message is for the named person's use only. It may contain confidential, proprietary or legally privileged material. No confidentiality or privilege is waived by any accidental or unintentional transmission. If you receive this message in error, please immediately delete it and all copies of it from your system, destroy any hard copies and notify the sender. You must not, directly or indirectly, use, disclose,
distribute, print or copy any part of this message if you are not the intended recipient. Hedge Fund Telemetry LLC. cannot guarantee the confidentiality of the material transmitted; therefore, information of a sensitive or confidential nature should not be transmitted. There is risk in trading markets. Hedge Fund Telemetry LLC reports are based on information gathered from various sources and believed to be reliable, but are not guaranteed as to accuracy and completeness. The information is subject to change without notice and Hedge Fund Telemetry LLC has no obligation to provide any updates or changes. Hedge Fund Telemetry LLC is providing this data for informational and educational purposes and does not believe that it is sufficient to base an investment decision on. This information should not be regarded as a solicitation or recommendation of any particular security or to engage in any trading strategy. One should always check with your licensed financial
advisor to determine suitability of any investments.
|
|
|
|
|