If you are having difficulty seeing this email, you can view in your browser or click here to
print.
|
|
|
|
|
04/25/2024
Thomas Thornton
|
|
|
|
|
"First rule of Fight Club is—you do not talk about Fight Club."
Over the past week, several recent market risks/geopolitical risks have intensified. Everyone of these risks involves some sort of fight so today's note is aptly titled Fight Club.
Although you're not supposed to talk about Fight Club, that's exactly what I'm going to do. The fight between the US China is now a "cold trade war" and has been the main catalyst of volatility recently. President Xi's remarks at Boas Forum have given a bit of relief to the bulls today the majority of what he said were reiterations of previous promises. The market is reacting as if what he said are stunning new developments. He did land a strong jab into Trump by saying "that cold-war thinking and zero-sum gaming are increasingly obsolete and that blind arrogance and paying attention only to one’s own community without thinking of others can only lead into a wall." Next, the ongoing Mueller investigation just put Trump into the corner turn buckle by having the FBI
raid his personal attorney's office. This is a big deal as Michael Cohen is the bag man who knows where all the bodies are buried (and how much was paid to all the strippers, hookers, and porn stars). Trump was very upset yesterday, even threatening to fire Mueller. If that happens, expect a rough day in the markets. Then Syria had been an ongoing regional civil war but with a recent chemical attack, the gloves came off between the US and Russia. Besides blaming Putin on Twitter for the attack, Trump threw an upper cut with more sanctions that really put the Russian Ruble and the Russian stock market (down 10% in two days) on the ground for the count. The follow up punch is a likely military response by Trump into Syria. So the bottom line is that these
fights are not close to being resolved and further escalation seems probable.
The recent late day sell off trend in the market reflects participants concerns with overnight headline risk. Traders have had a very quick trigger finger too. As of now the narrative I hear for those buying stocks is that earnings growth will be exceptionally high due to 1. Tax reform bill, and 2. Strong economy. Earnings growth for Q1 on January 1st was +12.2% and it's now at 18.4%. The two strongest sectors for earnings growth are Financials +24.4%, and Technology +23.4%. Considering how many of the retailers missed and guided down earnings starting in February and March, my thought is that these estimates are set way too high. Later this week we will start to get the big banks earnings and we will have a clear view of earnings growth.
Notable:
- US Markets - The choppy action hasn't lifted sentiment much
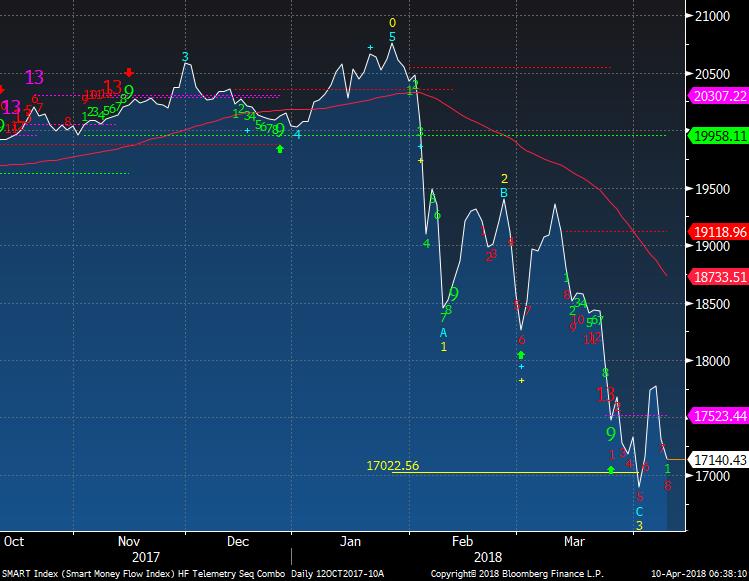
- Smart Money Flow Index - Late day selling has dominated since January
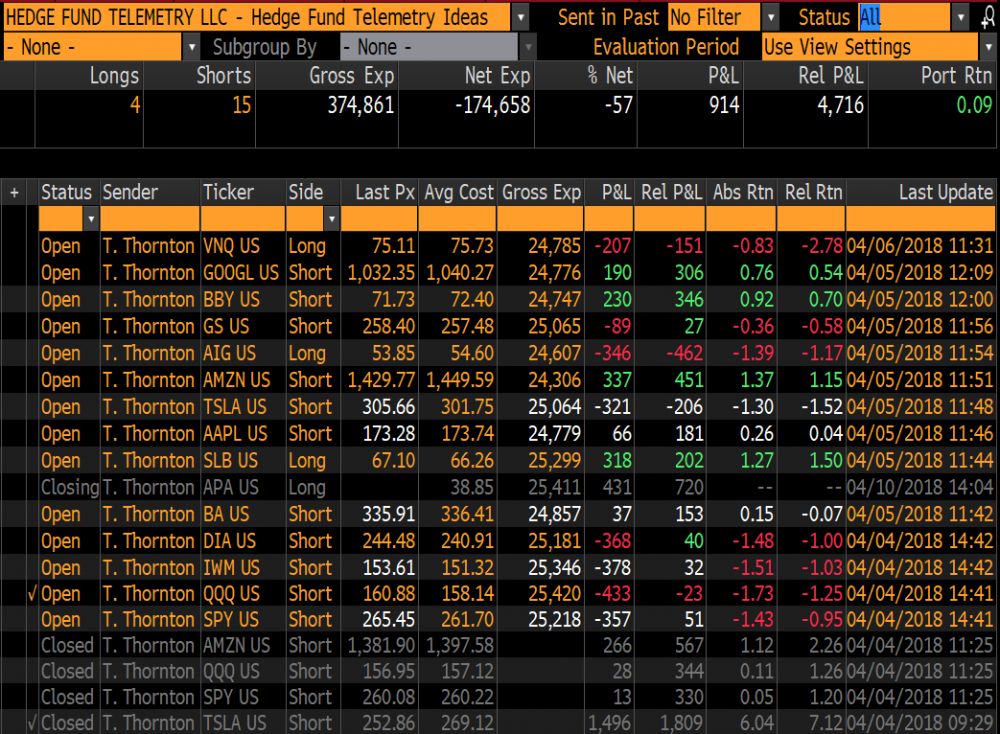
- Hedge Fund Telemetry Trade Ideas - One small change
- European Market - Some improving signs for the long side
- Currencies - USD tight range and Russian Ruble huge breakdown
- Asian Markets -
Shanghai and Nikkei could consolidate here
- Bond Update - Still very tight range
- DeMark Screens - Daily, Weekly, Monthly upside/downside exhaustion signals within the S&P 1500 and Euro Stoxx 600
|
|
|
|
|
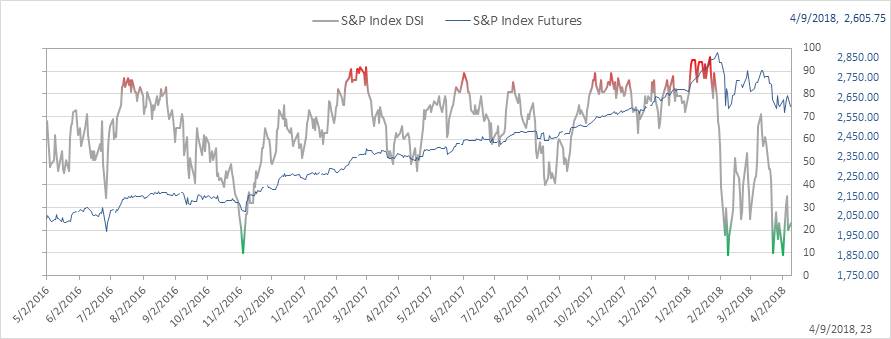
SPX bullish sentiment is at 23% up from 20% the previous day
Here's a link to the Hedge Fund Telemetry market sentiment page with 40 charts of sentiment including equities, bonds, commodities, and commodities updated each day.
|
|
|
|
|
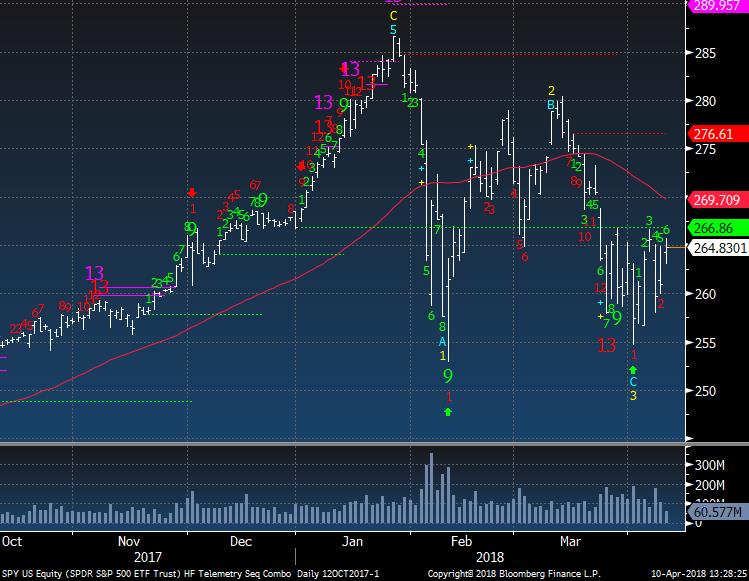
SPY recent action shows some good chop which beats up both bulls and bears. There is downside red Countdown on day 2 of 13 and an upside green Setup on day 6 of 9. It the Setup 9 completes (9 consecutive closes above 4 previous closes) then the red Countdown will be cancelled. Also if this moves above 265.64 the 4th of 5 waves will trigger with the next and final wave down price objective identified.
|
|
|
|
|
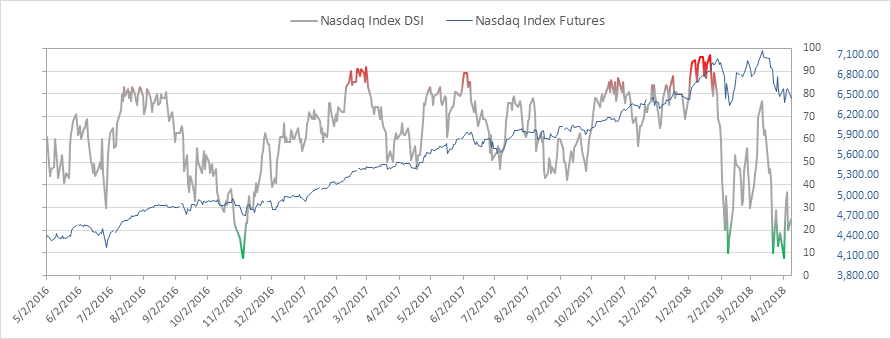
Nasdaq bullish sentiment is 25%
|
|
|
|
|
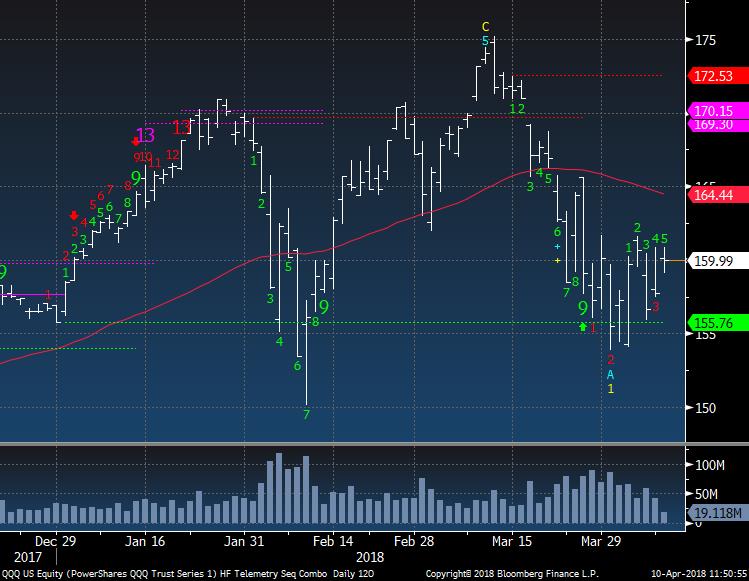
QQQ has a similar set up as SPY with the DeMark counts with both red Countdown and green Setup present. For those believing everything is just fine to the upside, they discount the amount of resistance from Q1 above.
|
|
|
|
|
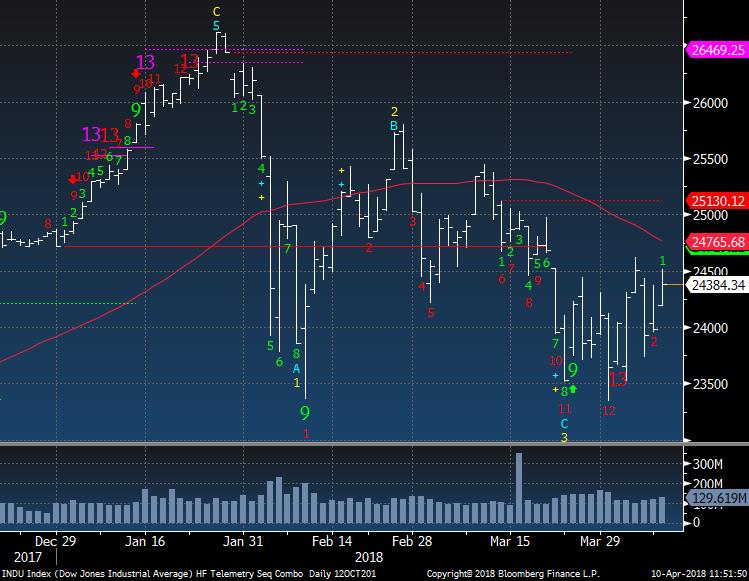
The Dow has a new downside secondary red Countdown on day 2 of 13.
|
|
|
|
|
|
|
|
|
This chart shows the dramatic late day sell offs seen since January highs. This is a comparison between the opening hour vs last hour.
|
|
|
|
|
|
|
Hedge Fund Telemetry Trade Ideas
|
|
|
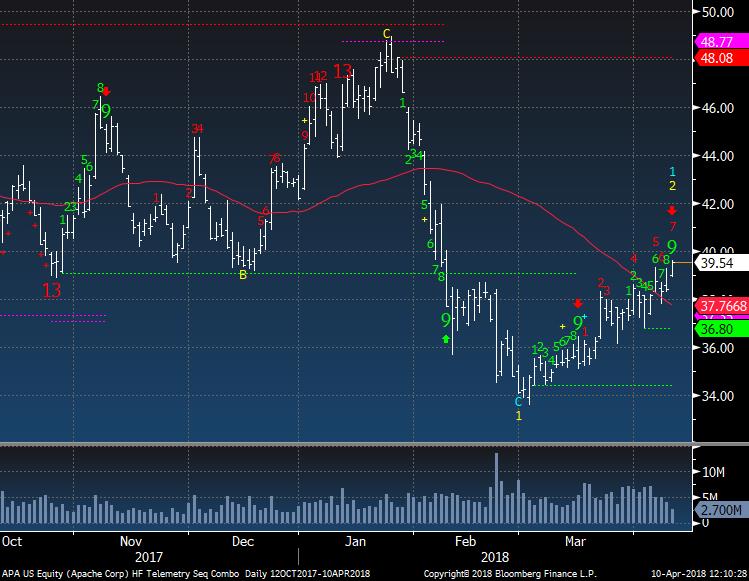
Taking small profit in APA long. Chart below. No new ideas, holding a few things with small losses but by the end of the day I could be up if we get the late day sell off
|
|
|
|
|
|
|
|
|
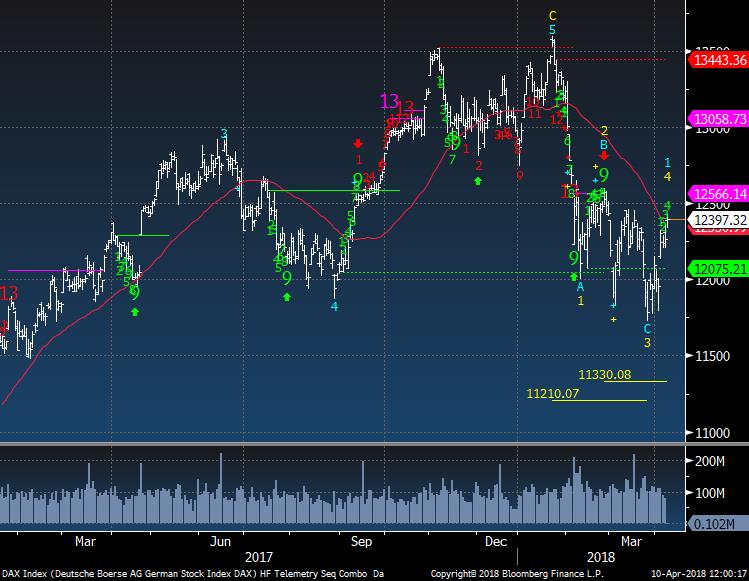
DAX Index now has wave 4 of 5 with a new downside price objective of 11,330. That will lock in under the 3rd wave down.
|
|
|
|
|
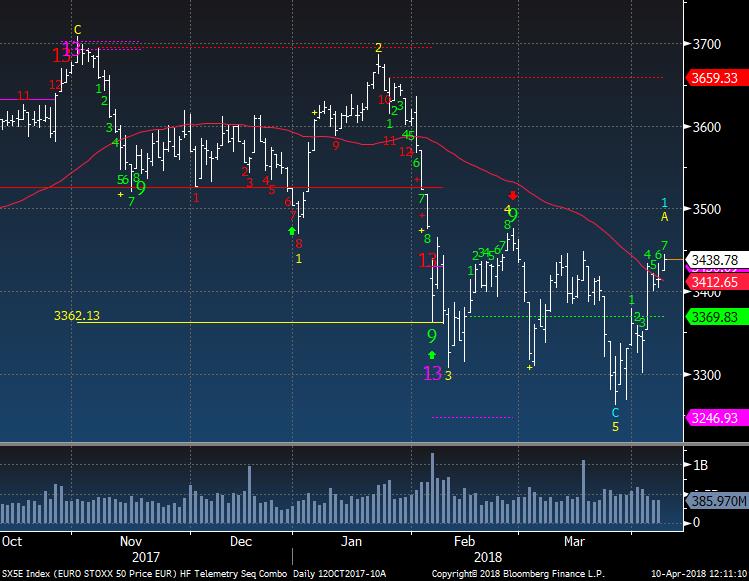
Euro Stoxx 50 is now back above the 50 day and that's a constructive sign. A positive scenario would be a higher low pullback (wave 2/B) to buy.
|
|
|
|
|
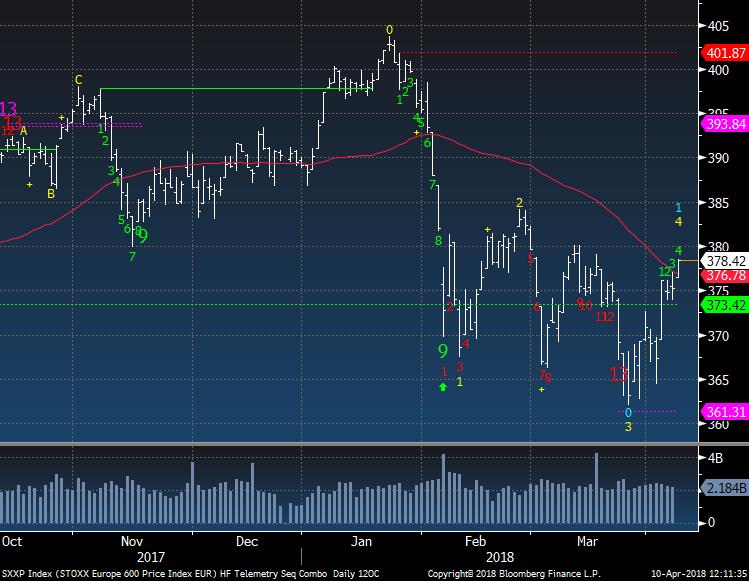
Euro Stoxx 600 also made it above the 50 day today yet the wave set up is not the same as the Euro Stoxx 50. If this made a higher low (wave 2) and did not break the recent closing low (wave 3) then there is a long trade potential.
|
|
|
|
|
|
|
|
|
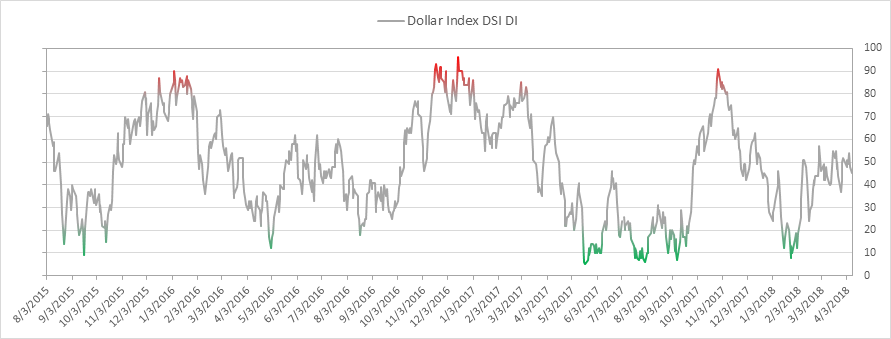
US Dollar bullish sentiment is at 45% and just remains in a tight range.
|
|
|
|
|
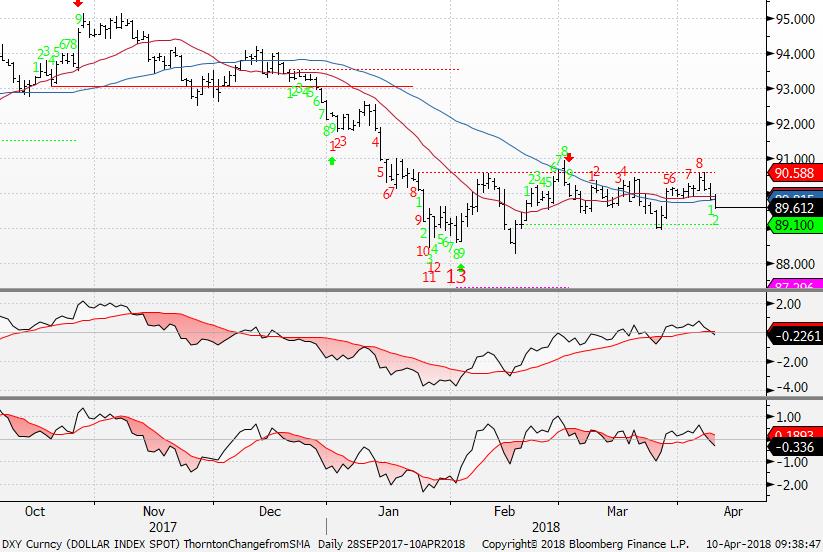
DXY US Dollar Index has been struggling to make a move higher with the upside red Countdown on day 8 of 13.
|
|
|
|
|
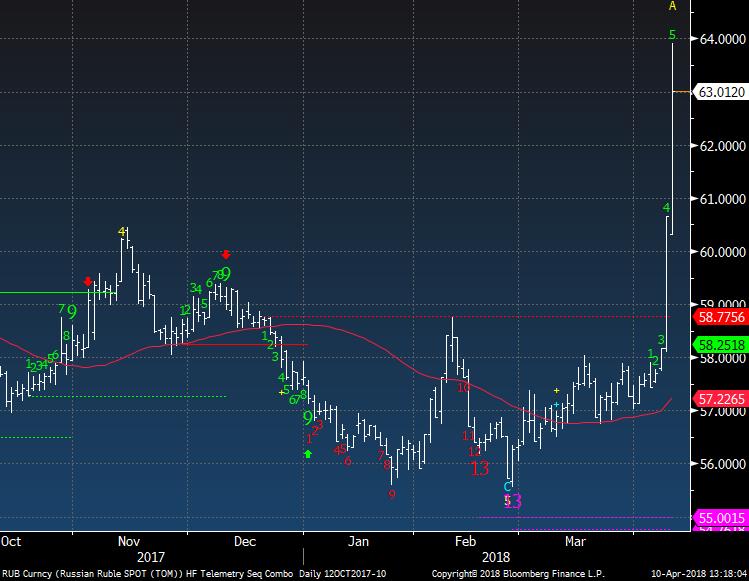
Russian Ruble on the other hand broke down (inverted) rather dramatically.
|
|
|
|
|
|
|
|
|
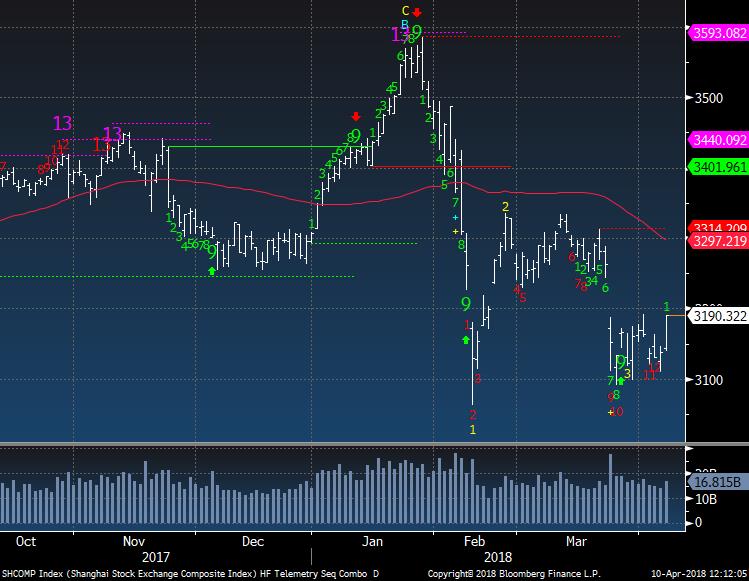
Shanghai Composite Index remains on day 12 of 13 with its downside Countdown. This could continue higher tomorrow.
|
|
|
|
|
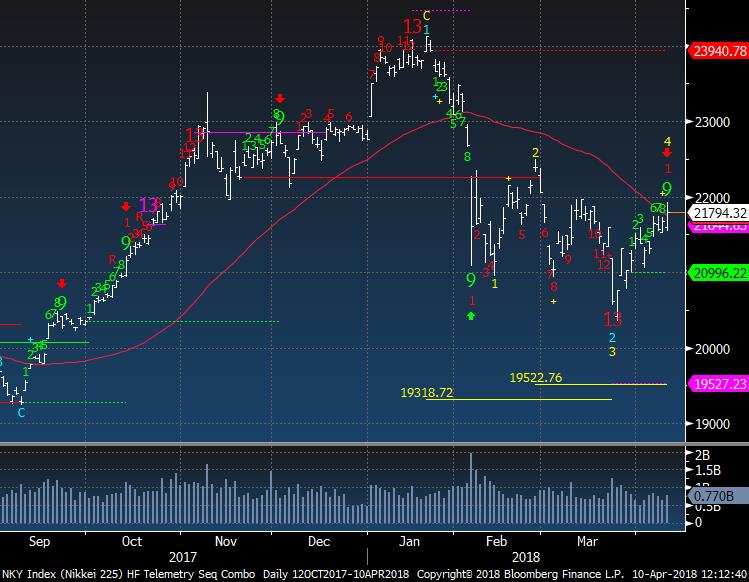
Nikkei Index has a green Setup 9 today and a red Countdown 1 today and the 4th wave was locked in with a downside price objective of 19,522. Some short term consolidation is likely
|
|
|
|
|
|
|
|
|
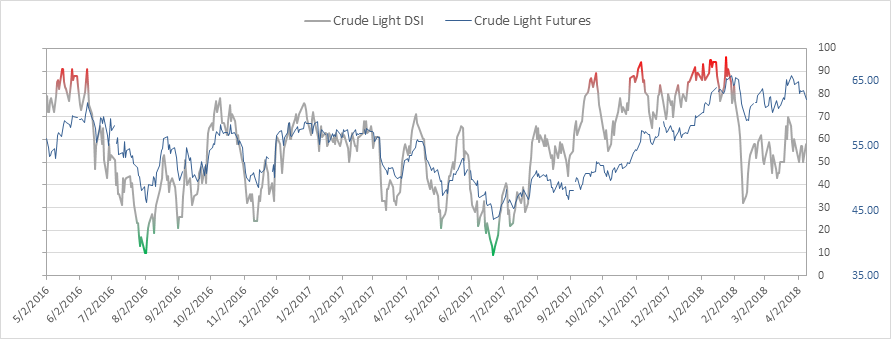
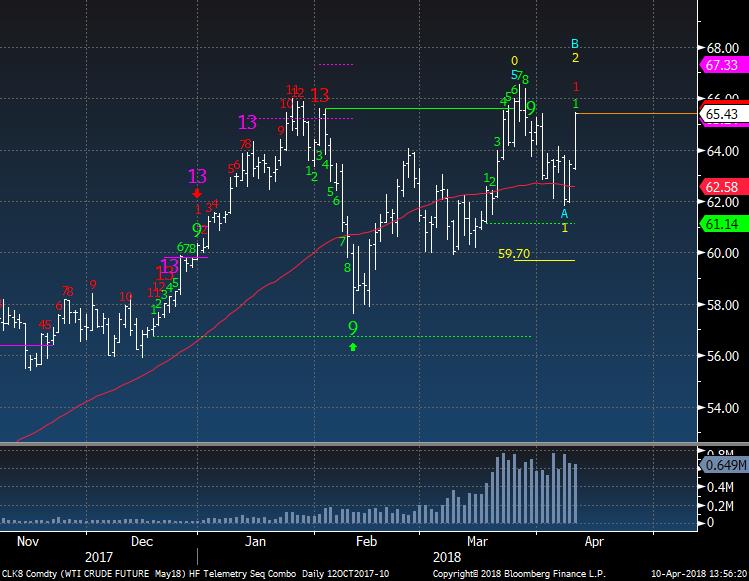
Crude bullish sentiment is at 58% and has remains above the 50% level on the recent pullback.
|
|
|
|
|
Crude is having a very strong day and has a new red Countdown on day 1 of 13. Follow through will be key
|
|
|
|
|
|
|
|
|
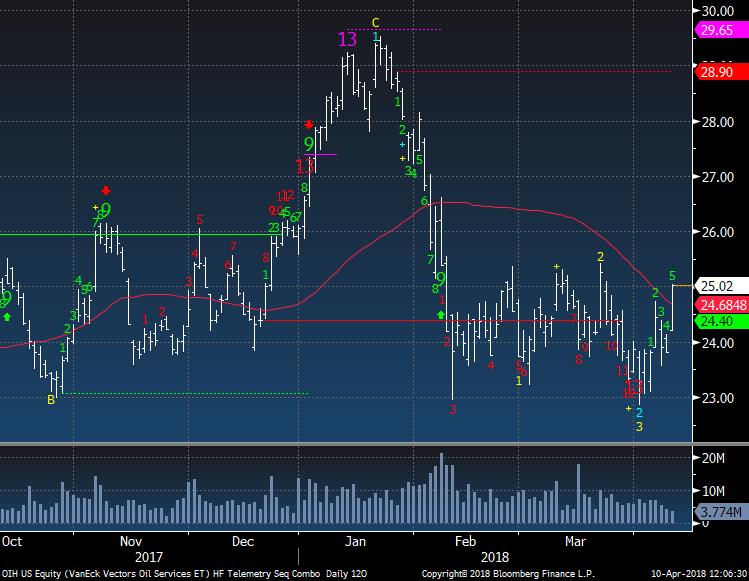
OIH Oil Drilling ETF had a recent downside exhaustion and is trying to make a move out of the recent range. I think it has a shot
|
|
|
|
|
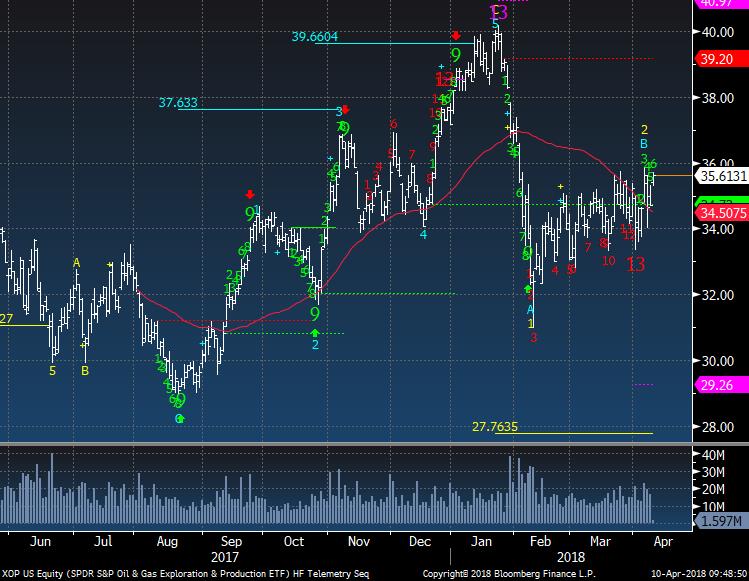
XO Oil and Gas Exploration had a downside exhaustion and is trying to move higher. There is however not the most favorable wave pattern as it's on downside Wave 2/B and this is my favorite setup to short (once it tops). I like it because you can use the previous high (from January as a defined stop) I'm not shorting this yet to be clear.
|
|
|
|
|
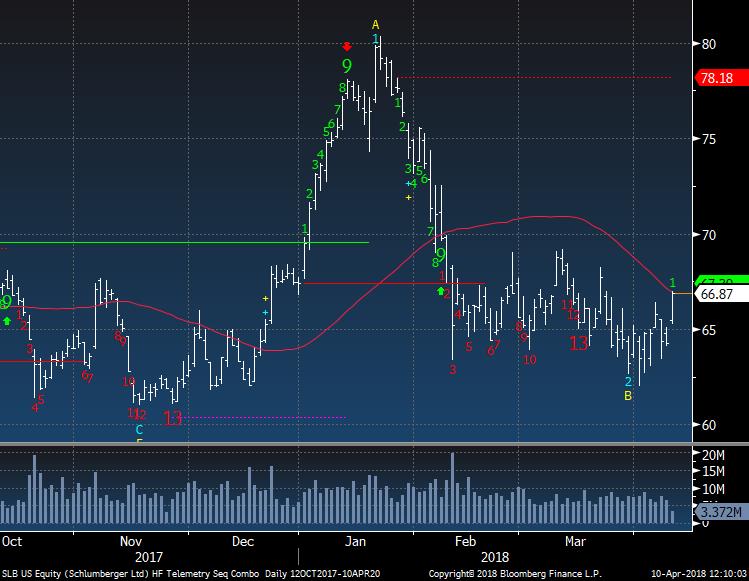
SLB has been one I've been long a few times in the past year and recently added it to the Trade Ideas page as a long. The wave 2/B on the downside is also a set up I like to buy
|
|
|
|
|
APA is being removed today with the green Setup 9. Taking a little 1.5% profit.
|
|
|
|
|
|
|
|
|
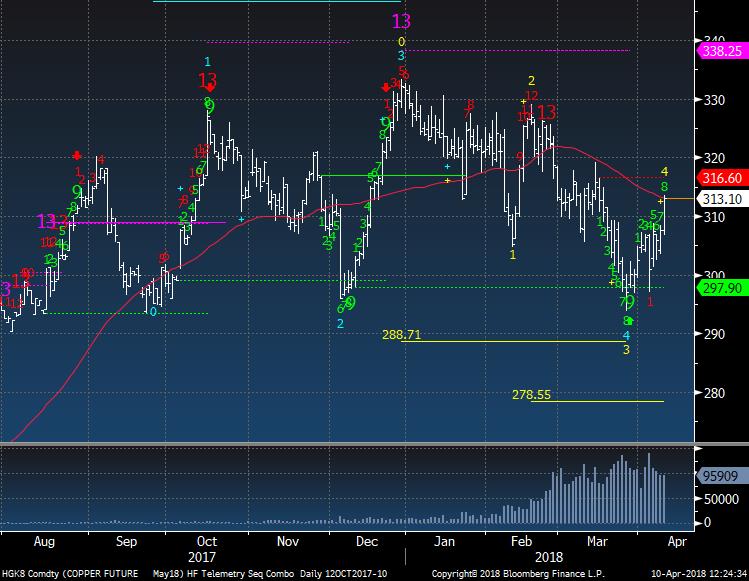
Copper is one that I liked on the long side after letting the upside exhaustion bring it back to support at 297.90 (TDST green dotted line). I lost the long as I stopped out with the red 1 and as I said use 297.90 as a stop. So unfortunately it's a "no harm, no foul" stop out yet I was right on the original idea. I'm not beating myself up since its on wave 4 of 5 now with a down wave setup. A short idea could develop again.
|
|
|
|
|
|
|
|
|
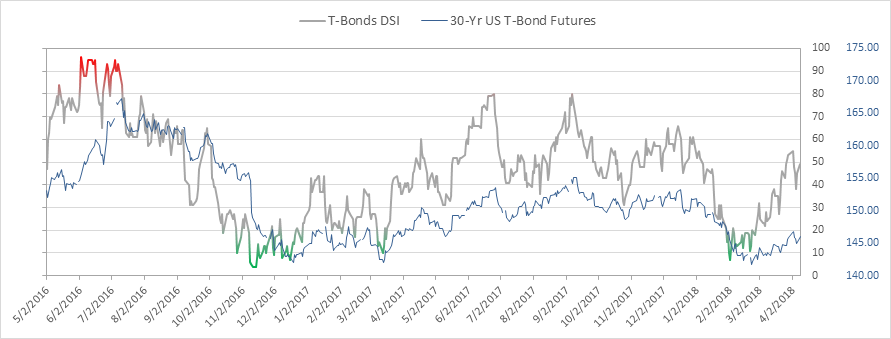
Bond bullish sentiment is at 49% and despite the hate I hear for bonds this holds a nice bid
|
|
|
|
|
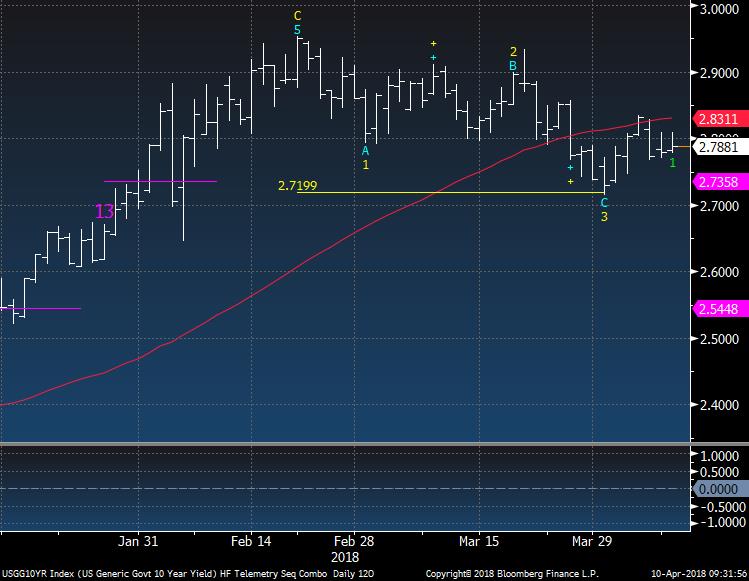
The US 10 year yield has been in a very tight range and hit the wave 3 downside price objective. I'm neutral for now
|
|
|
|
|
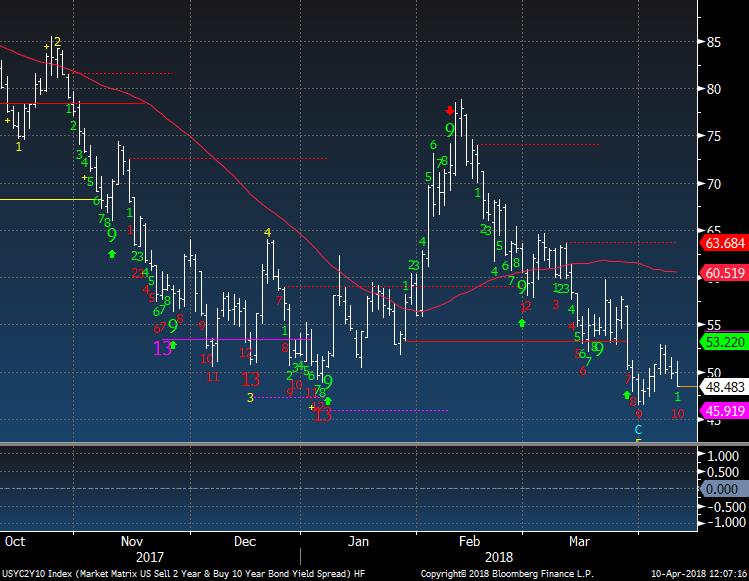
The 2/10 spread yield curve continues to flatten and is on day 10 of 13. A little more to go.
|
|
|
|
|
|
|
DEMARK SCREENS - Daily, Weekly, Monthly Upside/Downside Exhaustion Signals
|
|
|
Daily/Weekly DeMark upside/downside exhaustion signals (Sequential) Weekly updated on Monday's. Price flips occur when a stock closes higher/lower than four previous closes.
S&P 1500 Universe:
DAILY UPSIDE 13: NONE
DAILY DOWNSIDE 13: CDNS, CELG, COST, IP, L, NWBI, ODP, PFG, POL, TMK, VIVO, WAT, WOR
DAILY UPSIDE WITH PRICE FLIP REVERSAL DOWN: FSS, KFY, PGR, RNR
DAILY DOWNSIDE WITH PRICE FLIP REVERSAL UP: ANIK, CELG, MCF, WST
Updated: 4/10/18
WEEKLY UPSIDE 13: GES, LHCG, NEOG, TUES
WEEKLY DOWNSIDE 13: RRC, SIG, SPN
Updated: 4/2/18
MONTHLY UPSIDE 13:
MONTHLY DOWNSIDE 13:
Euro Stoxx 600 Universe:
DAILY UPSIDE 13: EKTAB SS
DAILY DOWNSIDE 13: IMI LN, MKS LN
DAILY UPSIDE WITH PRICE FLIP REVERSAL DOWN: BEZ LN, PFC LN
DAILY DOWNSIDE WITH PRICE FLIP REVERSAL UP: DEC FP, ERF FP, ITRK LN, SW FP
Updated: 4/10/18
WEEKLY UPSIDE 13: CDI FP, SAZ GR, SCAB SS, VCT LN
WEEKLY DOWNSIDE 13: ATC NA, DLG GR
Updated: 4/2/18
MONTHLY UPSIDE 13: ASSAB SS, BEZ LN
MONTHLY DOWNSIDE 13: CPI
LN
|
|
|
Unsubscribe me from Hedge Fund Telemetry
Hedge Fund Telemetry LLC, P.O. Box 4675, Greenwich, CT 06861, United States
CONFIDENTIALITY NOTE and DISCLAIMER: This message is for the named person's use only. It may contain confidential, proprietary or legally privileged material. No confidentiality or privilege is waived by any accidental or unintentional transmission. If you receive this message in error, please immediately delete it and all copies of it from your system, destroy any hard copies and notify the sender. You must not, directly or indirectly, use, disclose,
distribute, print or copy any part of this message if you are not the intended recipient. Hedge Fund Telemetry LLC. cannot guarantee the confidentiality of the material transmitted; therefore, information of a sensitive or confidential nature should not be transmitted. There is risk in trading markets. Hedge Fund Telemetry LLC reports are based on information gathered from various sources and believed to be reliable, but are not guaranteed as to accuracy and completeness. The information is subject to change without notice and Hedge Fund Telemetry LLC has no obligation to provide any updates or changes. Hedge Fund Telemetry LLC is providing this data for informational and educational purposes and does not believe that it is sufficient to base an investment decision on. This information should not be regarded as a solicitation or recommendation of any particular security or to engage in any trading strategy. One should always check with your licensed financial
advisor to determine suitability of any investments.
|
|
|
|
|