|
|
|
|
|
|
The Situation Remains Fluid
|
|
|
This saying originated in descriptions of military campaigns. Battle scenes are frequently described as "fluid situations" meaning that conditions are highly unstable and unpredictable and highly likely to change from one moment to the next. Today I woke up to a rather sizable move
in the USD and crosses, notably the Chinese offshore Yuan. If it looks like currency manipulation, it usually is from my experience and especially when at critical levels. Then the news that President Trump and President Xi spoke at length on the phone today it seems even clearer that some currency actions were taking place. Both leaders released positive comments reiterating a healthy relationship was the goal. Trump and Xi also agreed to meet at the upcoming G20 meeting. These are all potential market positives yet hammering out an agreement on the multiple issues will take time with a lot of negotiations between representatives.
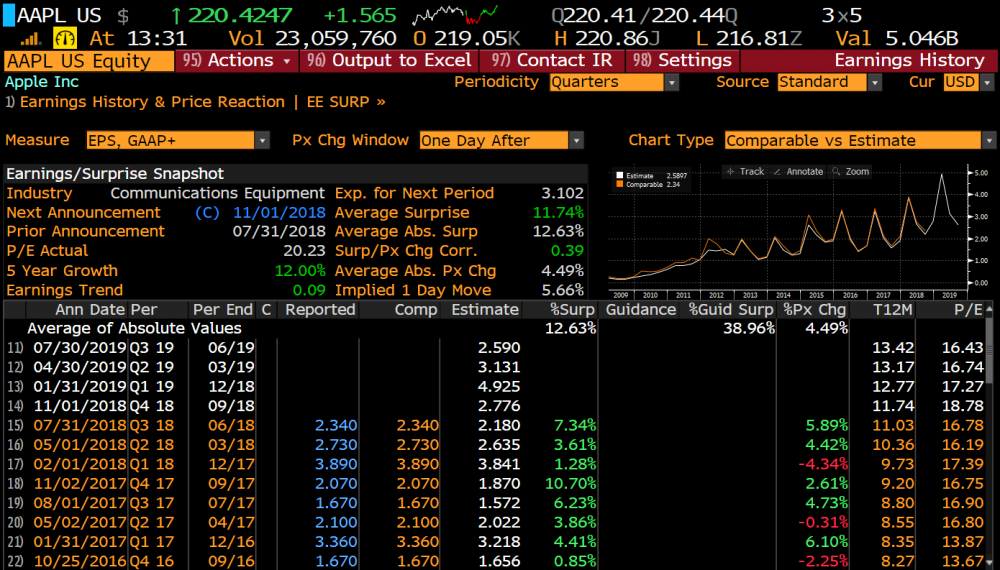
Apple reports today after the close and has had generally reported without surprises to the downside in recent quarters. Expectations are not too hot or cold. iPhone sales are always the focus and with new models hitting the market this quarter people expect about 3% year over year growth and ASP's of 20% year over
year (with the high end priced phones). Services revenue has been a real growth driver in the past year and the street expects 28% growth but that could be a bit too high with the China freeze on new games. The other concern is China growth which was up strong last quarter at 19% which might have cooled off this quarter with all the tariff talk. Apple is the last mega cap tech/consumer stock to report and also is the largest weight in the S&P and Nasdaq 100. The implied move is 6% and usually it trades around 4%. Any negative surprises could knock this down further than the implied move and considering Apple has only .94% of the float short there is no short squeeze threat. I have no position going into report but if I did it would lean more on having some puts to define risk.
The S&P bullish sentiment is at 25% and up from 8% on 10/24. The daily chart patterns of the major indexes have or are near triggering the 2nd wave of 5 down waves.
Wave 2's make lower highs and then are followed by lower low wave 3's. Once the waves trigger, it doesn't mean sell but it then becomes important to wait for that bounce to end. We will use the shorter term tactical 60 minute time frame charts to give us some good timing clues. In the meantime, stay nimble with a good sized cash position so we can opportunistically deploy when we see fit. Tomorrow after Apple and the jobs report will give us a lot more clarity. I'm patient until then.
- US Markets - Sentiment improving and we are on watch for wave 2 on daily charts.
- Hedge Fund Telemetry Trade Ideas - Added to Nov SPY, QQQ puts
- A few recent Trade Ideas
- Apple ahead of earnings
- Sector Focus - Semiconductors - I was a couple days early
- PPO Monitor - Percentage Price Oscillator Force Ranked Sector
Rotation - Look at 10 day moving average
- Bloomberg Technical Pattern Recognition Screen
- Currency Update - USD bullish sentiment was at 95% and looks like currency manipulation
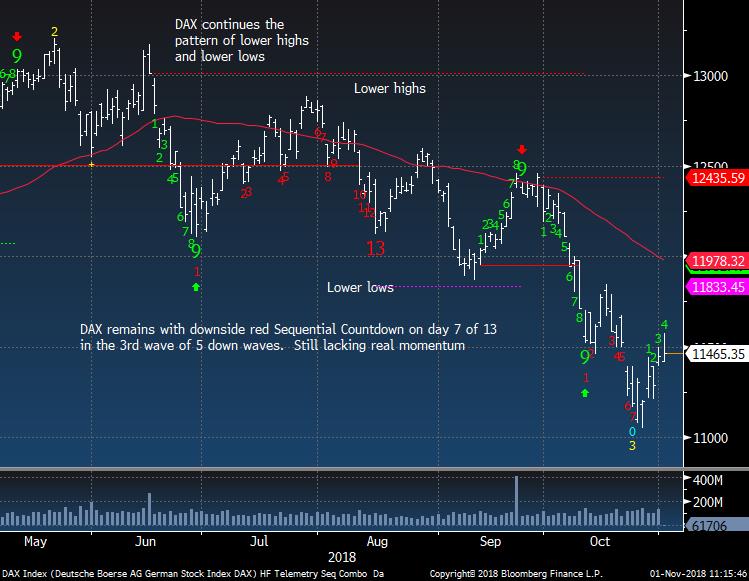
- European Market Update - An up day but weak one
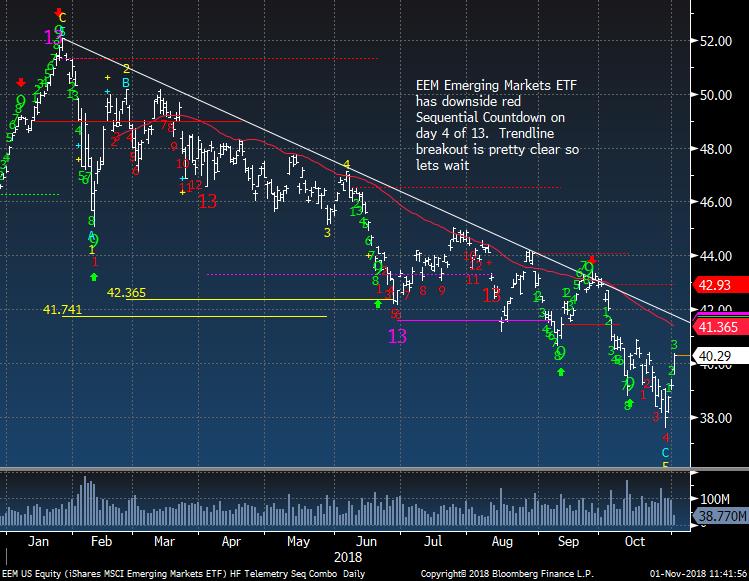
- Global Market Update - Need to see trendline breakout on EEM
- Asian Market Update - Still mixed
- Crude Update - Still going lower as
expected
- Gold Update - An up day but still needs more follow through
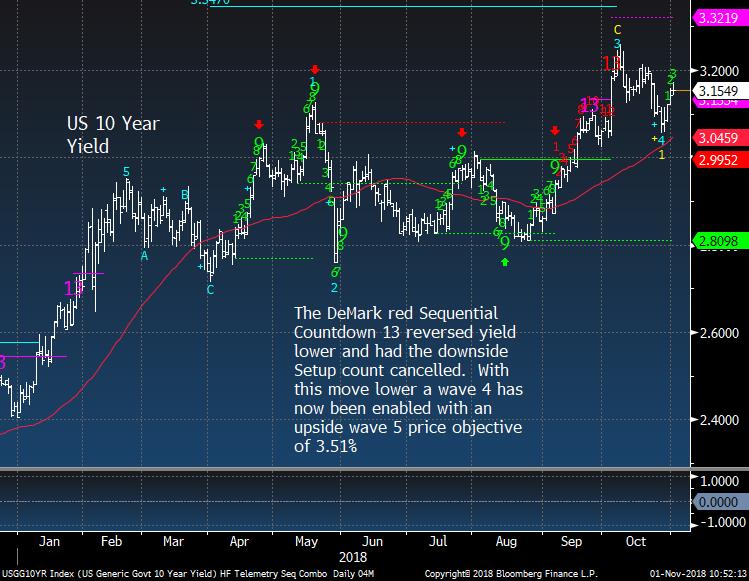
- Bond Update - As I said yesterday my bias changed and perhaps upside wave 5 higher targets on 10 year can be hit
- DeMark Screens - Daily, Weekly, Monthly upside/downside exhaustion signals within the S&P 500 and Euro Stoxx 600 OCTOBER MONTH END SIGNALS UPDATED
|
|
|
|
|
Here's a link to the Hedge Fund Telemetry market sentiment page with 40 charts of sentiment including equities, bonds, currencies, and commodities updated each day. When the new website launches we will be adding new charts and historical sentiment data for Euro Stoxx 50, UK FTSE 100, German DAX, French Cac 40. We will be adding Japanese Bonds, German Bunds, and a few more. Still having issues with new charts but charts are fine on the site.
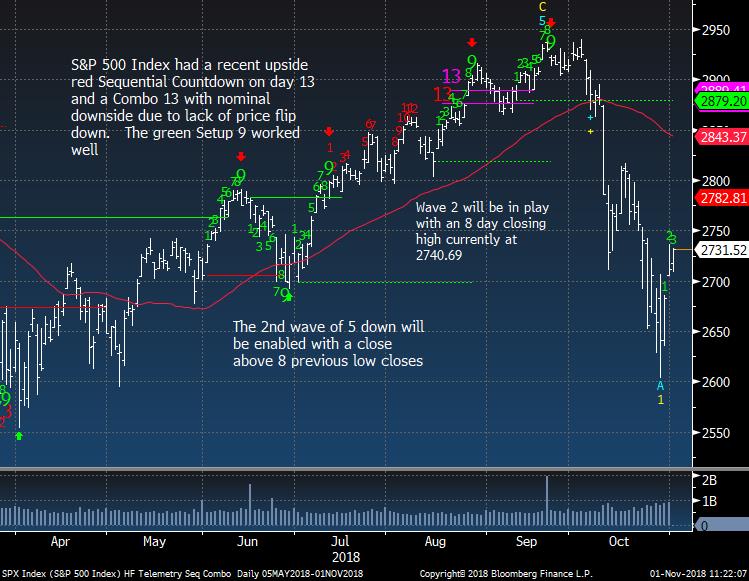
SPX bullish sentiment is at 25%
|
|
|
|
|
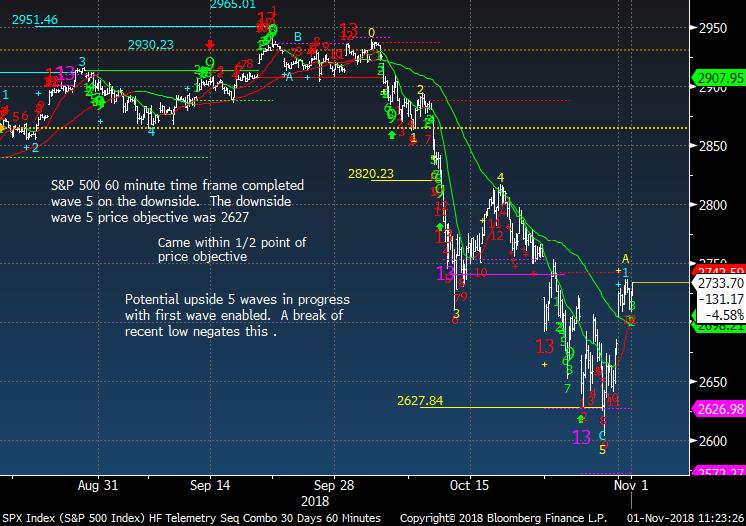
SPX 60 minute tactical time frame
|
|
|
|
|
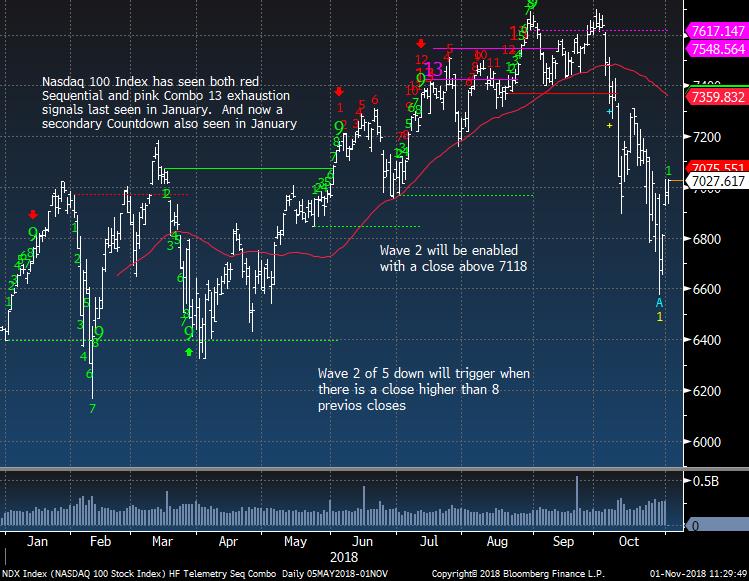
Nasdaq bullish sentiment is at 24%
|
|
|
|
|
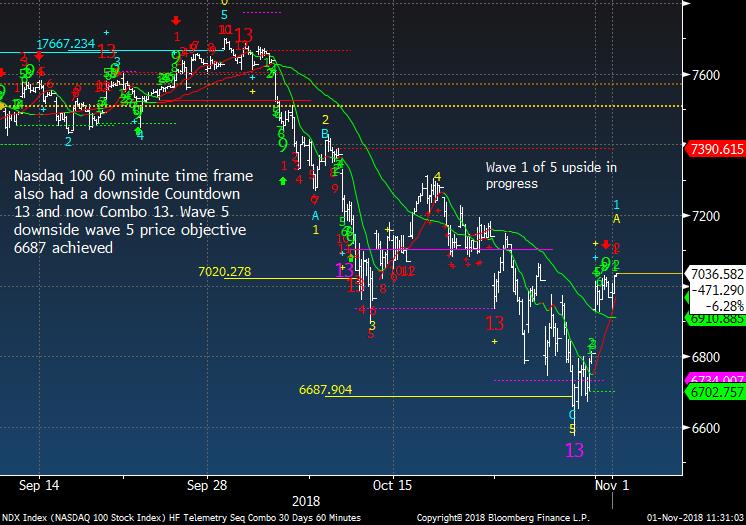
NDX 60 minute tactical time frame
|
|
|
|
|
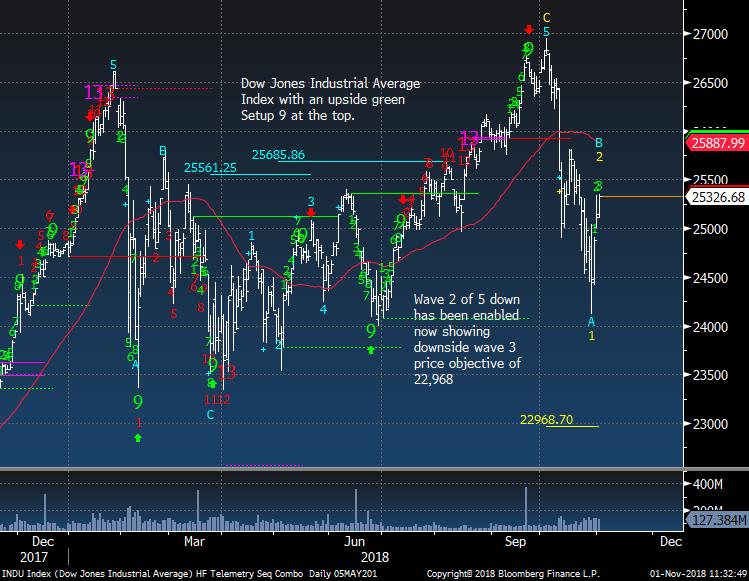
Dow Jones Industrial Average did get the wave 2 and now we have a wave 3 downside price objective
|
|
|
|
|
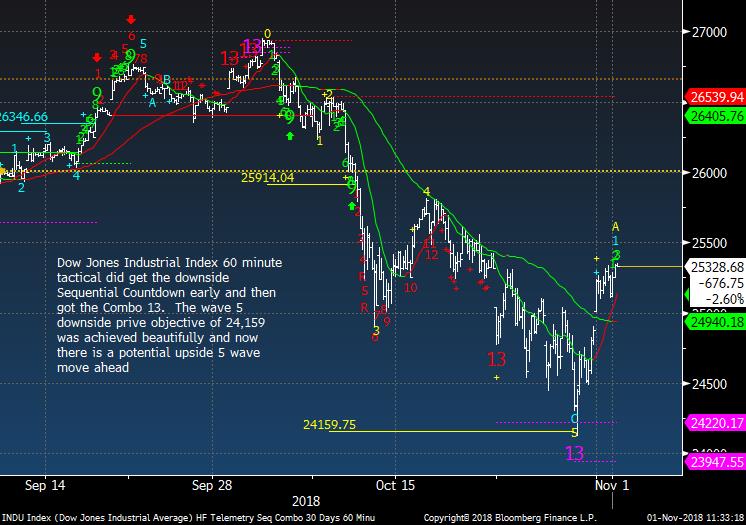
Dow 60 minute tactical also on wave 1 of 5 to the upside
|
|
|
|
|
|
|
|
|
|
|
Hedge Fund Telemetry Trade Ideas
|
|
|
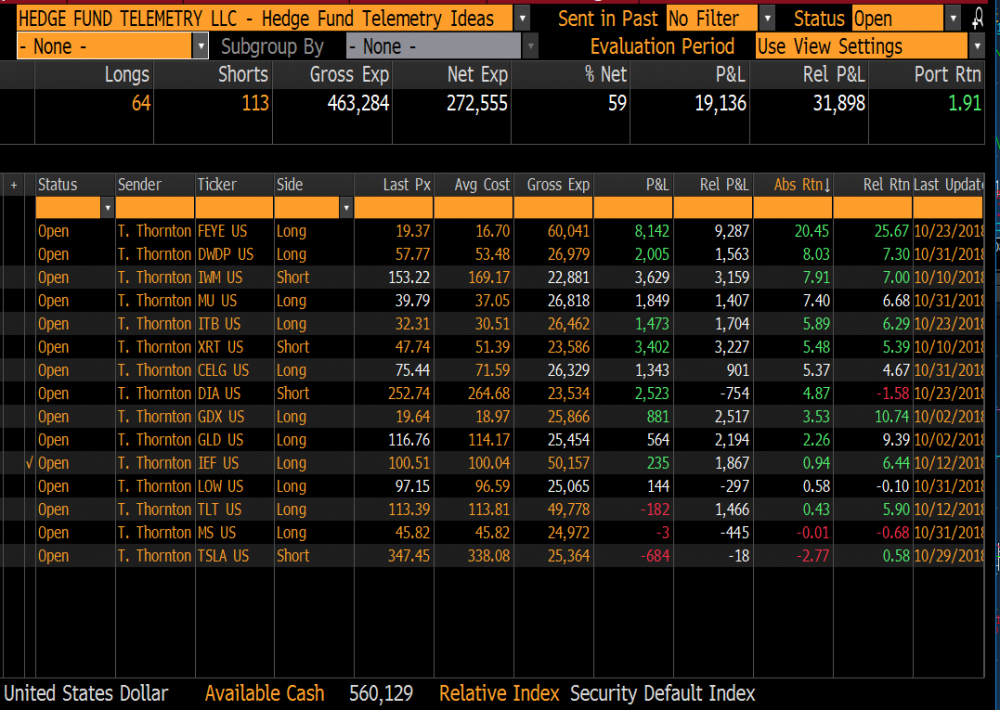
Trade Ideas Sheet - Long and short US equity ideas including ETF's. We will be overhauling the Trade Ideas Sheets for long only, short only, ETF's when the new website rolls out soon. There will also be a clearer email distribution with changes.
Trade Ideas Changes: Added to Nov puts SPY 267, QQQ 168. Using as a hedge
Stops on everything. TSLA 360, GDX 17.35 , FEYE 17.00, XLY 113, XRT 50, IWM 163, DIA 260, XLI 77, GLD 111, IEF 98 TLT 112 , (RECENTLY ADJUSTED STOPS), ITB 28, MS, MU, DWDP, LOW, CELG use 7-10% stops for now. Adding to puts: SPY 267 and QQQ 168 for Nov. Removed lower strike on SPY 255 puts that were sold in the put spread yesterday. THIS IS A HEDGE so keep exposure low.
|
|
|
|
|
|
|
|
|
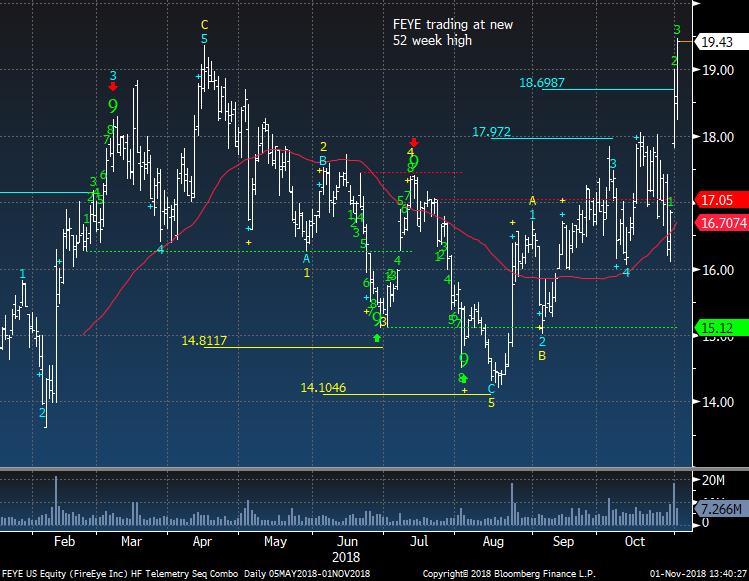
Fire Eye trades nicely after yesterday's gap up. I think when it moves over 20 momentum people will take notice
|
|
|
|
|
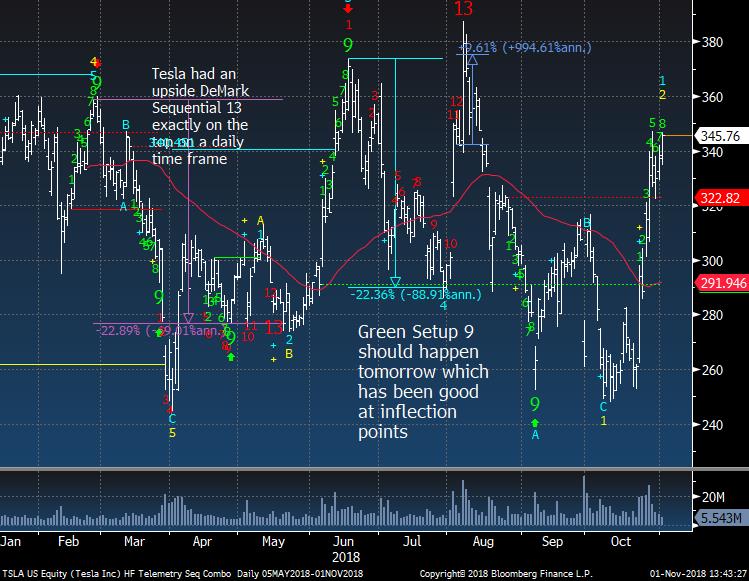
Tesla continues to defy gravity and also has not filed the 10k which is what every company files after they report. It's also where all the questions skeptics have will be answered.
|
|
|
|
|
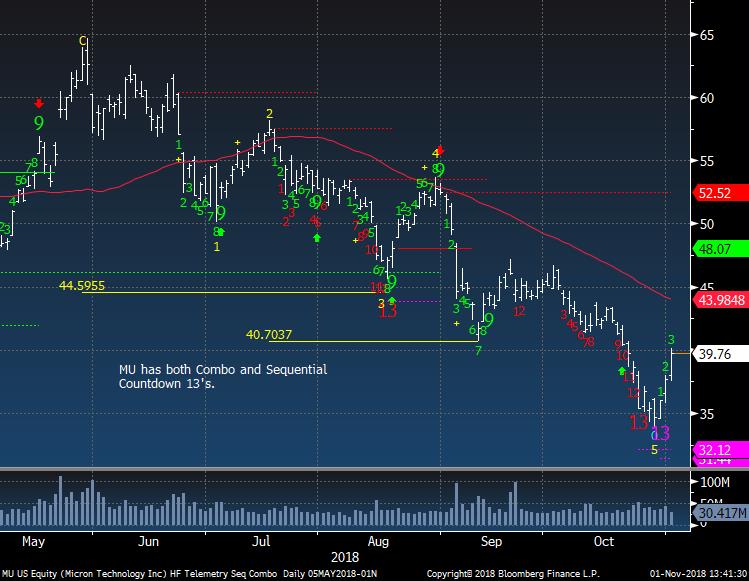
Micron nice follow through. I was early on Semi's last week but got it with MU now
|
|
|
|
|
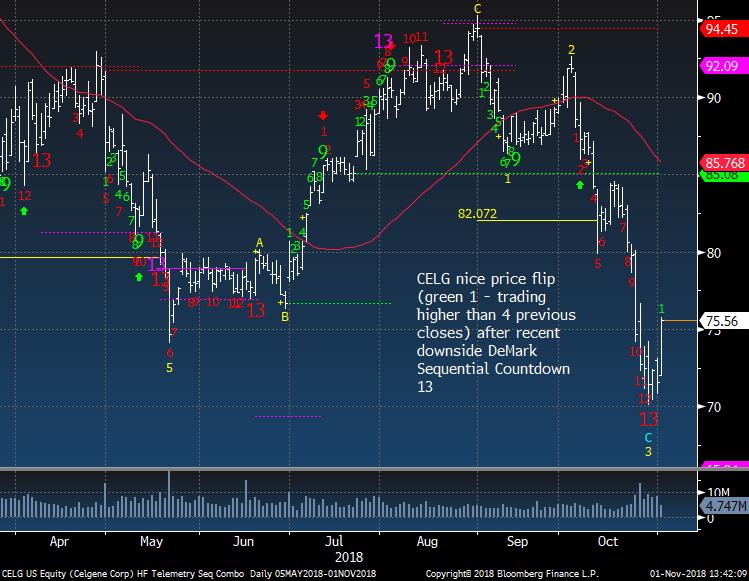
Celgene having a strong day
|
|
|
|
|
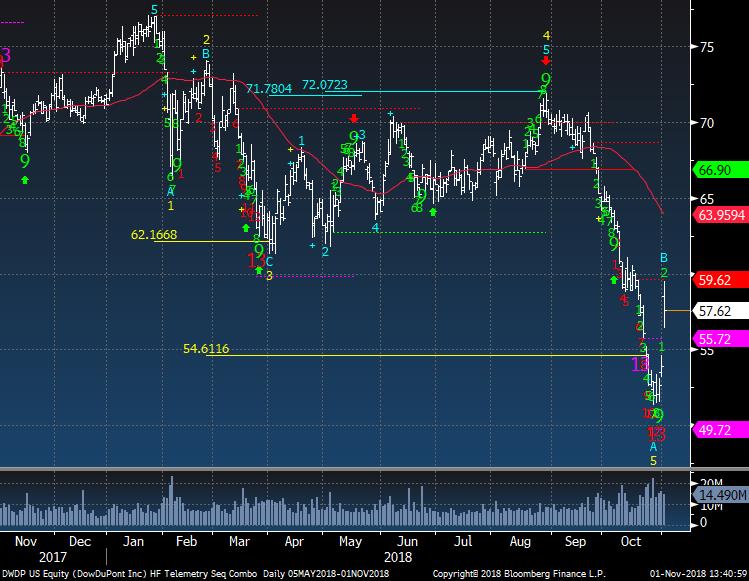
Dow Dupont reaction to OK earnings pretty good but never like seeing a gap up and then trading below opening price.
|
|
|
|
|
|
|
|
|
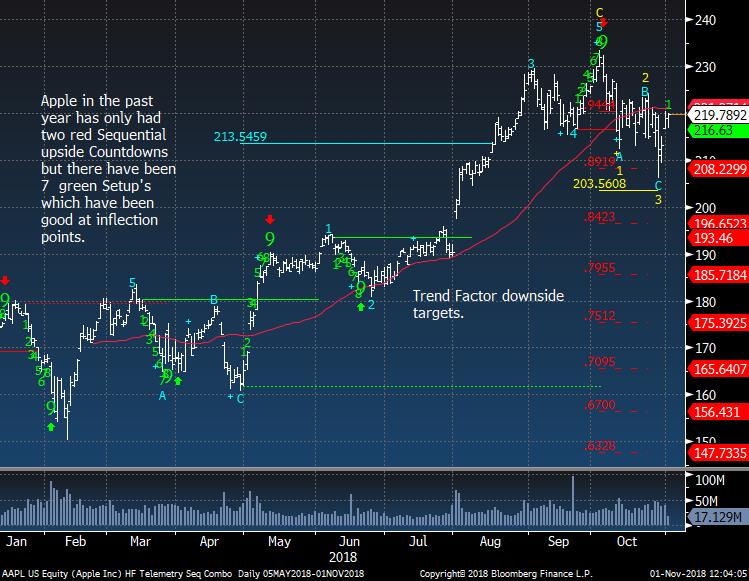
Apple stock has been going sideways in the last 3 months. I have no strong call here but I lean short (via puts) if I was to have to have an opinion.
|
|
|
|
|
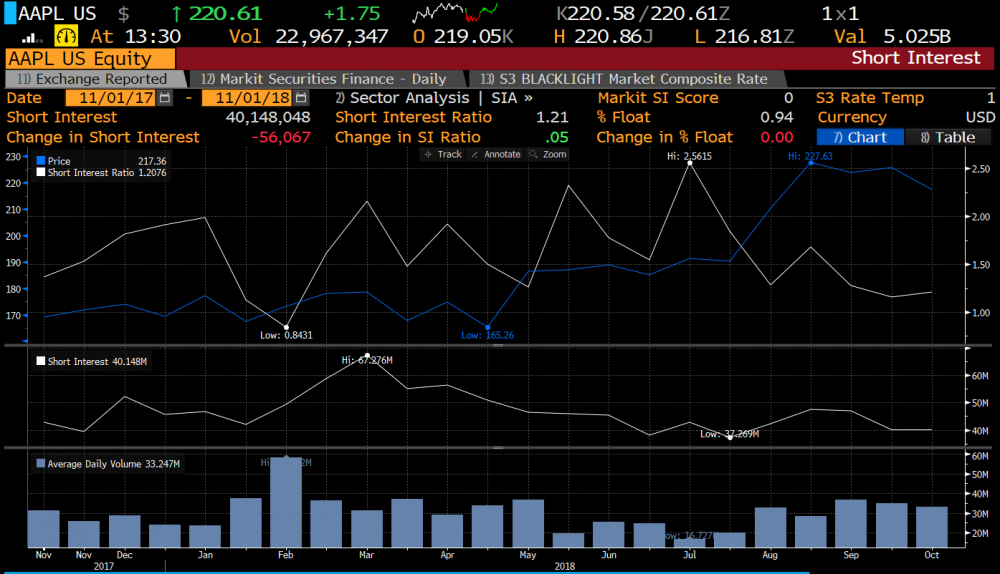
Part of the reason I would lean short is that there is only 0.94% of the float short. When there are few shorts the natural buyer is not there to cover and support the stock. The recent mega cap FANG stocks like FB, AMZN, NFLX gap downs I would say was due to ultra low short interest.
|
|
|
|
|
The options implied move is 5.66% with an average move of 4.5%. A lot will depend on how they guide for this quarter with new phones fully for sale in all markets.
|
|
|
|
|
|
|
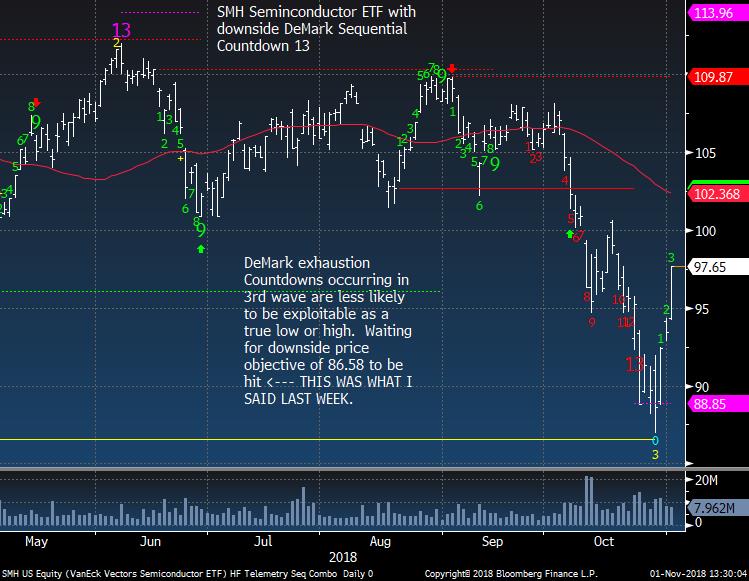
US Sector Focus - Semiconductors
|
|
|
I was early trying to buy Semi's and was stopped out last week. It happens and one has to made decisions with the info you have at that moment and yesterday knowing how SMH had been trading I went long MU. This was a situation that was fluid!
|
|
|
|
|
|
|
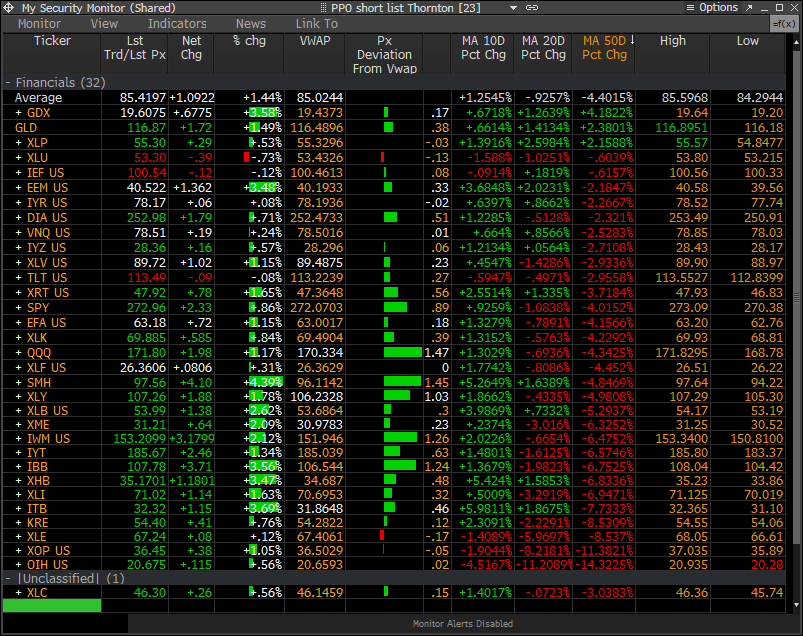
PPO Monitor - Percentage Price Oscillator
|
|
|
The PPO Monitor is a proprietary monitor developed to force rank Indexes, Sectors, and Stocks. It ranks top down by strongest to weakest by percentage above/below the 50 day moving average. Shorter term signals can be seen when the 10 and 20 day moving averages turn up (green) or down (red) which often are followed by the 50 day moving average. This is useful to watch for historically overbought/oversold percentage above/below the 50 day moving average. It is
non correlated with the DeMark Indicators however we have found upside/downside exhaustion signals often occur when something rises to the top or drifts to the bottom of the monitor - increasing the timing aspect. We share this monitor with clients with Bloomberg Terminals. An added feature is that each market/ETF can be expanded with each component force ranked in the same way. A couple other features include price deviation from intraday VWAP (useful for intraday reversals) and new 20 day highs/lows on right side. Please inquire if you would like to be permissioned to use the PPO Monitor.
Today's highlights: Notice how most sectors are now above the 10 day moving average (which I mentioned yesterday). New 20 day high hit in GLD today and 20 day low in OIH
|
|
|
|
|
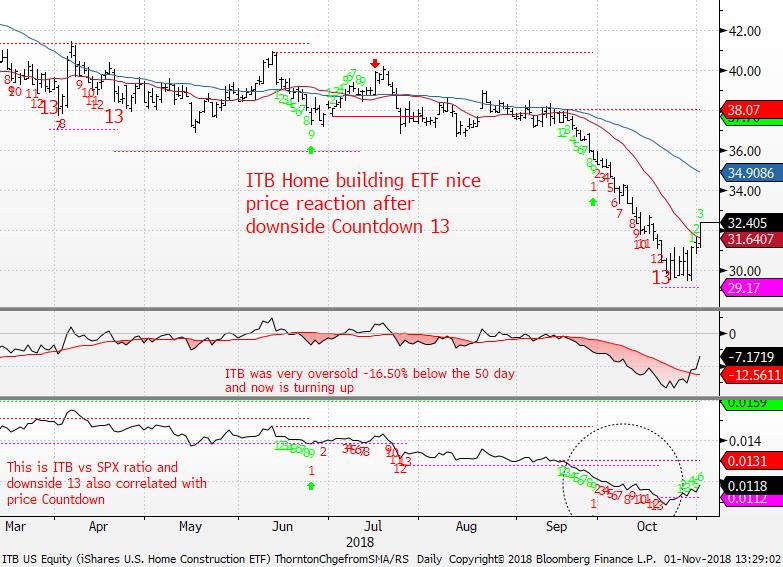
The following chart shows the Percentage Price Oscillator (50 day moving average) in action. ITB Homebuilder ETF still going up and this chart and PPO monitor is why I went long
|
|
|
|
|
|
|
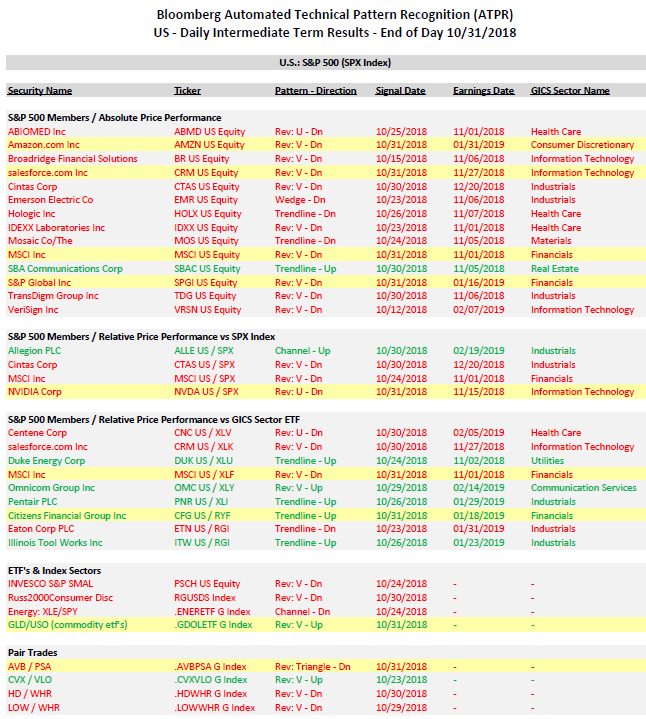
Bloomberg Automated Technical Pattern Recognition Screens
|
|
|
S&P 500 Members/Absolute Price Performance and Relative Price Performance vs S&P 500 and Sector ETF's. ETF's vs Index Sectors. Pair Trades. Long side is first symbol, short side is second symbol. If you would like a PDF from Bloomberg with full details of how this is formulated, please email. We will be doing a webinar in the coming weeks specifically on this system.
|
|
|
|
|
|
|
|
|
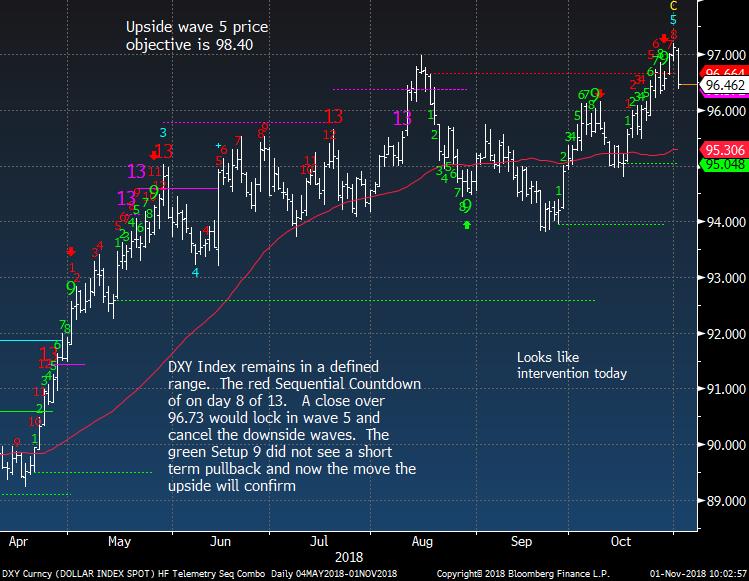
US Dollar bullish sentiment is at 95% and extreme. It didn't take much to move this lower with such high bullish sentiment. I would expect a little time out to cool sentiment and then a move higher. Maybe the green Setup 9's seen here and below are working better than the full red Countdowns?
|
|
|
|
|
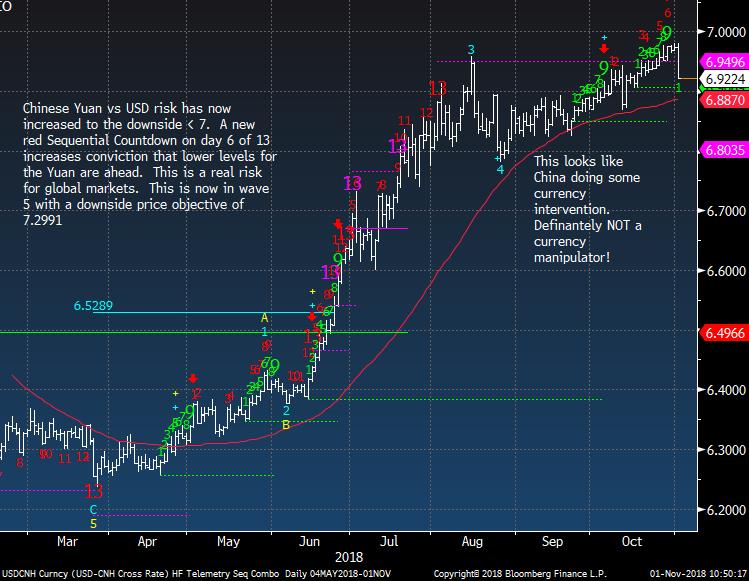
Yuan strength today in a BIG way.
|
|
|
|
|
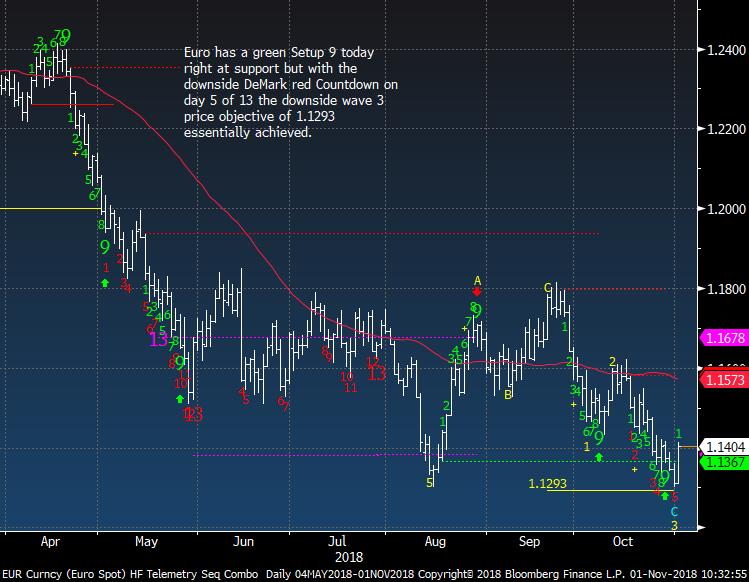
Euro Spot bounce off wave 3 price objective and green Setup 9
|
|
|
|
|
|
|
|
|
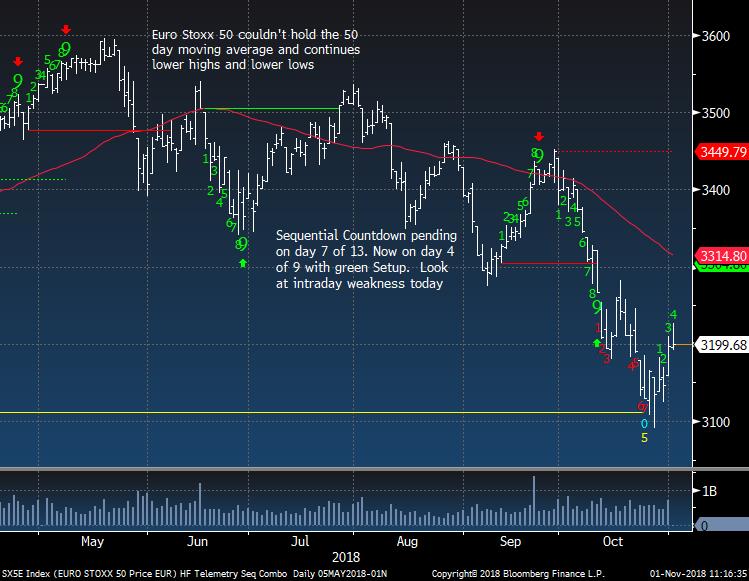
Euro Stoxx 50 decent move making another week high but intraday weakness
|
|
|
|
|
|
|
|
|
|
|
|
|
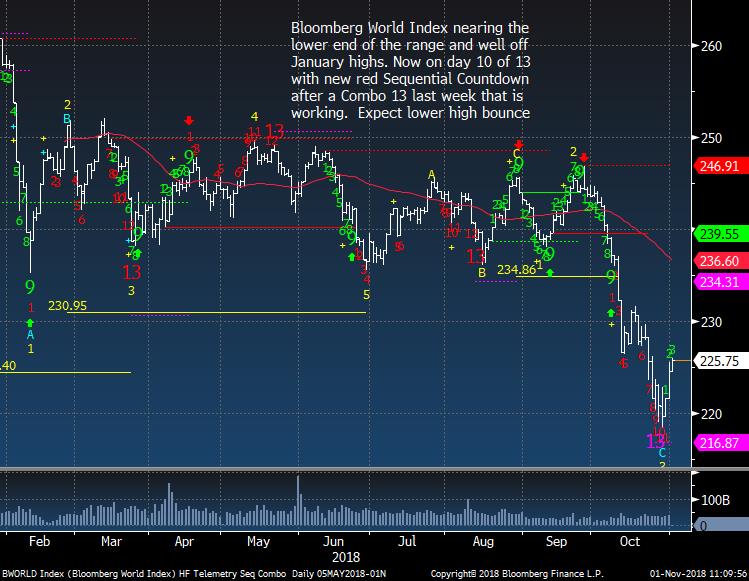
Bloomberg World Index bouncing still
|
|
|
|
|
EEM Emerging Markets ETF has had many false starts so lets watch the trend line
|
|
|
|
|
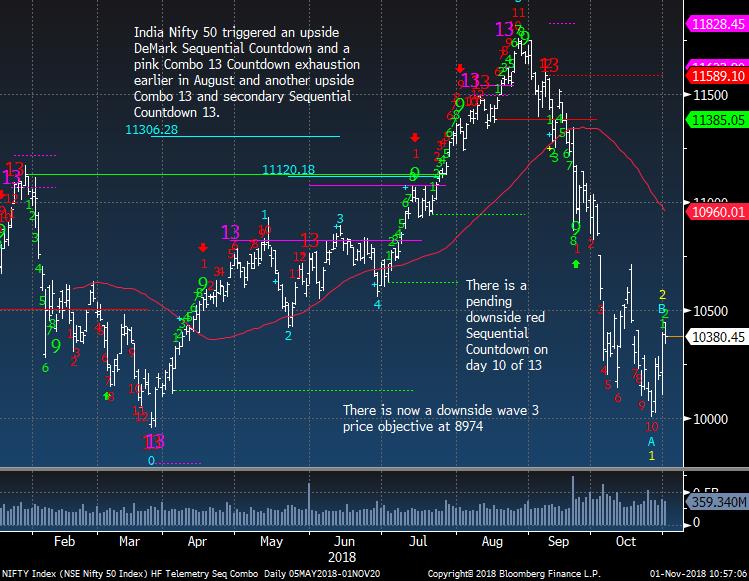
India has now triggered wave 2
|
|
|
|
|
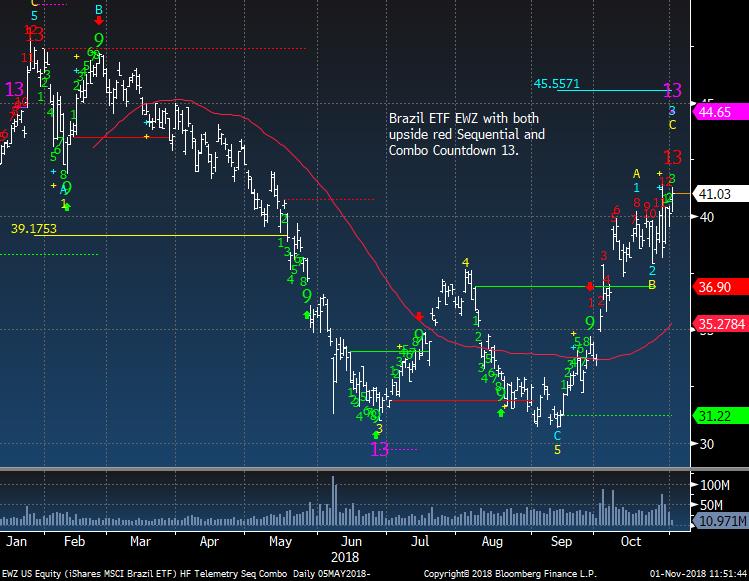
Brazil ETF with Countdown 13's
|
|
|
|
|
|
|
|
|
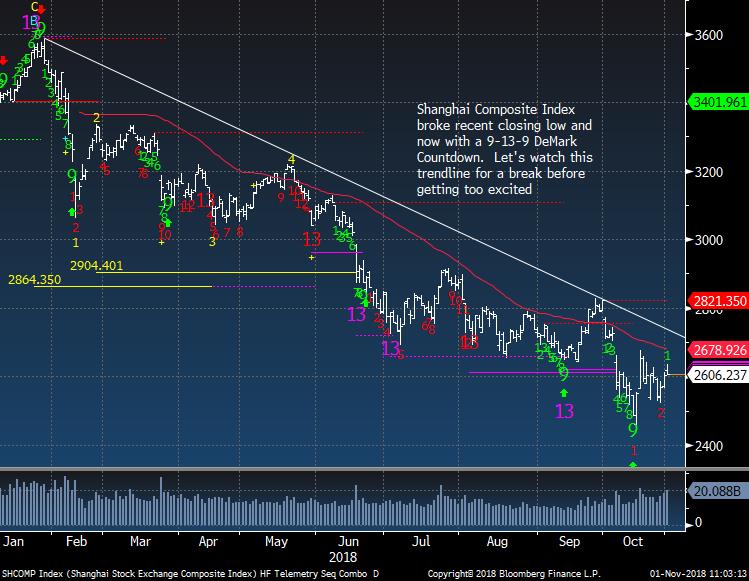
Shanghai also needs a trend line to confirm a real move
|
|
|
|
|
|
|
|
|
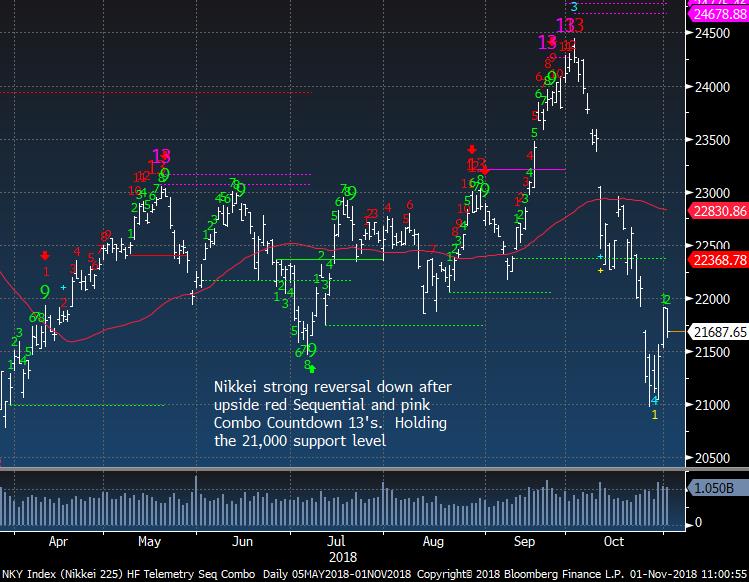
Nikkei reversed yesterday
|
|
|
|
|
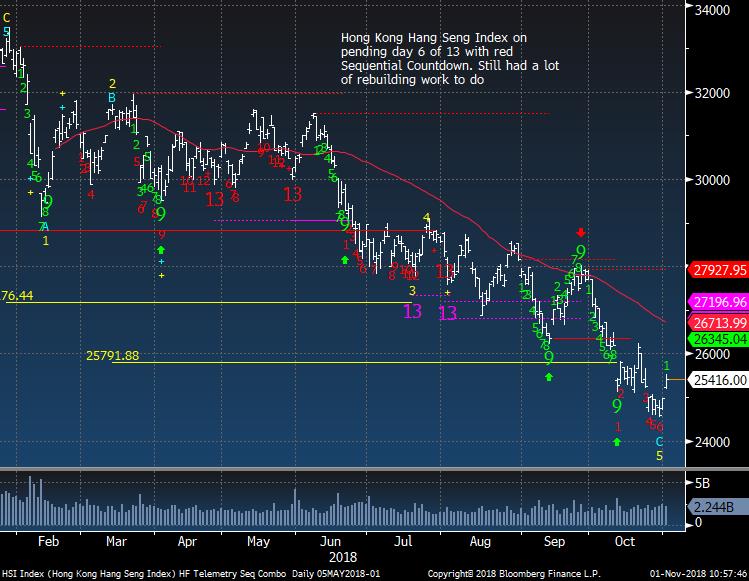
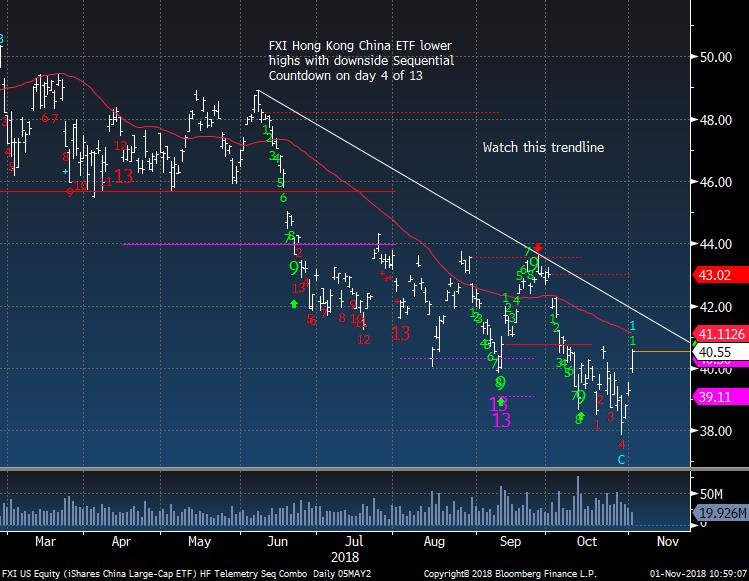
China / Hong Kong FXI ETF needs trend line break too
|
|
|
|
|
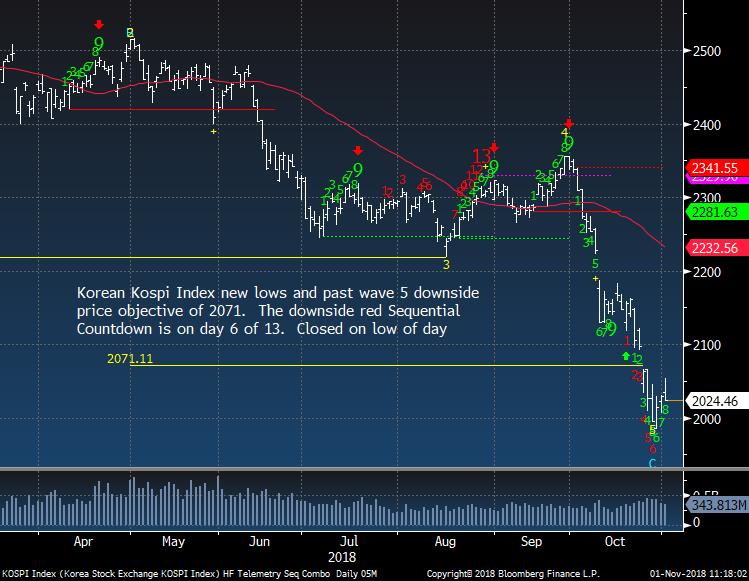
Korea still looks like it needs to rebuild more
|
|
|
|
|
|
|
|
|
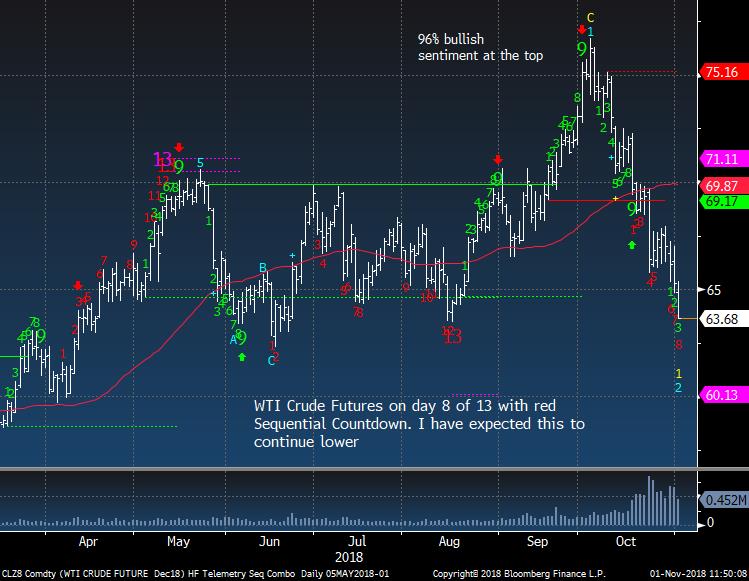
Crude bullish sentiment is at 51% down from 96% at the highs. WTI Crude Futures breaking support at 65
|
|
|
|
|
|
|
|
|
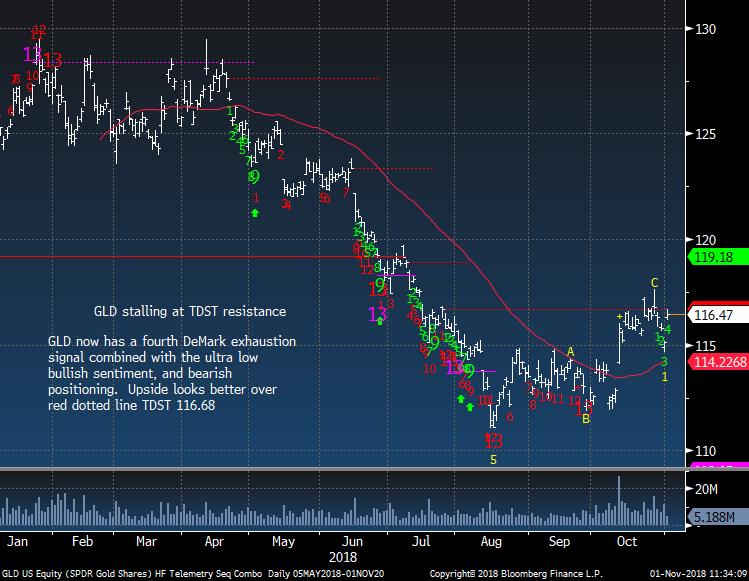
Gold bullish sentiment is at 21% and just can't get going. Lets see how it looks tonight
|
|
|
|
|
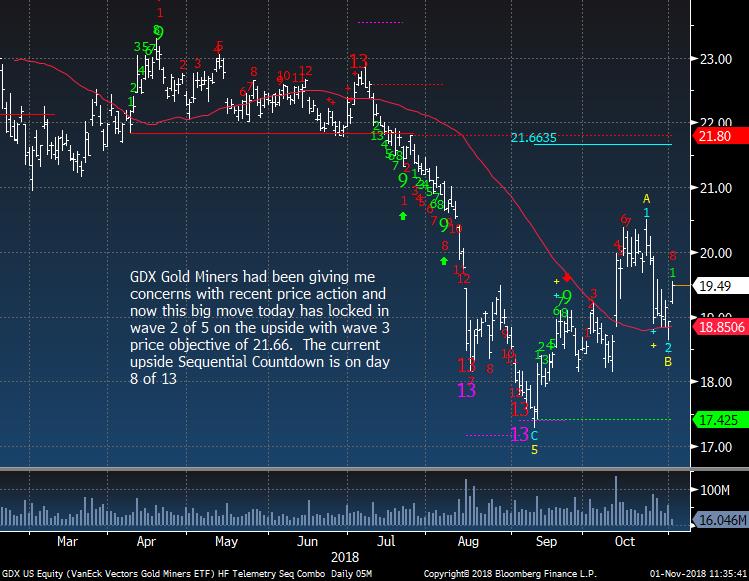
Gold Miners GDX ETF bouncing off 50 day
|
|
|
|
|
|
|
|
|
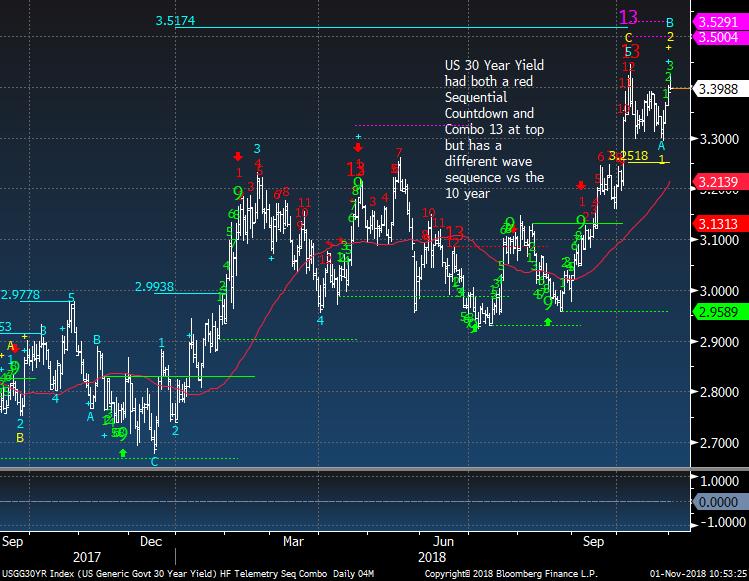
Bond bullish sentiment is at 47% and slipping under the 50% level again
|
|
|
|
|
|
|
|
|
|
|
|
|
DEMARK SCREENS - Daily, Weekly, Monthly Upside/Downside Exhaustion Signals
|
|
|
Daily/Weekly DeMark upside/downside exhaustion signals (Sequential) updated daily, Weekly signals on Monday's and monthly on the first day of the new month. Price flips occur when a stock closes higher/lower than four previous closes and increases conviction of a price turn.
The upside 13's are sell signals and downside 13's are buy signals. Price flip's are confirmation signals that increases potential for a price trend change. For example, if you are long a stock and there is an upside 13, you will want to take cautious action by selling down or out of a position. If initiating a short sale with the upside 13's, we tend to start with a 1/2 size and add with the downside price flip. The opposite is true for when there are downside 13's. Take a 1/2 size position
and add with the upside price flip. The DeMark Indicators are designed to assist the user with buying into weakness and selling into strength to anticipate trend exhaustion. Selling into a rally and buying into a decline often afford the opportunity to exit a trade without too serious a loss if wrong.
S&P 500 Universe:
DAILY UPSIDE 13: JNPR, LB, MRK, VRSK
DAILY DOWNSIDE 13: CERN
DAILY UPSIDE WITH PRICE FLIP REVERSAL DOWN: PM, REG
DAILY DOWNSIDE WITH PRICE FLIP REVERSAL UP: DWDP
Updated: 10/26/18
WEEKLY UPSIDE 13: CME
WEEKLY DOWNSIDE 13: ALXN, AMG, BHF
Updated: 11/1/18
MONTHLY UPSIDE 13: ALXN, CINF, CRM, FFIV, JNJ, MSI, MTD, RTN, V, VRSK, XEL, YUM
MONTHLY DOWNSIDE 13: WHR
Euro Stoxx 600 Universe:
DAILY UPSIDE 13: BARN SW
DAILY DOWNSIDE 13: NONE
DAILY UPSIDE WITH PRICE FLIP REVERSAL DOWN: NONE
DAILY DOWNSIDE WITH PRICE FLIP REVERSAL UP: CARLB DC, EKTAB SS, ENGI FP, ITV LN, NDA SS, ONTEX BB, PSM GR, PUB FP
Updated: 10/26/18
WEEKLY UPSIDE 13: AZN LN, DRX LN, TOP DC
WEEKLY DOWNSIDE 13: BME SM, DANSKE DC, FPE3 GR, HSBA LN, KN, FP, PNL NA, SAN SM, VOE AV
Updated: 11/1/18
MONTHLY UPSIDE 13: NONE
MONTHLY DOWNSIDE 13: DBK GR, TPK LN
|
|
|
Unsubscribe me from Hedge Fund Telemetry
Hedge Fund Telemetry LLC, P.O. Box 4675, Greenwich, CT 06861, United States
CONFIDENTIALITY NOTE and DISCLAIMER: This message is for the named person's use only. It may contain confidential, proprietary or legally privileged material. No confidentiality or privilege is waived by any accidental or unintentional transmission. If you receive this message in error, please immediately delete it and all copies of it from your system, destroy any hard copies and notify the sender. You must not, directly or indirectly, use, disclose,
distribute, print or copy any part of this message if you are not the intended recipient. Hedge Fund Telemetry LLC. cannot guarantee the confidentiality of the material transmitted; therefore, information of a sensitive or confidential nature should not be transmitted. There is risk in trading markets. Hedge Fund Telemetry LLC reports are based on information gathered from various sources and believed to be reliable, but are not guaranteed as to accuracy and completeness. The information is subject to change without notice and Hedge Fund Telemetry LLC has no obligation to provide any updates or changes. Hedge Fund Telemetry LLC is providing this data for informational and educational purposes and does not believe that it is sufficient to base an investment decision on. This information should not be regarded as a solicitation or recommendation of any particular security or to engage in any trading strategy. One should always check with your licensed financial
advisor to determine suitability of any investments.
|
|
|
|
|