|
|
|
|
|
|
Five Things On My Mind Today
|
|
|
First, the bounce today in the global markets is seeing a fade in the US and notably with FANG stocks. I've recently highlighted some oversold conditions and factors present in the US markets yet there are some real differences with the February low when we called for a lower high bounce. The FANG stocks never got fully oversold in February and now they still look lower despite other areas being very oversold. Just as those stocks dragged the broad markets higher being the largest
mega weights, the opposite could be happening now. Very concerning for potential real downside dislocation with passive funds. Liquidity remains shallow on depth of book, buy the dip people continue to try but have quicker trigger fingers the more the bounces fail. The market never got a scary capitulation with this down move. I've raised lots of cash and took profits on shorts on the way down while having some optionality and defined risk being long November SPY and QQQ puts. Below I do a deep dive on all the major US sectors which illustrates continued risk absent DeMark signals.
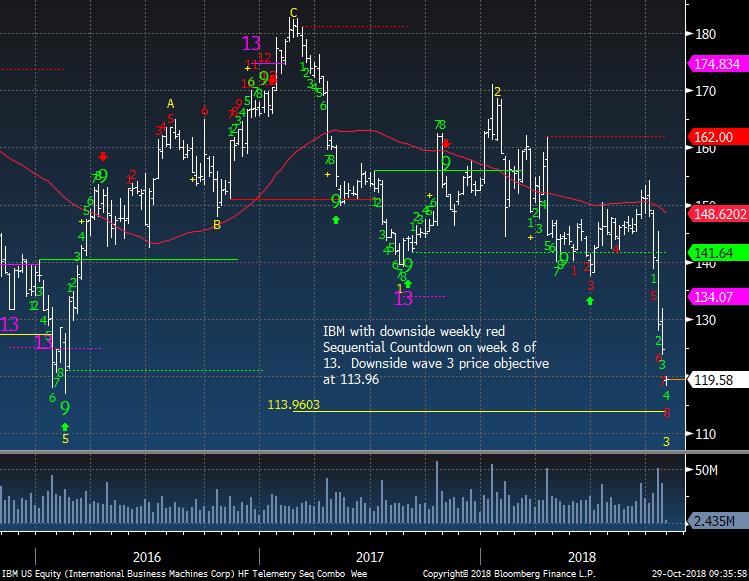
Second, IBM is late to try and buy "growth" with a ridiculous premium with what they are paying for Red Hat. Red Hat has been missing earnings for several quarters and has different model from IBM. In short they are open source while IBM has been more closed source developing proprietary software for clients. Maybe IBM is waving the white flag and trying to
catch up with competitors? Bottom line, they are overpaying for growth at the top of the cycle. I covered the IBM in the Trade Ideas Sheet as it hit my price objective. I would like to short it again if I can get a bounce. Is this the new GE?
Third, in Germany big news at Chancellor Angela Merkel will not stand for election as her party's head. Her term ends in 2021 and she wants to stay on but it wouldn't shock me to see her power continue to erode. She has been the most powerful European leader so obviously any changes will bring uncertainty. In Brazil, right wing populist Bolsonaro won as expected. His platform was based on reforms that included political corruption, economic weakness, and high crime. Seems obvious but can he pull it off with a global economy slowing? Going to be tougher and I believe the market has priced in the reforms being easier said than done.
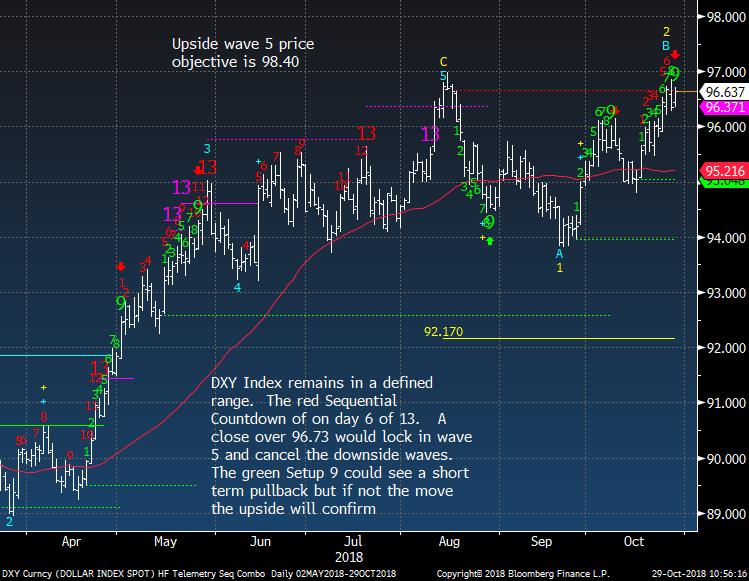
Fourth, I continue to see the USD moving higher but it
hasn't yet made a new high for the cycle.
Fifth, I am a long time LA Dodger fan who happened to be in Boston this weekend. I've had to watch my Dodgers lose two World Series in a row and it hurts. Congratulations to all my Boston friends. We'll be back.
- US Markets - Sentiment remains low but absent downside DeMark signals despite some oversold conditions
- Hedge Fund Telemetry Trade Ideas - Took some profits on a few more shorts and added back TSLA short
- Credit Spread Update - Widest in two years
- IBM - Anatomy of a successful short trade
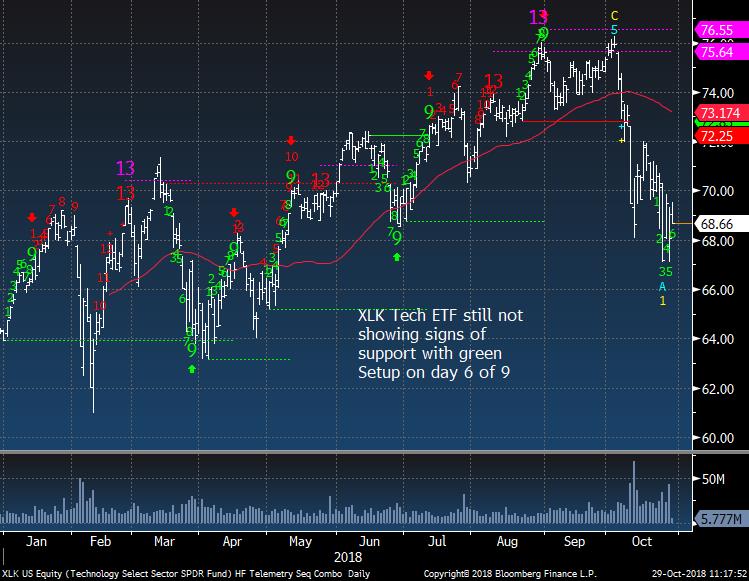
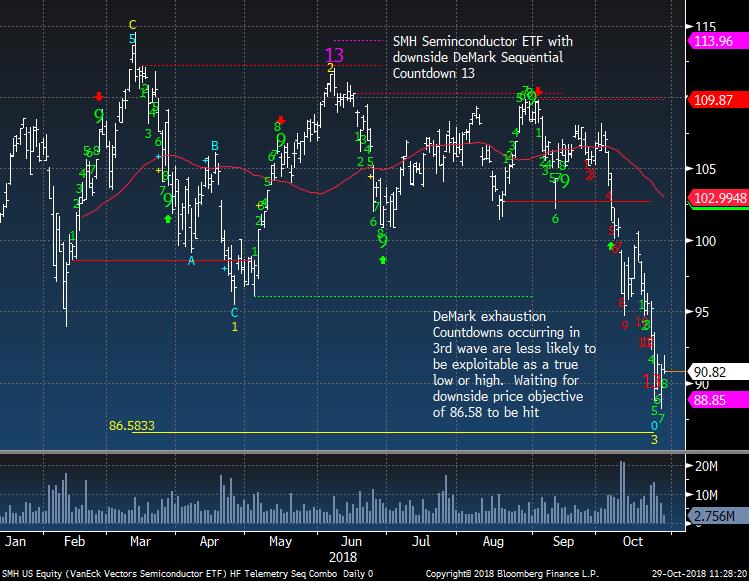
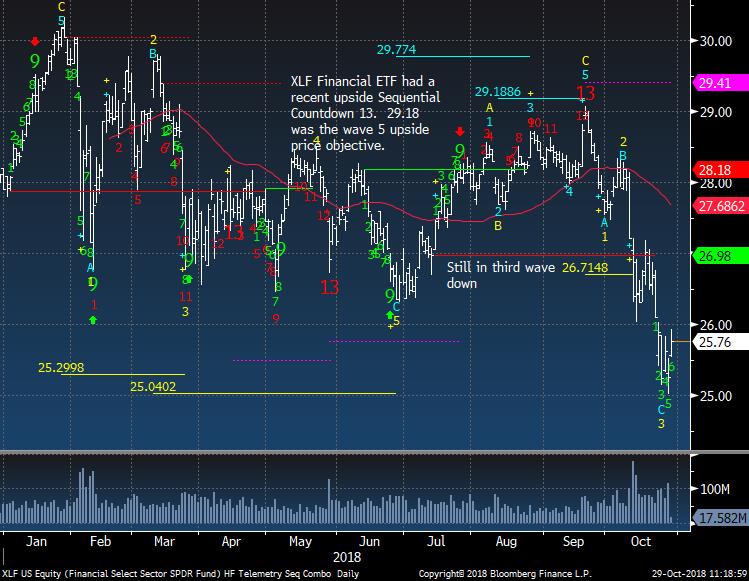
- US Sectors Deep Dive
- Tesla Update
- PPO Monitor - Percentage Price Oscillator Force Ranked Sector Rotation - How VWAP spots early weakness
- Bloomberg Technical Pattern Recognition
Screen
- Currency Update - Very important to watch the next two days
- European Market Update - A nice bounce but we've seen this too many times in the past year
- Global Market Update - Still risk to downside
- Asian Market Update - Still risk to downside
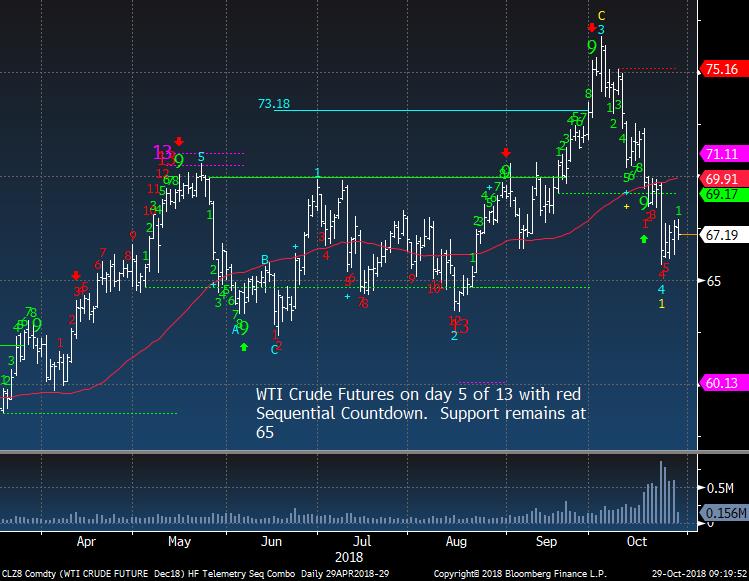
- Crude Update - Holding support
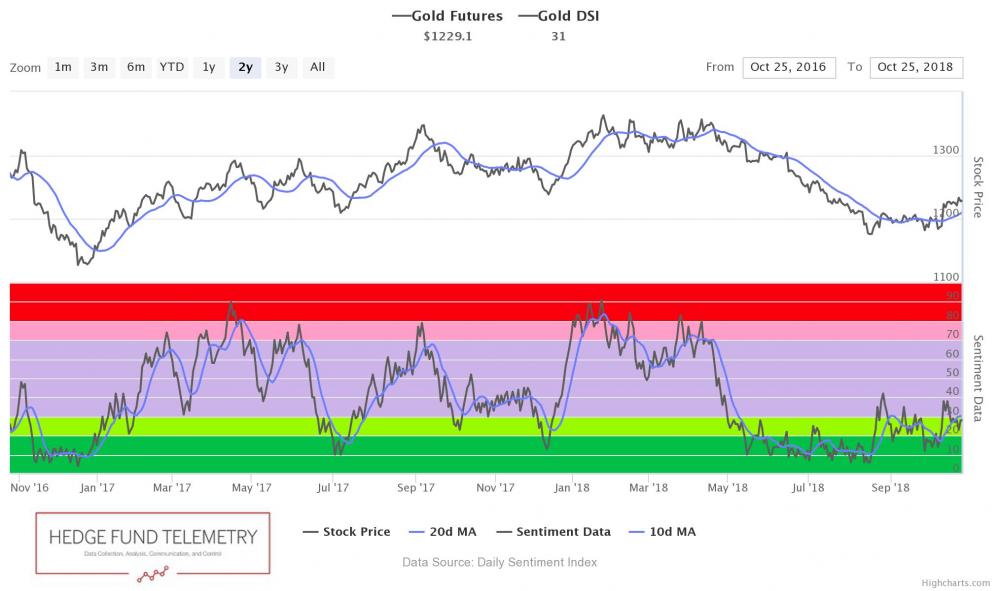
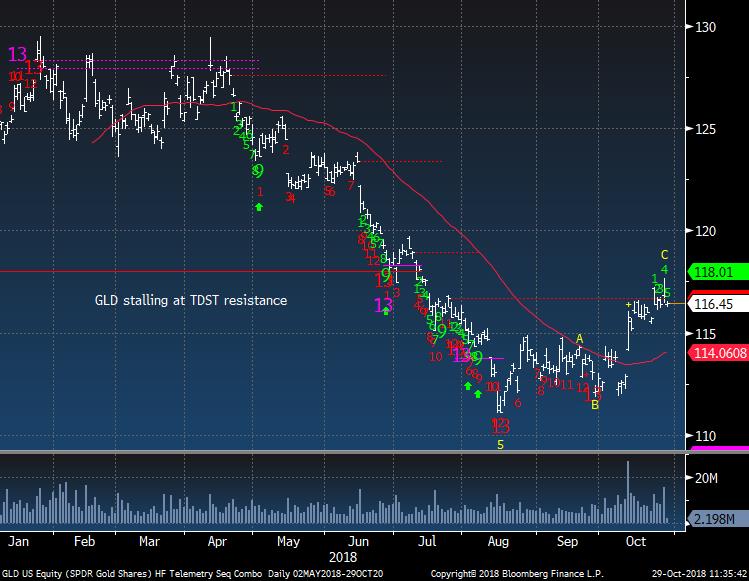
- Gold Update - Stalling
- Bond Update - Yields should work lower
- DeMark Screens - Daily, Weekly, Monthly upside/downside exhaustion signals within the S&P 500 and Euro Stoxx 600 Weekly data updated
|
|
|
|
|
Here's a link to the Hedge Fund Telemetry market sentiment page with 40 charts of sentiment including equities, bonds, currencies, and commodities updated each day. When the new website launches we will be adding new charts and historical sentiment data for Euro Stoxx 50, UK FTSE 100, German DAX, French Cac 40. We will be adding Japanese Bonds, German Bunds, and a few more.
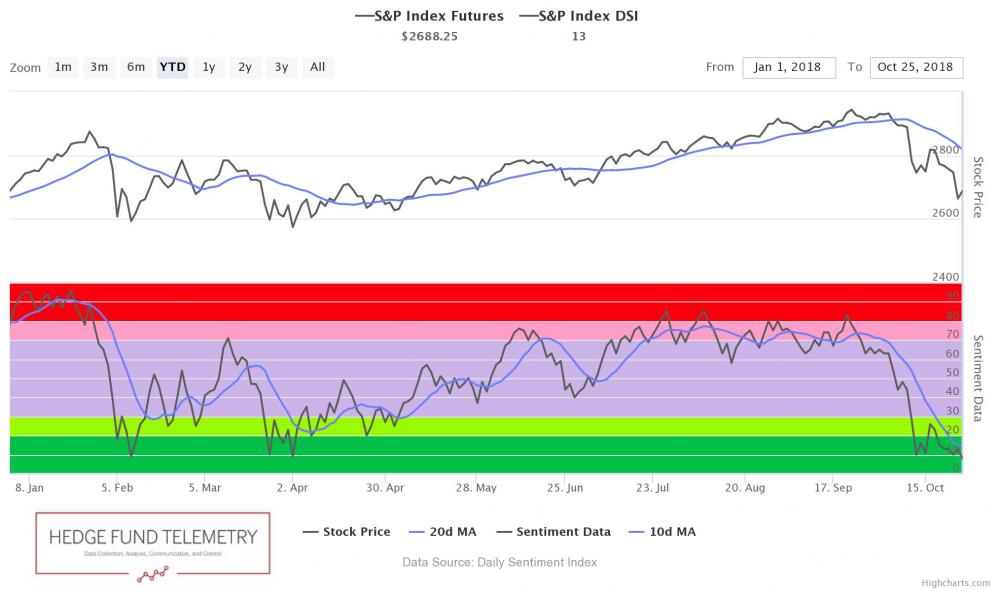
SPX bullish sentiment is at 13%
|
|
|
|
|
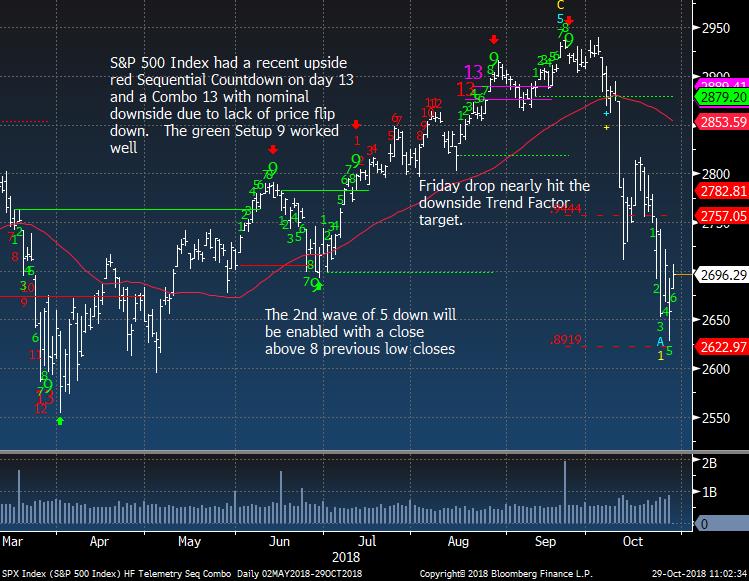
SPX daily had a green Setup 9 at February lows which was consistent across indexes and sectors. Not there yet.
|
|
|
|
|
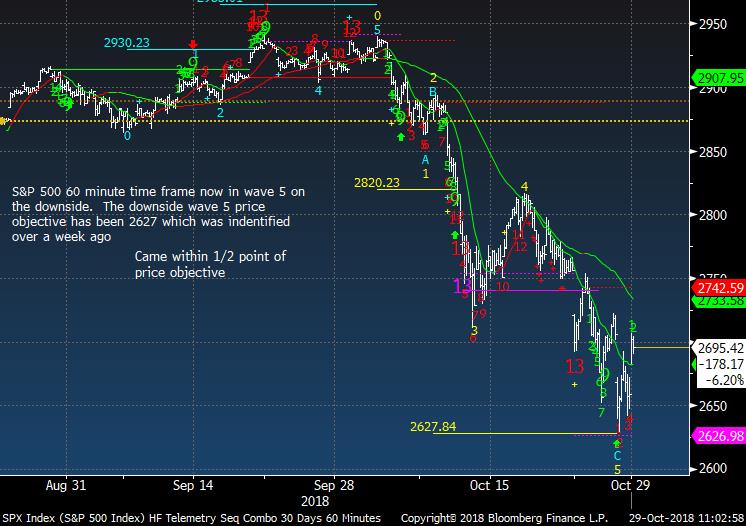
SPX 60 minute tactical time frame still chopping around
|
|
|
|
|
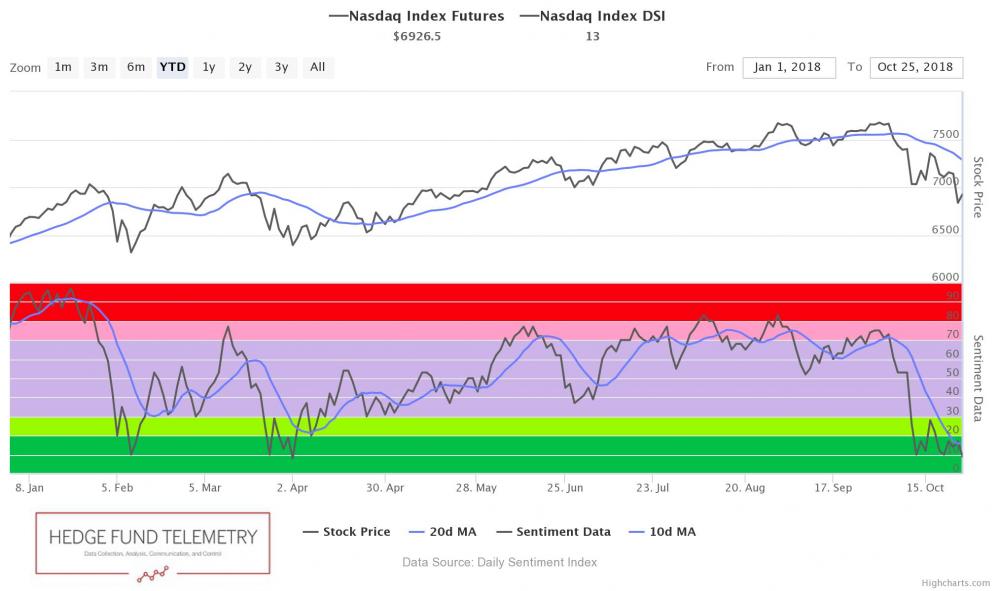
Nasdaq bullish sentiment is at 13%
|
|
|
|
|
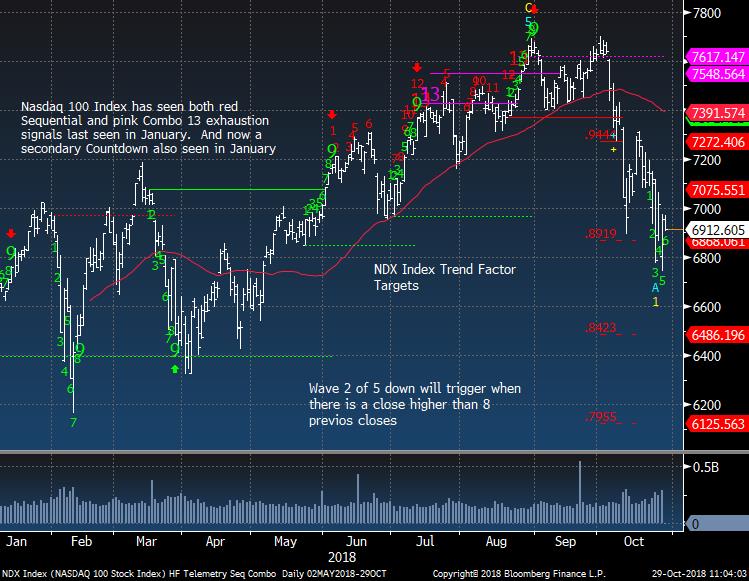
NDX Index could test February lows in a quick down move if recent lows are taken out
|
|
|
|
|
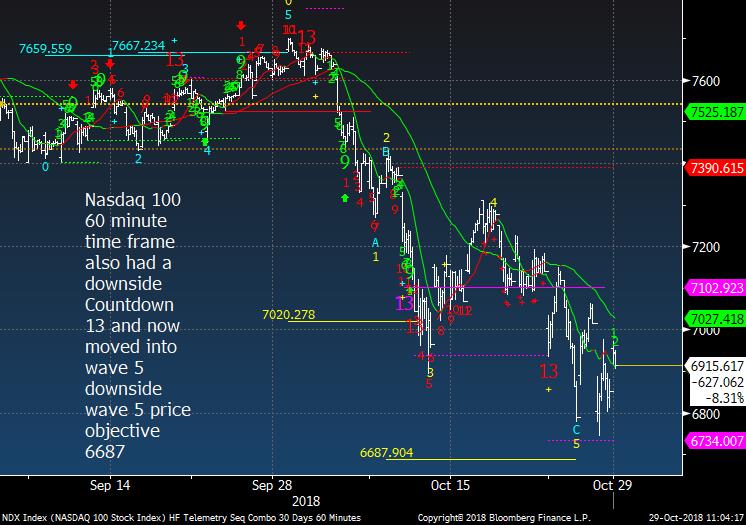
NDX 60 minute tactical time frame chopping around
|
|
|
|
|
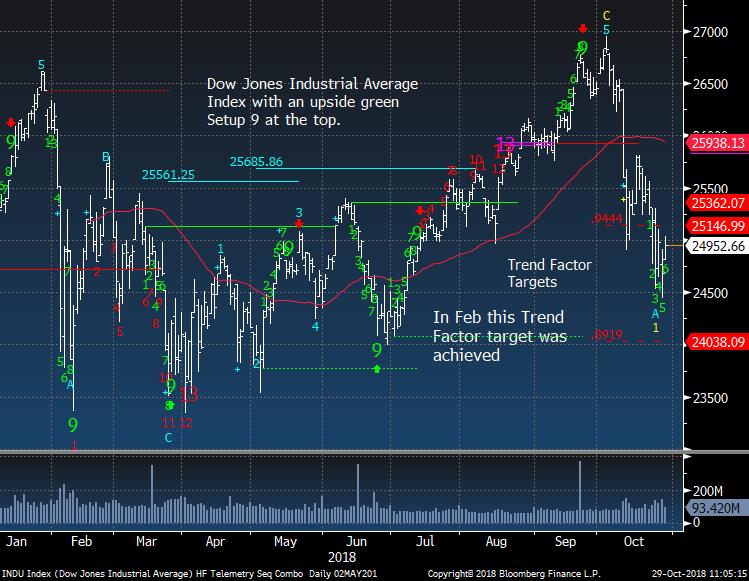
Dow Jones Industrial Average still well above June lows
|
|
|
|
|
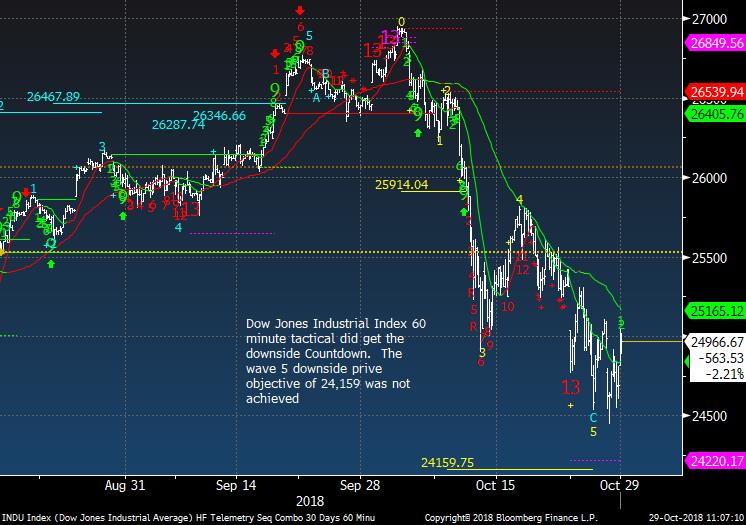
Dow 60 minute tactical chopping around above wave 5 price objective
|
|
|
|
|
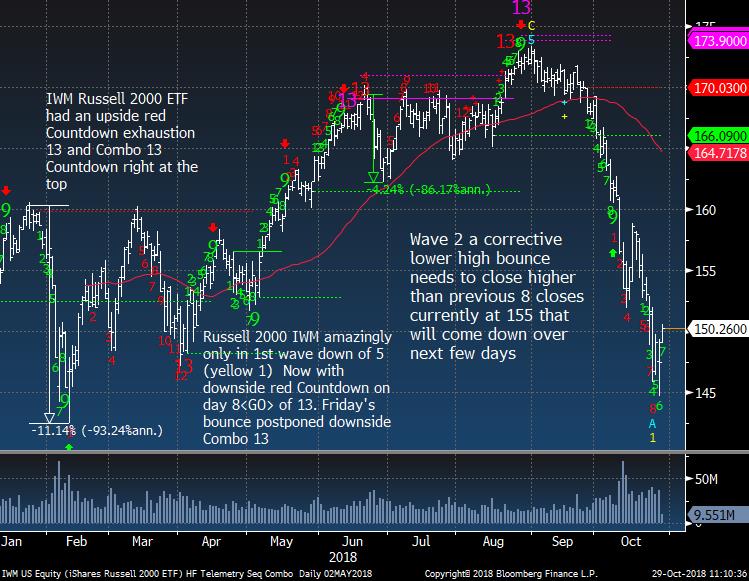
IWM Russell nearly gave everything back to February lows. The pink Combo that I showed Friday did not stick since IWM bounced on Friday
|
|
|
|
|
|
|
Hedge Fund Telemetry Trade Ideas
|
|
|
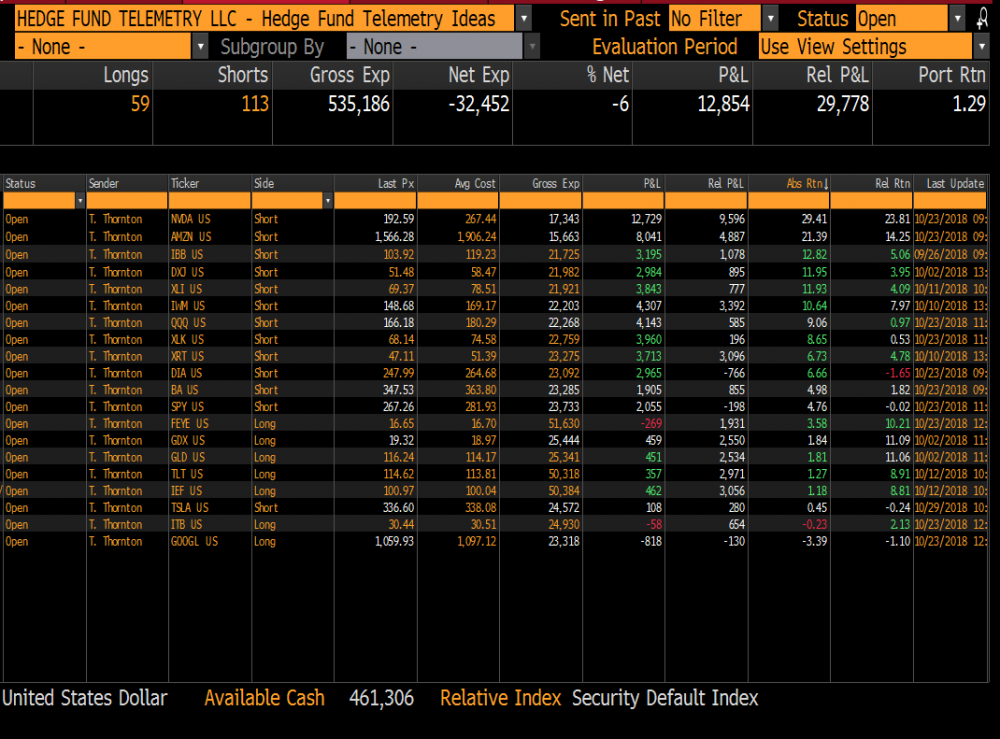
Trade Ideas Sheet - Long and short US equity ideas including ETF's. We will be overhauling the Trade Ideas Sheets for long only, short only, ETF's when the new website rolls out soon. There will also be a clearer email distribution with changes.
Trade Ideas Changes: COVERED SHORTS: IBM +13.5%, NFLX +10%, NSC +11%. ADDED SHORT: TSLA 2.5% WITH 360 STOP
Stops on everything. TSLA 360, GDX 17.35 , FEYE 16.00, NVDA 235, QQQ 179, XLK 75, SPY 285, XLY 113, XRT 50, IWM 163, DIA 260, XLI 77 IBB 116, AMZN 1860 DXJ 56 , GLD 111, IEF 98 TLT 112 , BA 370, (RECENTLY ADJUSTED STOPS) GOOGL 1000, ITB 28
|
|
|
|
|
|
|
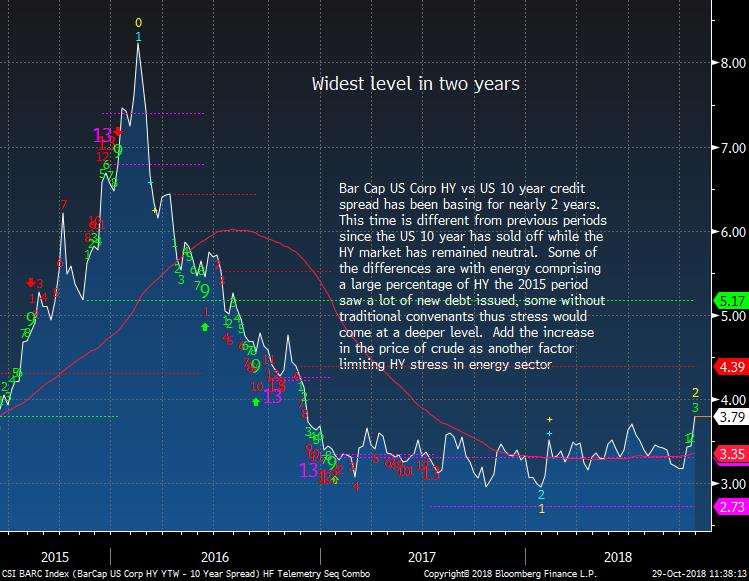
Credit Spreads - Update widest levels in two years
|
|
|
Credit spreads weekly still in check but my view is to watch out in coming weeks for these to blow out
|
|
|
|
|
|
|
IBM - Anatomy of a successful short trade
|
|
|
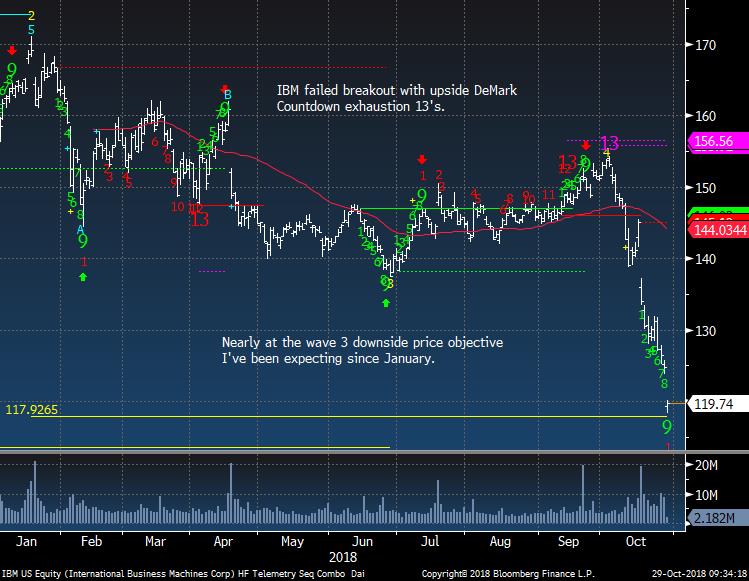
IBM daily recently had upside DeMark exhaustion signals and when I see these at "breakout levels" the breakouts tend to fail.
|
|
|
|
|
Weekly has made lower highs and now lower lows. Is IBM the new GE? Lot's of increased debt, no growth, buying expensive assets at top of cycle, suspending buy back?
|
|
|
|
|
|
|
|
|
|
|
|
|
|
|
|
|
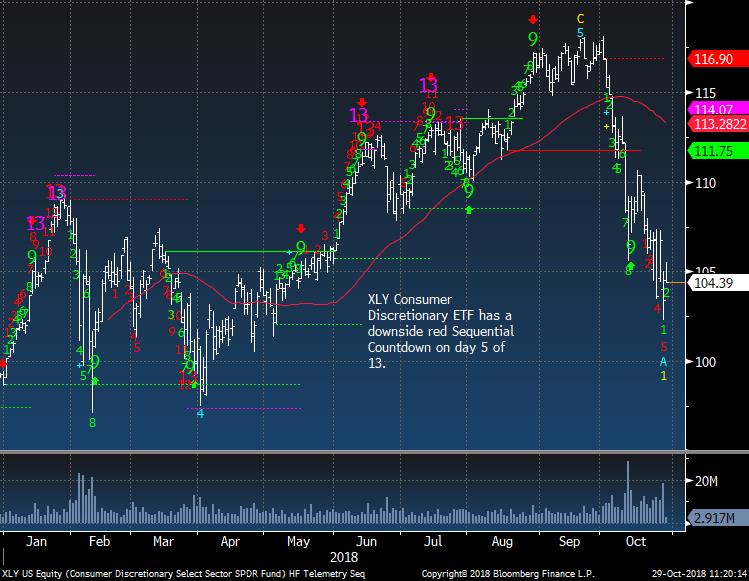
XLY Consumer Discretionary
|
|
|
|
|
|
|
|
|
|
|
|
|
|
|
|
|
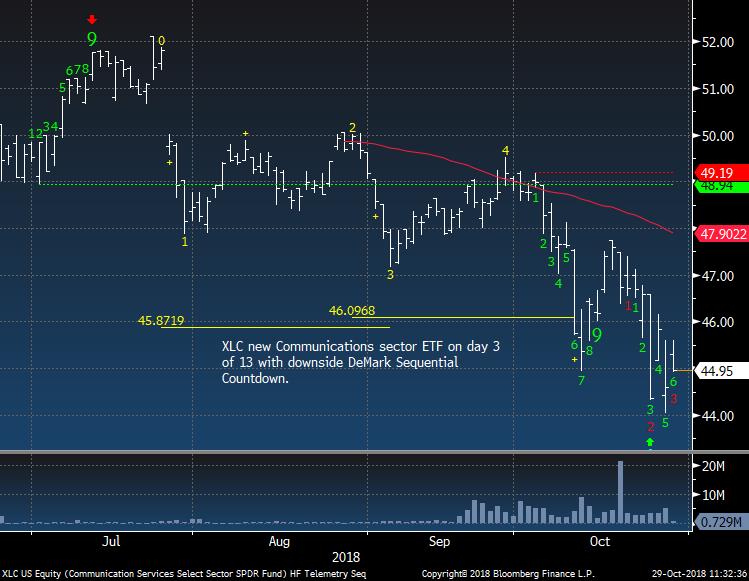
XLC Communications - New ETF
|
|
|
|
|
|
|
|
|
|
|
|
|
|
|
|
|
|
|
|
|
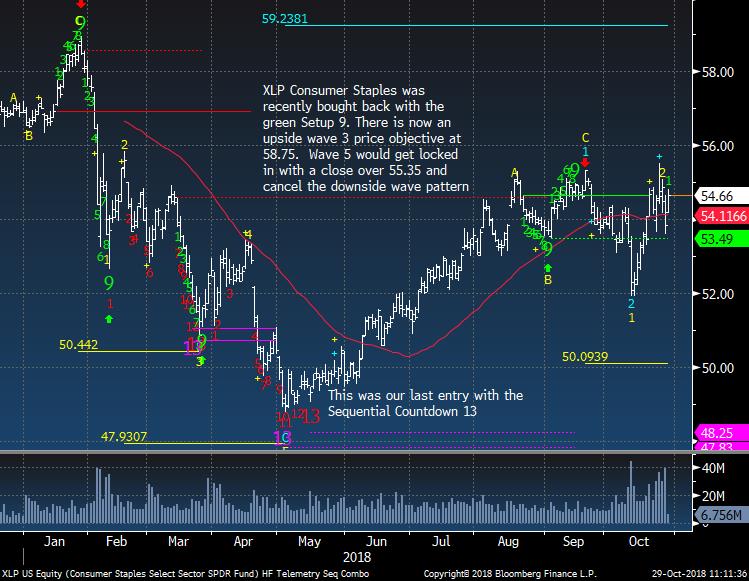
XLP Staples - Looks OK on long side if you want to hide in some defensive high dividend paying stocks
|
|
|
|
|
|
|
|
|
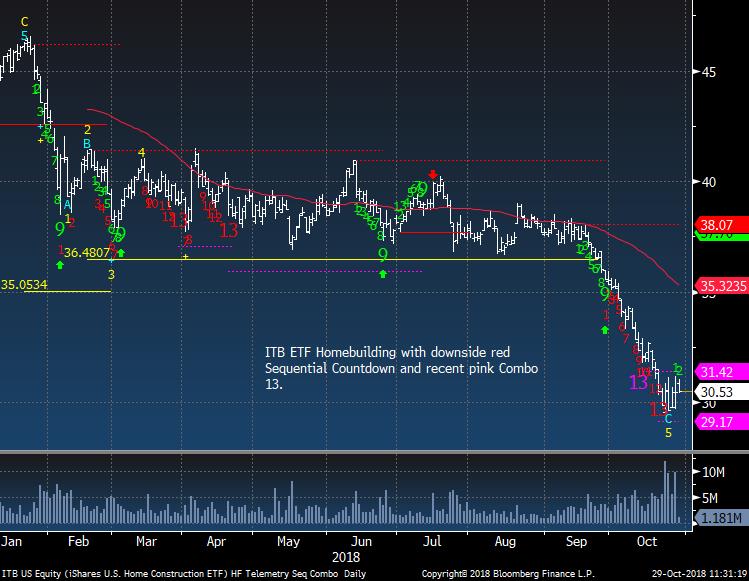
ITB Homebuilding recent downside exhaustion signals and very oversold. I'm holding a small long here
|
|
|
|
|
|
|
|
|
|
|
|
|
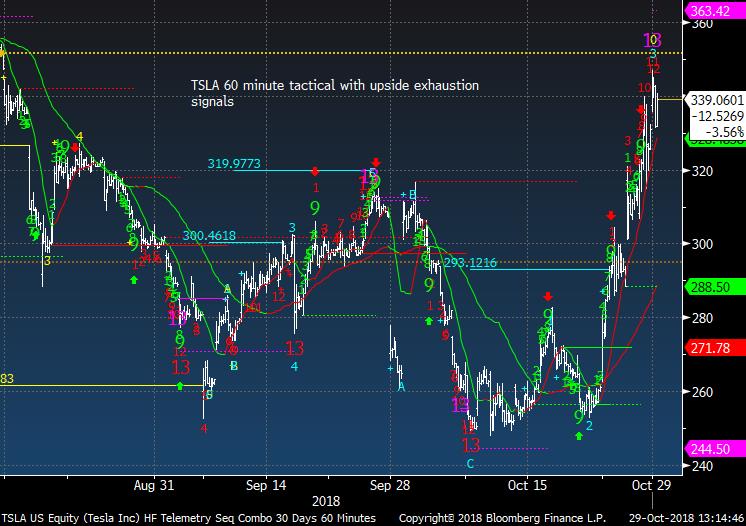
Adding back a small short in Tesla with upside exhaustion signals on 60 minute tactical chart
|
|
|
|
|
|
|
PPO Monitor - Percentage Price Oscillator
|
|
|
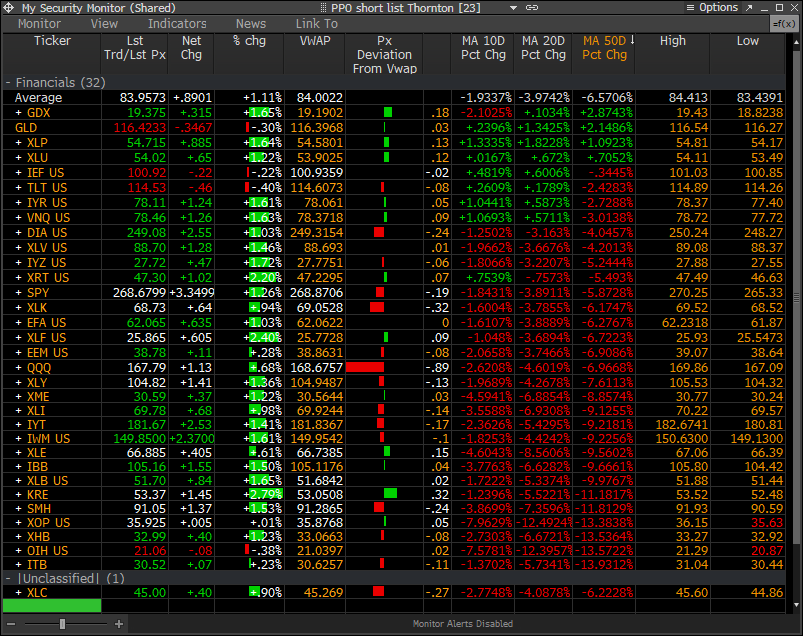
The PPO Monitor is a proprietary monitor developed to force rank Indexes, Sectors, and Stocks. It ranks top down by strongest to weakest by percentage above/below the 50 day moving average. Shorter term signals can be seen when the 10 and 20 day moving averages turn up (green) or down (red) which often are followed by the 50 day moving average. This is useful to watch for historically overbought/oversold percentage above/below the 50 day moving average. It is
non correlated with the DeMark Indicators however we have found upside/downside exhaustion signals often occur when something rises to the top or drifts to the bottom of the monitor - increasing the timing aspect. We share this monitor with clients with Bloomberg Terminals. An added feature is that each market/ETF can be expanded with each component force ranked in the same way. A couple other features include price deviation from intraday VWAP (useful for intraday reversals) and new 20 day highs/lows on right side. Please inquire if you would like to be permissioned to use the PPO Monitor.
Today's highlights: Here is the early look on the PPO. Notice a lot of sectors were under VWAP while prices were very green
|
|
|
|
|
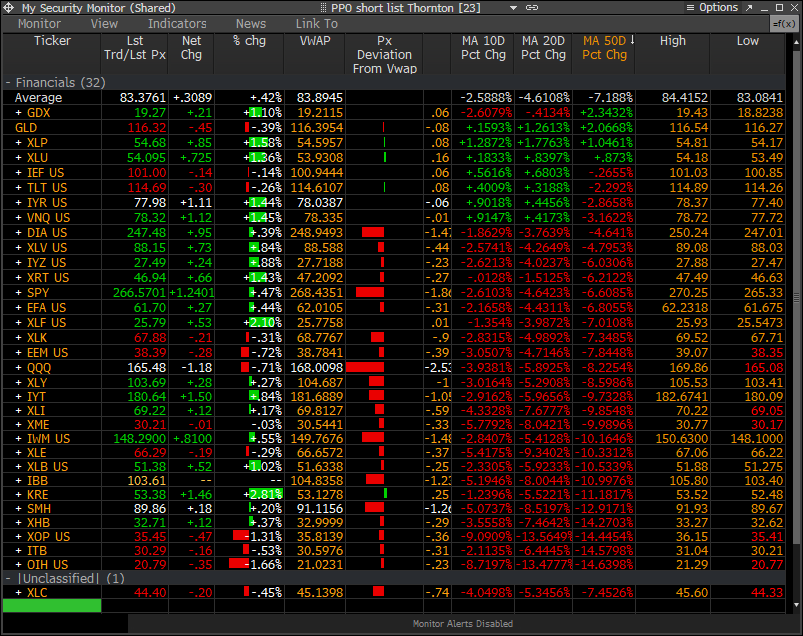
Here's the PPO a little while later. Under VWAP further and gains eroded too
|
|
|
|
|
|
|
Bloomberg Automated Technical Pattern Recognition Screens
|
|
|
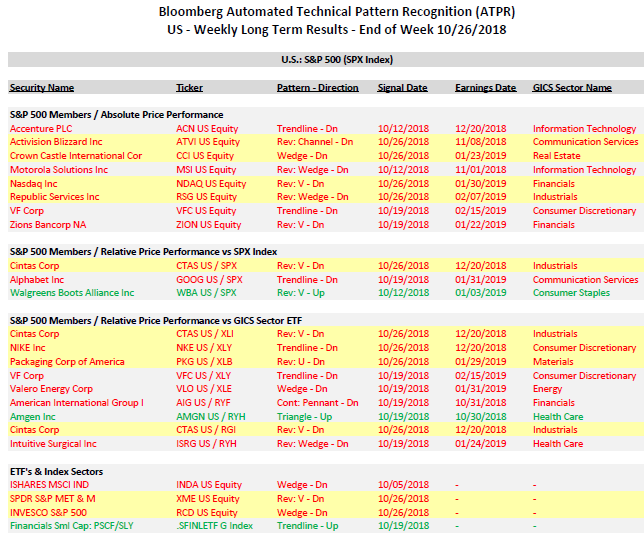
S&P 500 Members/Absolute Price Performance and Relative Price Performance vs S&P 500 and Sector ETF's. ETF's vs Index Sectors. Pair Trades. Long side is first symbol, short side is second symbol. If you would like a PDF from Bloomberg with full details of how this is formulated, please email. We will be doing a webinar in the coming weeks specifically on this system.
|
|
|
|
|
|
|
|
|
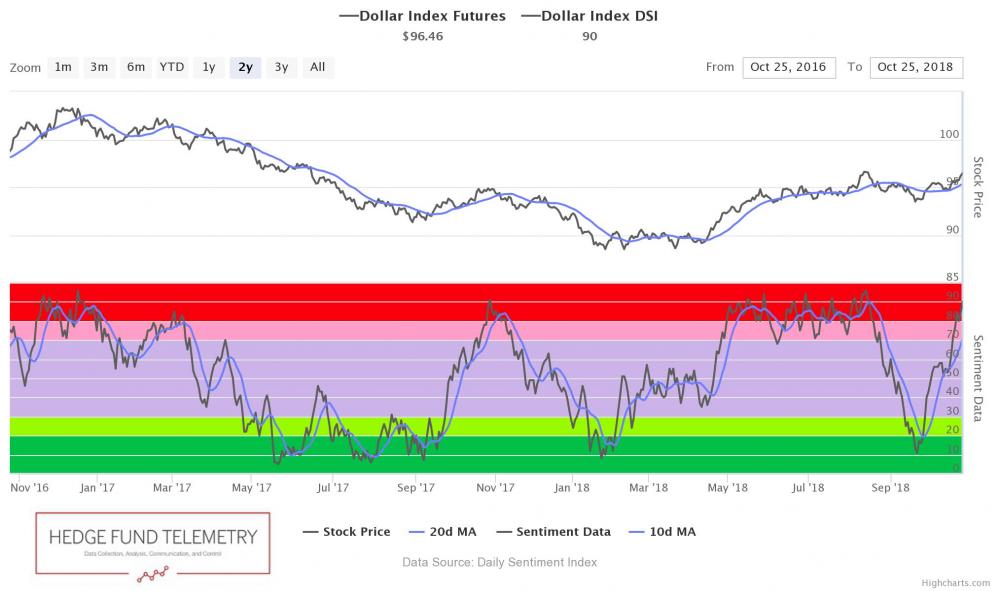
US Dollar bullish sentiment is at 90% still extreme
|
|
|
|
|
US Dollar Index with green Setup could see a little dip but if not then look out to the upside
|
|
|
|
|
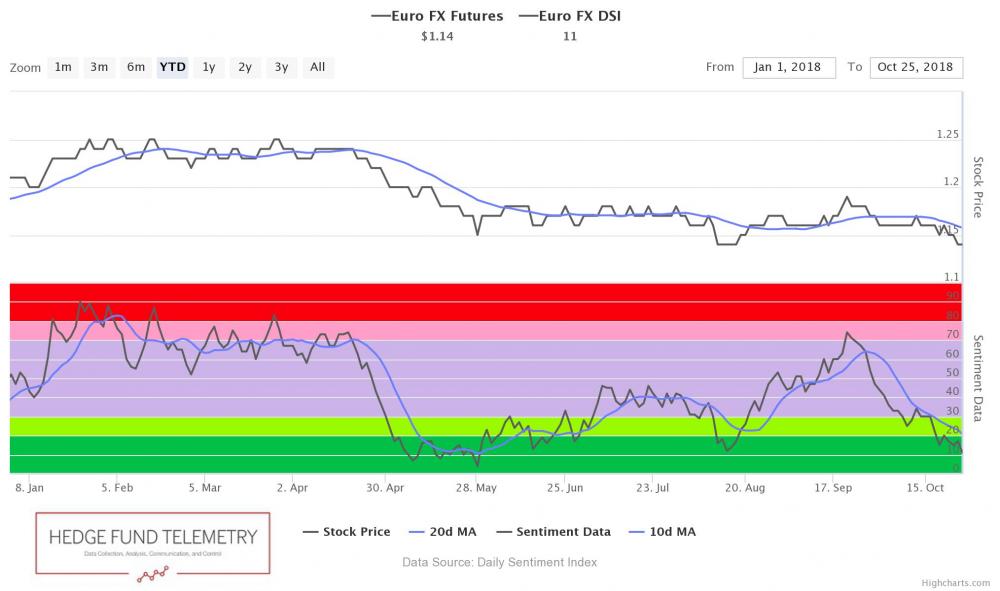
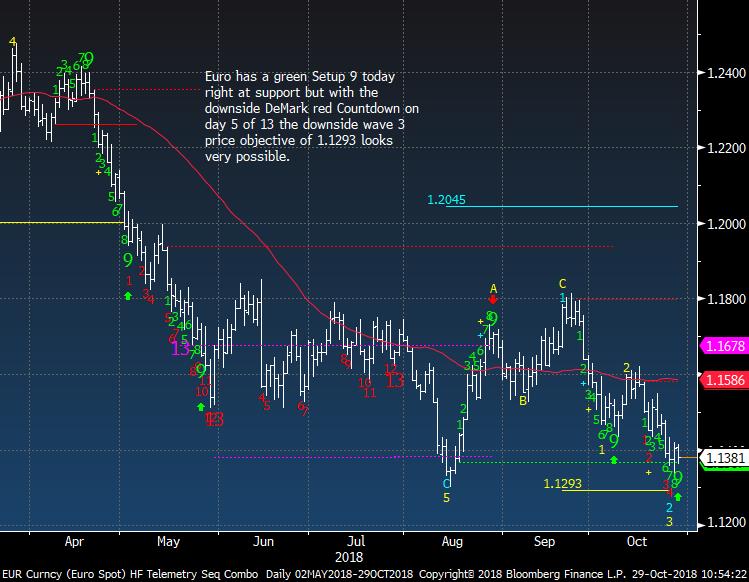
Euro bullish sentiment is at 11%
|
|
|
|
|
|
|
|
|
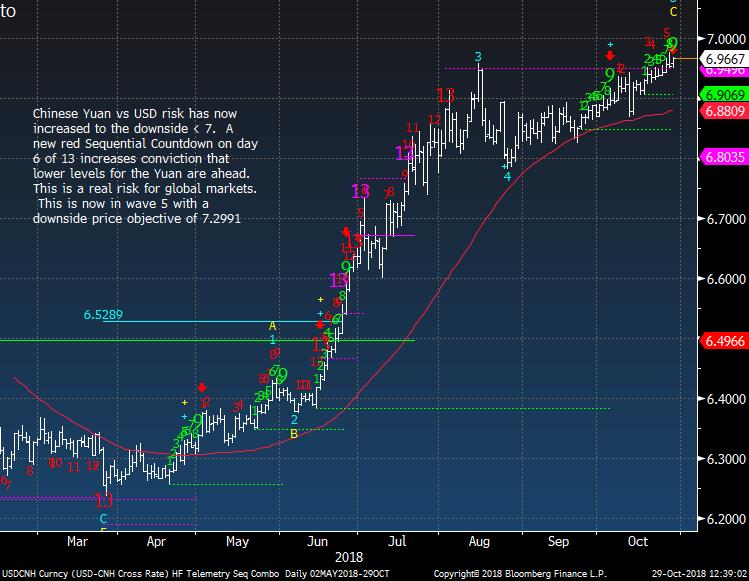
Yuan same story but still getting closer under 7 which will have alarm bells ringing loudly around the world
|
|
|
|
|
|
|
|
|
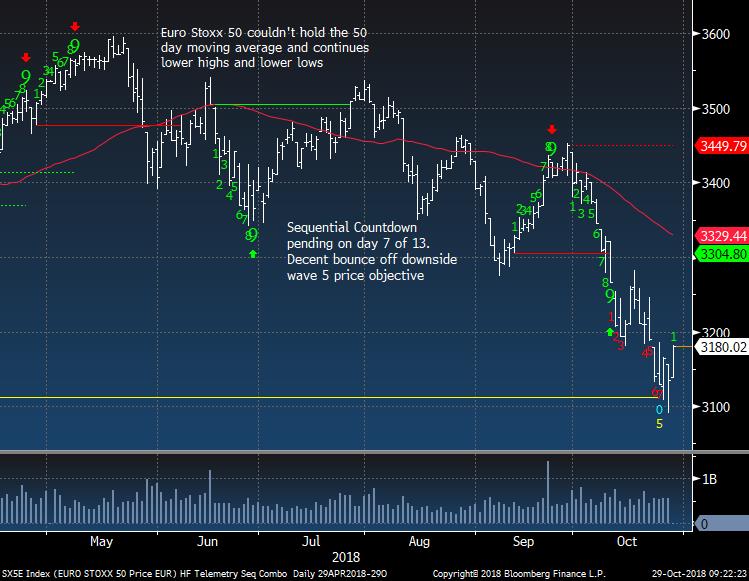
Euro Stoxx 50 nice bounce but seen this too many times in the past months
|
|
|
|
|
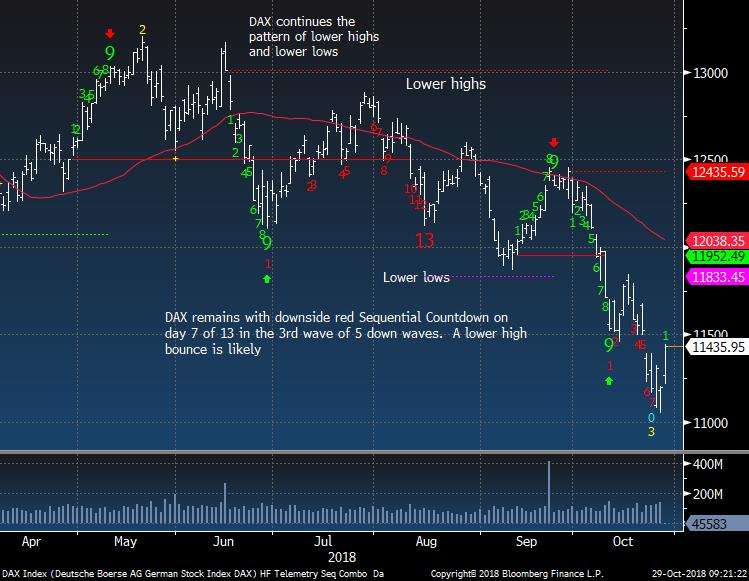
German DAX same story and this is in wave 3 of 5 on the downside
|
|
|
|
|
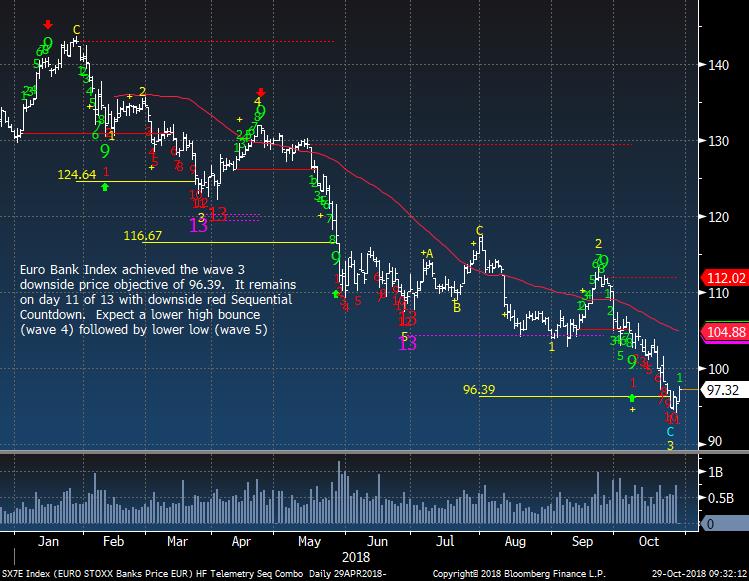
Euro Bank Index holding wave 3 price objective
|
|
|
|
|
|
|
|
|
|
|
|
|
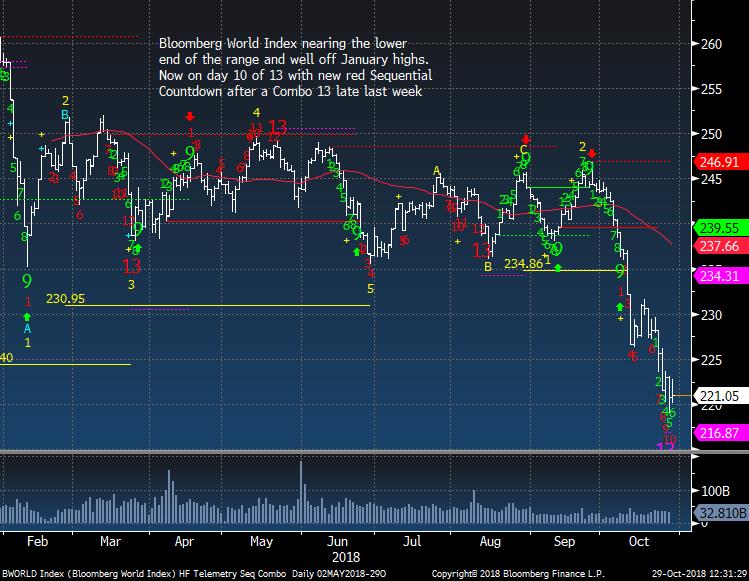
Bloomberg World Index still weak with some downside exhaustion signals nearing
|
|
|
|
|
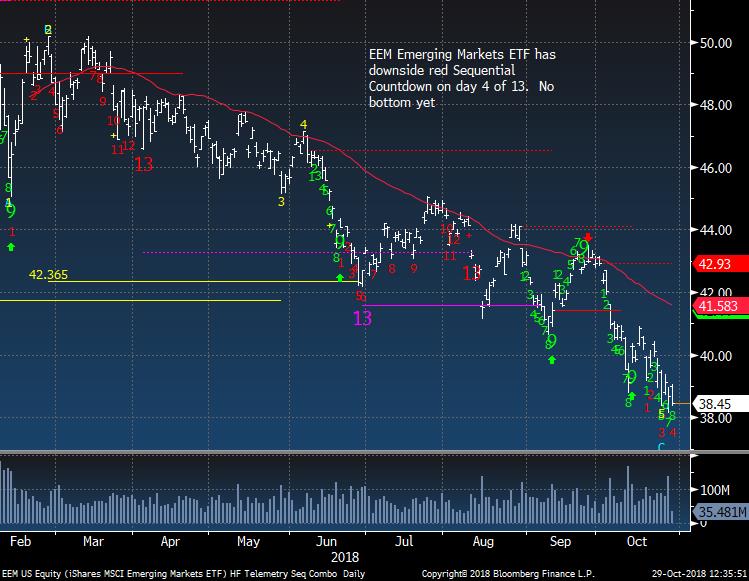
EEM Emerging Markets ETF does not look like a bottom is near
|
|
|
|
|
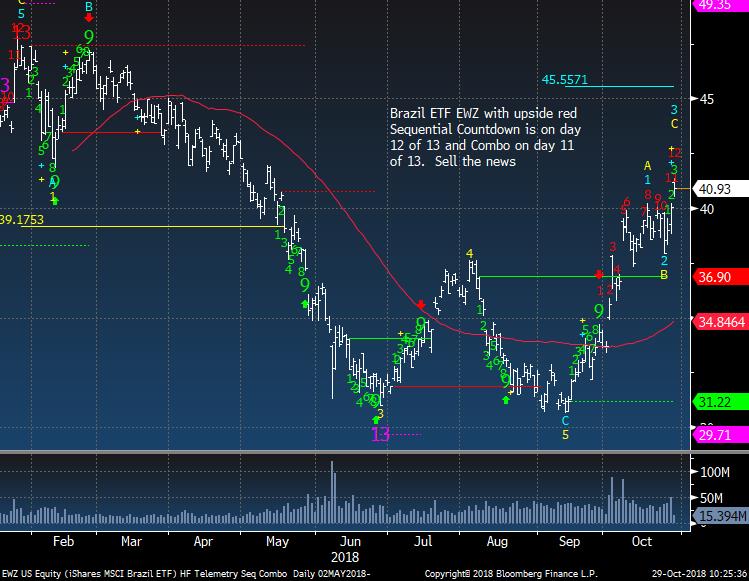
Brazil nearing upside exhaustion. Sell the news
|
|
|
|
|
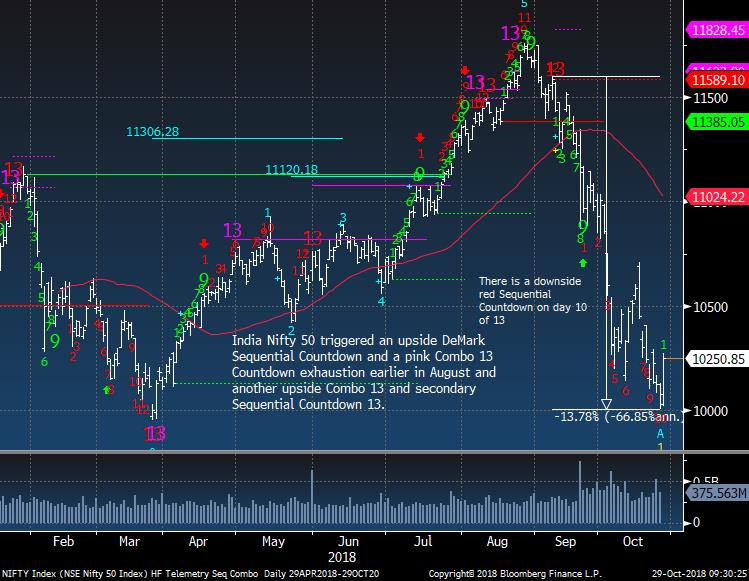
India Nifty 50 nice bounce but not done yet
|
|
|
|
|
|
|
|
|
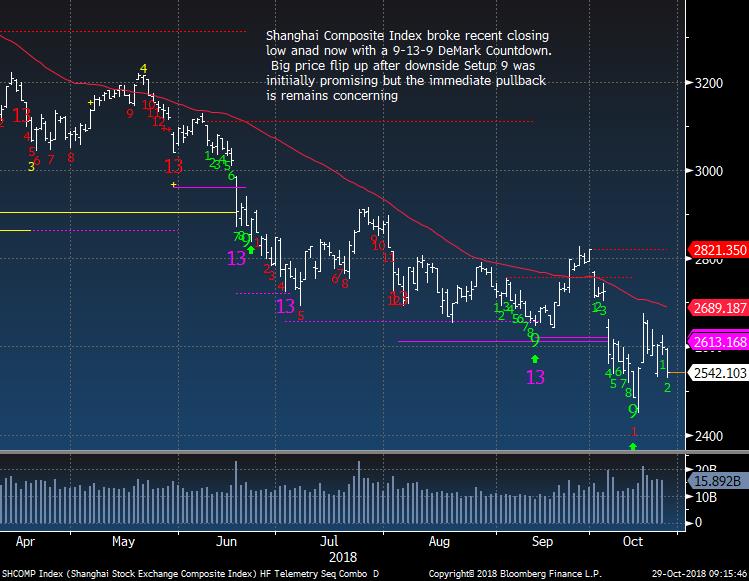
Shanghai with another weak session yesterday
|
|
|
|
|
|
|
|
|
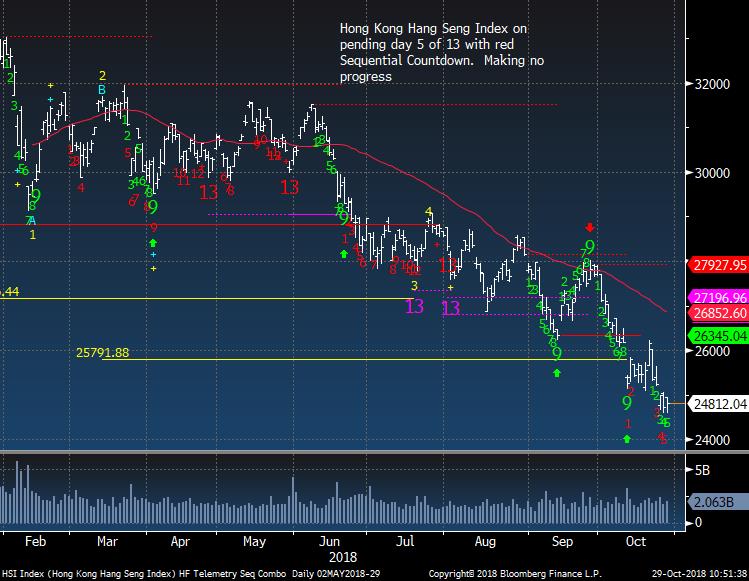
Hong Kong really weak still
|
|
|
|
|
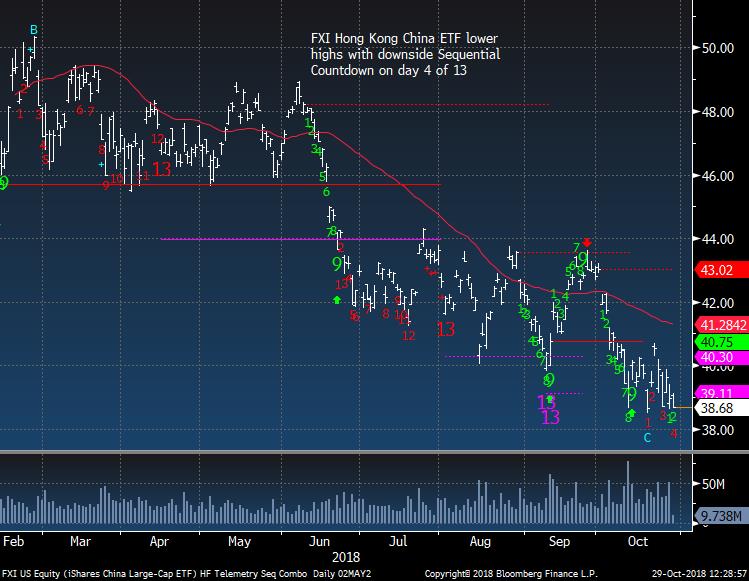
China / Hong Kong FXI ETF near new lows
|
|
|
|
|
|
|
|
|
WTI Crude Futures bullish sentiment is at 69% and holding support for now
|
|
|
|
|
|
|
|
|
Gold bullish sentiment is at 31%
|
|
|
|
|
|
|
|
|
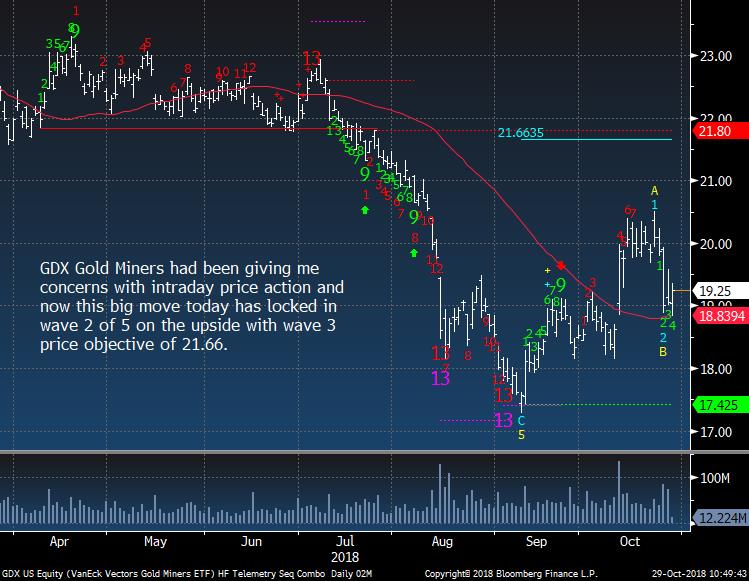
Gold Miners GDX ETF holding 50 day and I'm raising my stop to 18
|
|
|
|
|
|
|
|
|
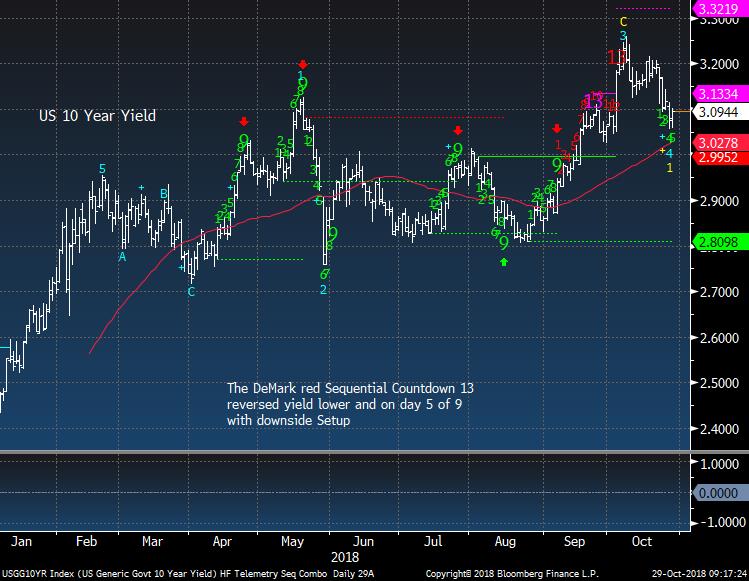
US 10 Year Yield bullish sentiment is at 59% and increasing. I expect lower yields ahead
|
|
|
|
|
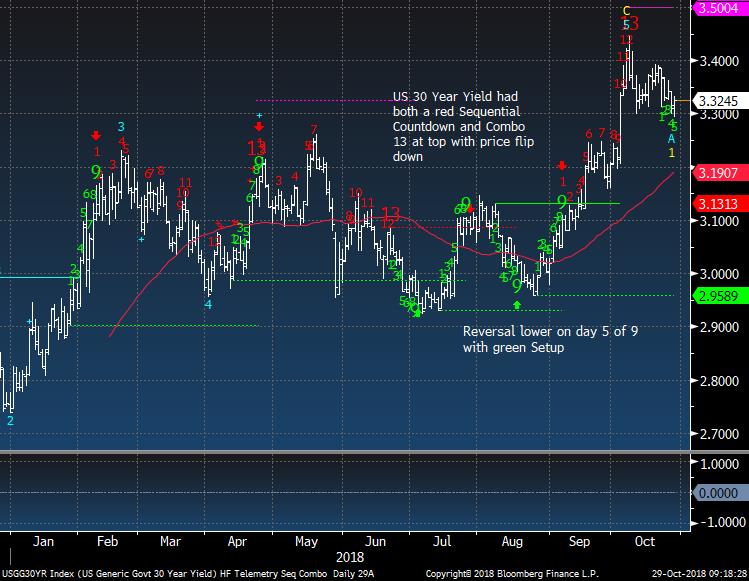
US 30 Year Yield could work to 50 day at 3.19. There is potential for a move all the way back to 2.95 too
|
|
|
|
|
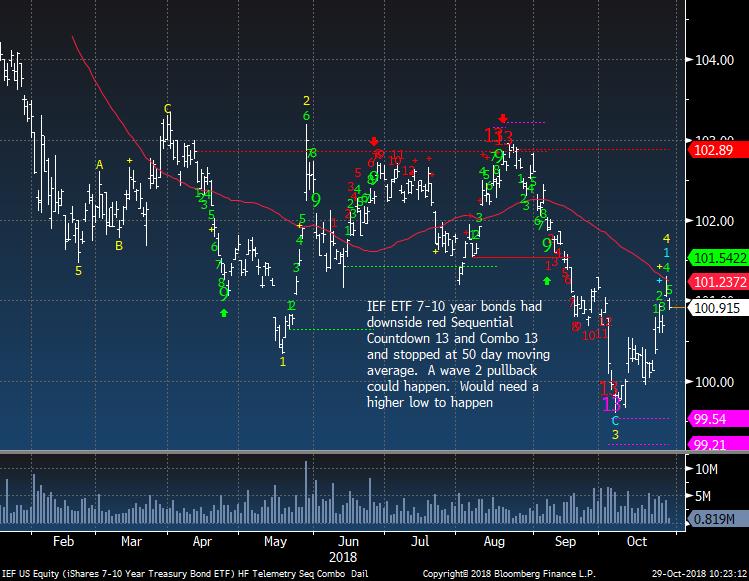
IEF ETF stalled at 50 day
|
|
|
|
|
|
|
DEMARK SCREENS - Daily, Weekly, Monthly Upside/Downside Exhaustion Signals
|
|
|
Daily/Weekly DeMark upside/downside exhaustion signals (Sequential) updated daily, Weekly signals on Monday's and monthly on the first day of the new month. Price flips occur when a stock closes higher/lower than four previous closes and increases conviction of a price turn.
The upside 13's are sell signals and downside 13's are buy signals. Price flip's are confirmation signals that increases potential for a price trend change. For example, if you are long a stock and there is an upside 13, you will want to take cautious action by selling down or out of a position. If initiating a short sale with the upside 13's, we tend to start with a 1/2 size and add with the downside price flip. The opposite is true for when there are downside 13's. Take a 1/2 size position
and add with the upside price flip. The DeMark Indicators are designed to assist the user with buying into weakness and selling into strength to anticipate trend exhaustion. Selling into a rally and buying into a decline often afford the opportunity to exit a trade without too serious a loss if wrong.
S&P 500 Universe:
DAILY UPSIDE 13: PM
DAILY DOWNSIDE 13: LOW, NWL, SNPS, SRCL
DAILY UPSIDE WITH PRICE FLIP REVERSAL DOWN: NONE
DAILY DOWNSIDE WITH PRICE FLIP REVERSAL UP: LEN
Updated: 10/29/18
WEEKLY UPSIDE 13: CME
WEEKLY DOWNSIDE 13: ALXN, AMG, BHF
Updated: 10/1/18
MONTHLY UPSIDE 13: ADSK, ALL, CCI, CME, DE, DLR, DTE, ETN, GLW, HPQ, INTU, PH, TPR, TXT, UPS, XLNX
MONTHLY DOWNSIDE 13: NONE
Euro Stoxx 600 Universe:
DAILY UPSIDE 13: NONE
DAILY DOWNSIDE 13: INF LN, JM SS, WMH LN
DAILY UPSIDE WITH PRICE FLIP REVERSAL DOWN: NONE
DAILY DOWNSIDE WITH PRICE FLIP REVERSAL UP: CRH ID, IMI LN, INCH LN
Updated: 10/29/18
WEEKLY UPSIDE 13: AZN LN, DRX LN,
TOP DC
WEEKLY DOWNSIDE 13: BME SM, DANSKE DC, FPE3 GR, HSBA LN, KN, FP, PNL NA, SAN SM, VOE AV
Updated: 10/1/18
MONTHLY UPSIDE 13: BNZL LN, EXPN LN, FPE3 GR, SBMO NA, SECUB SS, SWEDA SS
MONTHLY DOWNSIDE 13: BAYN GR, HMB SS, TEF SM
|
|
|
Unsubscribe me from Hedge Fund Telemetry
Hedge Fund Telemetry LLC, P.O. Box 4675, Greenwich, CT 06861, United States
CONFIDENTIALITY NOTE and DISCLAIMER: This message is for the named person's use only. It may contain confidential, proprietary or legally privileged material. No confidentiality or privilege is waived by any accidental or unintentional transmission. If you receive this message in error, please immediately delete it and all copies of it from your system, destroy any hard copies and notify the sender. You must not, directly or indirectly, use, disclose,
distribute, print or copy any part of this message if you are not the intended recipient. Hedge Fund Telemetry LLC. cannot guarantee the confidentiality of the material transmitted; therefore, information of a sensitive or confidential nature should not be transmitted. There is risk in trading markets. Hedge Fund Telemetry LLC reports are based on information gathered from various sources and believed to be reliable, but are not guaranteed as to accuracy and completeness. The information is subject to change without notice and Hedge Fund Telemetry LLC has no obligation to provide any updates or changes. Hedge Fund Telemetry LLC is providing this data for informational and educational purposes and does not believe that it is sufficient to base an investment decision on. This information should not be regarded as a solicitation or recommendation of any particular security or to engage in any trading strategy. One should always check with your licensed financial
advisor to determine suitability of any investments.
|
|
|
|
|