|
|
|
|
|
|
Three Car Monte - Model 3, X, and S
|
|
|
Earnings season always brings surprises both on the upside and downside. It was never one of my favorite times when trading at my hedge fund. One could have done a ton of work of what to expect from fundamentals, technicals, and positioning and still get it wrong. Tesla, the most entertaining company hedge funds are watching, reported last night a "blowout" "historic" quarter in which I believe it was due to a slight of accounting hand tricks. Let's call the earnings report "Three Car
Monte". Of course, Three Card Monte is a three card trick that simply cons a victim into betting a sum of money, on the assumption that they can find the "money card" among three face-down playing cards. There are also shills who conspire with the dealer and "win" a few times making it look easy for the victim. I believe the Tesla report has numerous accounting red flags and considering the stock popped and has faded, people may be questioning how honest and sustainable was this blowout earnings report. And don't forget the chief accounting officer quit after working at Tesla for a month ahead of this earnings blowout! If this seems like I might be overreacting just remember in August when Elon Musk fraudulently tweeted "Funding Secured." There is nothing he won't do to con people to keep Tesla afloat. I run down a few red flags below. I will remain short with the 2.5% sized position using a 325 stop.
Today's bounce in the markets is a welcome relief for many and I'm glad I reduced my very overweight net short exposure a couple days ago. I now expect a lower high bounce in the coming days and if this does not happen the downside move could be substantial breaking recent support. Microsoft had a good report as expected and tonight Amazon and Alphabet will report likely decent numbers too. I'm a little concerned with Amazon as the beat might not be as strong with the anniversary of the Whole Foods acquisition so there could be a top line slowdown. AWS growth should be flat at 50% and advertising remains strong but watch out for cost headwinds such as higher wages, USPS rates, shipping and freight costs. A lot is riding on Amazon too from a market perspective as it remains the largest attribute
within the Nasdaq 100 YTD. The stock still has relatively low short interest with 1% of the float is short. The options implied move is 8.5% with the average move the next day of 7%. Alphabet needs to have a clean number with core margins holding up after last quarter's 400bps decline due to investments in cloud, You Tube and Waymo. I like the stock here but I can't say I'm very confident to add more than a 2.5% weight.
Sorry for the late note today. I've been on some client calls going over markets as well I just completed a new Real Vision Think Tank written piece that will be out in a few days. I'm very excited to show the new sentiment charts below which once we launch the new site (I know, I know it's taking forever) you will be able to look at various time frames going back to 2000.
- US Markets - Sentiment is oversold
- Hedge Fund Telemetry Trade Ideas - No changes
- Tesla - Three Car Monte
- IBM and AMD Updates
- A few US sectors I'm watching today
- PPO Monitor - Percentage Price Oscillator Force Ranked Sector Rotation
- Bloomberg Technical Pattern Recognition Screen
- Currency Update - USD should work higher on WEEKLY chart
- European Market Update - Nice bounce today but I don't trust it
- Crude Update - Holding support for now
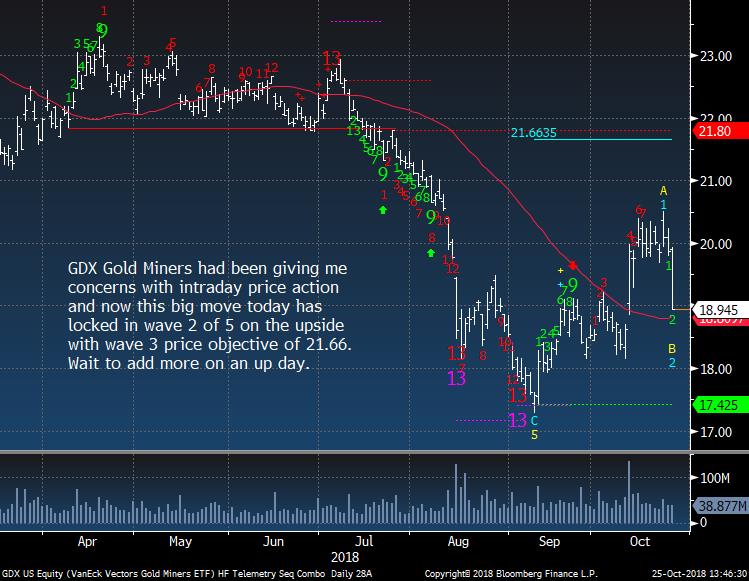
- Gold Update - GLD flat but GDX OUCH
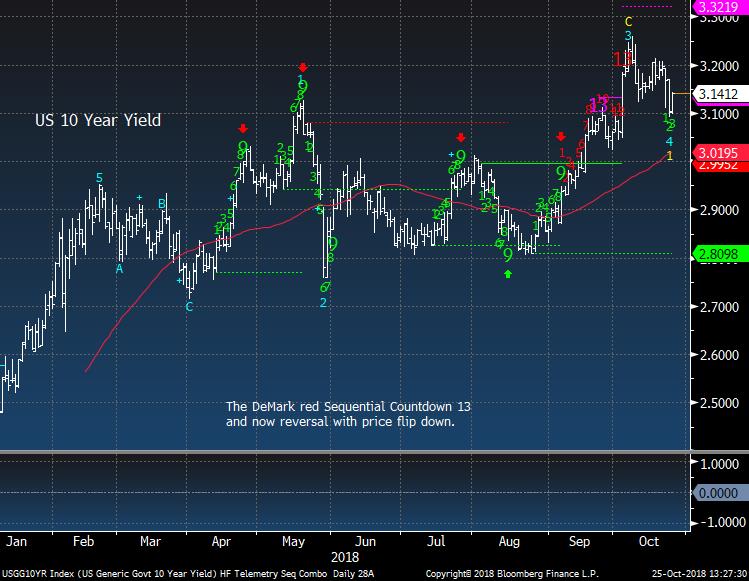
- Bond Update - Still expect lower yields
- DeMark Screens - Daily, Weekly, Monthly upside/downside exhaustion signals within the S&P 500 and Euro Stoxx 600
|
|
|
|
|
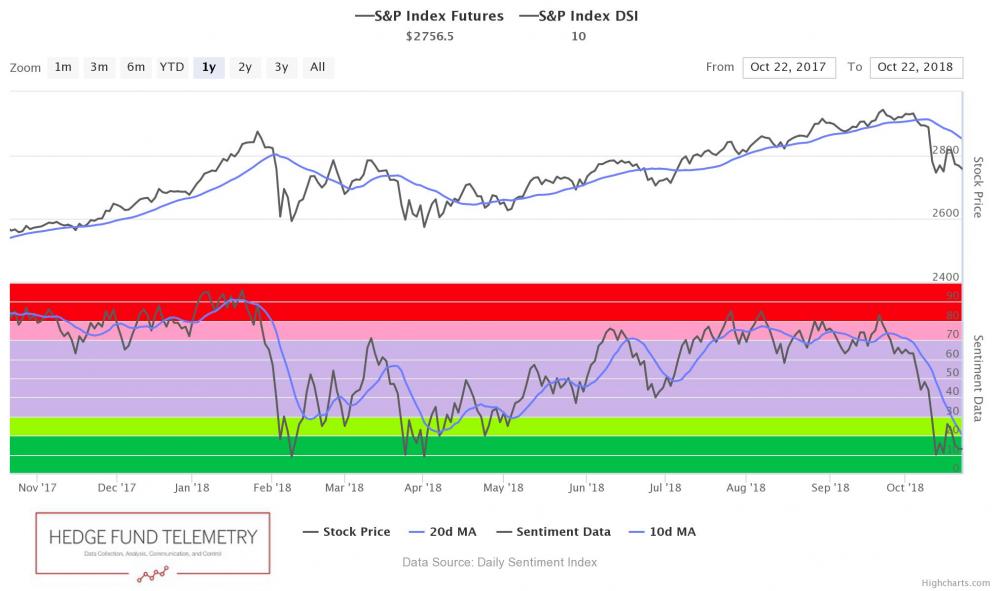
Here's a link to the Hedge Fund Telemetry market sentiment page with 40 charts of sentiment including equities, bonds, currencies, and commodities updated each day. When the new website launches we will be adding new charts and historical sentiment data for Euro Stoxx 50, UK FTSE 100, German DAX, French Cac 40. We will be adding Japanese Bonds, German Bunds, and a few more.
SPX bullish sentiment is at 10% and is oversold but it can stay low for a while. Hope you like the new charts!
|
|
|
|
|
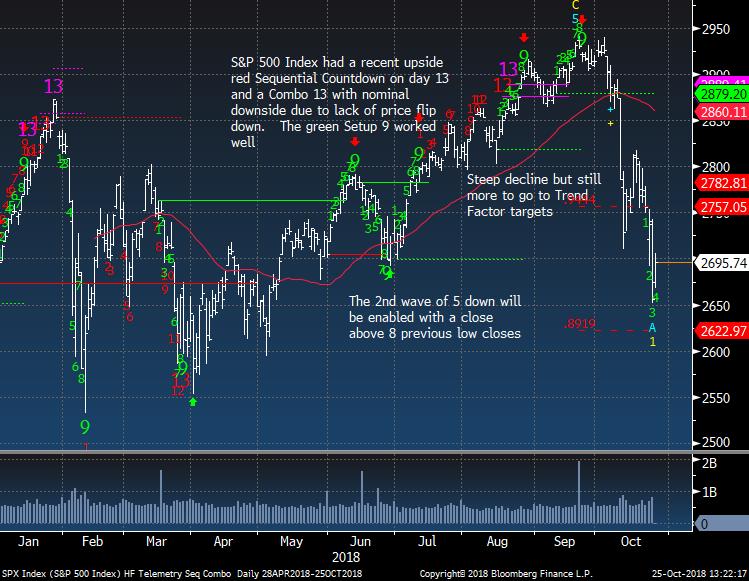
SPX daily should make a lower high and if the lows break tomorrow after AMZN and GOOGL February lows will come into play
|
|
|
|
|
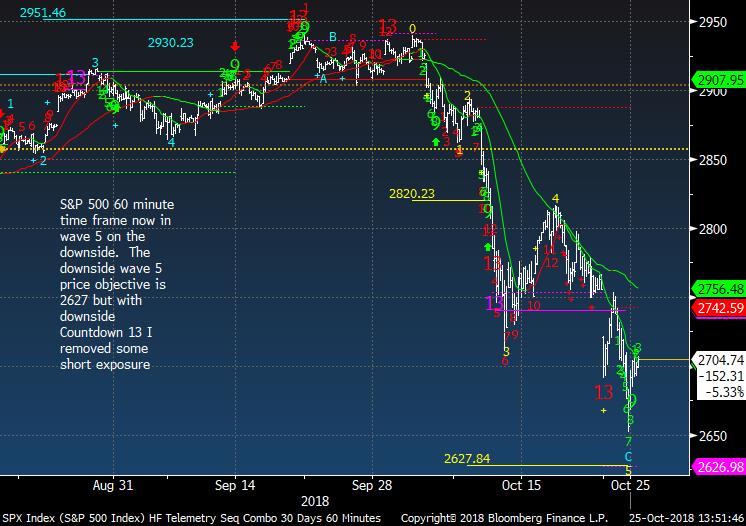
SPX 60 minute tactical time frame nearly hit the wave 5 downside price objective
|
|
|
|
|
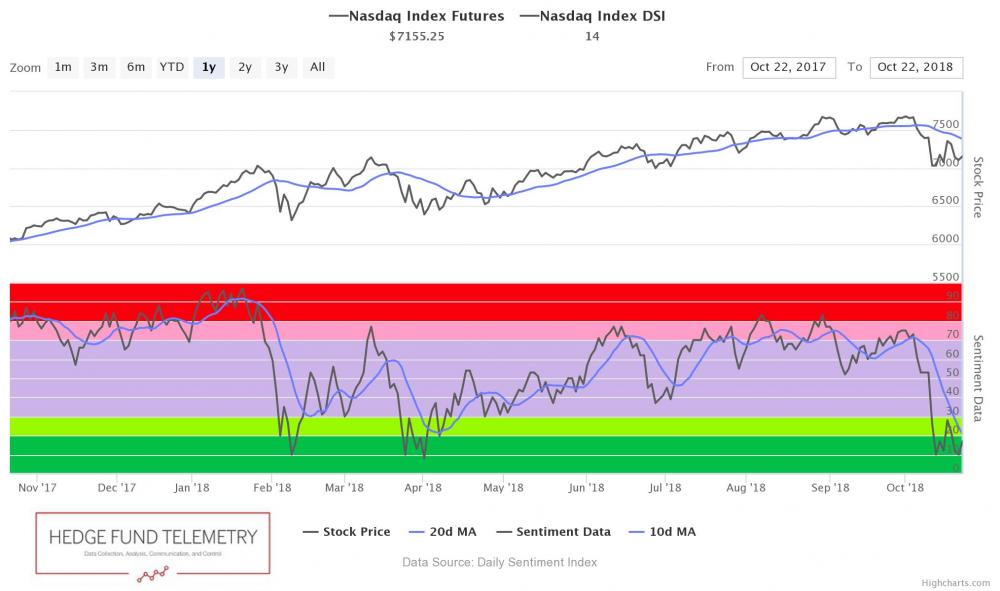
Nasdaq bullish sentiment is at 14%
|
|
|
|
|
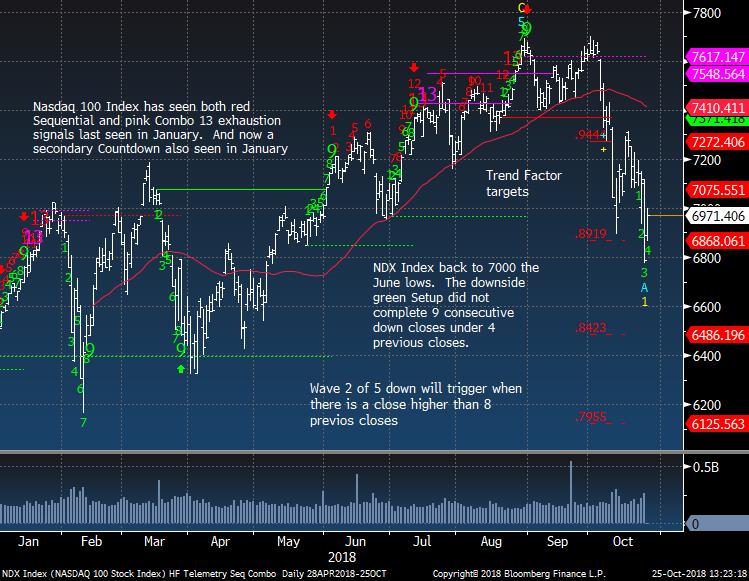
NDX Index is oversold but again AMZN and GOOGL will be huge tell
|
|
|
|
|
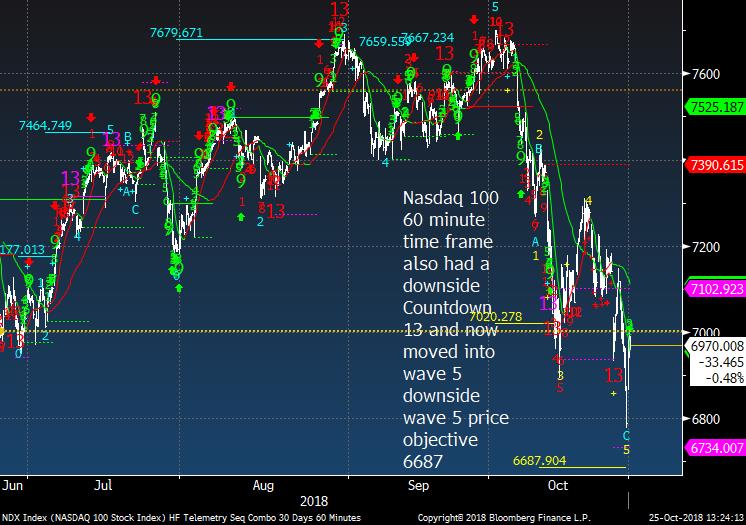
NDX 60 minute tactical time frame nearly hit the wave 5 price objective
|
|
|
|
|
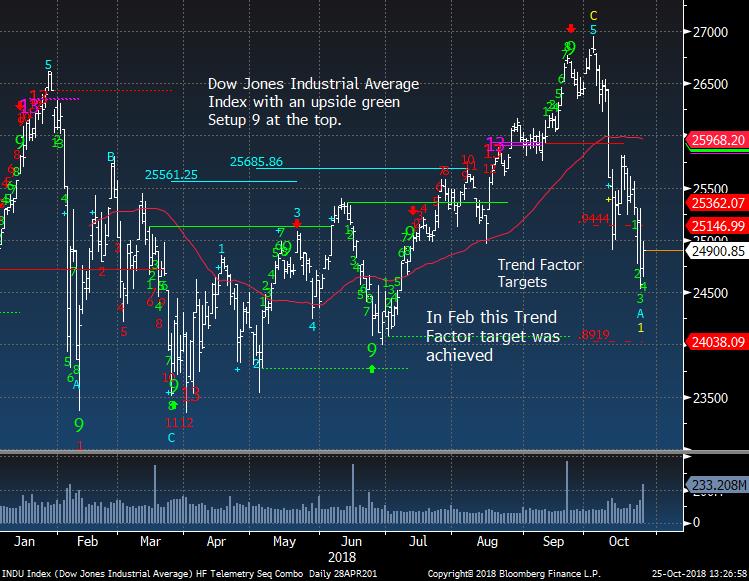
Dow Jones Industrial Average should also have a wave 2 lower high bounce
|
|
|
|
|
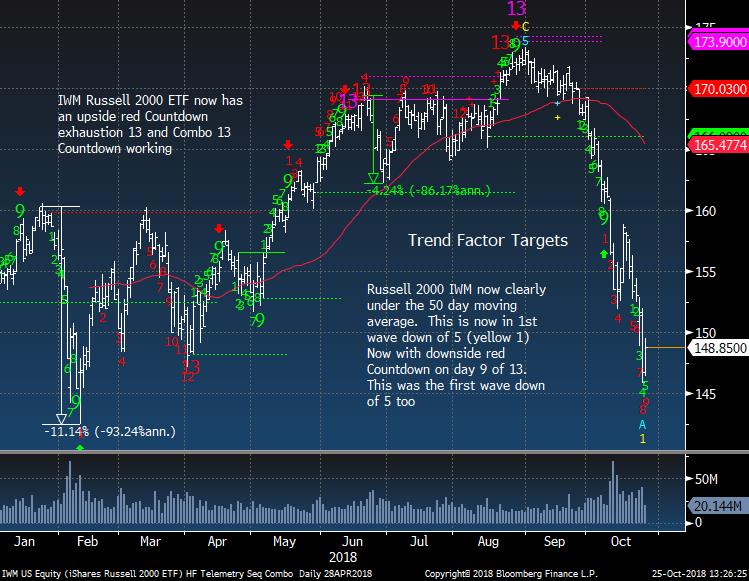
IWM Russell 2000 still looks weak
|
|
|
|
|
|
|
Hedge Fund Telemetry Trade Ideas
|
|
|
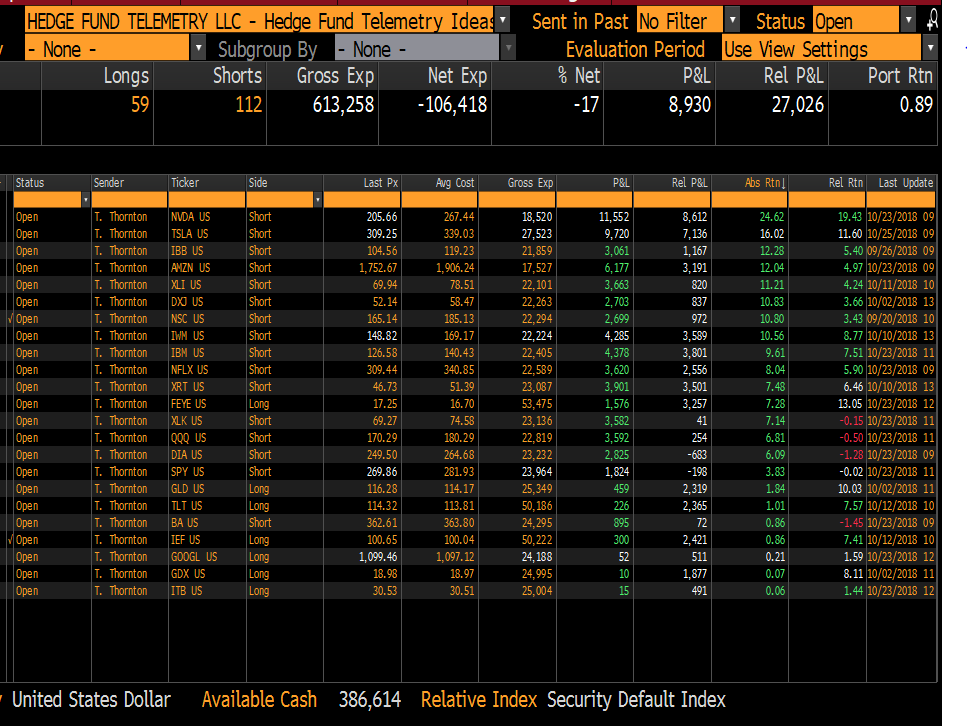
Trade Ideas Sheet - Long and short US equity ideas including ETF's. We will be overhauling the Trade Ideas Sheets for long only, short only, ETF's when the new website rolls out soon. There will also be a clearer email distribution with changes.
Trade Ideas Changes: NO CHANGES TODAY AHEAD OF GOOGL AND AMZN REPORTS
Stops on everything. TSLA
325, GDX 17.35 , FEYE 16.00, NVDA 235, QQQ 179, XLK 75, SPY 285, XLY 113, XRT 50, IWM 163, NSC 173, DIA 260, XLI 77 IBB 116, AMZN 1860 DXJ 56 , GLD 111, IEF 98 TLT 112 , BA 370, IBM 140, NFLX 345 (RECENTLY ADJUSTED STOPS) GOOGL 1000, ITB 28
|
|
|
|
|
|
|
|
|
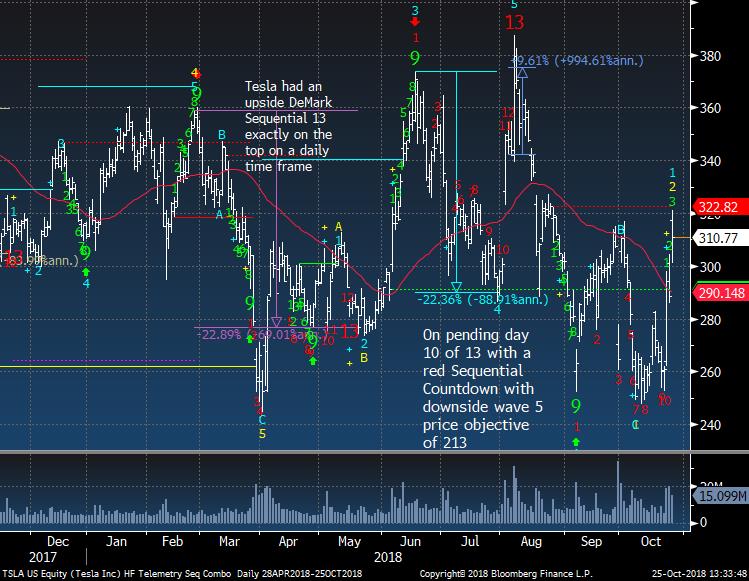
Tesla remains incredibly volatile and entertaining. Small size keeps one involved until this breaks 250
|
|
|
|
|
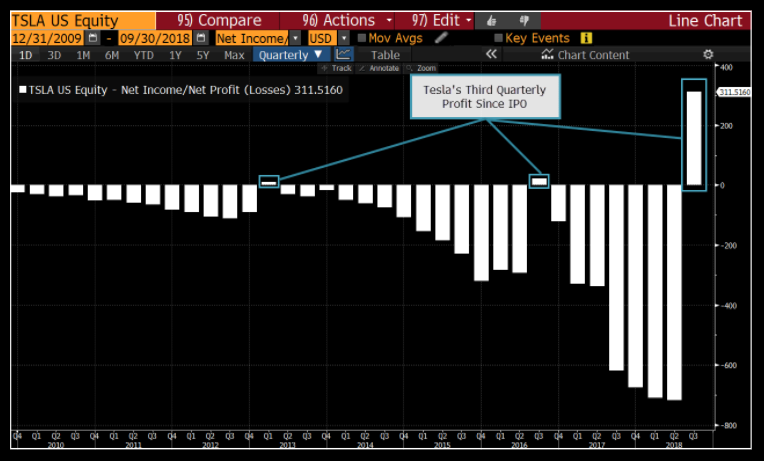
Tesla's profit was huge. The COGS dropped by 17% and that seems very strange. They had accounts receivables spike too and maybe they sold trade ins and fleet vehicles to Enterprise Rent A Car?
|
|
|
|
|
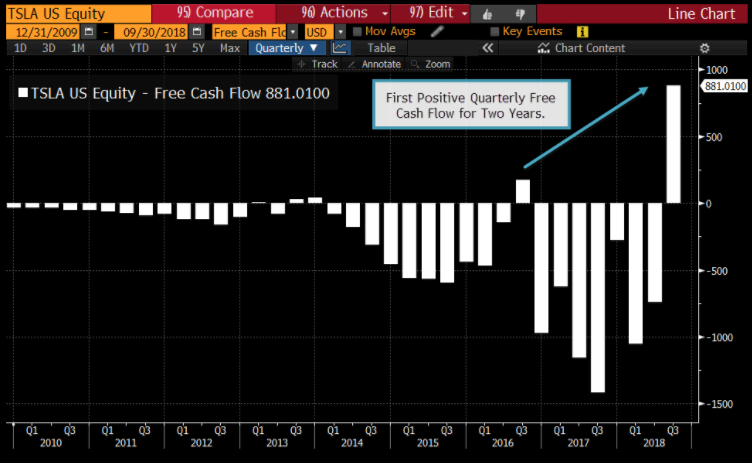
Cash flow was huge. There are a lot of stories that people paid in full for cars in September but Tesla sold those cars to someone else as people were told they needed new Vin numbers and would get cars in October.
|
|
|
|
|
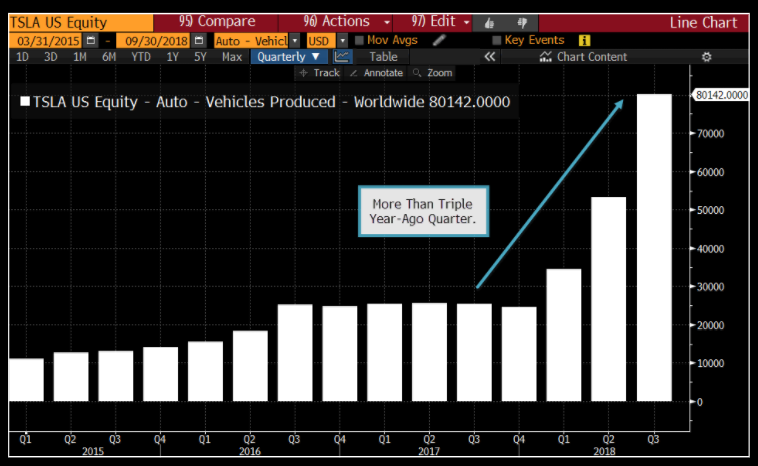
They produced a lot of vehicles but did they pull forward demand? Model S and X have not seen gains in the past year too. They showed an extra billion in operating profit from selling an extra 43k vehicles vs the previous quarter. Where are the costs for warranty expenses? They jammed them in SG&A thus boosting margins. I could go on and on...
|
|
|
|
|
|
|
|
|
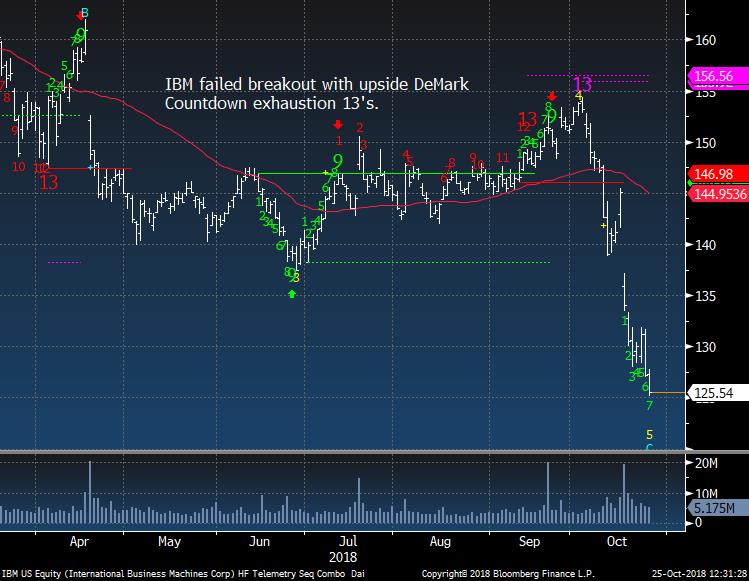
IBM continues lower. Remember "breakouts" with DeMark signals tend to fail
|
|
|
|
|
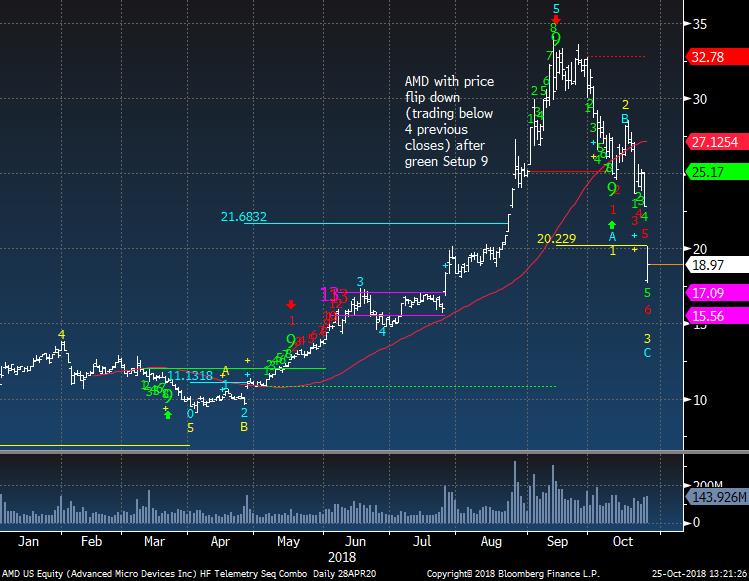
AMD has been murdered confirming huge inventory and demand issues. I was short from mid 30's and covered at 25 at the support. Oh well. I am happy to have made some nice gains. This does not look finished on the downside
|
|
|
|
|
|
|
A few US sectors I'm watching today
|
|
|
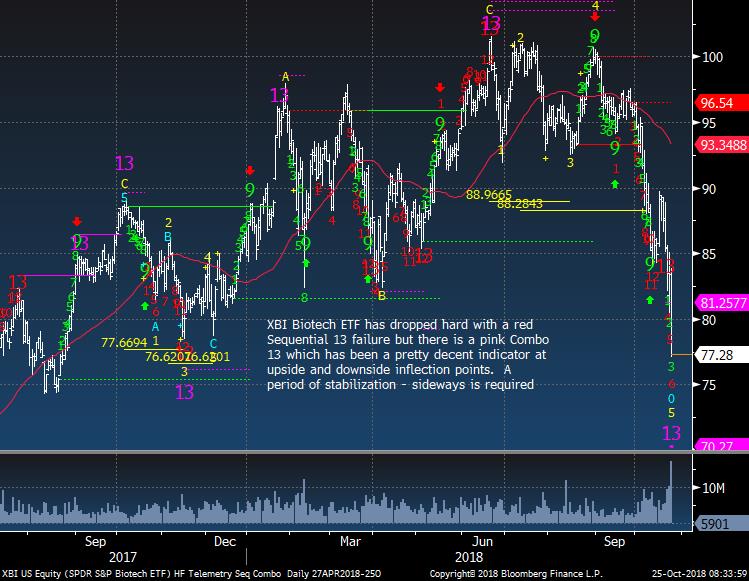
XBI Biotech ETF has been crushed and now there is a Combo 13 which has worked well at inflection points. Keep in mind IBB does not yet have downside exhaustion.
|
|
|
|
|
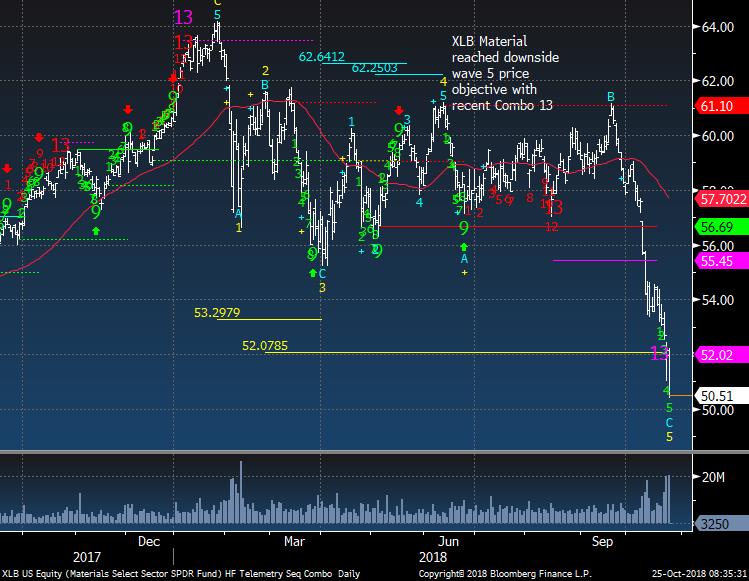
XLB Materials has hit some levels expected and should bounce
|
|
|
|
|
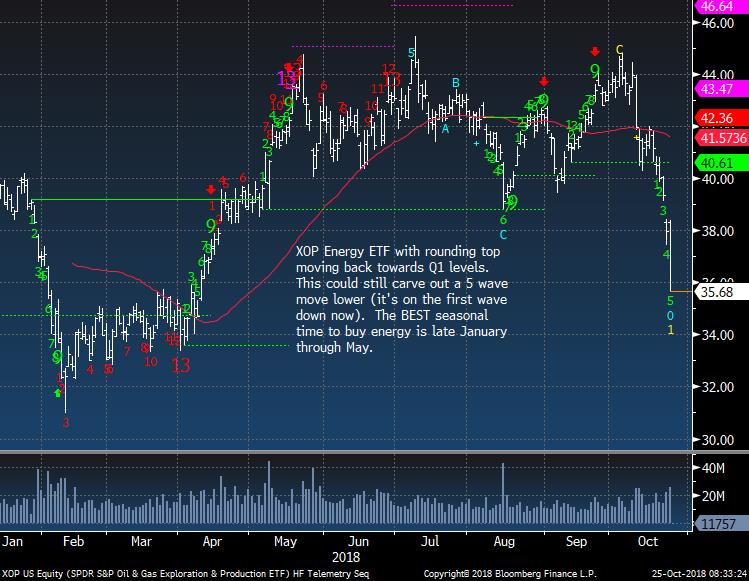
XOP Energy will take time to stabilize
|
|
|
|
|
|
|
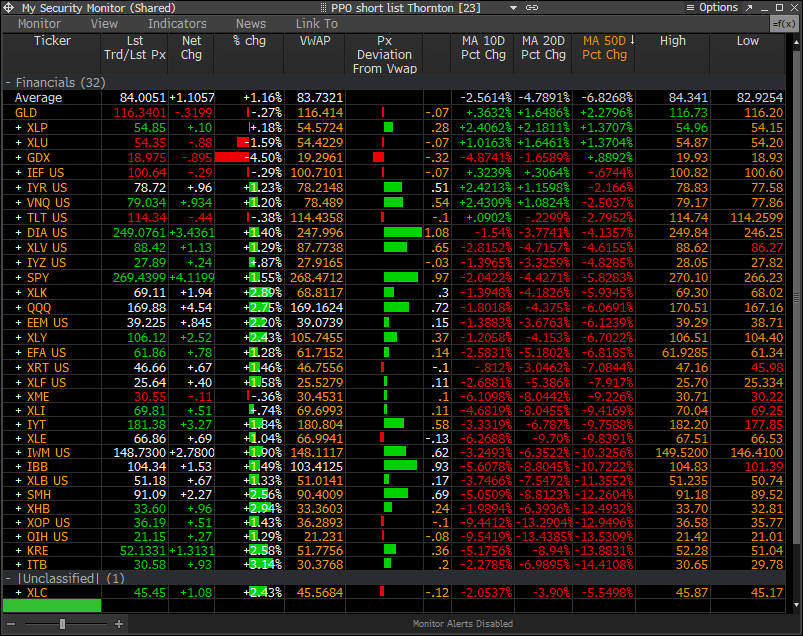
PPO Monitor - Percentage Price Oscillator
|
|
|
The PPO Monitor is a proprietary monitor developed to force rank Indexes, Sectors, and Stocks. It ranks top down by strongest to weakest by percentage above/below the 50 day moving average. Shorter term signals can be seen when the 10 and 20 day moving averages turn up (green) or down (red) which often are followed by the 50 day moving average. This is useful to watch for historically overbought/oversold percentage above/below the 50 day moving average. It is
non correlated with the DeMark Indicators however we have found upside/downside exhaustion signals often occur when something rises to the top or drifts to the bottom of the monitor - increasing the timing aspect. We share this monitor with clients with Bloomberg Terminals. An added feature is that each market/ETF can be expanded with each component force ranked in the same way. A couple other features include price deviation from intraday VWAP (useful for intraday reversals) and new 20 day highs/lows on right side. Please inquire if you would like to be permissioned to use the PPO Monitor.
Today's highlights: What has been the worst is up the most today.
|
|
|
|
|
|
|
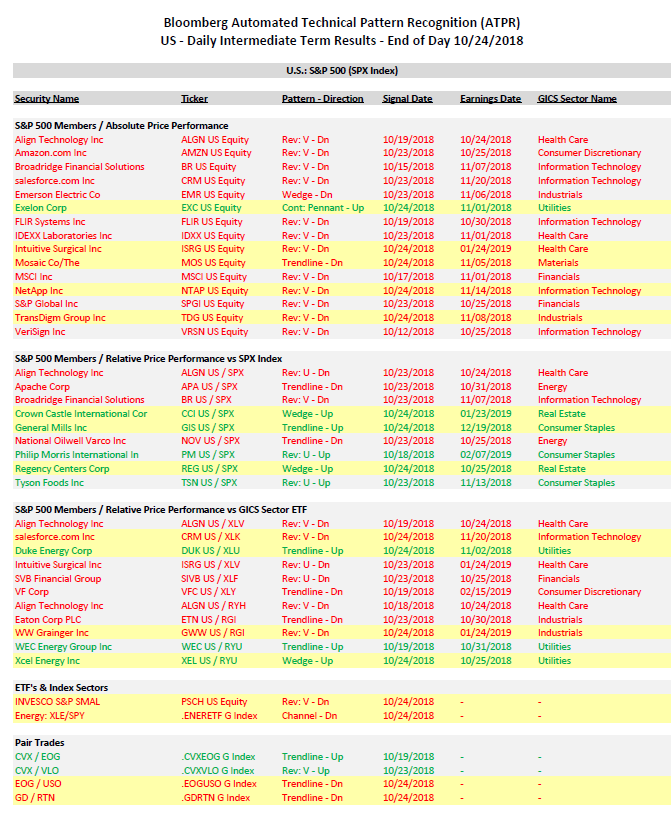
Bloomberg Automated Technical Pattern Recognition Screens
|
|
|
S&P 500 Members/Absolute Price Performance and Relative Price Performance vs S&P 500 and Sector ETF's. ETF's vs Index Sectors. Pair Trades. Long side is first symbol, short side is second symbol. If you would like a PDF from Bloomberg with full details of how this is formulated, please email. We will be doing a webinar in the coming weeks specifically on this system.
|
|
|
|
|
|
|
|
|
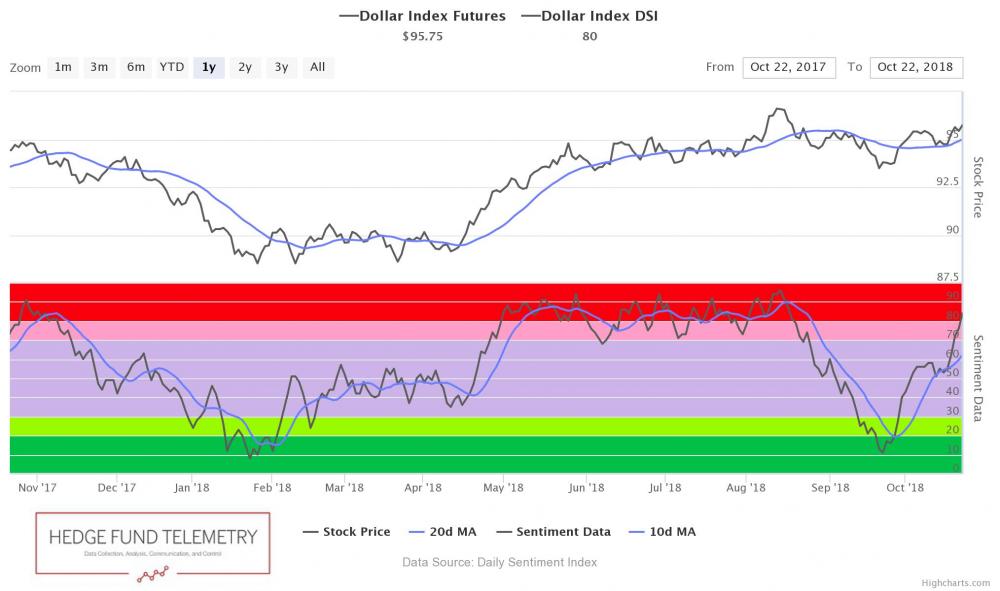
US Dollar bullish sentiment is at 80% and can go higher
|
|
|
|
|
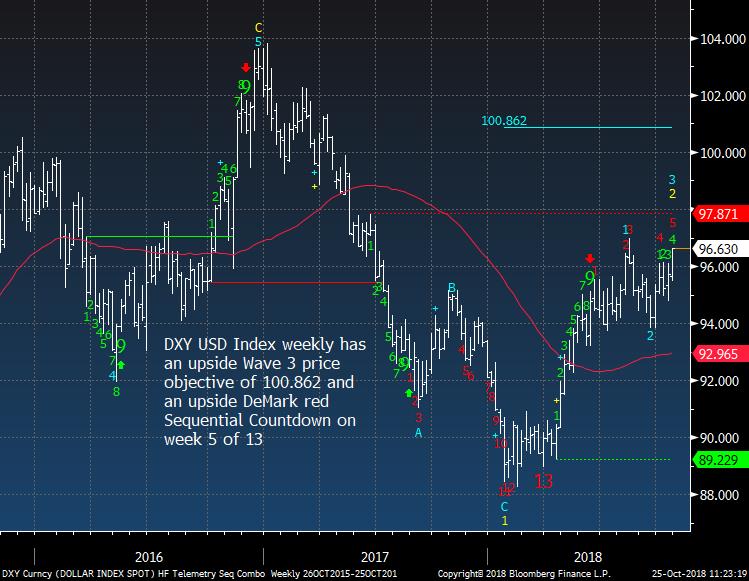
US Dollar Index WEEKLY looks higher
|
|
|
|
|
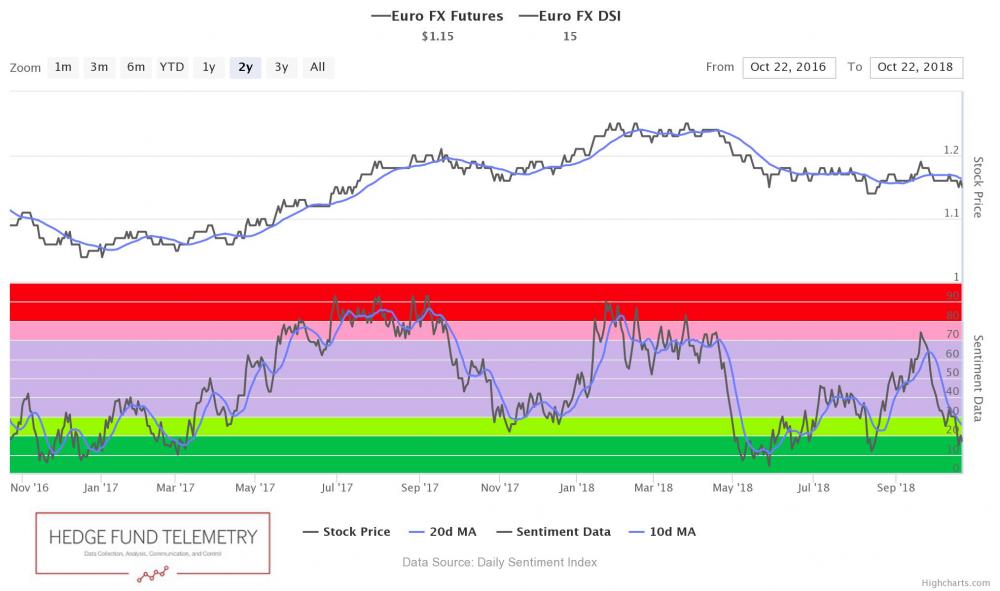
Euro bullish sentiment is at 15%
|
|
|
|
|
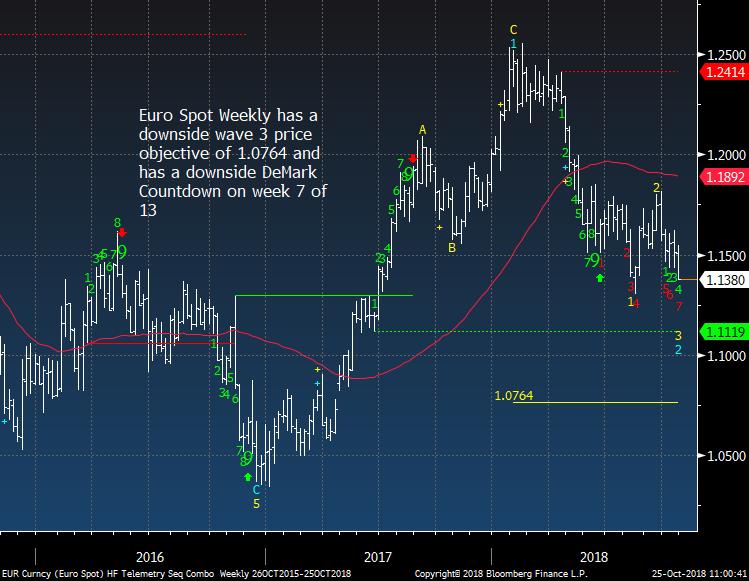
Euro Spot WEEKLY looks lower
|
|
|
|
|
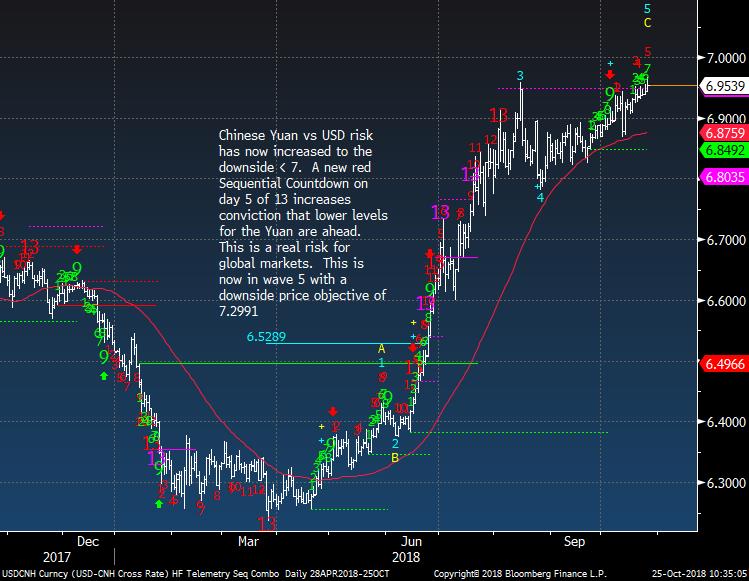
YUAN should work below 7 soon
|
|
|
|
|
|
|
|
|
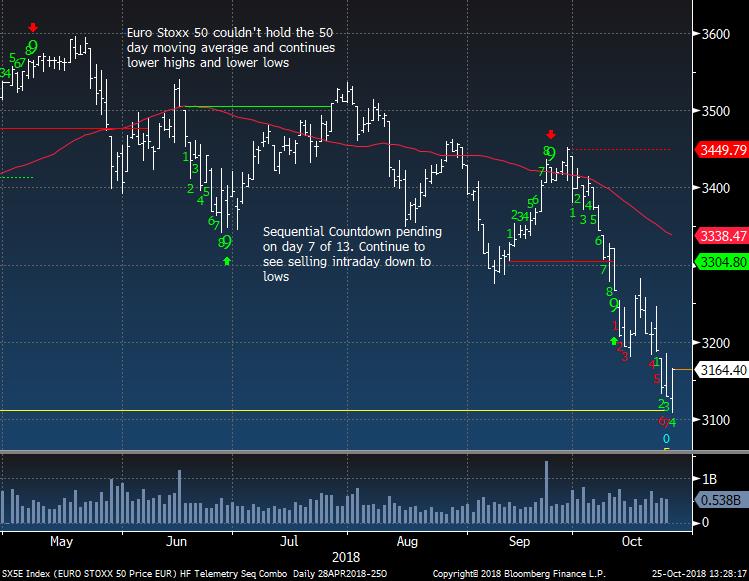
Euro Stoxx 50 bouncing today at wave 5 price objective but I still feel this needs to stabilize before buying
|
|
|
|
|
|
|
|
|
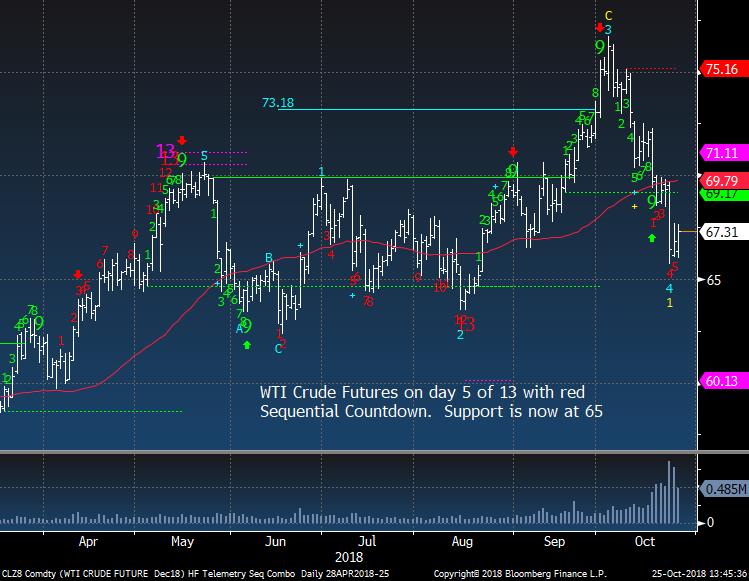
Crude bullish sentiment is at 60% down from 96%. Holding 65 and expect a lower high bounce
|
|
|
|
|
|
|
|
|
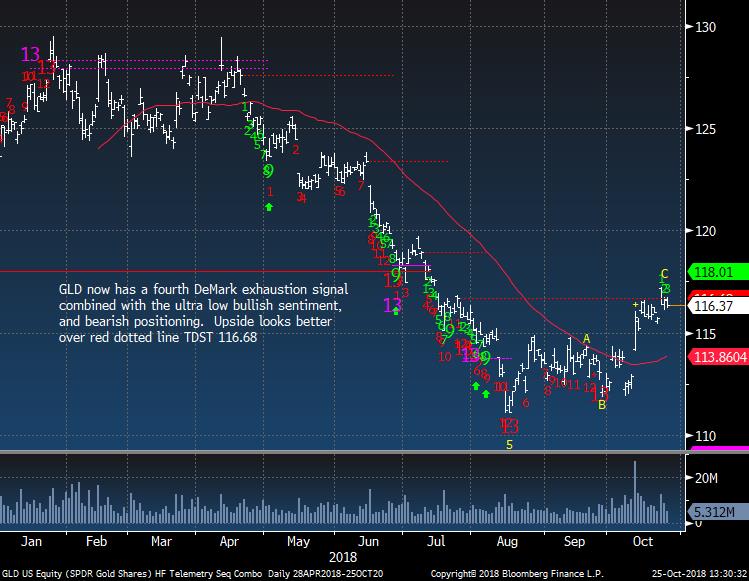
Gold bullish sentiment is at 28% and GLD is fairly flat
|
|
|
|
|
Gold Miners GDX ETF OUCH but not giving up the long here
|
|
|
|
|
|
|
|
|
Bond bullish sentiment is at 54% and US 10 Year Yield should still work lower to 3% at least
|
|
|
|
|
|
|
DEMARK SCREENS - Daily, Weekly, Monthly Upside/Downside Exhaustion Signals
|
|
|
Daily/Weekly DeMark upside/downside exhaustion signals (Sequential) updated daily, Weekly signals on Monday's and monthly on the first day of the new month. Price flips occur when a stock closes higher/lower than four previous closes and increases conviction of a price turn.
The upside 13's are sell signals and downside 13's are buy signals. Price flip's are confirmation signals that increases potential for a price trend change. For example, if you are long a stock and there is an upside 13, you will want to take cautious action by selling down or out of a position. If initiating a short sale with the upside 13's, we tend to start with a 1/2 size and add with the downside price flip. The opposite is true for when there are downside 13's. Take a 1/2 size position
and add with the upside price flip. The DeMark Indicators are designed to assist the user with buying into weakness and selling into strength to anticipate trend exhaustion. Selling into a rally and buying into a decline often afford the opportunity to exit a trade without too serious a loss if wrong.
S&P 500 Universe:
DAILY UPSIDE 13: EXC, HSY
DAILY DOWNSIDE 13: CBRE, DGX, MU, SWK
DAILY UPSIDE WITH PRICE FLIP REVERSAL DOWN: CTL
DAILY DOWNSIDE WITH PRICE FLIP REVERSAL UP: MLM, VAR
Updated: 10/22/18
WEEKLY UPSIDE 13: NONE
WEEKLY DOWNSIDE 13: COTY, IRM, VNO
Updated: 10/1/18
MONTHLY UPSIDE 13: ADSK, ALL, CCI, CME, DE, DLR, DTE, ETN, GLW, HPQ, INTU, PH, TPR, TXT, UPS, XLNX
MONTHLY DOWNSIDE 13: NONE
Euro Stoxx 600 Universe:
DAILY UPSIDE 13: NONE
DAILY DOWNSIDE 13: AENA SM, CON GR
DAILY UPSIDE WITH PRICE FLIP REVERSAL DOWN: CA FP
DAILY DOWNSIDE WITH PRICE FLIP REVERSAL UP: NONE
Updated: 10/22/18
WEEKLY UPSIDE 13: MUV2 GR
WEEKLY DOWNSIDE 13: BAS GR, FHZN SW, FRA GR, IMB LN, JMT PL, ONTEX BB, OSR GR
Updated: 10/1/18
MONTHLY UPSIDE 13: BNZL LN, EXPN LN, FPE3 GR, SBMO NA, SECUB SS, SWEDA SS
MONTHLY DOWNSIDE 13: BAYN GR, HMB SS, TEF SM
|
|
|
Unsubscribe me from Hedge Fund Telemetry
Hedge Fund Telemetry LLC, P.O. Box 4675, Greenwich, CT 06861, United States
CONFIDENTIALITY NOTE and DISCLAIMER: This message is for the named person's use only. It may contain confidential, proprietary or legally privileged material. No confidentiality or privilege is waived by any accidental or unintentional transmission. If you receive this message in error, please immediately delete it and all copies of it from your system, destroy any hard copies and notify the sender. You must not, directly or indirectly, use, disclose,
distribute, print or copy any part of this message if you are not the intended recipient. Hedge Fund Telemetry LLC. cannot guarantee the confidentiality of the material transmitted; therefore, information of a sensitive or confidential nature should not be transmitted. There is risk in trading markets. Hedge Fund Telemetry LLC reports are based on information gathered from various sources and believed to be reliable, but are not guaranteed as to accuracy and completeness. The information is subject to change without notice and Hedge Fund Telemetry LLC has no obligation to provide any updates or changes. Hedge Fund Telemetry LLC is providing this data for informational and educational purposes and does not believe that it is sufficient to base an investment decision on. This information should not be regarded as a solicitation or recommendation of any particular security or to engage in any trading strategy. One should always check with your licensed financial
advisor to determine suitability of any investments.
|
|
|
|
|