|
|
|
|
|
|
|
|
With six trading days remaining in October, it's likely this will be a down month on nearly every market in the world (Brazil notable outlier) and sector (Gold sector notable outlier). The narrative for market strategists to remain bullish on the US markets has been strong earnings growth. My theme in the past couple months has been expecting guidance cuts...after decent earnings. I've shown charts from Factset with earnings expectations along with continued high expectations with
profit margins. My call has been the benefits from tax cuts would wear off into this quarter, tougher comps especially in retail, peak in consumer confidence and bottom in unemployment rate. Add the pronounced weakness around the world due to slowing growth, it was just a matter of time that the US would catch a cold too.
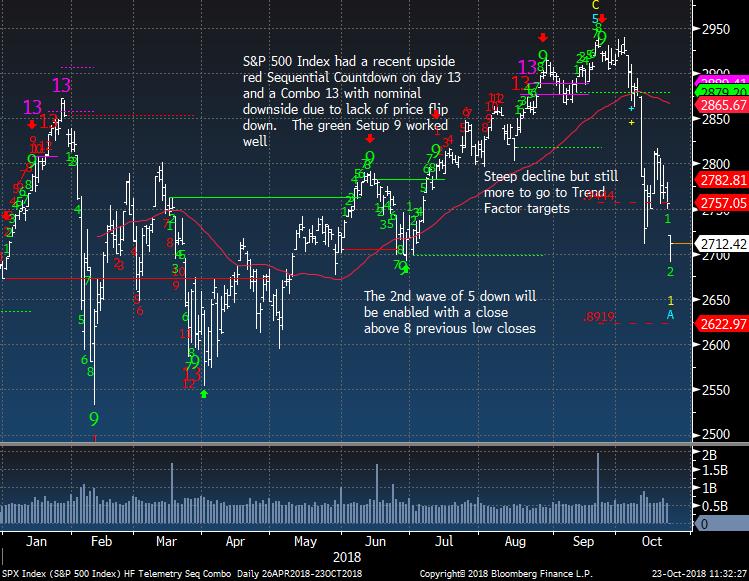
I do not believe the true bottom is here, as it will take more time, but a bottom ahead of a lower high bounce is likely forming here. Some catalysts could take the market higher which involve the usual suspects. Microsoft, Google, and Amazon by themselves can lift the markets by reporting earnings this week free of surprises. The China/US tariff war is far from over but with Trump and Xi scheduled now to meet soon could thaw out the poor relations to kick start serious talks. The pattern on the US indexes is now in the first of five waves down with a lower high wave two bounce potential ahead. Bullish sentiment hit 10% on
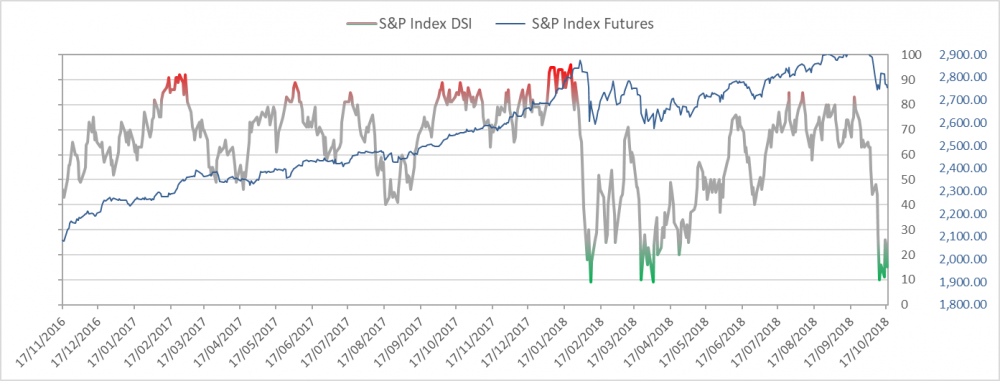
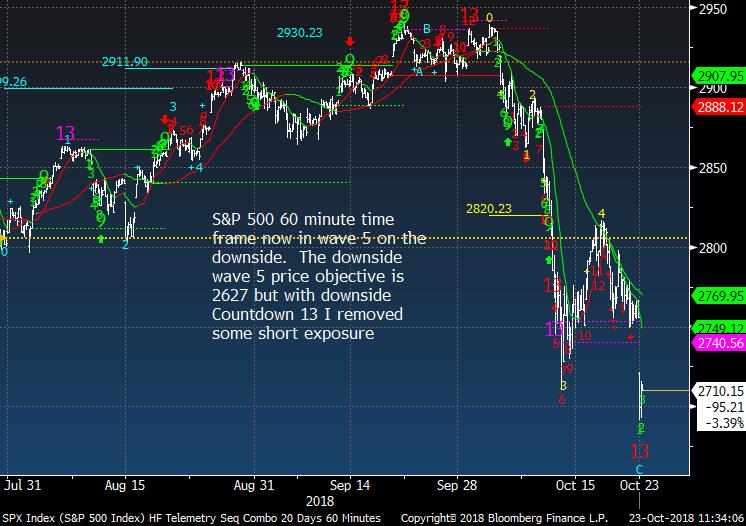
the S&P last night and it will likely be lower this afternoon (it will be posted on the website at 5pm). Sentiment readings can stay oversold for a while as it is a condition and not a trigger. The trigger for a bounce could be the 60 minute tactical charts now carving out five down waves which have worked well as a road map from the top. At that recent top I moved my short exposure on the Trade Ideas Sheet to the highest level all year and today I reduced significantly short exposure and will hold a higher percentage in cash for now. There are a couple sectors and stocks that are now showing downside exhaustion worthy of buying with tight stops for a trade that I'm adding to the Trade Ideas Sheet.
- US Markets - Sentiment oversold ripe for bounce
- Hedge Fund Telemetry Trade Ideas - Lot's of changes today
- Fun with Analogs
- Alphabet - New long idea
- Semiconductor Sector
- PPO Monitor - Percentage Price Oscillator Force Ranked Sector Rotation - ITB oversold
- Bloomberg Technical Pattern Recognition Screen
- Currency Update - Range bound
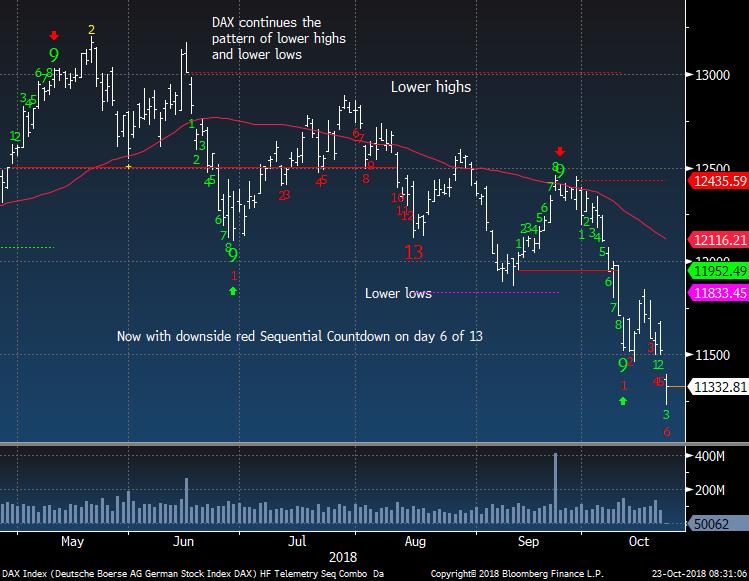
- European Market Update - New lows
- Global Market Update - New lows
- Asian Market Update - Japan has support a little lower
- Crude Update - Should work lower
- Gold Update - Still working but ugly and unloved still
- Bond Update - Reversal down with yields is a sign of risk off
- DeMark Screens - Daily, Weekly, Monthly upside/downside exhaustion signals within the S&P 500 and Euro Stoxx 600
|
|
|
|
|
Here's a link to the Hedge Fund Telemetry market sentiment page with 40 charts of sentiment including equities, bonds, currencies, and commodities updated each day. When the new website launches we will be adding new charts and historical sentiment data for Euro Stoxx 50, UK FTSE 100, German DAX, French Cac 40. We will be adding Japanese Bonds, German Bunds, and a few more.
SPX bullish sentiment is at 10%
|
|
|
|
|
SPX daily still very risky with drop gapping lower today
|
|
|
|
|
SPX 60 minute tactical time frame now in wave 5 with a downside Countdown 13
|
|
|
|
|
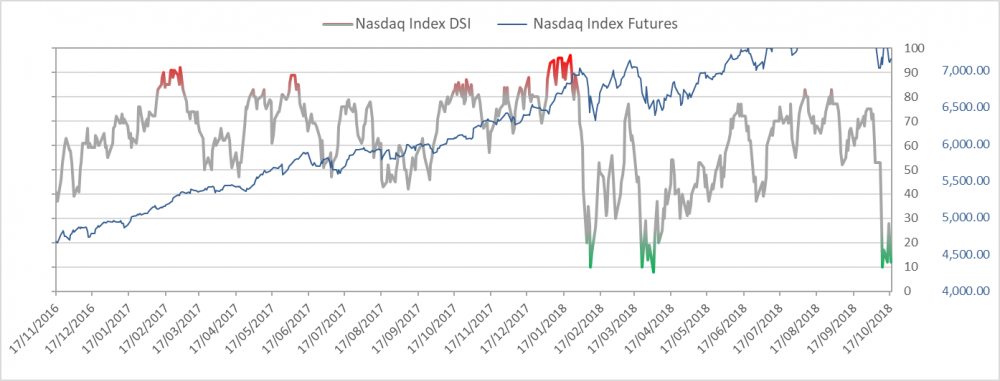
Nasdaq bullish sentiment is at 14%
|
|
|
|
|
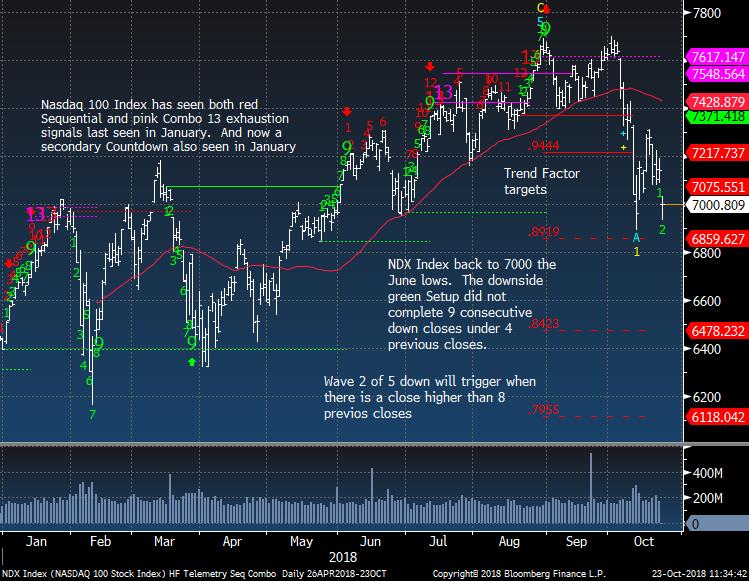
NDX Index holding 7000 - a lot rides on the mega caps reporting this week
|
|
|
|
|
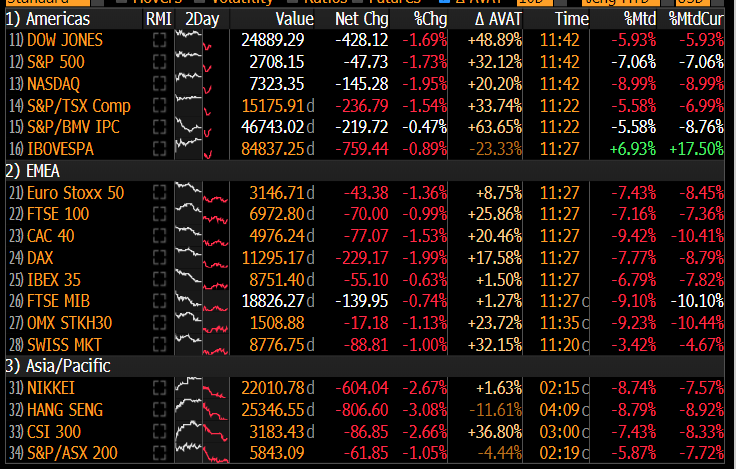
The Hunt For Red October - What a month!
|
|
|
|
|
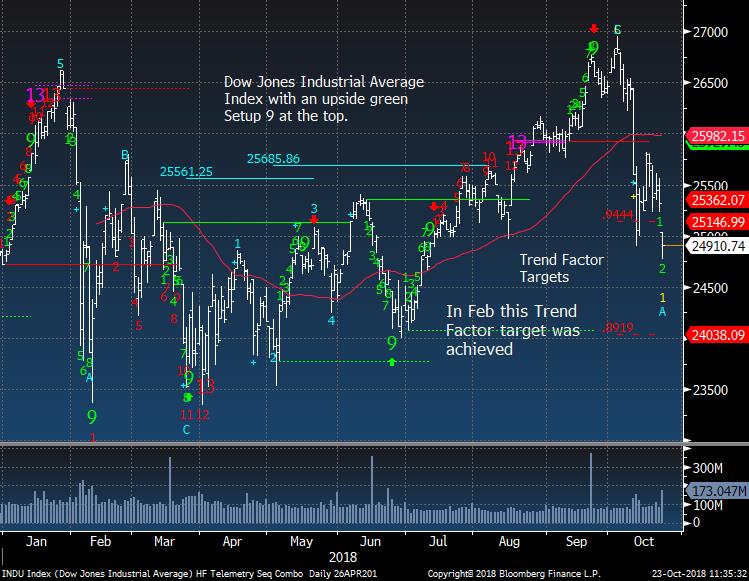
Dow Jones Industrial Average still could go to downside lower Trend Factor level
|
|
|
|
|
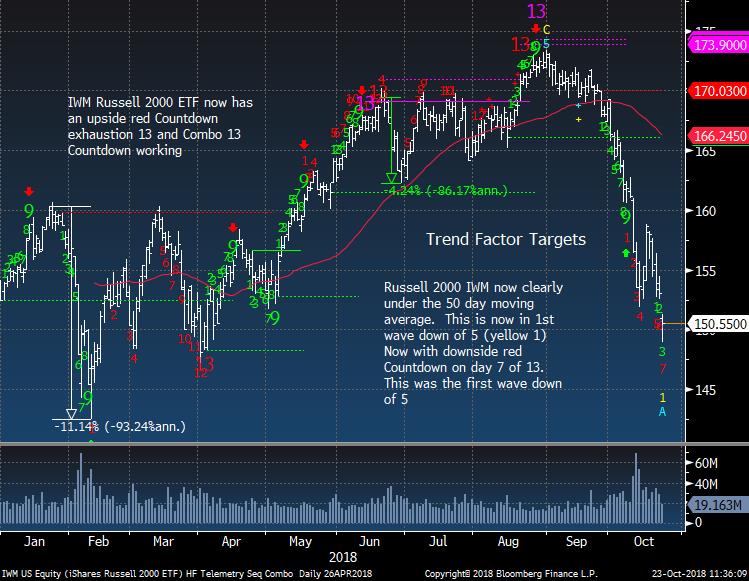
IWM Russell 2000 still looks the worst index in the US
|
|
|
|
|
|
|
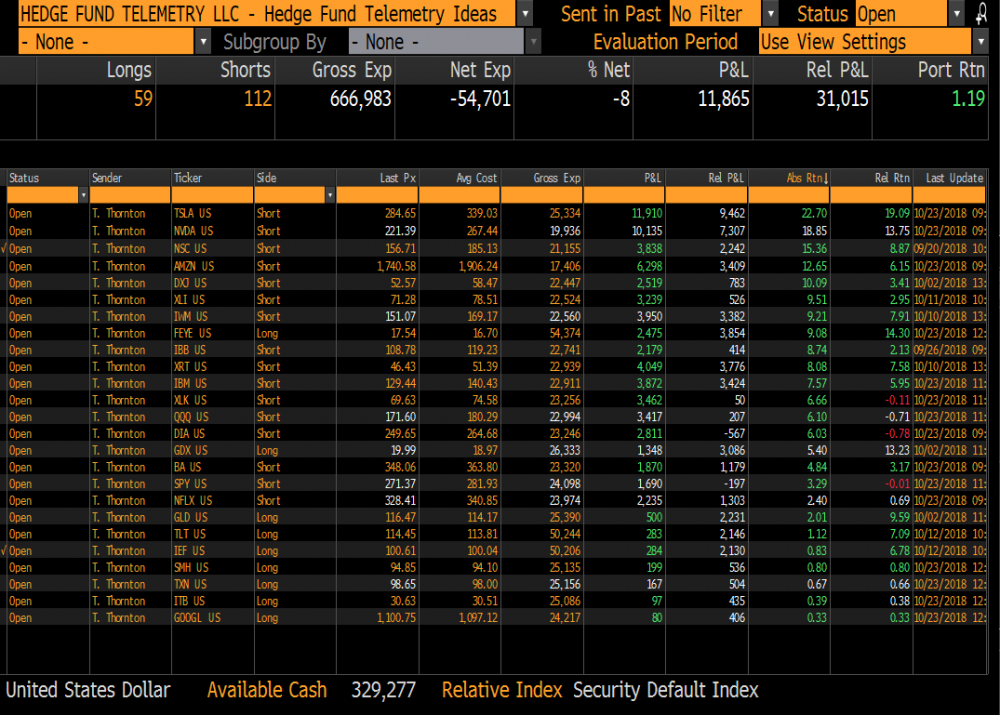
Hedge Fund Telemetry Trade Ideas
|
|
|
Trade Ideas Sheet - Long and short US equity ideas including ETF's. We will be overhauling the Trade Ideas Sheets for long only, short only, ETF's when the new website rolls out soon. There will also be a clearer email distribution with changes.
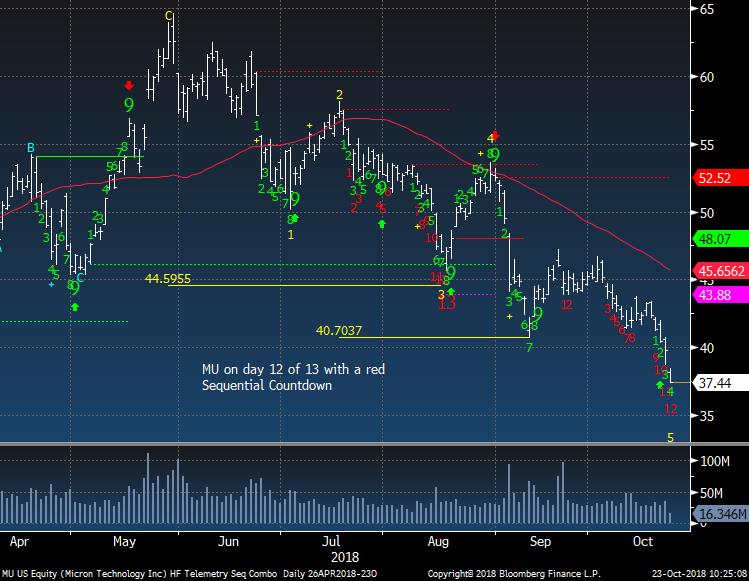
Trade Ideas Changes: REMOVED SHORTS: AAPL +2.5%, ABT +8%, AXP +4%, CUT SIZE IN HALF TO 2.5% SHORT: TSLA +25%, AMZN +13%, NVDA +18.5%, DIA +6%, NFLX +4.5%, BA +4%, QQQ +6.5%, XLK +7%, IBM +7.5%, SPY +3.5%. ADDED NEW LONGS 2.5% SIZE: GOOGL, TXN, ITB, SMH. DOUBLED LONG TO 5% FEYE
Stops on everything. TSLA 320, GDX 17.35 , FEYE 16.00, NVDA 235, QQQ 179, XLK 75, SPY 285, XLY 113, XRT 50, IWM 163, NSC 173, DIA 260, XLI 77 IBB 116, AMZN 1860 DXJ 56 , GLD 111, IEF 98 TLT 112 , BA 360, IBM 140, NFLX 345 (RECENTLY ADJUSTED STOPS) GOOGL 1000, TXN 90, ITB 28, SMH 90
|
|
|
|
|
|
|
|
|
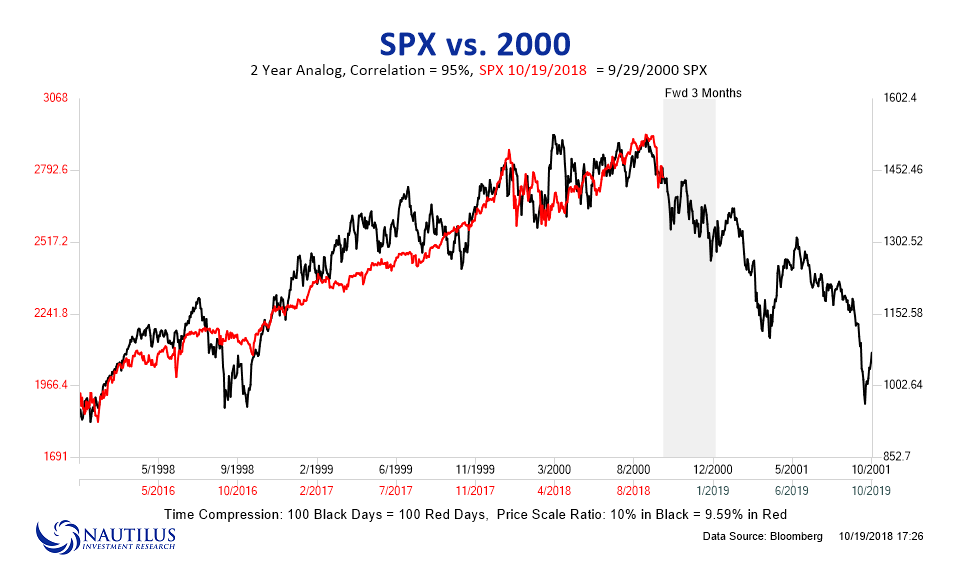
Nautilus Research does fine work and they have studied analogs for years. Here's 2000 with 95% correlation with today's market. Face ripper bounces happened all the way down. Please do not post these chart online
|
|
|
|
|
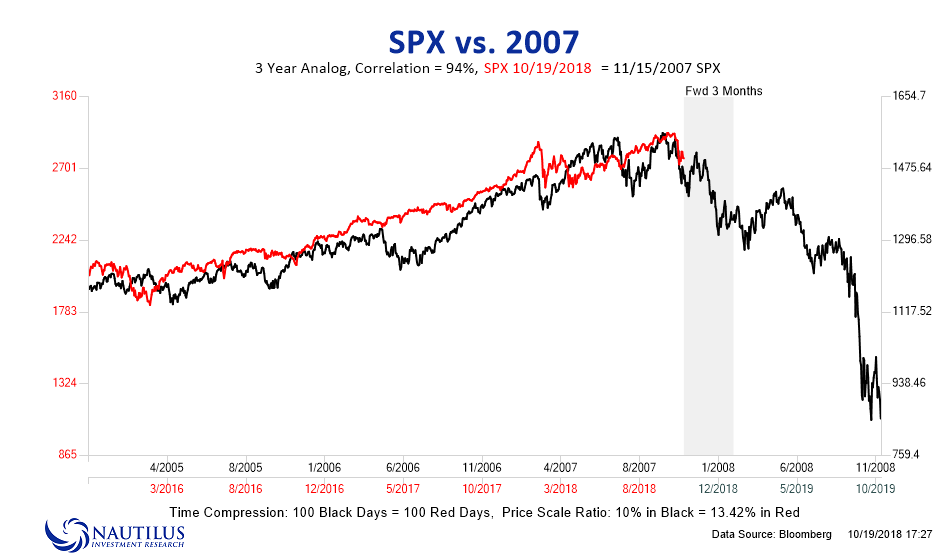
2007 with 94% correlation
|
|
|
|
|
|
|
|
|
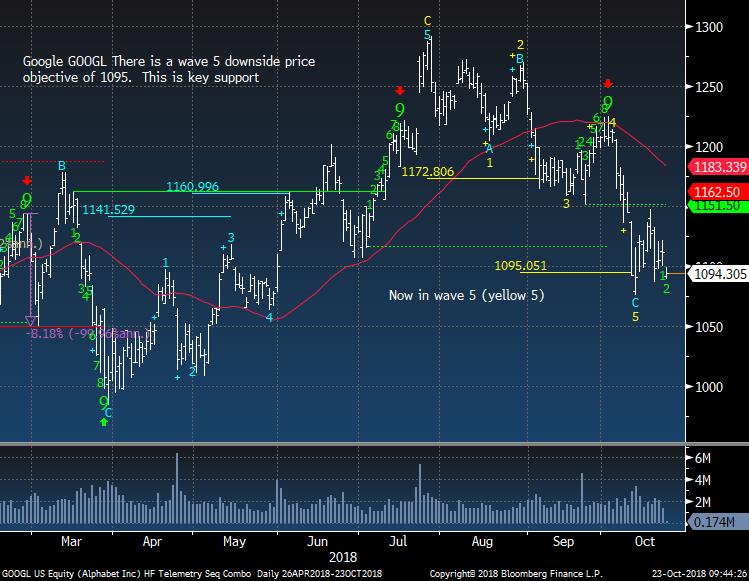
Alphabet reports this week and has carved out 5 down waves and has some support here. I do think they have the best of the FANG's business model. Using a 1000 stop
|
|
|
|
|
|
|
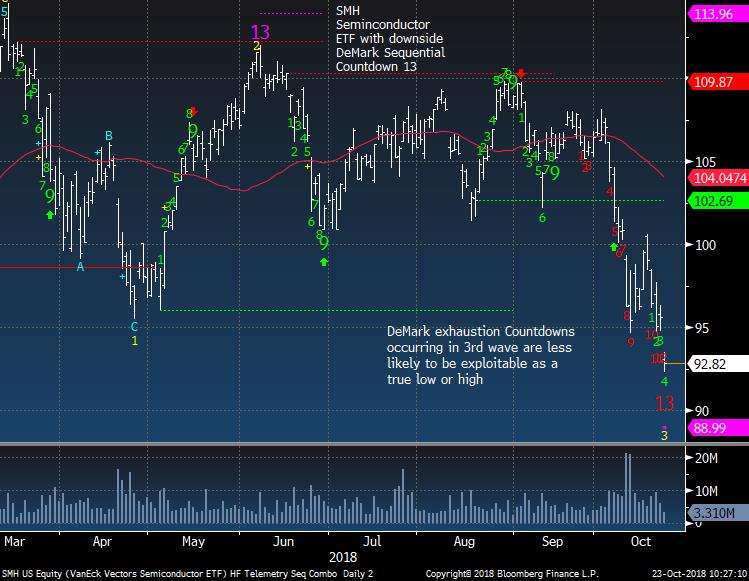
US Sector Focus - Semiconductors
|
|
|
SMH has a downside Countdown today. Sentiment is pretty bad in the group and shorts have been adding as well the "technicians" who loved it at the top now hate the group here. It's in wave 3 of 5 so this is a trade for a bounce
|
|
|
|
|
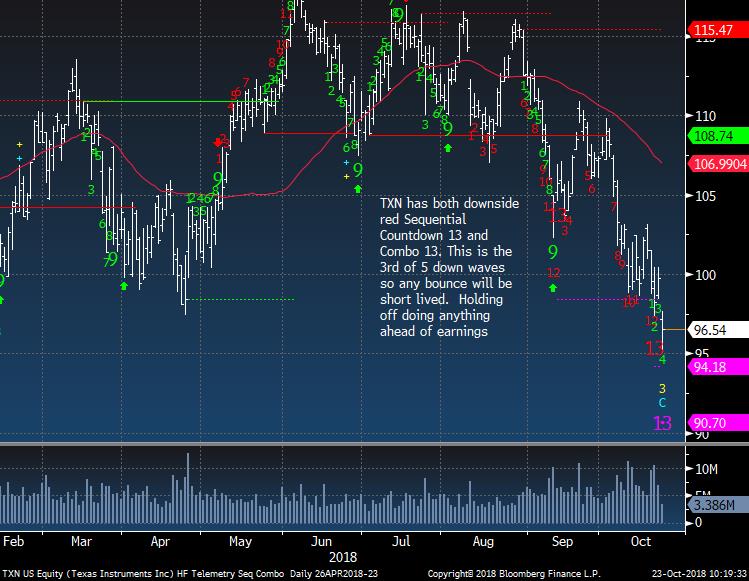
TXN with downside exhaustion and they report tomorrow. I expect bad but not terrible guidance and a bounce is possible
|
|
|
|
|
|
|
|
|
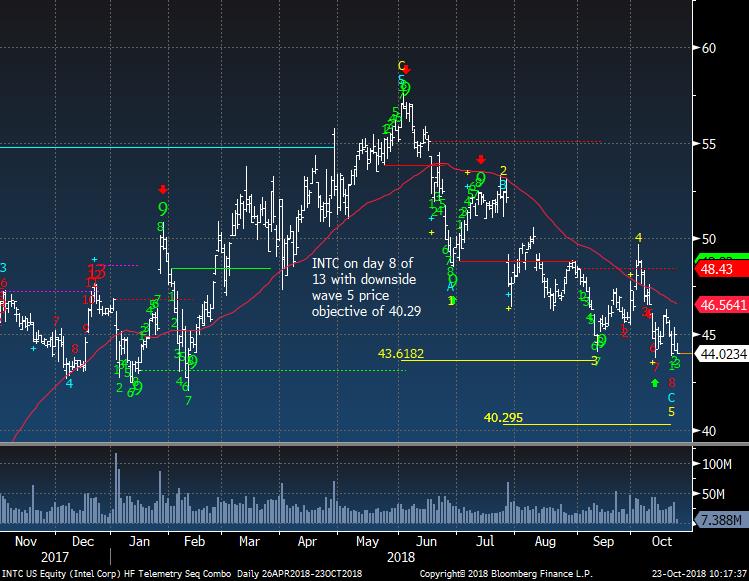
INTC the largest weight in the SMH ETF still has some risk lower which should be considered
|
|
|
|
|
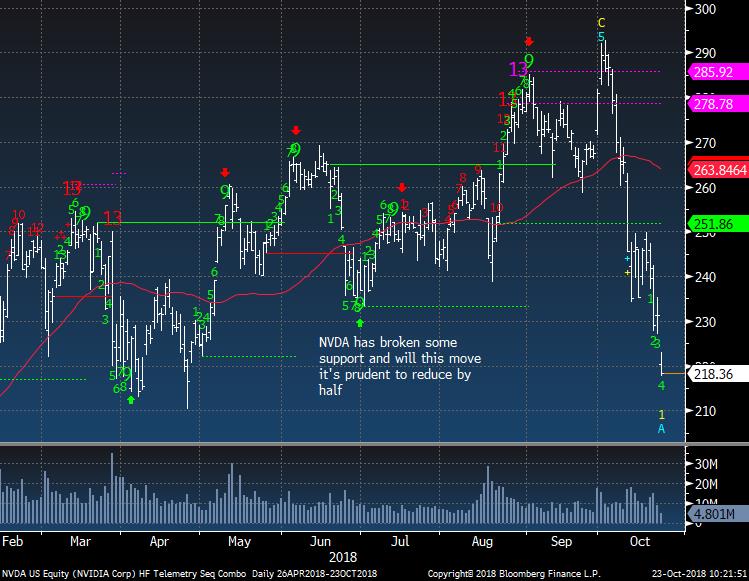
NVDA has been hit hard and I reduced the short by half today
|
|
|
|
|
|
|
PPO Monitor - Percentage Price Oscillator
|
|
|
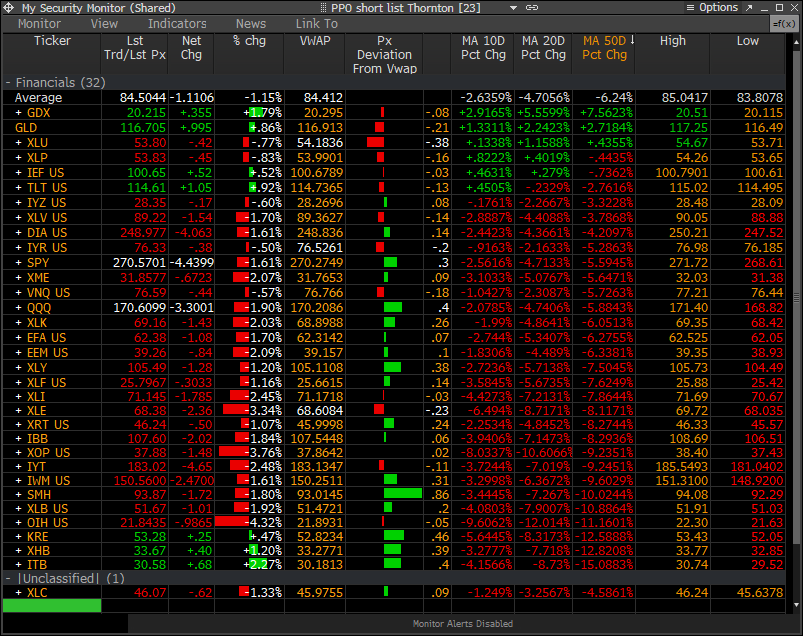
The PPO Monitor is a proprietary monitor developed to force rank Indexes, Sectors, and Stocks. It ranks top down by strongest to weakest by percentage above/below the 50 day moving average. Shorter term signals can be seen when the 10 and 20 day moving averages turn up (green) or down (red) which often are followed by the 50 day moving average. This is useful to watch for historically overbought/oversold percentage above/below the 50 day moving average. It is
non correlated with the DeMark Indicators however we have found upside/downside exhaustion signals often occur when something rises to the top or drifts to the bottom of the monitor - increasing the timing aspect. We share this monitor with clients with Bloomberg Terminals. An added feature is that each market/ETF can be expanded with each component force ranked in the same way. A couple other features include price deviation from intraday VWAP (useful for intraday reversals) and new 20 day highs/lows on right side. Please inquire if you would like to be permissioned to use the PPO Monitor.
Today's highlights: Notice a lot of the sectors are trading above today's VWAP suggesting real buying is happening before they turn positive. Also the weakest homebuilding ETF's are up strong today.
|
|
|
|
|
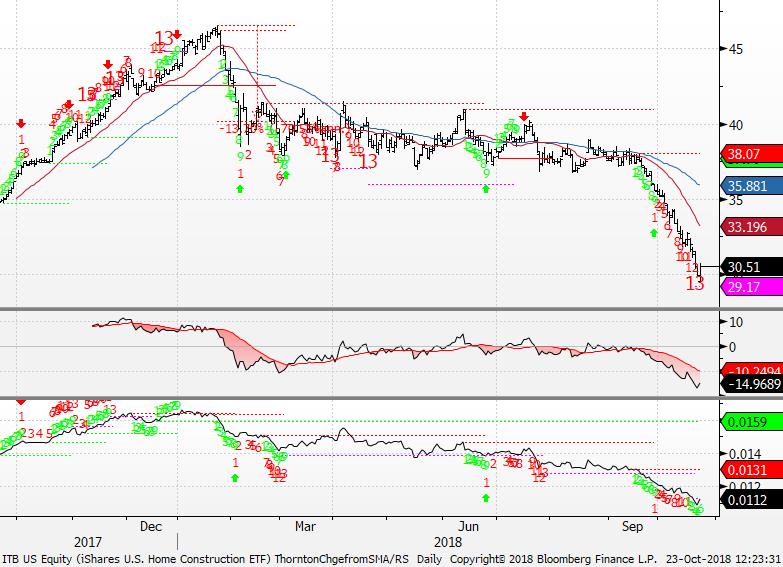
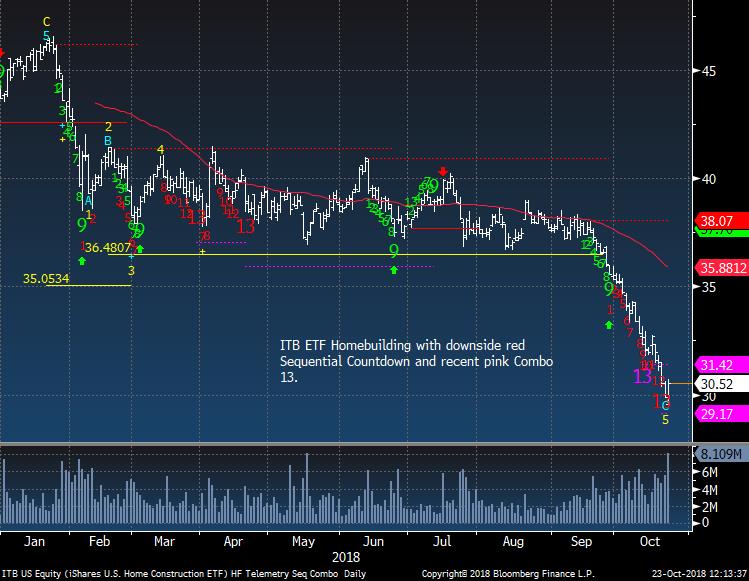
The following chart shows the Percentage Price Oscillator (50 day moving average) in action. ITB was added as a new long as it was 17% below the 50 day and that's oversold
|
|
|
|
|
Also a downside Countdown 13 too
|
|
|
|
|
|
|
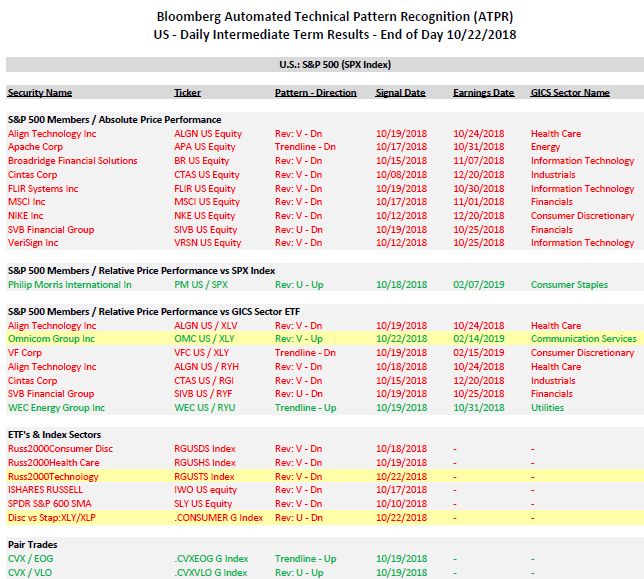
Bloomberg Automated Technical Pattern Recognition Screens
|
|
|
S&P 500 Members/Absolute Price Performance and Relative Price Performance vs S&P 500 and Sector ETF's. ETF's vs Index Sectors. Pair Trades. Long side is first symbol, short side is second symbol. If you would like a PDF from Bloomberg with full details of how this is formulated, please email. We will be doing a webinar in the coming weeks specifically on this system.
|
|
|
|
|
|
|
|
|
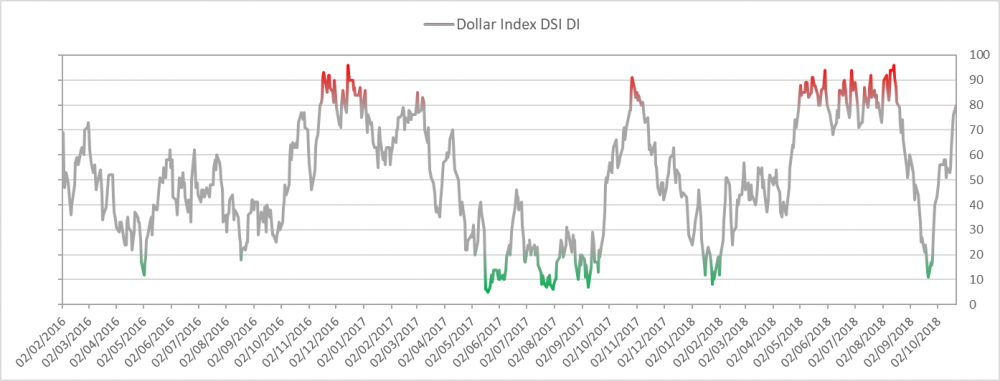
US Dollar bullish sentiment is at 80% and now back in the extreme zone. It can and probably will work higher
|
|
|
|
|
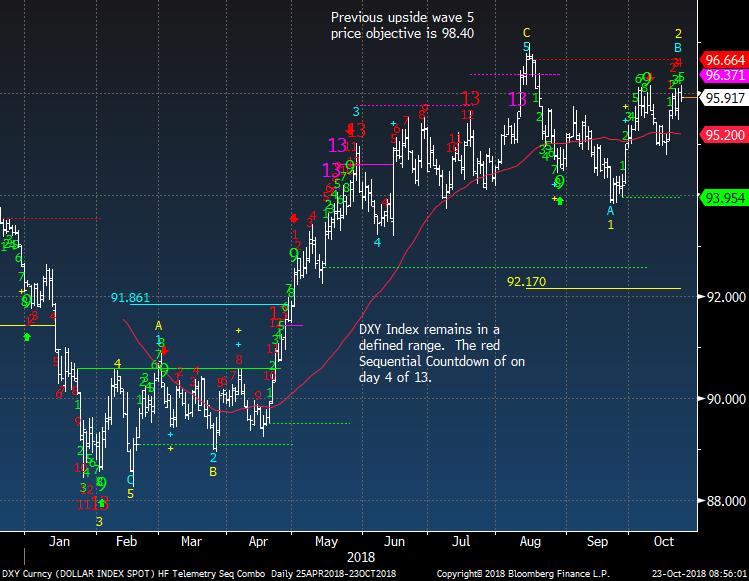
US Dollar Index still in range
|
|
|
|
|
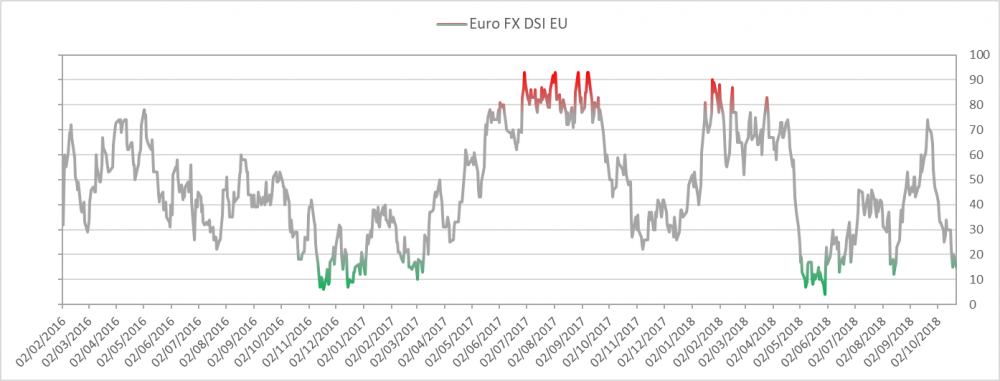
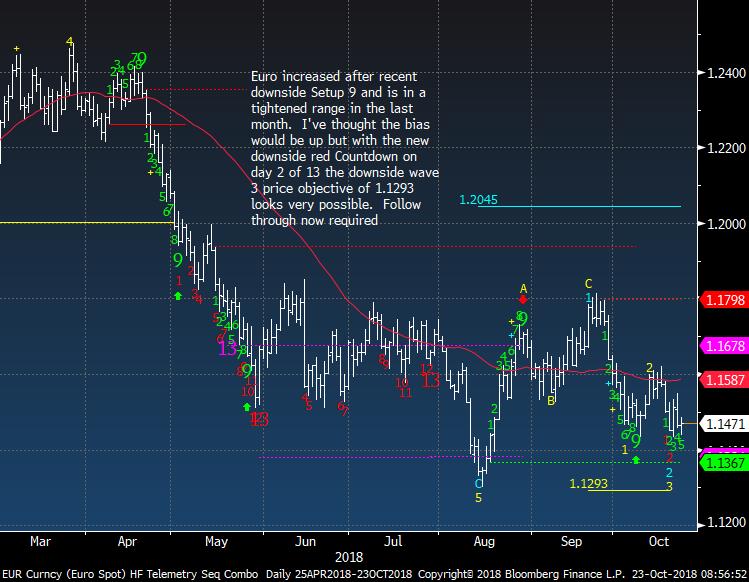
Euro bullish sentiment is at 15% and is oversold but it can and likely work lower
|
|
|
|
|
|
|
|
|
|
|
|
|
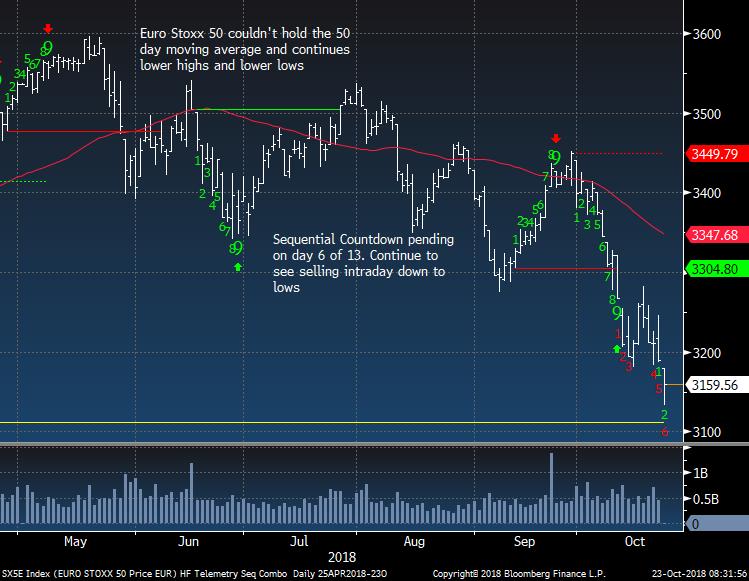
Euro Stoxx 50 just made new lows
|
|
|
|
|
|
|
|
|
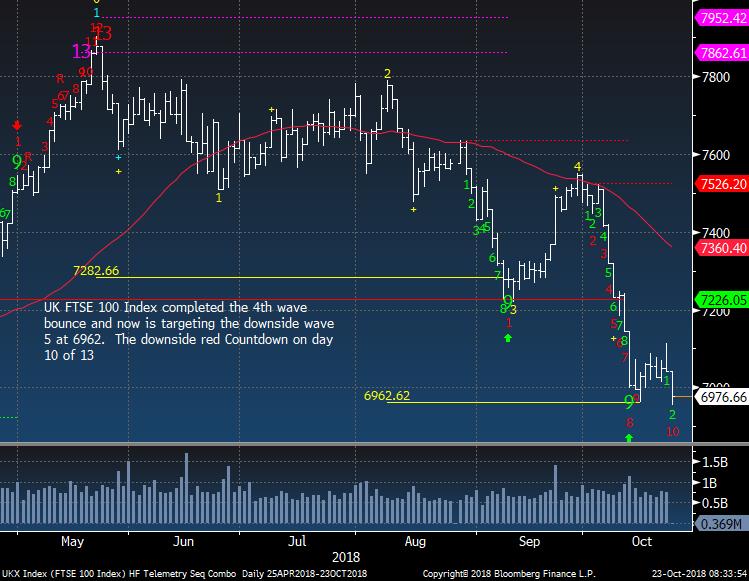
UK FTSE 100 on day 10 of 13 and at wave 5 downside price objective we've been expecting
|
|
|
|
|
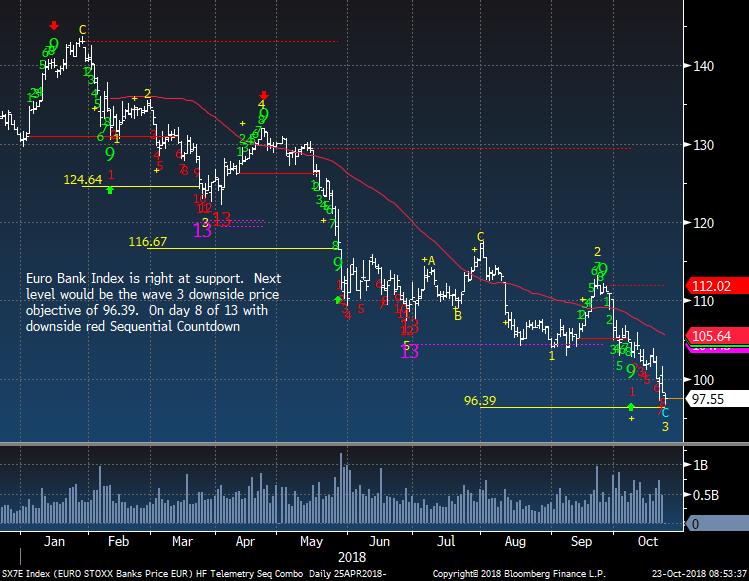
Euro Banks still look bad but it hit the downside wave 3 of 5 price objective
|
|
|
|
|
|
|
|
|
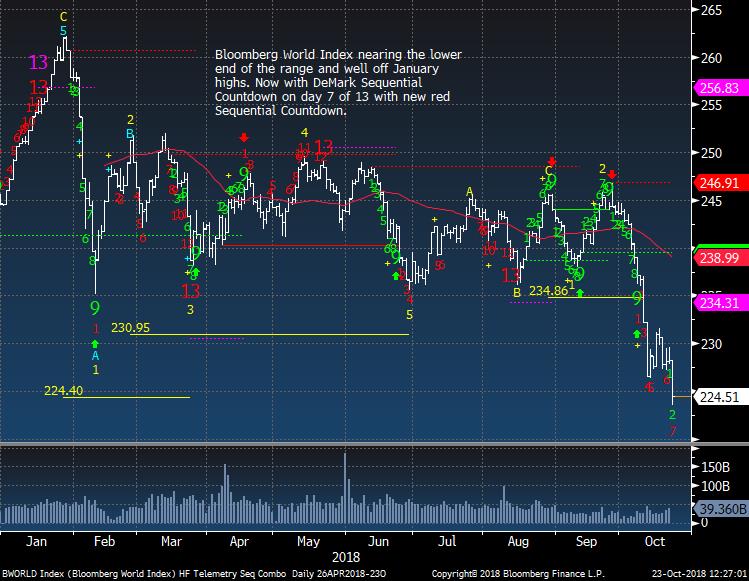
Bloomberg World Index new lows and remains with a downside Countdown
|
|
|
|
|
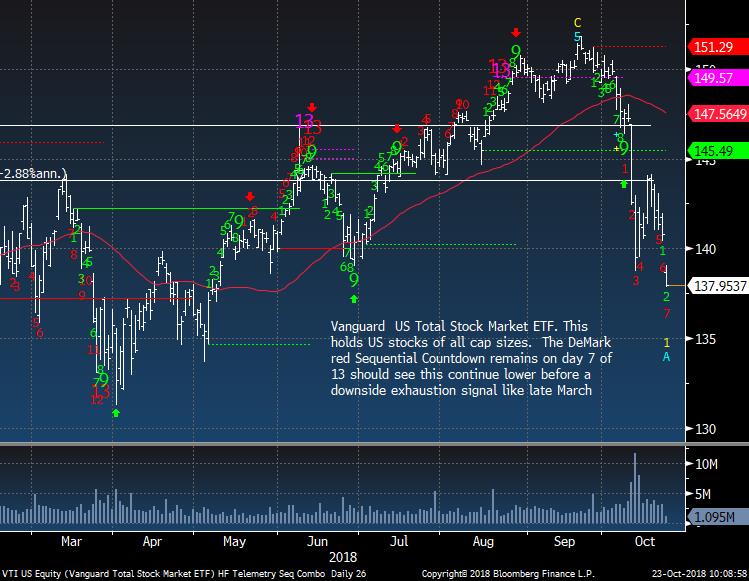
US Total Market ETF still looks dangerous but a wave 2 bounce is ahead
|
|
|
|
|
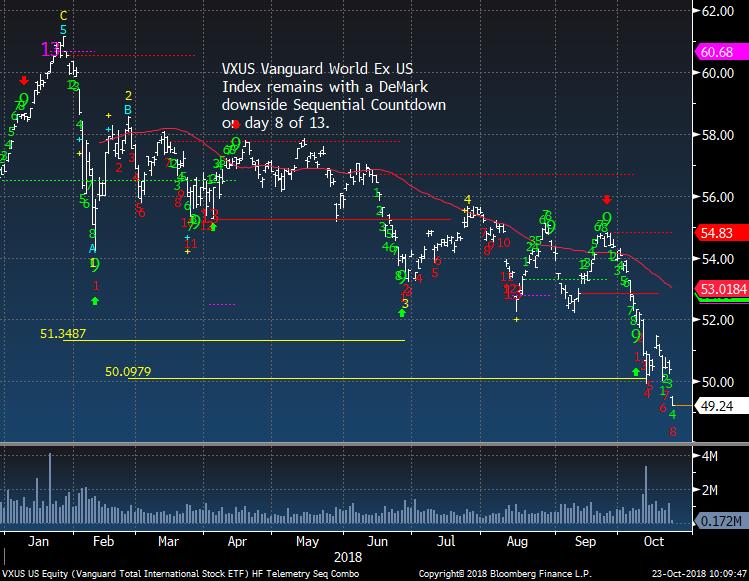
World Markets Ex US new lows
|
|
|
|
|
|
|
|
|
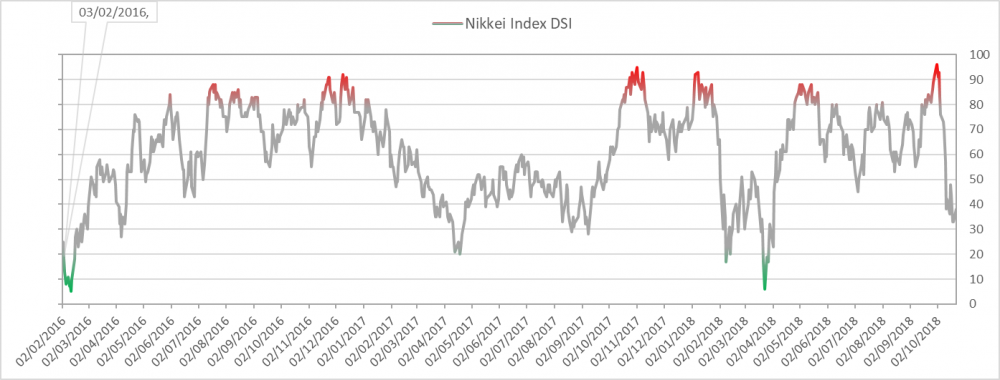
Nikkei bullish sentiment is at 38%
|
|
|
|
|
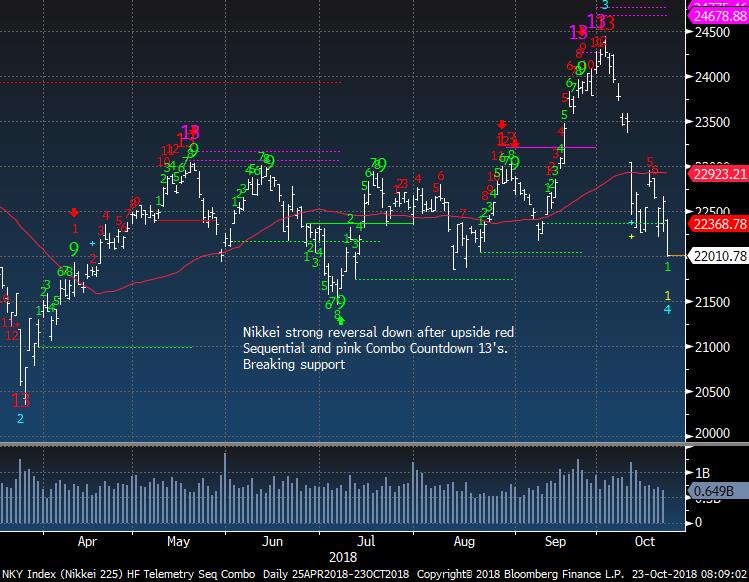
Nikkei has support at 21,500
|
|
|
|
|
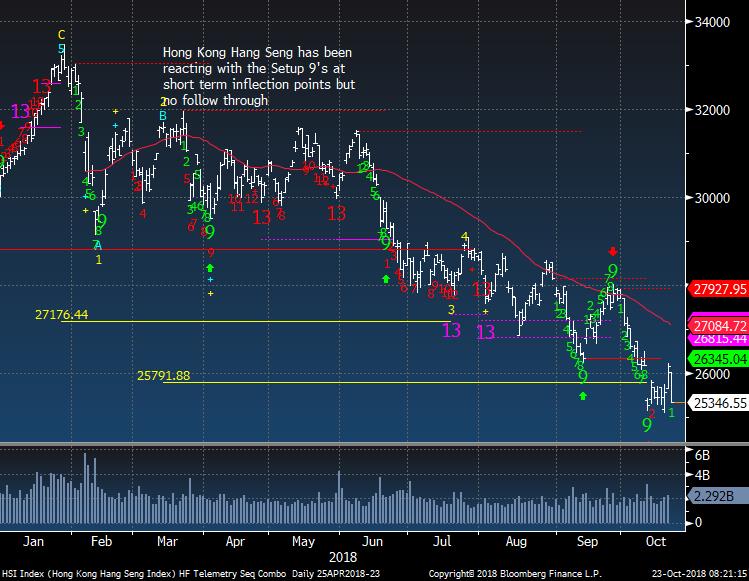
China / Hong Kong FXI ETF bad day today giving everything back from the previous day
|
|
|
|
|
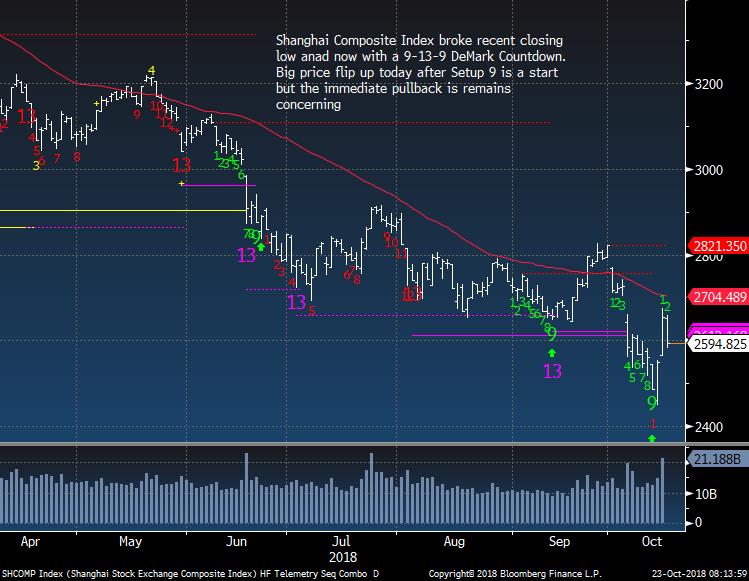
Shanghai still above the previous day's low so small positive in a very negative index
|
|
|
|
|
|
|
|
|
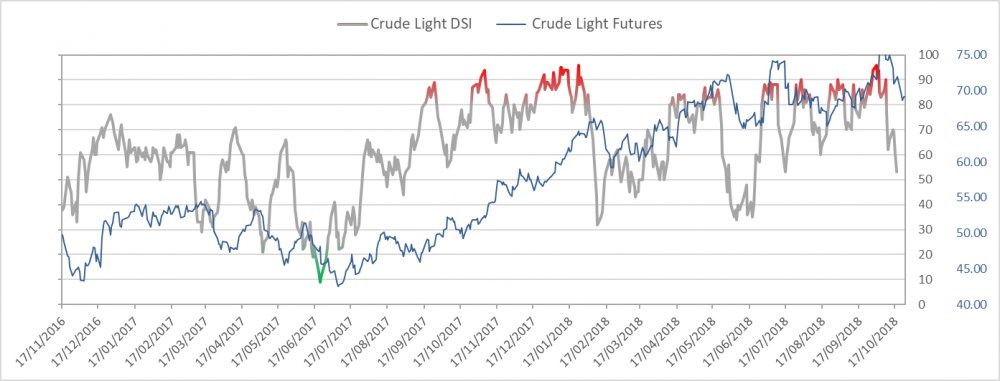
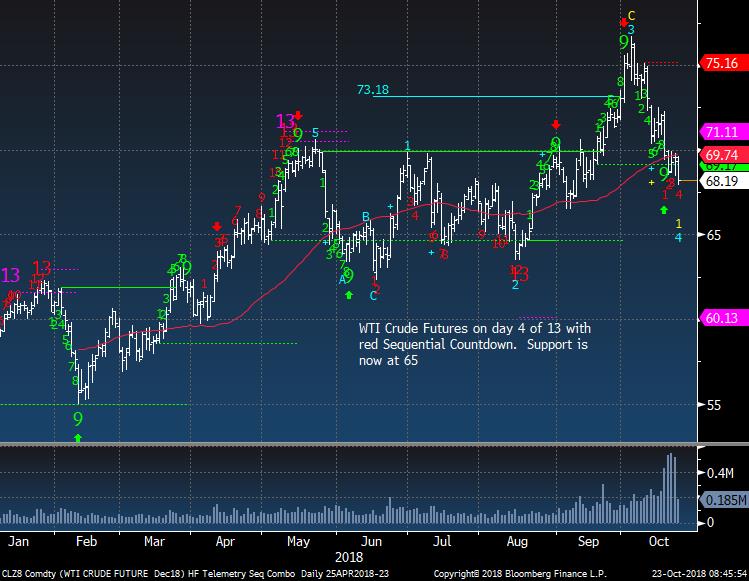
Crude bullish sentiment is at 61%
|
|
|
|
|
WTI Crude Futures breaking support at 70 with next support at 65
|
|
|
|
|
|
|
|
|
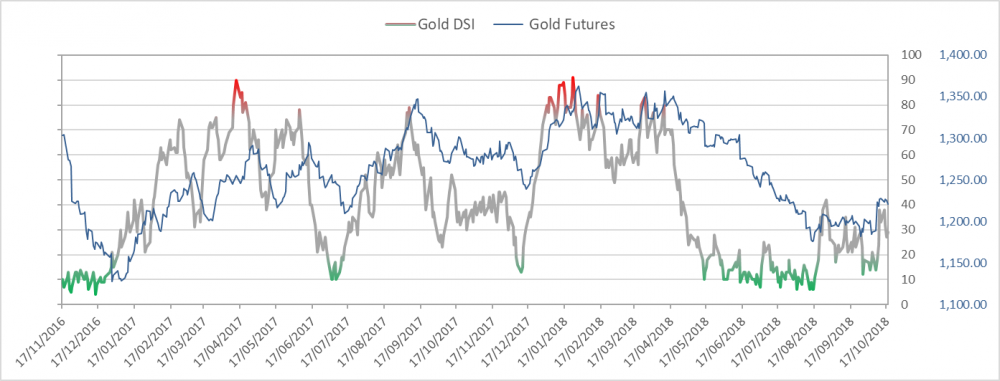
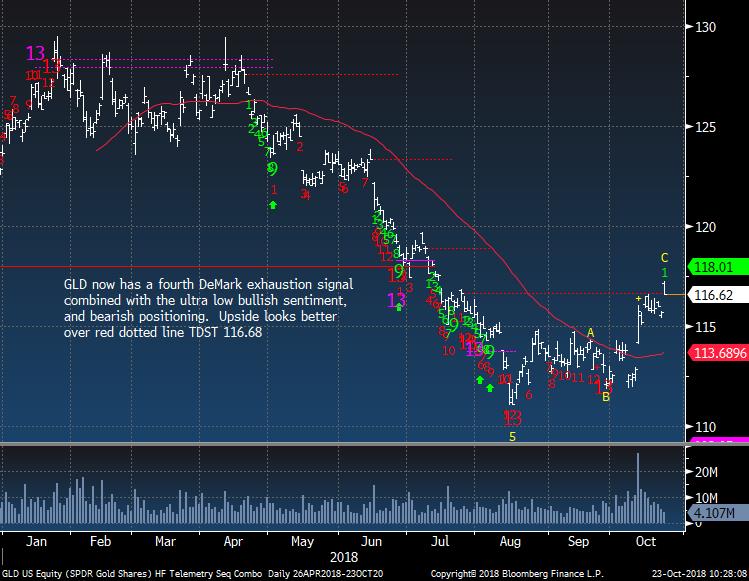
Gold bullish sentiment is at 23% and remains weak
|
|
|
|
|
Gold GLD gap up and reversed. Not a great sign
|
|
|
|
|
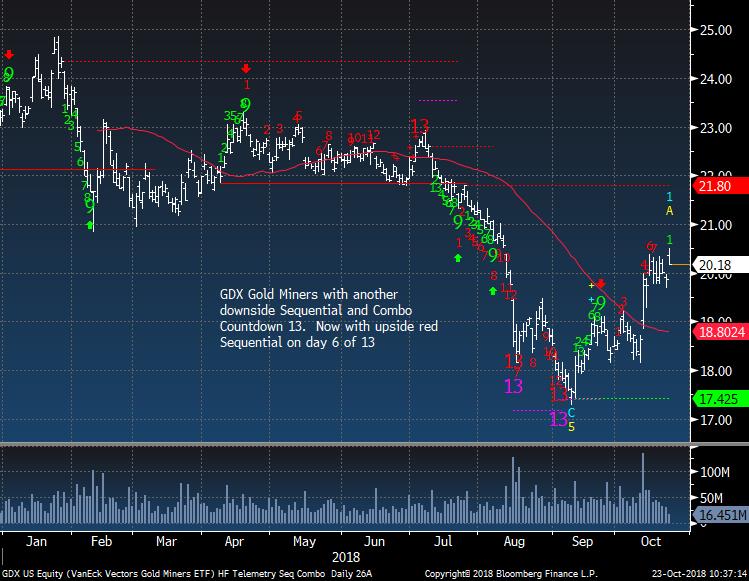
Gold Miners GDX ETF same story. I'll stay long GLD and GDX for now
|
|
|
|
|
|
|
|
|
Bond bullish sentiment is at 41%
|
|
|
|
|
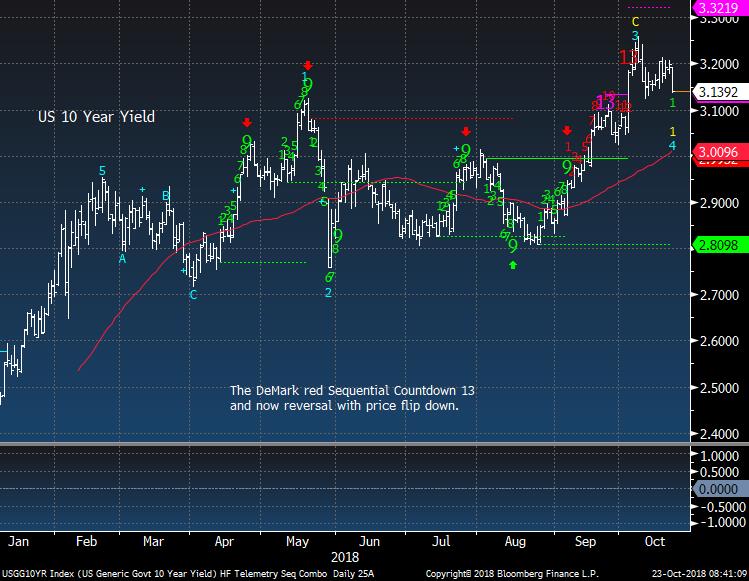
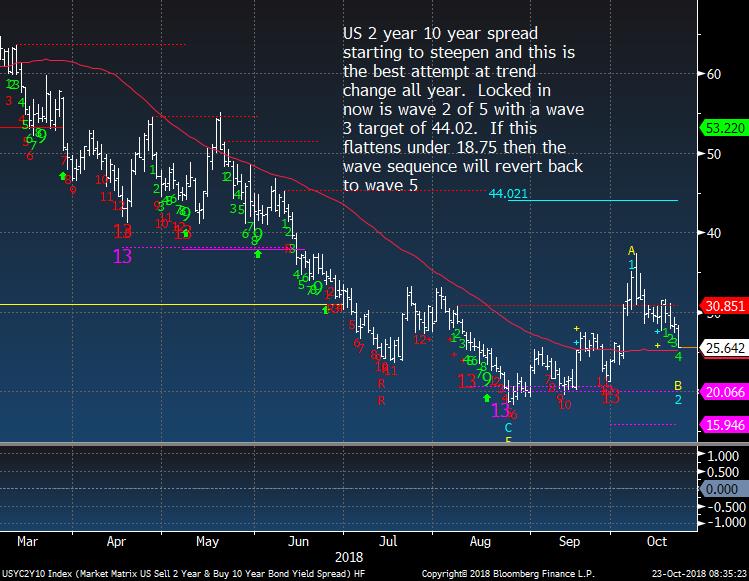
US 10 Year Yield reversing in a "risk off" way
|
|
|
|
|
|
|
|
|
|
|
|
|
|
|
DEMARK SCREENS - Daily, Weekly, Monthly Upside/Downside Exhaustion Signals
|
|
|
Daily/Weekly DeMark upside/downside exhaustion signals (Sequential) updated daily, Weekly signals on Monday's and monthly on the first day of the new month. Price flips occur when a stock closes higher/lower than four previous closes and increases conviction of a price turn.
The upside 13's are sell signals and downside 13's are buy signals. Price flip's are confirmation signals that increases potential for a price trend change. For example, if you are long a stock and there is an upside 13, you will want to take cautious action by selling down or out of a position. If initiating a short sale with the upside 13's, we tend to start with a 1/2 size and add with the downside price flip. The opposite is true for when there are downside 13's. Take a 1/2 size position
and add with the upside price flip. The DeMark Indicators are designed to assist the user with buying into weakness and selling into strength to anticipate trend exhaustion. Selling into a rally and buying into a decline often afford the opportunity to exit a trade without too serious a loss if wrong.
S&P 500 Universe:
DAILY UPSIDE 13: MKC
DAILY DOWNSIDE 13: AMAT, BXP, MS, RHT, WU
DAILY UPSIDE WITH PRICE FLIP REVERSAL DOWN: BSX, DG, YUM
DAILY DOWNSIDE WITH PRICE FLIP REVERSAL UP: NONE
Updated: 10/22/18
WEEKLY UPSIDE 13: NONE
WEEKLY DOWNSIDE 13: COTY, IRM, VNO
Updated: 10/1/18
MONTHLY UPSIDE 13: ADSK, ALL, CCI, CME, DE, DLR, DTE, ETN, GLW, HPQ, INTU, PH, TPR, TXT, UPS, XLNX
MONTHLY DOWNSIDE 13: NONE
Euro Stoxx 600 Universe:
DAILY UPSIDE 13: NONE
DAILY DOWNSIDE 13: IMI LN, KGX GR, NXT LN, REN NA, SMIN LN, SPR GR, STJ
LN
DAILY UPSIDE WITH PRICE FLIP REVERSAL DOWN: NONE
DAILY DOWNSIDE WITH PRICE FLIP REVERSAL UP: HSBA LN, SBRY LN
Updated: 10/22/18
WEEKLY UPSIDE 13: MUV2 GR
WEEKLY DOWNSIDE 13: BAS GR, FHZN SW, FRA GR, IMB LN, JMT PL, ONTEX BB, OSR GR
Updated: 10/1/18
MONTHLY UPSIDE 13: BNZL LN, EXPN LN, FPE3 GR, SBMO NA, SECUB SS, SWEDA SS
MONTHLY DOWNSIDE 13: BAYN GR, HMB SS, TEF
SM
|
|
|
Unsubscribe me from Hedge Fund Telemetry
Hedge Fund Telemetry LLC, P.O. Box 4675, Greenwich, CT 06861, United States
CONFIDENTIALITY NOTE and DISCLAIMER: This message is for the named person's use only. It may contain confidential, proprietary or legally privileged material. No confidentiality or privilege is waived by any accidental or unintentional transmission. If you receive this message in error, please immediately delete it and all copies of it from your system, destroy any hard copies and notify the sender. You must not, directly or indirectly, use, disclose,
distribute, print or copy any part of this message if you are not the intended recipient. Hedge Fund Telemetry LLC. cannot guarantee the confidentiality of the material transmitted; therefore, information of a sensitive or confidential nature should not be transmitted. There is risk in trading markets. Hedge Fund Telemetry LLC reports are based on information gathered from various sources and believed to be reliable, but are not guaranteed as to accuracy and completeness. The information is subject to change without notice and Hedge Fund Telemetry LLC has no obligation to provide any updates or changes. Hedge Fund Telemetry LLC is providing this data for informational and educational purposes and does not believe that it is sufficient to base an investment decision on. This information should not be regarded as a solicitation or recommendation of any particular security or to engage in any trading strategy. One should always check with your licensed financial
advisor to determine suitability of any investments.
|
|
|
|
|