|
|
|
|
|
|
Three Quick Thoughts For Monday
|
|
|
Just got in from a fun weekend for the Formula 1 race in Austin. Always a great time especially this year since my daughter came with me to see her first F1 race. She was very impressed and amazed. If you get a chance to attend a race it's quite the spectacle.
Three Quick Thoughts for Monday:
First, China is trying a lot of ways to stabilize their markets with a top down policy approach. 3Q18 Real GDP and September details were near the weak consensus. Beijing’s economic priority now is offsetting the trade-war economic drag with MP and FP initiatives. The leaders see the slowing and this has always been a big risk and concern that there could be political instability. So far, China has shown restrain to react to Trumps rhetoric and has proposed some industries to target. If, BIG IF, they start to target individual US companies, it would be a game changer escalating bringing the awareness to the American public as the markets would react very negatively.
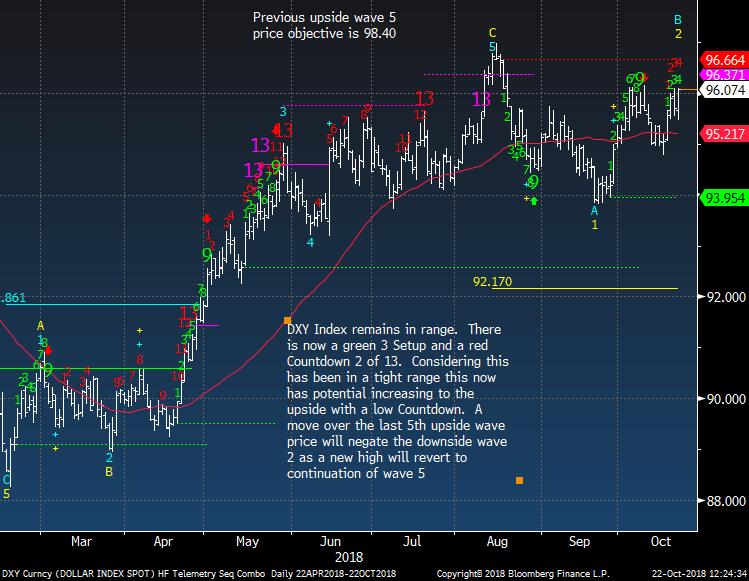
Second, the USD is the first thing I am looking on my Bloomberg on my phone when I wake up each day and sometimes in the middle of the night. A higher USD as discussed all year would have a lot of alarm bells ringing. The USD looks higher and a new high is
not far. There are signs European and Asian access to USD is getting tight.
Third, markets have seen fading after early strength. It's been happening all over the world. This is a concern as it continues to run buyers over weakening risk appetite. The buy the dip people are backing off with the enthusiasm seen in recent years as confidence wanes. This week in the US will have the busiest week with earnings and with markets down from highs the bar has actually been lowered so the potential for some sharp gains are probable. On the other hand, look at the recent Netflix pop and drop multi day fade and I would attribute that to the fact that there has been very little short interest in Netflix as well similar all the big mega gap FANG stocks. With markets at weak support levels any breaks could be magnified to the downside without a decent amount of shorts. A lot is riding on these earnings reports to stabilize the US markets. Tight
stops, extra percentage of cash, and downside hedges is prudent strategy right now.
- US Markets - No sentiment charts today but I did post readings on key markets. Everything at support
- Hedge Fund Telemetry Trade Ideas - FCX stopped out Friday as mentioned it was possible
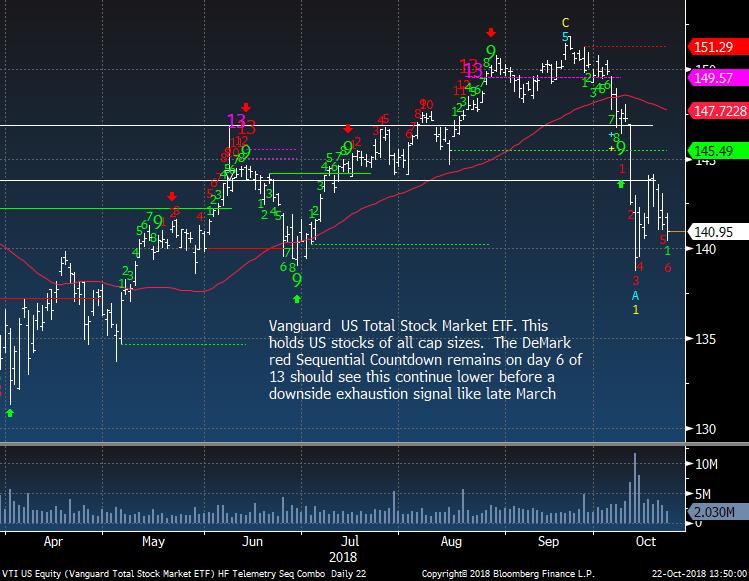
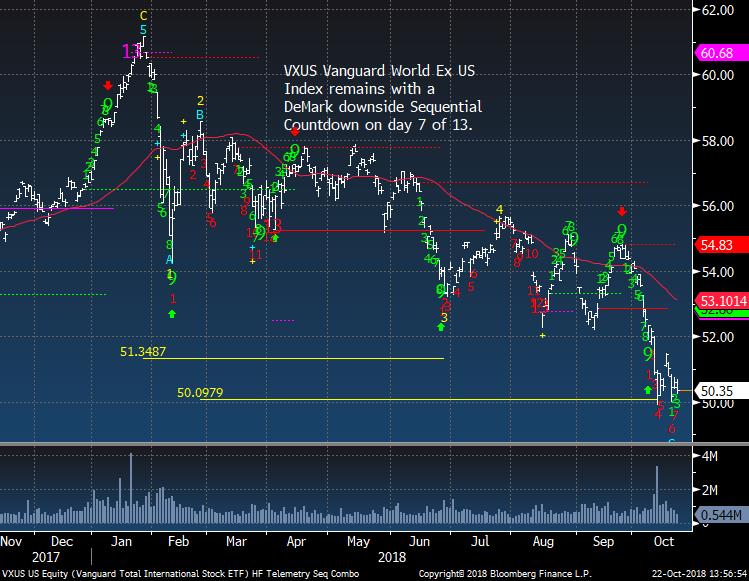
- US
Markets vs World Ex US ETF - Update still looks risky with downside DeMark Countdowns
- PPO Monitor - Percentage Price Oscillator Force Ranked Sector Rotation - Defensive sectors on top
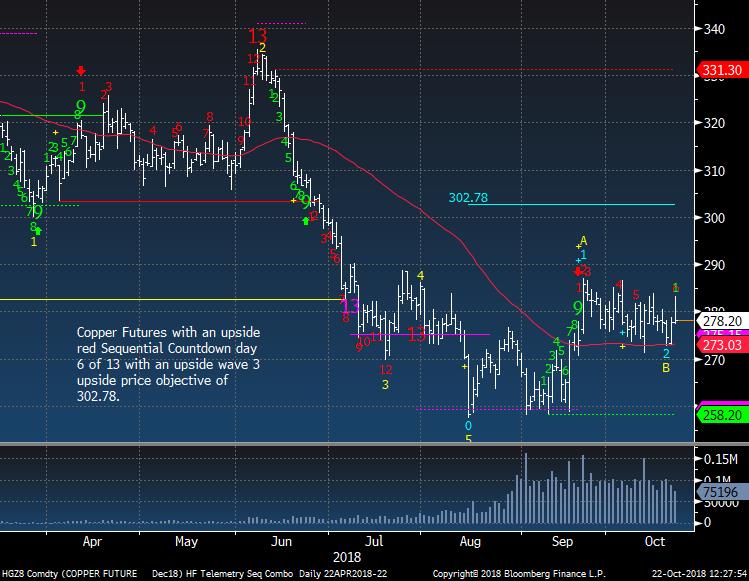
- Copper Update
- Bloomberg Technical Pattern Recognition Screen
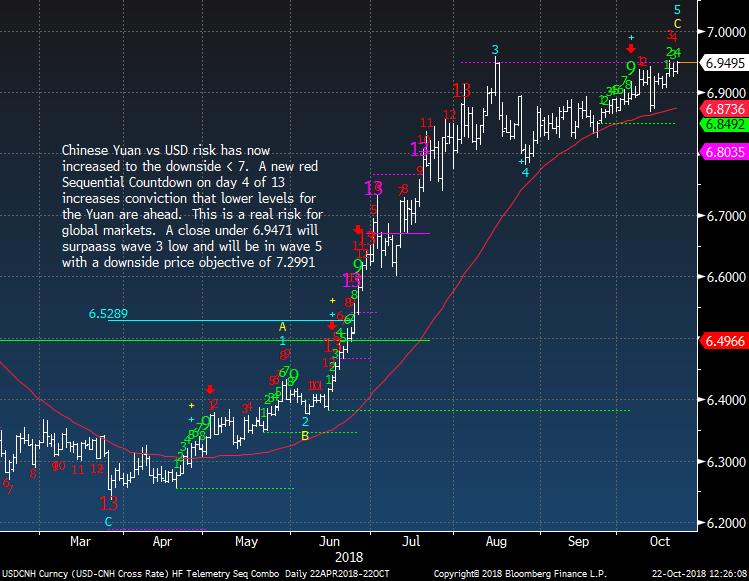
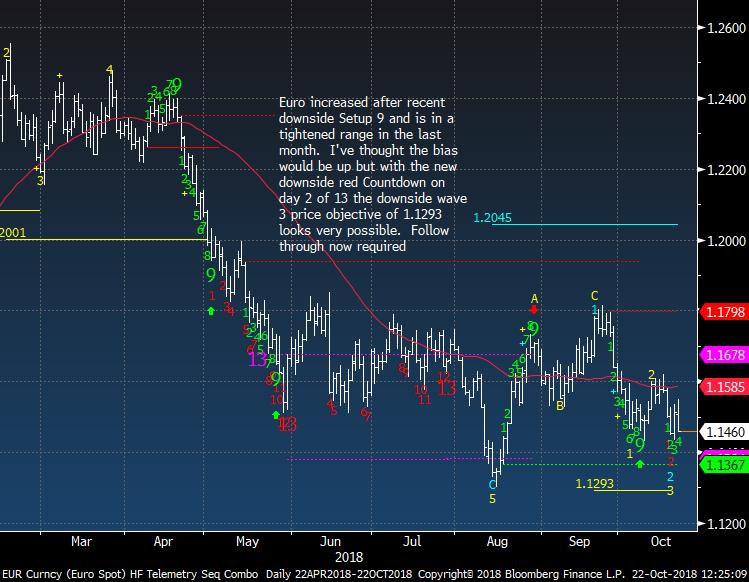
- Currency Update - The USD
looks higher
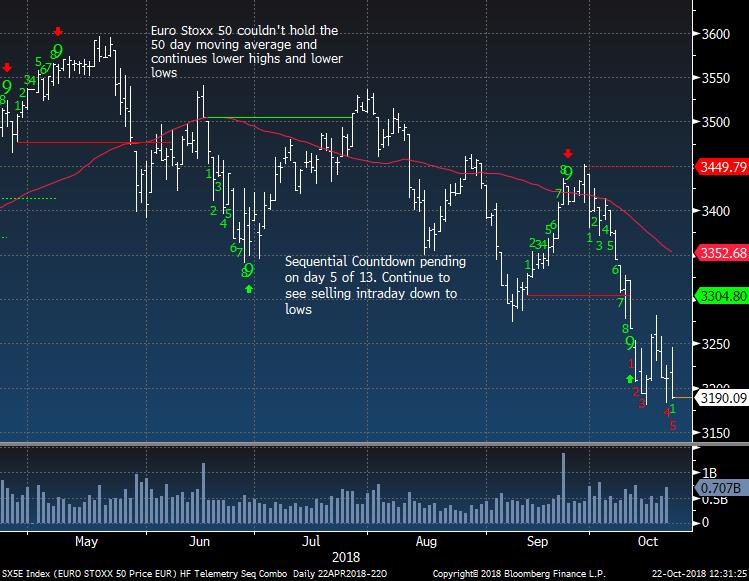
- European Market Update - Just terrible price action
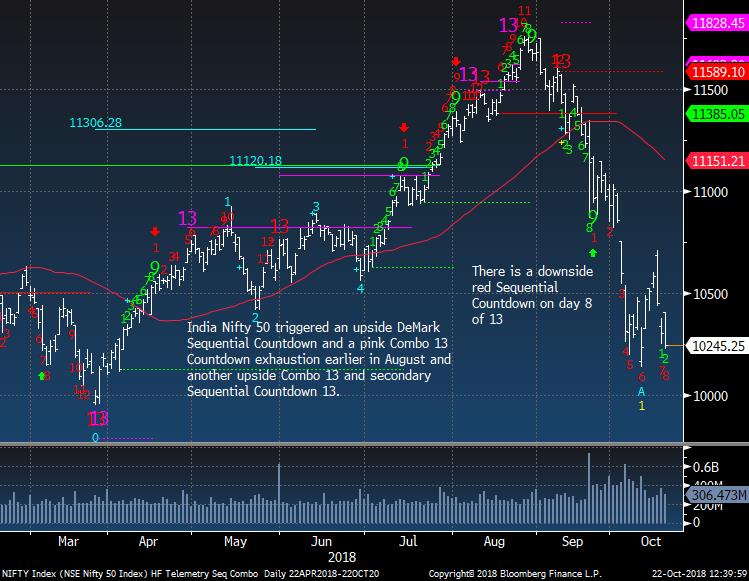
- India Update - At support but looks lower
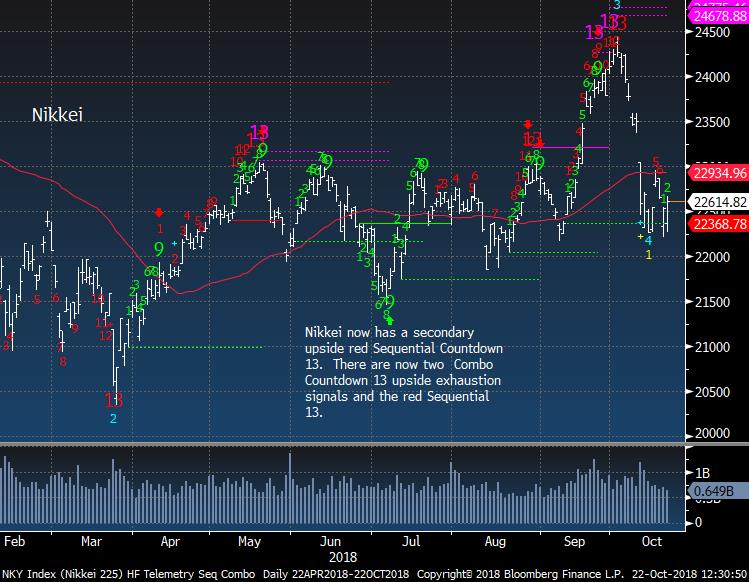
- Asian Market Update - Nikkei at support, MUST have follow through tomorrow in China
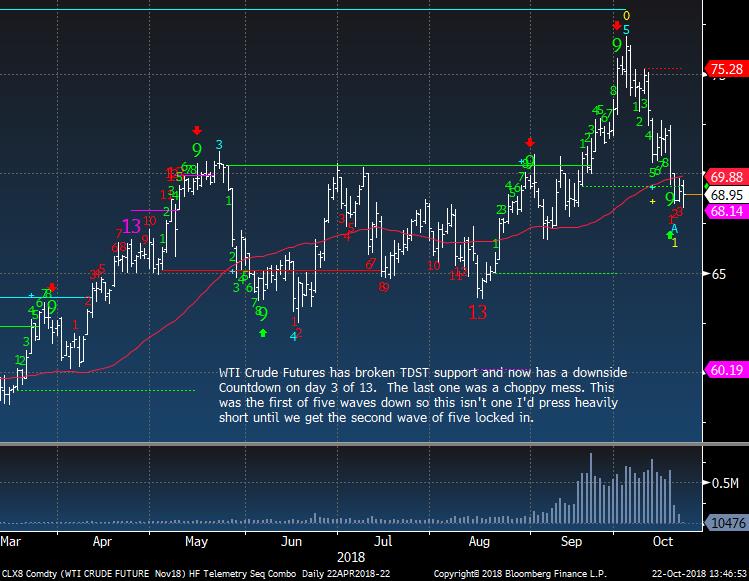
- Crude Update - At support
- Gold Update - Stalling and I might exit longs if USD continues higher
- Bond Update - Lower yields before higher.
- DeMark Screens - Daily, Weekly, Monthly upside/downside exhaustion signals within the S&P 500 and Euro Stoxx 600 Weekly data updated
|
|
|
|
|
Here's a link to the Hedge Fund Telemetry market sentiment page with 40 charts of sentiment including equities, bonds, currencies, and commodities updated each day. When the new website launches we will be adding new charts and historical sentiment data for Euro Stoxx 50, UK FTSE 100, German DAX, French Cac 40. We will be adding Japanese Bonds, German Bunds, and a few more.
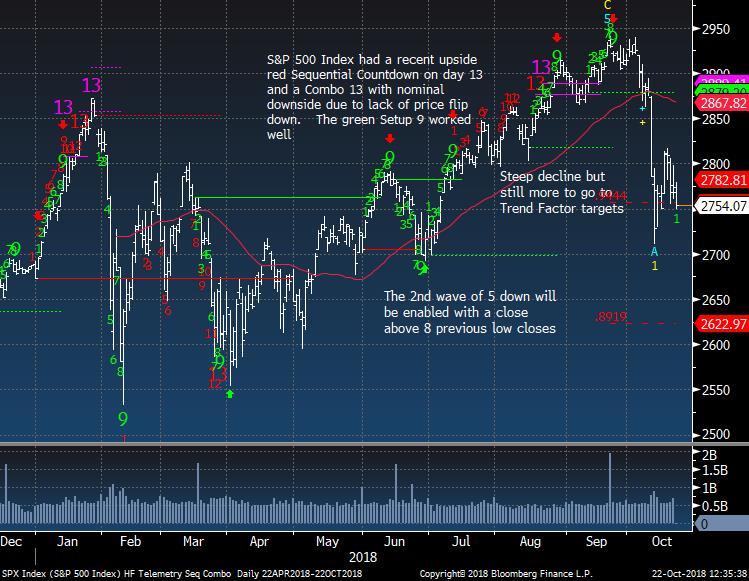
SPX bullish sentiment is at 13% and the index could move to the downside lower Trend Factor target at 2622 - note in February it did hit the .8919 target
|
|
|
|
|
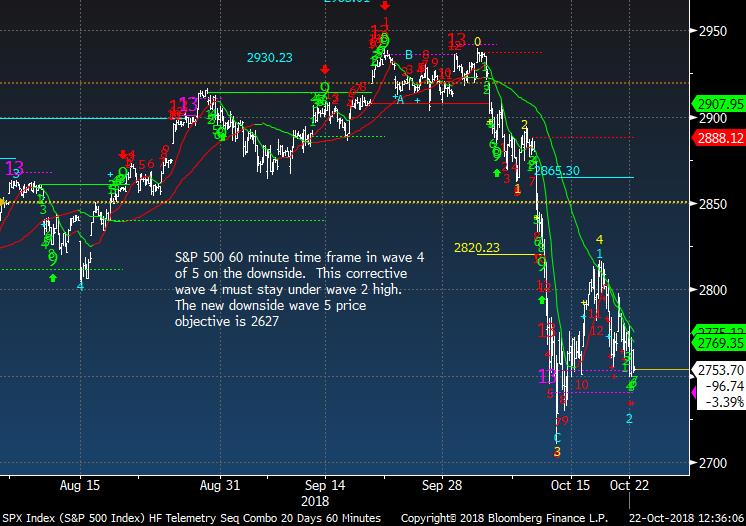
SPX 60 minute tactical time frame will lock in the wave 5 downside breaking the recent lows and all the recent buyers will likely run for the doors
|
|
|
|
|
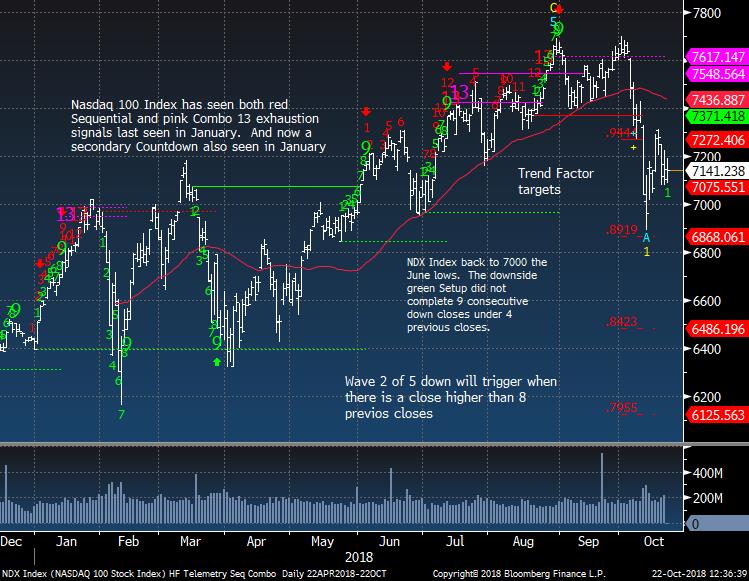
Nasdaq bullish sentiment is at 10% and is very low. Big weights MSFT, INTC, AMZN, GOOGL reports Wednesday and Thursday. A lot of pressure on them to deliver
|
|
|
|
|
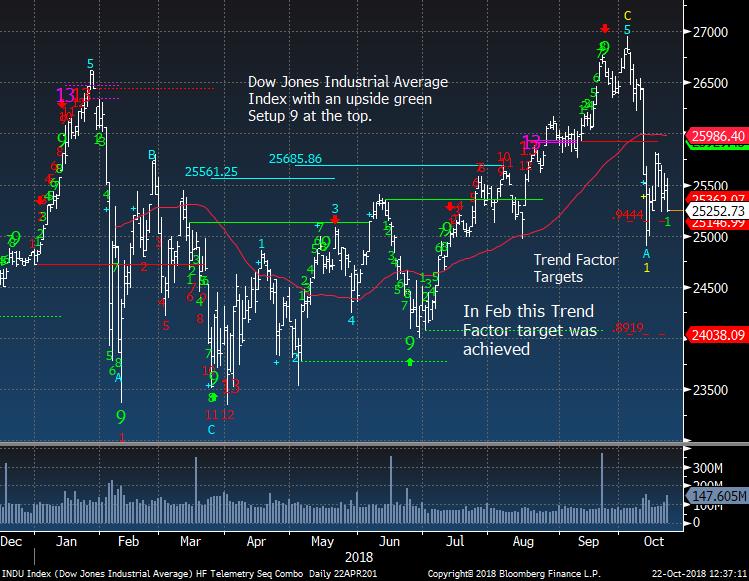
Dow Jones Industrial Average looks concerning there are several very heavy weighted Dow components reporting this week
|
|
|
|
|
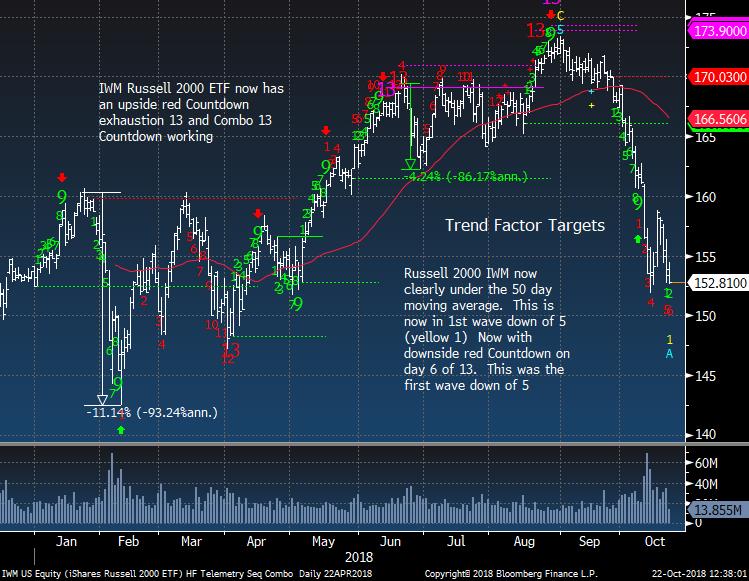
IWM Russell 2000 still looks the worst of all US indexes
|
|
|
|
|
|
|
Hedge Fund Telemetry Trade Ideas
|
|
|
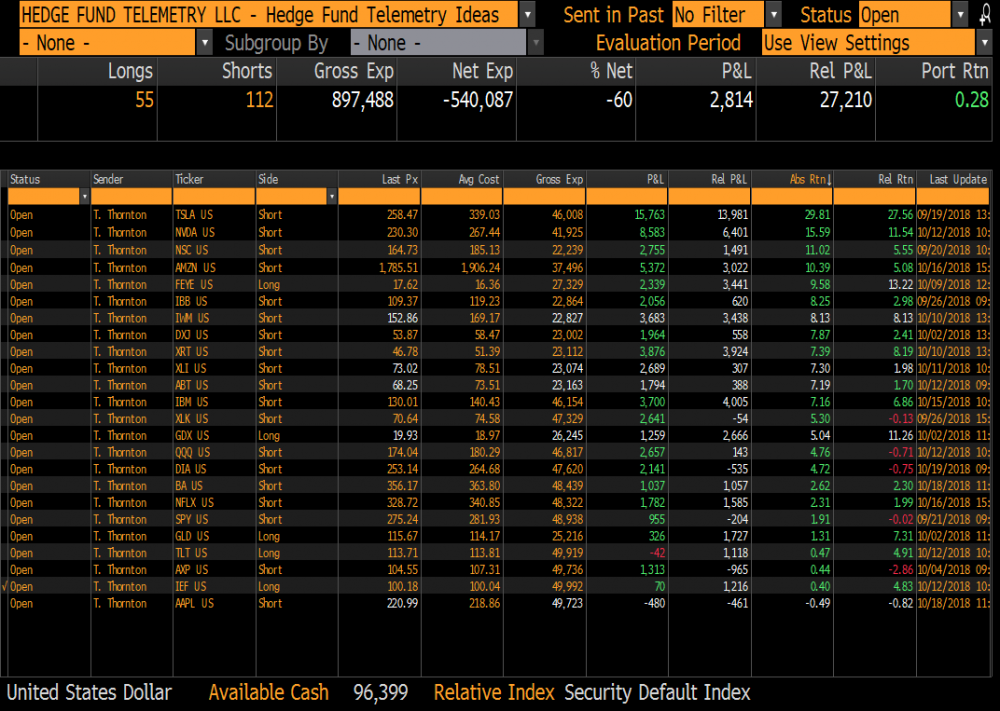
Trade Ideas Sheet - Long and short US equity ideas
including ETF's. We will be overhauling the Trade Ideas Sheets for long only, short only, ETF's when the new website rolls out soon. There will also be a clearer email distribution with changes.
Trade Ideas Changes: STOPPED ON FCX LONG -8%
Stops on everything. TSLA 285, GDX 17.35 , FEYE 16.00, NVDA 255, QQQ 179, XLK 75, SPY 285, XLY 113, AXP 109, XRT 50, IWM 163, NSC 173, DIA 260, XLI 77 IBB 116, ABT 75, AMZN 1860 DXJ 56 , GLD 111, IEF 98 TLT 112 , AAPL 225, BA 370, IBM 140, NFLX 375 (RECENTLY ADJUSTED STOPS)
|
|
|
|
|
|
|
US Markets and World Markets Ex US
|
|
|
|
|
|
|
|
|
|
|
|
|
|
|
Copper bullish sentiment is at 28% and faded after early China related strength
|
|
|
|
|
|
|
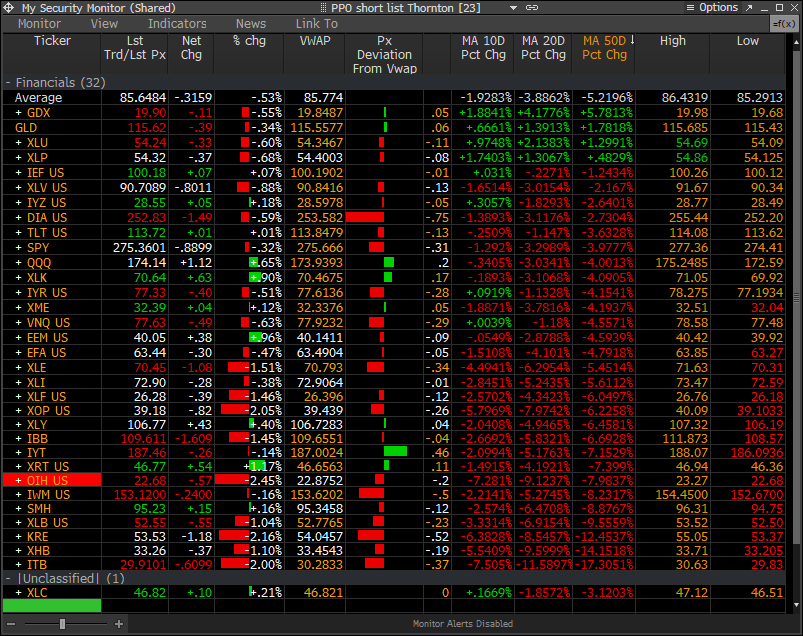
PPO Monitor - Percentage Price Oscillator
|
|
|
The PPO Monitor is a proprietary monitor developed to force rank Indexes, Sectors, and Stocks. It ranks top down by strongest to weakest by percentage above/below the 50 day moving average. Shorter term signals can be seen when the 10 and 20 day moving averages turn up (green) or down (red) which often are followed by the 50 day moving average. This is useful to watch for historically overbought/oversold percentage above/below the 50 day moving average. It is
non correlated with the DeMark Indicators however we have found upside/downside exhaustion signals often occur when something rises to the top or drifts to the bottom of the monitor - increasing the timing aspect. We share this monitor with clients with Bloomberg Terminals. An added feature is that each market/ETF can be expanded with each component force ranked in the same way. A couple other features include price deviation from intraday VWAP (useful for intraday reversals) and new 20 day highs/lows on right side. Please inquire if you would like to be permissioned to use the PPO Monitor.
Today's highlights: The defensive sectors remain at the top and we are seeing a lot sectors break 20 day lows which were the recent lows so this is concerning
|
|
|
|
|
|
|
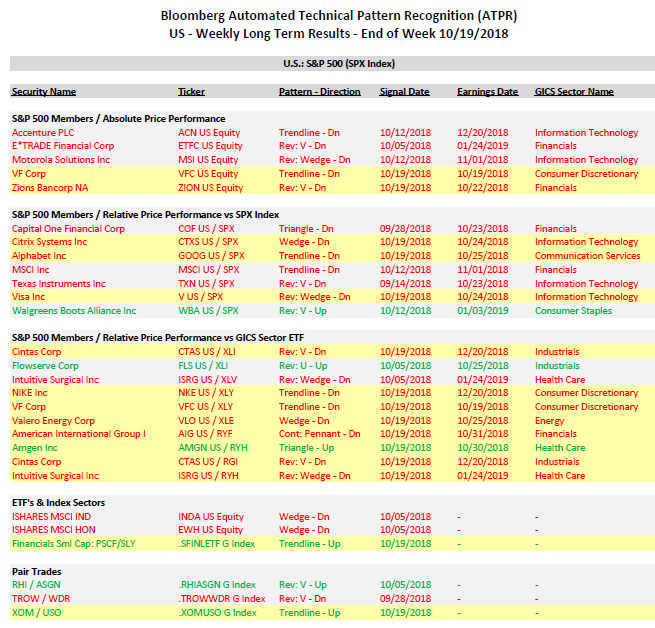
Bloomberg Automated Technical Pattern Recognition Screens
|
|
|
S&P 500 Members/Absolute Price Performance and Relative Price Performance vs S&P 500 and Sector ETF's. ETF's vs Index Sectors. Pair Trades. Long side is first symbol, short side is second symbol. If you would like a PDF from Bloomberg with full details of how this is formulated, please email. We will be doing a webinar in the coming weeks specifically on this system.
|
|
|
|
|
|
|
|
|
US Dollar Index bullish sentiment is at 76%
|
|
|
|
|
|
|
|
|
|
|
|
|
British Pound Sterling could not continue the upside momentum
|
|
|
|
|
|
|
|
|
Euro Stoxx 50 just looks terrible still. Look at the fade today
|
|
|
|
|
|
|
India Nifty 50 Index Update
|
|
|
Opened up and faded hard too
|
|
|
|
|
|
|
|
|
Nikkei bullish sentiment is at 33% and the index is holding support
|
|
|
|
|
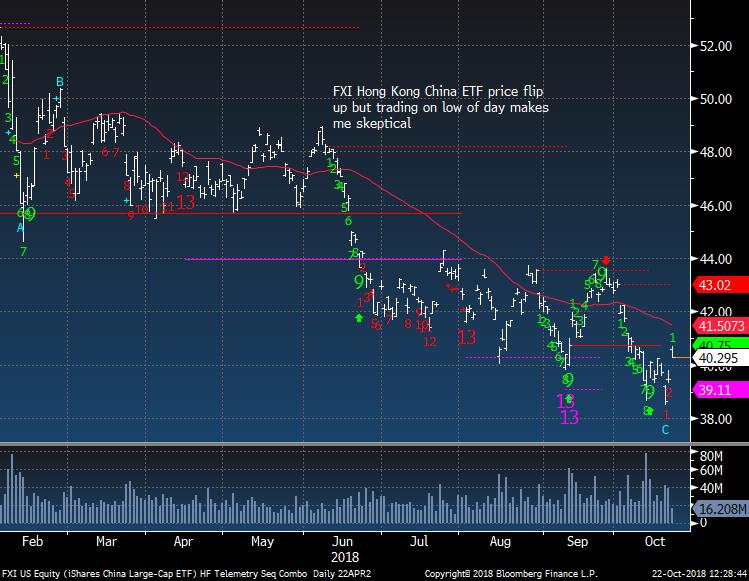
China / Hong Kong FXI ETF gapped up but faded to low of day.
|
|
|
|
|
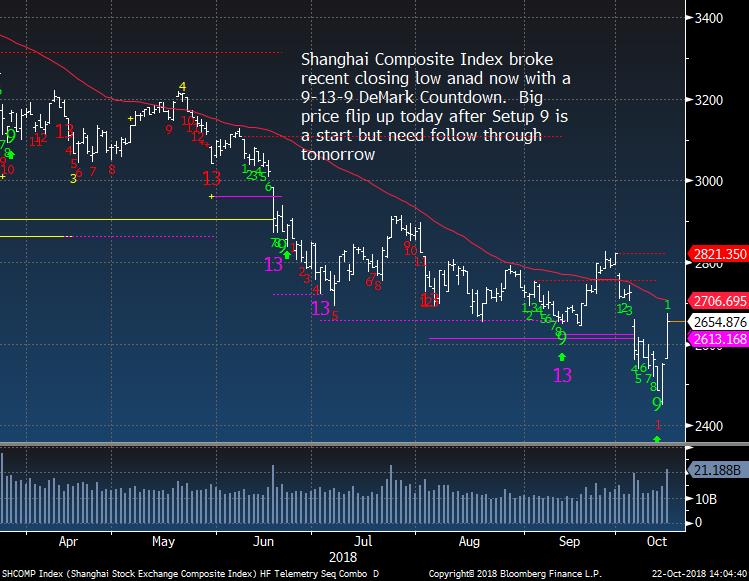
Shanghai MUST follow through or else global markets could act rather consider the China top down talk won't help China markets.
|
|
|
|
|
|
|
|
|
WTI Crude Futures bullish sentiment is at 57% and Crude is at support
|
|
|
|
|
|
|
|
|
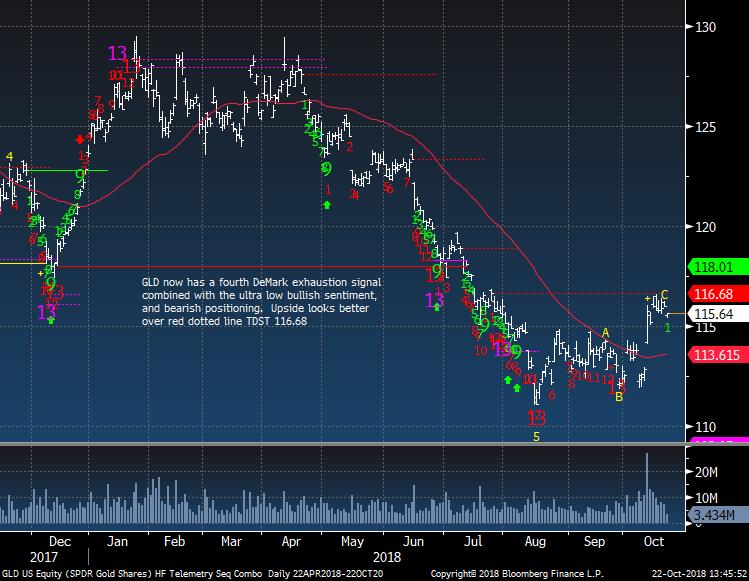
Gold bullish sentiment is at 27% and the metal is stalling. I might sell this if the USD continues higher
|
|
|
|
|
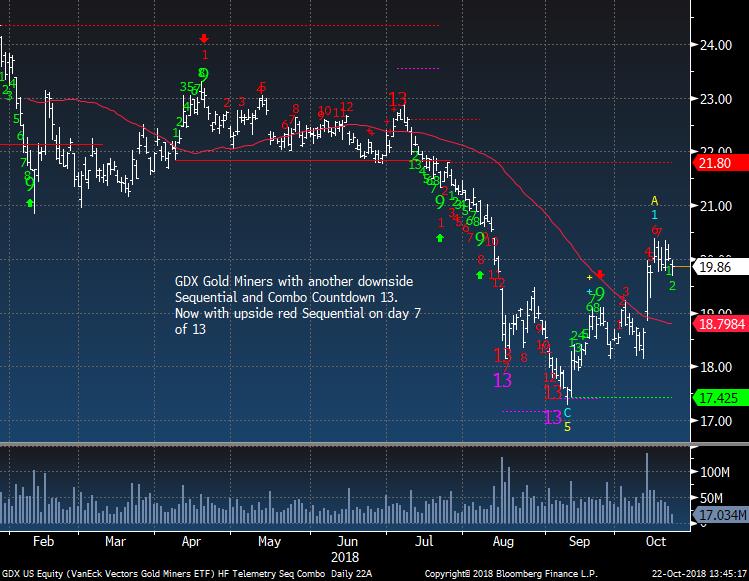
Gold Miners GDX ETF same plan
|
|
|
|
|
|
|
|
|
Bond bullish sentiment is at 39%
|
|
|
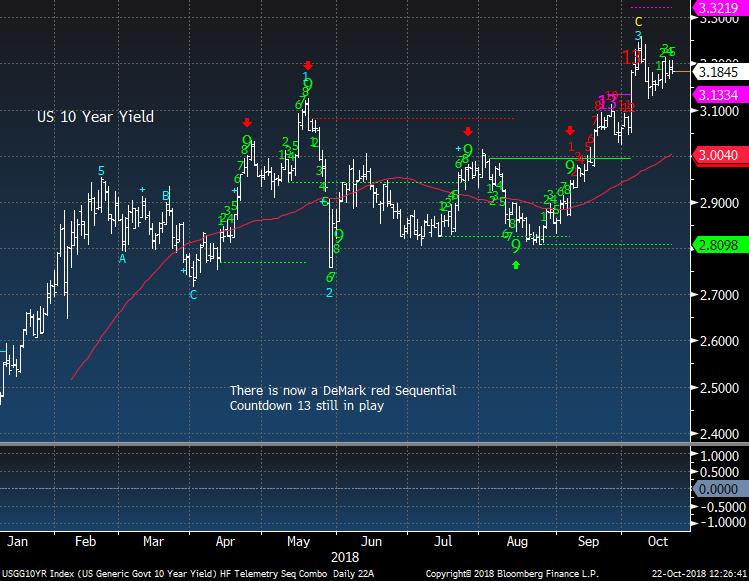
US 10 Year Yield still believe a move lower before higher
|
|
|
|
|
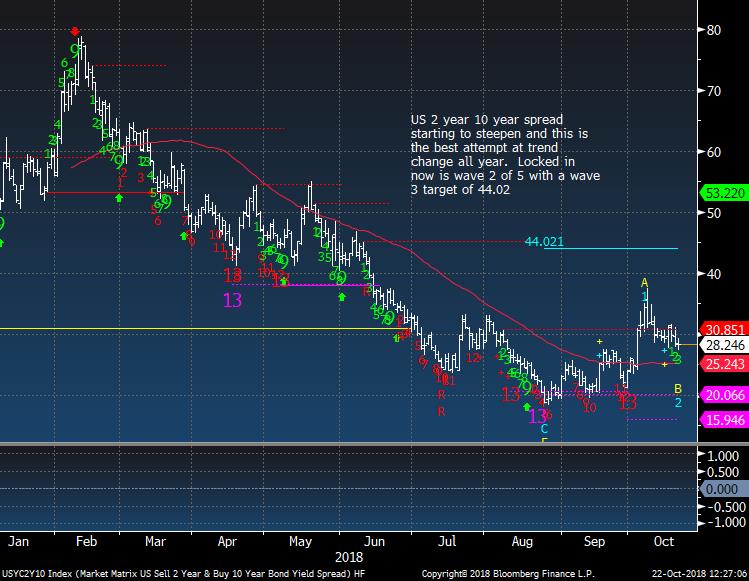
US 2/10 Year Yield Curve has backed off enough in a wave 2
|
|
|
|
|
|
|
|
|
What keeps me motivated.... this girl!
|
|
|
|
|
|
|
DEMARK SCREENS - Daily, Weekly, Monthly Upside/Downside Exhaustion Signals
|
|
|
Daily/Weekly DeMark upside/downside exhaustion signals (Sequential) updated daily, Weekly signals on Monday's and monthly on the first day of the new month. Price flips occur when a stock closes higher/lower than four previous closes and increases conviction of a price turn.
The upside 13's are sell signals and downside 13's are buy signals. Price flip's are confirmation signals that increases potential for a price trend change. For example, if you are long a stock and there is an upside 13, you will want to take cautious action by selling down or out of a position. If initiating a short sale with the upside 13's, we tend to start with a 1/2 size and add with the downside price flip. The opposite is true for when there are downside 13's. Take a 1/2 size position
and add with the upside price flip. The DeMark Indicators are designed to assist the user with buying into weakness and selling into strength to anticipate trend exhaustion. Selling into a rally and buying into a decline often afford the opportunity to exit a trade without too serious a loss if wrong.
S&P 500 Universe:
DAILY UPSIDE 13: AMT, CHD, CA, SBUX
DAILY DOWNSIDE 13: ADI, GWW, JCI, LEG, PHM, TXN, VAR, WY, BLK, CPB, ETFC, MCHP, NDAQ, NTRS, UAA
DAILY UPSIDE WITH PRICE FLIP REVERSAL DOWN: FL, TJX
DAILY DOWNSIDE WITH PRICE FLIP REVERSAL UP: CPB, NDAQ, TAP, WY
Updated: 10/22/18
WEEKLY UPSIDE 13: NONE
WEEKLY DOWNSIDE 13: COTY, IRM, VNO
Updated: 10/1/18
MONTHLY UPSIDE 13: ADSK, ALL, CCI, CME, DE, DLR, DTE, ETN, GLW, HPQ, INTU, PH, TPR, TXT, UPS, XLNX
MONTHLY DOWNSIDE 13: NONE
Euro Stoxx 600 Universe:
DAILY UPSIDE 13: CA FP, HNR1 GR
DAILY DOWNSIDE 13: IGG LN, TEL NO, 1COV GR, ASML NA, HEI GR, OERL SW, SUBC NO
DAILY UPSIDE WITH PRICE FLIP REVERSAL DOWN: DLG GR, MCRO LN
DAILY DOWNSIDE WITH PRICE FLIP REVERSAL UP: BATS LN, COB LN, TEL NO
Updated: 10/22/18
WEEKLY UPSIDE 13: MUV2 GR
WEEKLY DOWNSIDE 13: BAS GR, FHZN SW, FRA GR, IMB LN, JMT PL, ONTEX BB, OSR GR
Updated: 10/1/18
MONTHLY UPSIDE 13: BNZL LN, EXPN LN, FPE3 GR, SBMO NA, SECUB SS, SWEDA SS
MONTHLY DOWNSIDE 13: BAYN GR, HMB SS, TEF SM
|
|
|
Unsubscribe me from Hedge Fund Telemetry
Hedge Fund Telemetry LLC, P.O. Box 4675, Greenwich, CT 06861, United States
CONFIDENTIALITY NOTE and DISCLAIMER: This message is for the named person's use only. It may contain confidential, proprietary or legally privileged material. No confidentiality or privilege is waived by any accidental or unintentional transmission. If you receive this message in error, please immediately delete it and all copies of it from your system, destroy any hard copies and notify the sender. You must not, directly or indirectly, use, disclose,
distribute, print or copy any part of this message if you are not the intended recipient. Hedge Fund Telemetry LLC. cannot guarantee the confidentiality of the material transmitted; therefore, information of a sensitive or confidential nature should not be transmitted. There is risk in trading markets. Hedge Fund Telemetry LLC reports are based on information gathered from various sources and believed to be reliable, but are not guaranteed as to accuracy and completeness. The information is subject to change without notice and Hedge Fund Telemetry LLC has no obligation to provide any updates or changes. Hedge Fund Telemetry LLC is providing this data for informational and educational purposes and does not believe that it is sufficient to base an investment decision on. This information should not be regarded as a solicitation or recommendation of any particular security or to engage in any trading strategy. One should always check with your licensed financial
advisor to determine suitability of any investments.
|
|
|
|
|
|
|