|
|
|
|
|
|
Three Quick Thoughts On Yesterday's Bounce
|
|
|
I'm headed into NYC this afternoon so I have to keep things brief and as a reminder I will be traveling Friday so there won't be a Daily Note published.
Regarding yesterday's bounce - Three quick thoughts
First, it was strong. Period. Breadth was great and the Russell 3000 had a 13:1 ratio up move which is the strongest in several years. This tells me people are hungry for gains. This wasn't a short covering bounce it was money being put to work. Poking holes
in this is that volume was just OK suggesting that most traders and investors sat on hands with longs. Getting granular yesterday ended with 46.5% of all stocks in the top 10% of today’s range, 72.8% in the top 20%.
93.3% are in the top half. This is VERY strong. Today's action has only 0.5% of stocks are in the top 10% of today’s range, 1.9% are in the top 20%. 11.7% are in the top half. 88.3% of stocks are in the bottom half of today’s range. 70.7% are in the bottom 20%.
56.8% are in the bottom 10%. Without follow through, the buy the dip people are going to be active sellers if the recent lows are taken out.
Second, the rest of the world didn't get the memo that it was back to "risk on" as Europe and Asia were mixed to down and the early gains were sold off hard. My big concern has been when I look at US markets starting to get under pressure VTI (US total market) down 6% while the VTUS is down 16% from the January high and without support, my view is globally things could unwind fast. The US has been the outlier of strength and you have to wonder how many global managers are overweight long the US that would have to reduce exposures across the board if the safety of the US markets turns to
risk.
Third, from a macro point of view a few notable things: bonds didn't move down as you would expect for a 3% equity move, they actually closed up on the day. The USD has been in a tight range with sentiment near 50% but today there is a potential development that could move the USD higher again. It's early on and some follow through tomorrow is needed to confirm. The global implications with a new leg higher with the USD will certainly be felt.
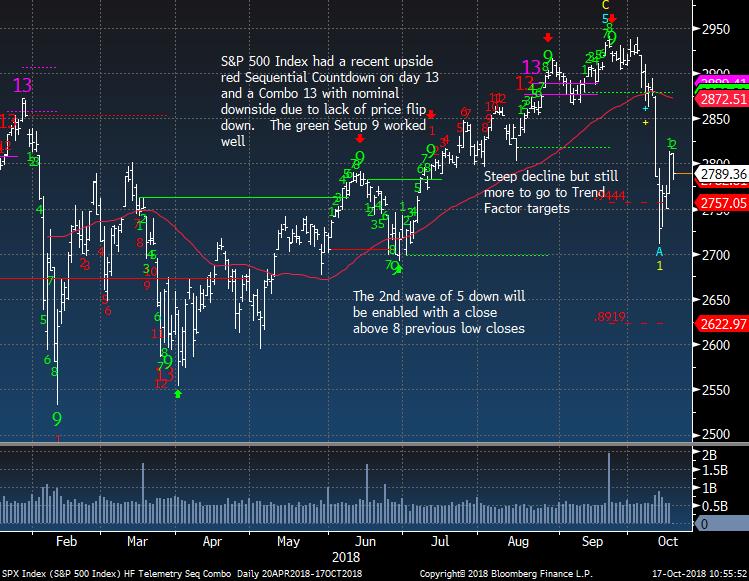
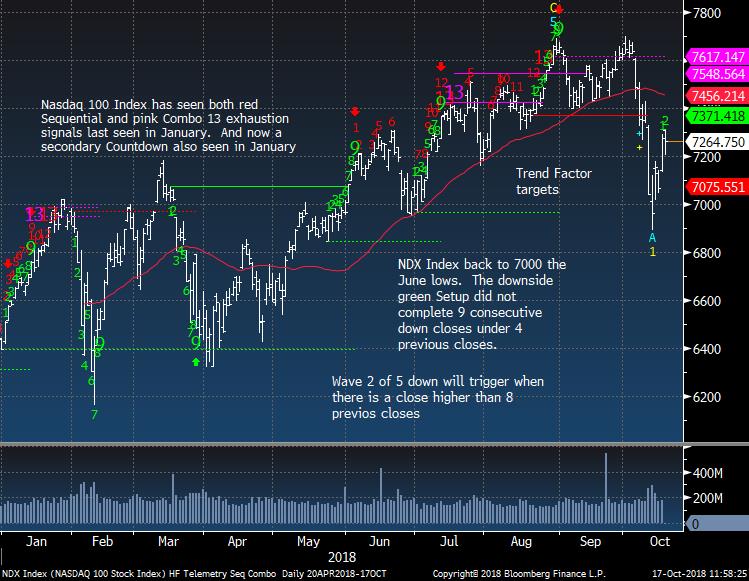
- US Markets - Sentiment bounced off extremes. Wave 2 of 5 down waves on daily is expected soon
- Hedge Fund Telemetry Trade Ideas - Pressed NFLX and AMZN late yesterday - Giving a little time to see if it will workout
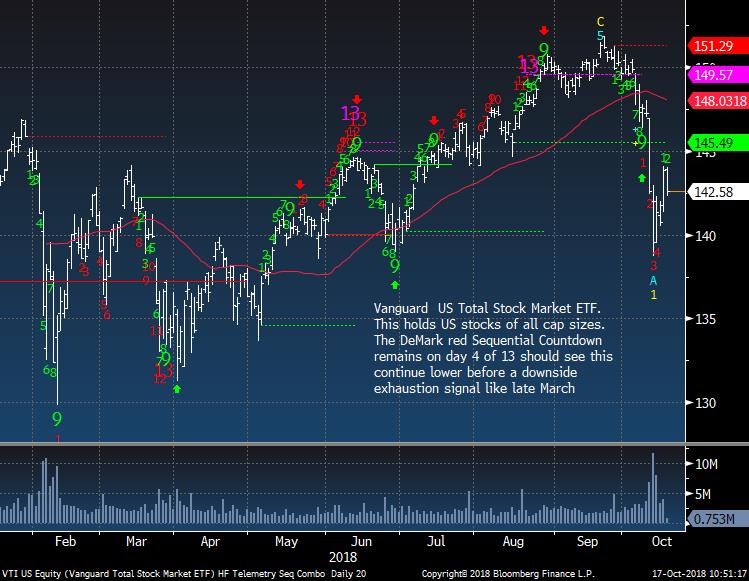
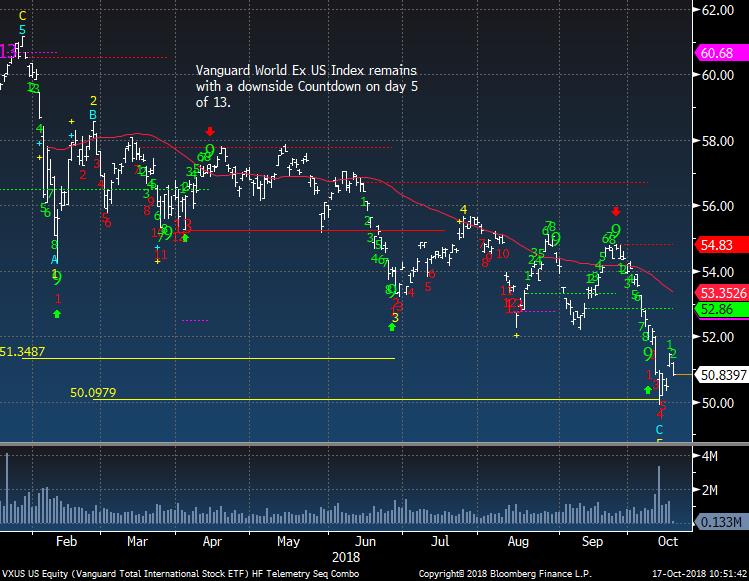
- US Total Market and World Market Ex US - Update still very concerning
- PPO Monitor - Percentage Price Oscillator Force Ranked Sector Rotation
- Bloomberg Technical Pattern Recognition Screen
- Currency Update - POTENTIAL FOR A USD RISE AHEAD - TOMORROW'S ACTION WILL BE IMPORTANT
- European Market Update - Big reversals down today after being up
- Crude Update - Brent and WTI at important support levels
- Gold Update - Sideways again and I might exit if USD lifts tomorrow
- Bond Update - No changes to bias
- DeMark Screens - Daily, Weekly, Monthly upside/downside exhaustion signals within the S&P 500 and Euro Stoxx 600 Seeing more downside buy's especially in Europe but lack of follow through is needed
|
|
|
|
|
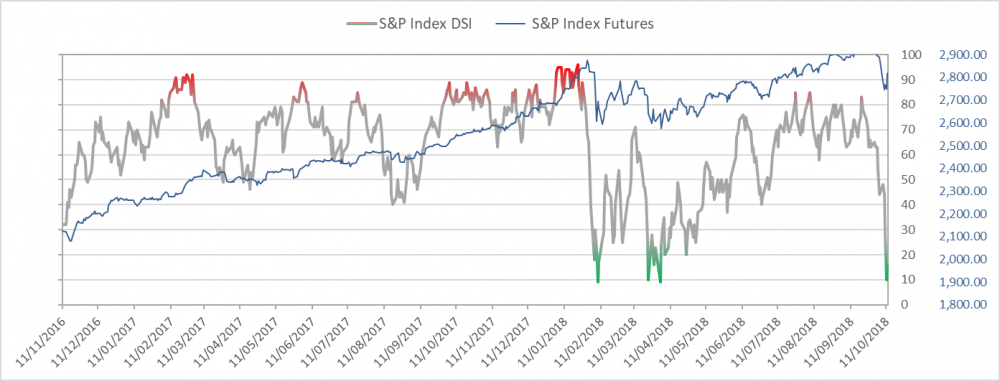
Here's a link to the Hedge Fund Telemetry market sentiment page with 40 charts of sentiment including equities, bonds, currencies, and commodities updated each day. When the new website launches we will be adding new charts and historical sentiment data for Euro Stoxx 50, UK FTSE 100, German DAX, French Cac 40. We will be adding Japanese Bonds, German Bunds, and a few more.
SPX bullish sentiment is at 26% up from recent low of 10%
|
|
|
|
|
SPX daily - note the comment on the wave 2 setting
|
|
|
|
|
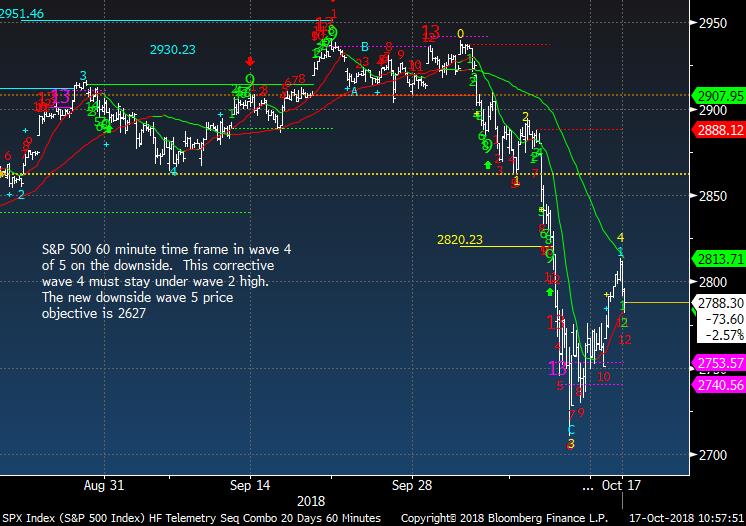
SPX 60 minute tactical time frame wave 4 of 5 down
|
|
|
|
|
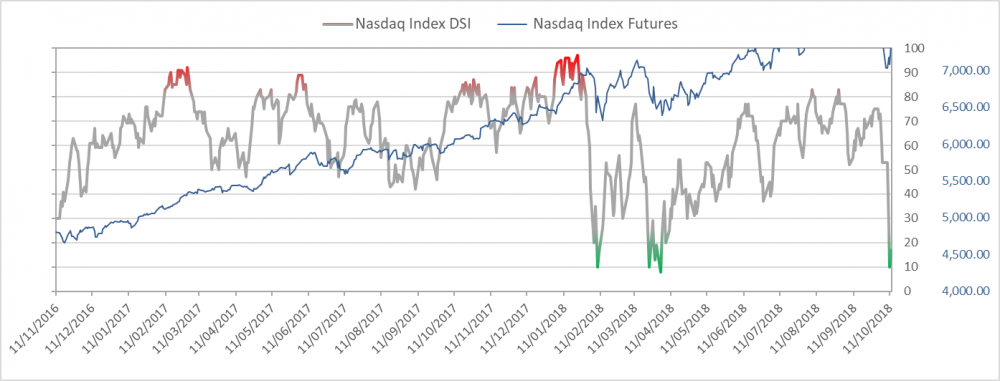
Nasdaq bullish sentiment is at 28%
|
|
|
|
|
|
|
|
|
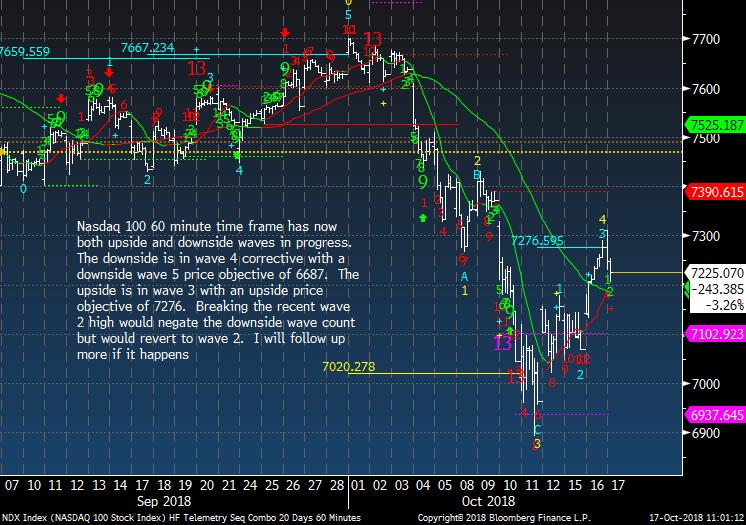
NDX 60 minute tactical time frame wave 4 of 5
|
|
|
|
|
|
|
|
|
|
|
Hedge Fund Telemetry Trade Ideas
|
|
|
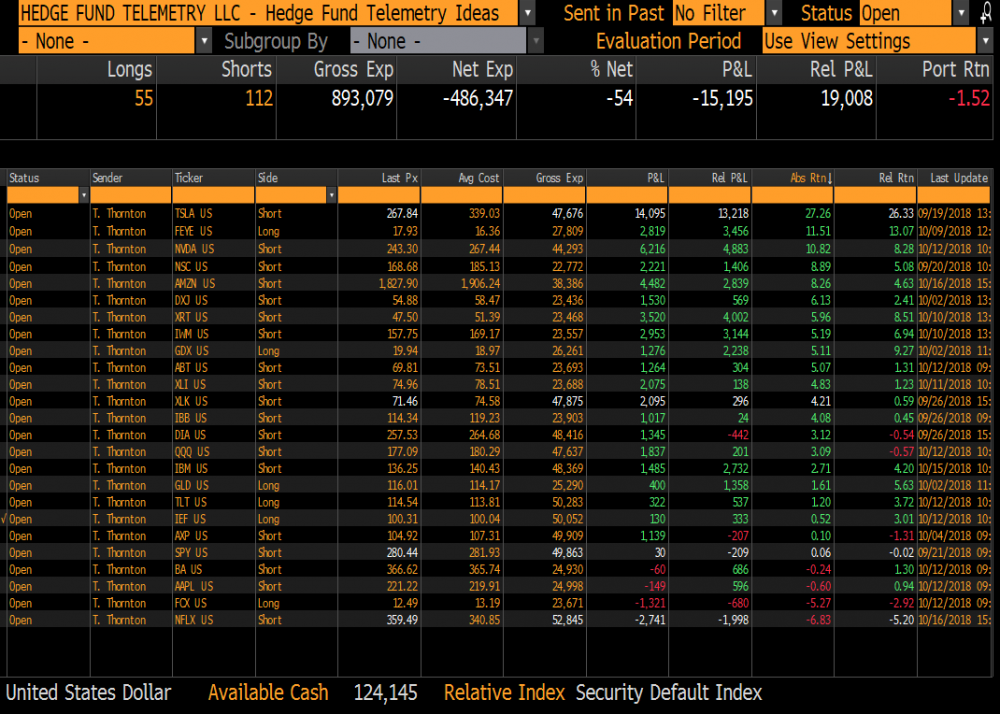
Trade Ideas Sheet - Long and short US equity ideas including ETF's. We will be overhauling the Trade Ideas Sheets for long only, short only, ETF's when the new website rolls out soon. There will also be a clearer email distribution with changes.
Trade Ideas Changes: ADDED YESTERDAY LATE (VIA TWITTER) 2.5% MORE NETFLIX AND AMAZON. NFLX WAS UP AFTER HOURS STRONG BUT IT FELL BELOW VWAP AND THUS I GUESSED A FADE WAS AHEAD. I WAS RIGHT. AMZN IS JUST TRYING TO ADD EXPOSURE SHORT IN FANG. REMOVED BRK/B +2% TODAY
Stops on everything. TSLA 285, GDX 17.35 , FEYE 16.00, NVDA 255, QQQ 179, XLK 75,
SPY 285, XLY 113, AXP 109, XRT 50, IWM 163, XLV 94, DIA 260, XLI 77 IBB 116, ABT 75, AMZN 1860 DXJ 56 , GLD 111, IEF 98 TLT 112 , AAPL 225, BA 370, IBM 140, NFLX 390 (ADJUSTED STOPS)
|
|
|
|
|
|
|
|
|
Vanguard US Total Market giving back some gains
|
|
|
|
|
Vanguard World Ex US lack of follow through to the upside
|
|
|
|
|
|
|
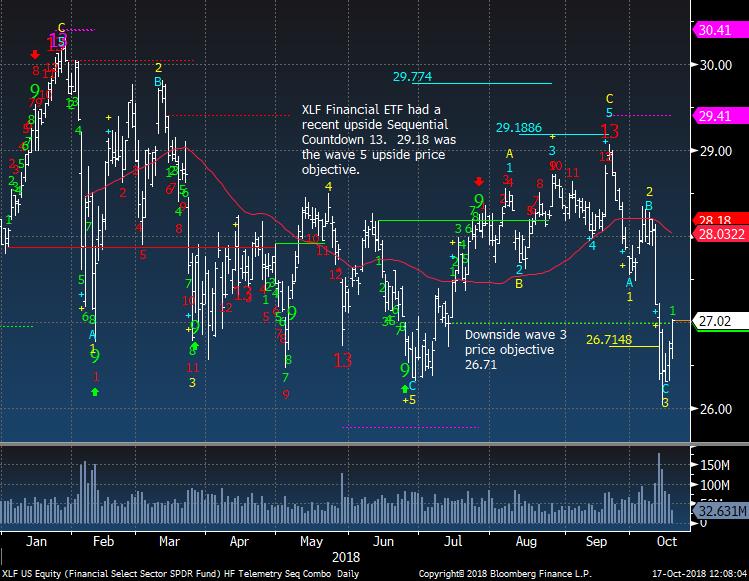
US Sector Focus - Financials
|
|
|
Financials bouncing off support. This could be the start of wave 4 of 5 on the downside. So trade them tight
|
|
|
|
|
|
|
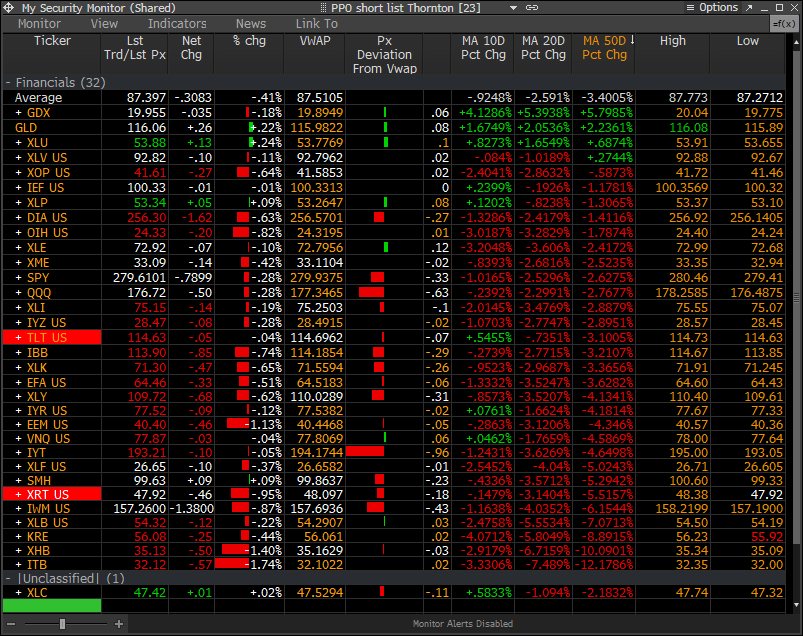
PPO Monitor - Percentage Price Oscillator
|
|
|
The PPO Monitor is a proprietary monitor developed to force rank Indexes, Sectors, and Stocks. It ranks top down by strongest to weakest by percentage above/below the 50 day moving average. Shorter term signals can be seen when the 10 and 20 day moving averages turn up (green) or down (red) which often are followed by the 50 day moving average. This is useful to watch for historically overbought/oversold percentage above/below the 50 day moving average. It is
non correlated with the DeMark Indicators however we have found upside/downside exhaustion signals often occur when something rises to the top or drifts to the bottom of the monitor - increasing the timing aspect. We share this monitor with clients with Bloomberg Terminals. An added feature is that each market/ETF can be expanded with each component force ranked in the same way. A couple other features include price deviation from intraday VWAP (useful for intraday reversals) and new 20 day highs/lows on right side. Please inquire if you would like to be permissioned to use the PPO Monitor.
Today's highlights: A lot more red across the board today. Financials turning around helped market. Currently 61/6 breadth within S&P Financials Index.
|
|
|
|
|
|
|
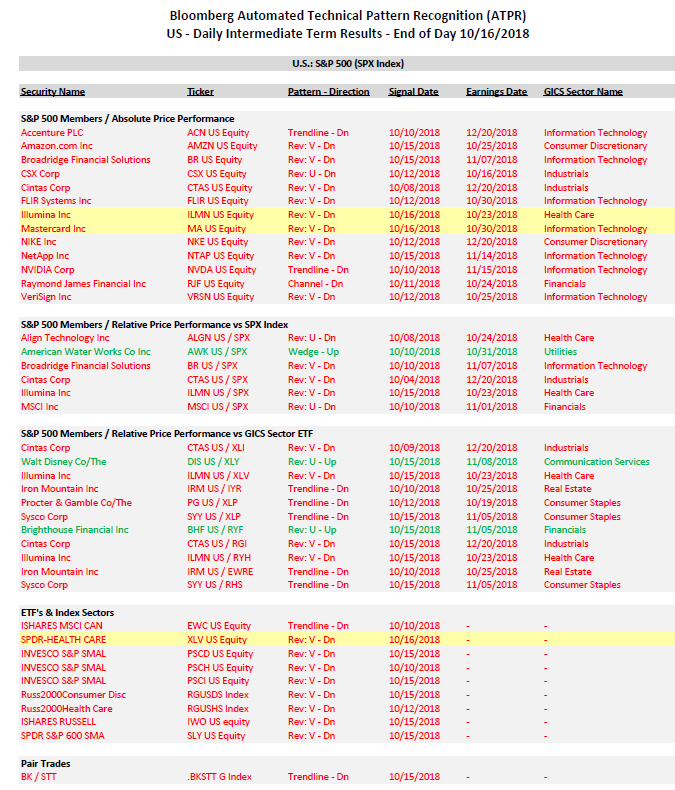
Bloomberg Automated Technical Pattern Recognition Screens
|
|
|
S&P 500 Members/Absolute Price Performance and Relative Price Performance vs S&P 500 and Sector ETF's. ETF's vs Index Sectors. Pair Trades. Long side is first symbol, short side is second symbol. If you would like a PDF from Bloomberg with full details of how this is formulated, please email. We will be doing a webinar in the coming weeks specifically on this system.
|
|
|
|
|
|
|
|
|
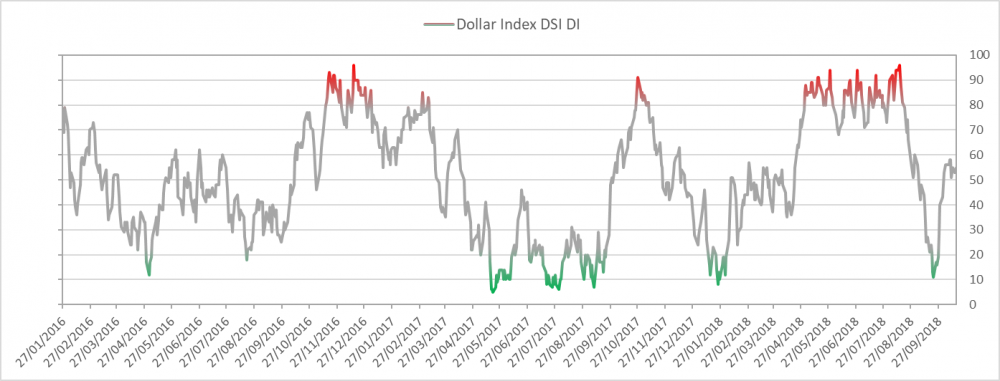
US Dollar bullish sentiment is at 55% and could make a run higher
|
|
|
|
|
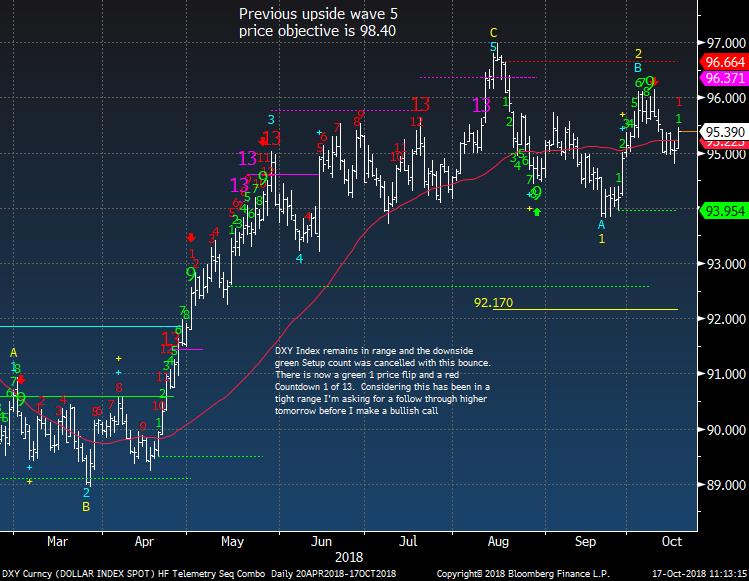
US Dollar Index has been in a tight range. The price flip up and new red Countdown could be the start of a higher move. Tomorrow will be very important.
|
|
|
|
|
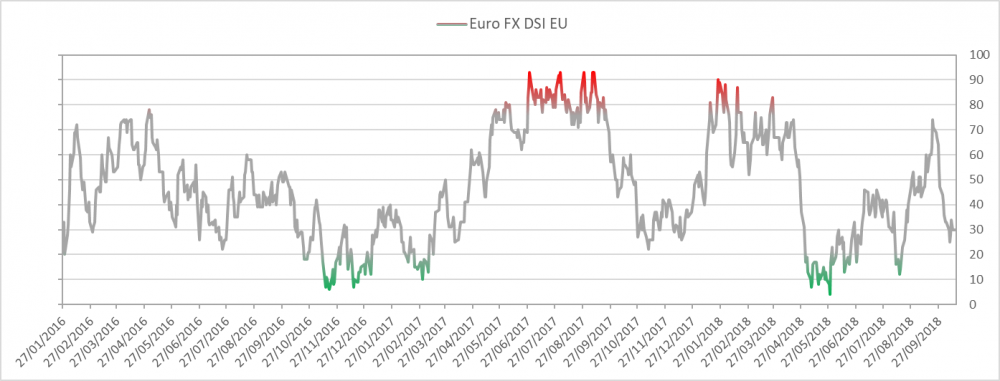
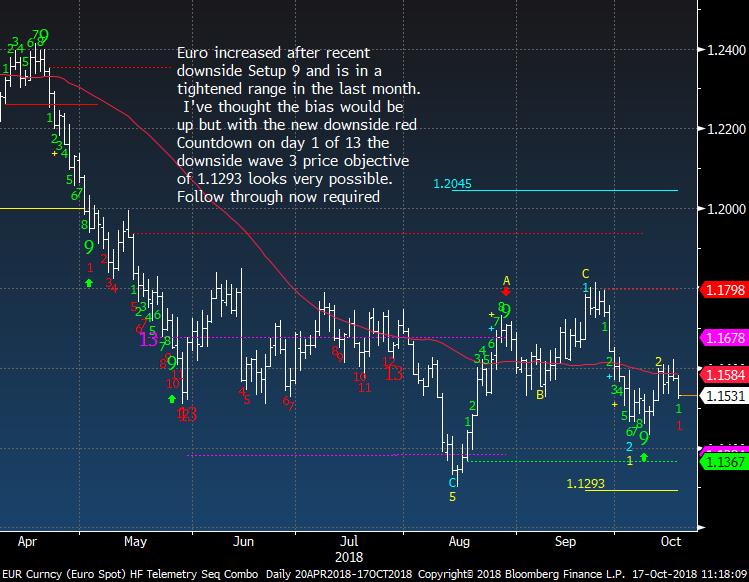
Euro bullish sentiment is at 30%
|
|
|
|
|
Euro Spot has a different wave count but same risk with the red Countdown
|
|
|
|
|
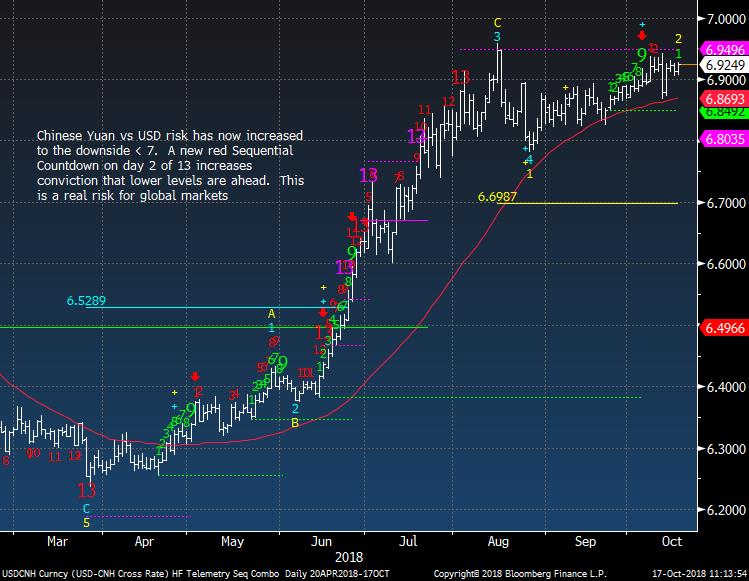
Yuan should work lower through 7 very soon. This is a big global risk
|
|
|
|
|
|
|
|
|
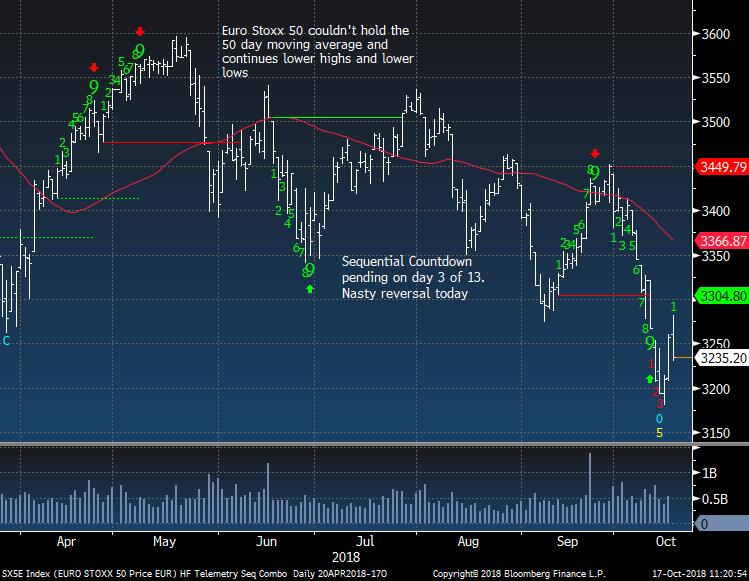
Euro Stoxx 50 quite the reversal today off the highs
|
|
|
|
|
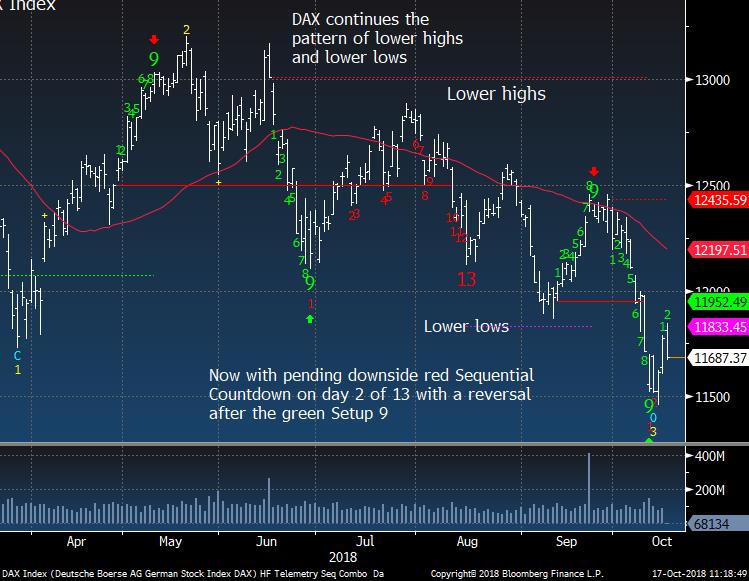
German DAX bounced after the green Setup but still has the downside red Countdown in progress
|
|
|
|
|
|
|
|
|
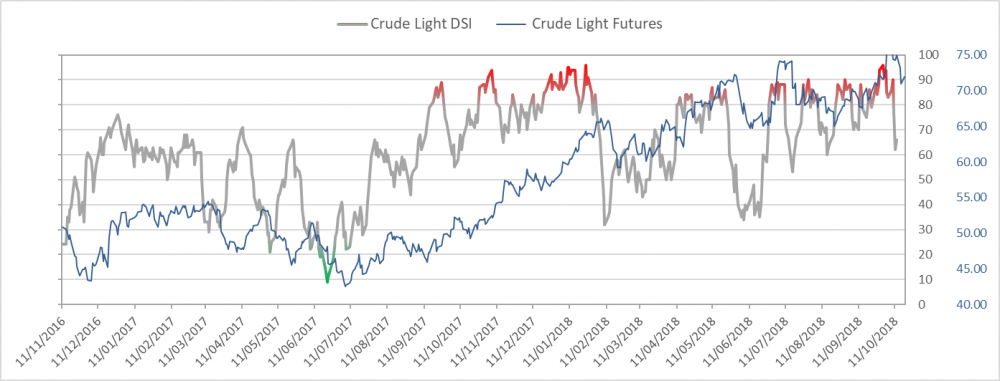
Crude bullish sentiment is at
|
|
|
|
|
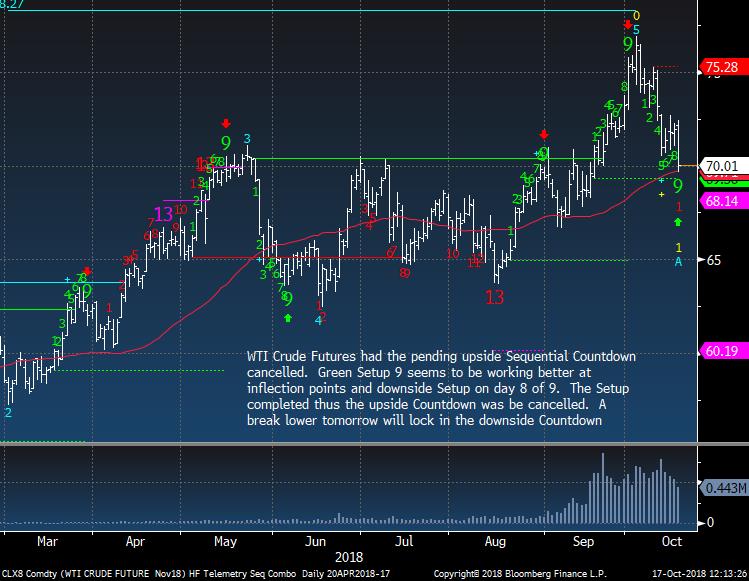
WTI Crude Futures has seen inflection with green Setup 9's and bulls need this to bounce for a couple days here
|
|
|
|
|
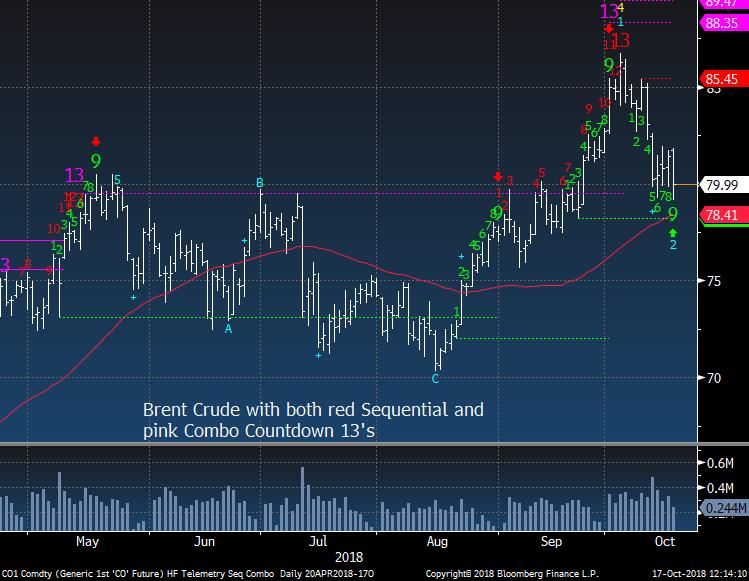
Brent Crude similar but I had a much more defined upside sell signal a few weeks ago
|
|
|
|
|
|
|
|
|
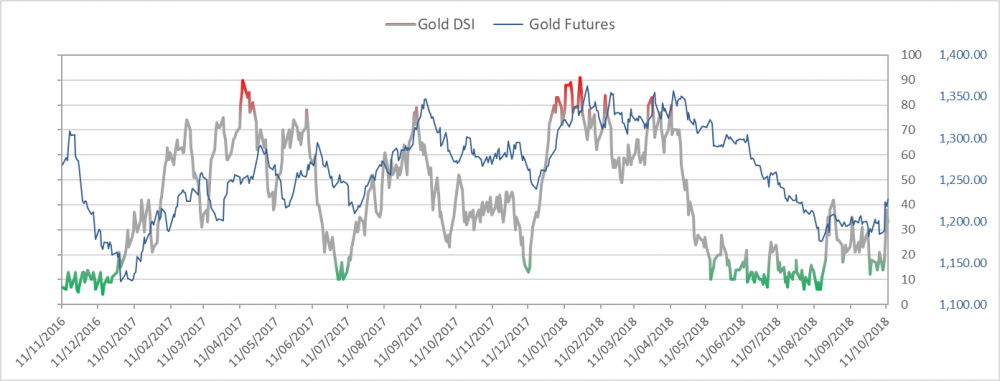
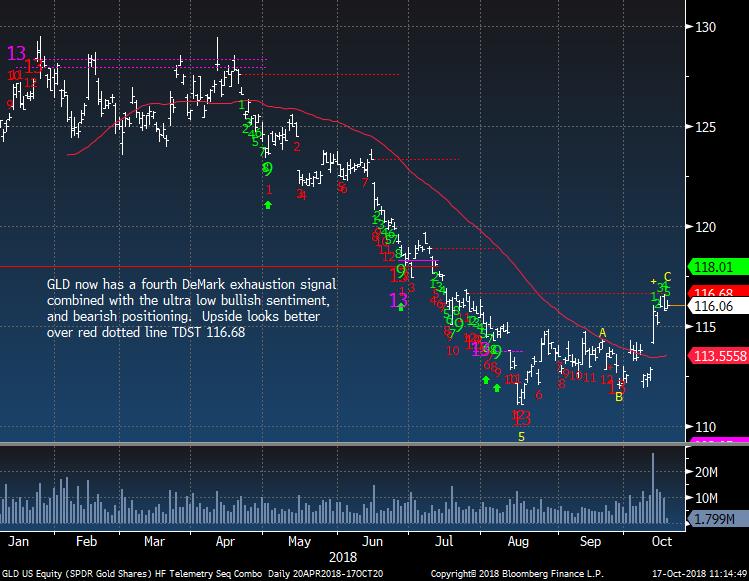
Gold bullish sentiment is at 32%
|
|
|
|
|
Gold stalling. If the USD is up tomorrow I might take the profit in Gold and revisit
|
|
|
|
|
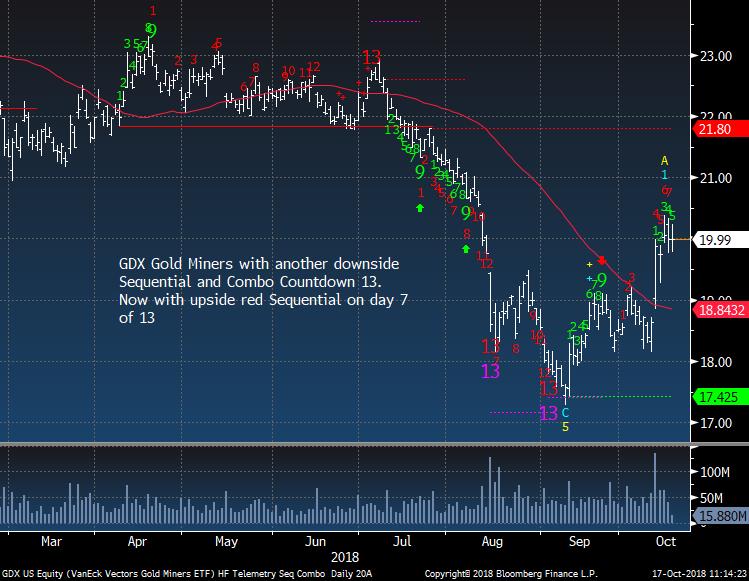
Gold Miners GDX ETF stalling.
|
|
|
|
|
|
|
|
|
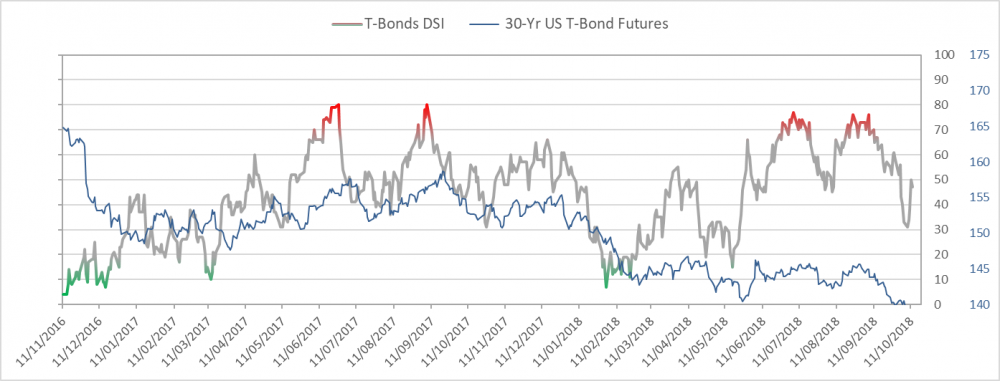
Bond bullish sentiment is at 44%
|
|
|
|
|
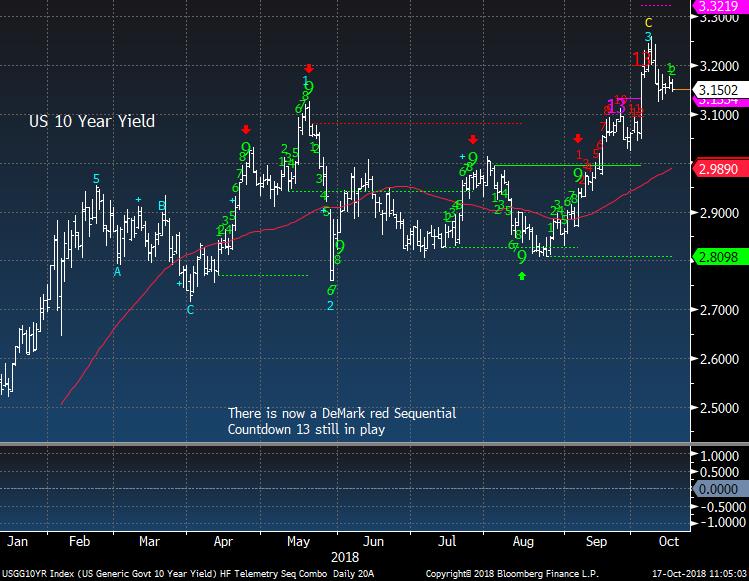
US 10 Year Yield will get people talking under 3.10%. If yields start to drop it will be a 'risk off' event
|
|
|
|
|
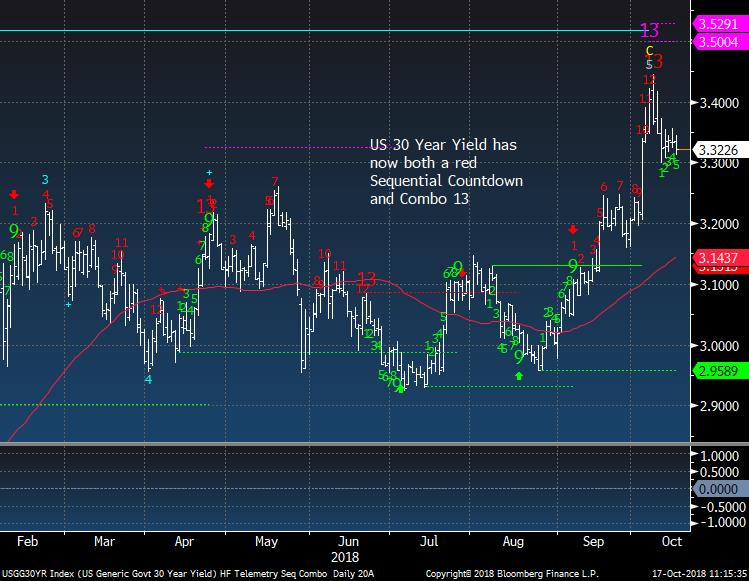
US 30 Year Yield same story
|
|
|
|
|
|
|
DEMARK SCREENS - Daily, Weekly, Monthly Upside/Downside Exhaustion Signals
|
|
|
Daily/Weekly DeMark upside/downside exhaustion signals (Sequential) updated daily, Weekly signals on Monday's and monthly on the first day of the new month. Price flips occur when a stock closes higher/lower than four previous closes and increases conviction of a price turn.
The upside 13's are sell signals and downside 13's are buy signals. Price flip's are confirmation signals that increases potential for a price trend change. For example, if you are long a stock and there is an upside 13, you will want to take cautious action by selling down or out of a position. If initiating a short sale with the upside 13's, we tend to start with a 1/2 size and add with the downside price flip. The opposite is true for when there are downside 13's. Take a 1/2 size position
and add with the upside price flip. The DeMark Indicators are designed to assist the user with buying into weakness and selling into strength to anticipate trend exhaustion. Selling into a rally and buying into a decline often afford the opportunity to exit a trade without too serious a loss if wrong.
S&P 500 Universe:
DAILY UPSIDE 13: DG, TJX
DAILY DOWNSIDE 13: NONE
DAILY UPSIDE WITH PRICE FLIP REVERSAL DOWN: NONE
DAILY DOWNSIDE WITH PRICE FLIP REVERSAL UP: CDNS, EA,
FB, GS, LKQ, PX, QRVO, SWKS, TPR WFC
Updated: 10/15/18
WEEKLY UPSIDE 13: NONE
WEEKLY DOWNSIDE 13: IVZ, SYMC, WHR
Updated: 10/1/18
MONTHLY UPSIDE 13: ADSK, ALL, CCI, CME, DE, DLR, DTE, ETN, GLW, HPQ, INTU, PH, TPR, TXT, UPS, XLNX
MONTHLY DOWNSIDE 13: NONE
Euro Stoxx 600 Universe:
DAILY UPSIDE 13: NONE
DAILY DOWNSIDE 13: AZM IM, BATS LN, INCH LN, ITRK LN, TEMN SW
DAILY UPSIDE WITH PRICE FLIP REVERSAL DOWN: NONE
DAILY DOWNSIDE WITH PRICE FLIP REVERSAL UP: AMS SW, DB1 GR, DUE GR, ELM LN, EMSN SW, EOAN GR, FRA GR, GSK LN, HEIA NA, HEIO NA, HEN3 GR, HUH1V FH, INCH LN, INF LN, ITRK LN, ITX SM, LOGN SW, POM FP, QIA GR, RMV LN, STM IM, TEMN SW, TUI LN, UTDI GR
Updated: 10/15/18
WEEKLY UPSIDE 13: MUV2 GR
WEEKLY DOWNSIDE 13: BAS GR, FHZN SW, FRA GR, IMB LN, JMT PL, ONTEX BB, OSR GR
Updated: 10/1/18
MONTHLY UPSIDE 13: BNZL LN, EXPN LN, FPE3 GR, SBMO NA, SECUB SS, SWEDA SS
MONTHLY DOWNSIDE 13: BAYN GR, HMB SS, TEF SM
|
|
|
Unsubscribe me from Hedge Fund Telemetry
Hedge Fund Telemetry LLC, P.O. Box 4675, Greenwich, CT 06861, United States
CONFIDENTIALITY NOTE and DISCLAIMER: This message is for the named person's use only. It may contain confidential, proprietary or legally privileged material. No confidentiality or privilege is waived by any accidental or unintentional transmission. If you receive this message in error, please immediately delete it and all copies of it from your system, destroy any hard copies and notify the sender. You must not, directly or indirectly, use, disclose,
distribute, print or copy any part of this message if you are not the intended recipient. Hedge Fund Telemetry LLC. cannot guarantee the confidentiality of the material transmitted; therefore, information of a sensitive or confidential nature should not be transmitted. There is risk in trading markets. Hedge Fund Telemetry LLC reports are based on information gathered from various sources and believed to be reliable, but are not guaranteed as to accuracy and completeness. The information is subject to change without notice and Hedge Fund Telemetry LLC has no obligation to provide any updates or changes. Hedge Fund Telemetry LLC is providing this data for informational and educational purposes and does not believe that it is sufficient to base an investment decision on. This information should not be regarded as a solicitation or recommendation of any particular security or to engage in any trading strategy. One should always check with your licensed financial
advisor to determine suitability of any investments.
|
|
|
|
|
|
|