|
|
|
|
|
|
|
|
No, not Mortgage Back Securities risk, I'm talking about Mohammed bin Salman, the Saudi Crown Prince who came to power in 2017. Known as "MbS." He's only 33 and has made some successful liberal reforms notably with women's rights. These include allowing women to drive, ability to go to sports venues, and a few workplace reforms. Essentially these rights are now about 100 years late with the modern world but it's a step. He's taken an active interest in economic affairs and will
likely be the one who will decide when Saudi Aramco goes public if ever. He even broke with Islamic leaders and voiced support for a Jewish homeland. The darker side is he rules in a brutal way to stamp out dissent even within the royal family members and with the richest and most powerful business leaders under the guise of purging corruption. The recent disappearance (and suspected murder) of Washington Post journalist Jamal Khashoggi has turned the spotlight on MbS.
Here's the market risk from my view: Trump and MbS have had a friendly beneficial relationship but Trump's hand was forced to made it clear there will be a severe response if Khashoggi was found to be murdered by Saudi/MbS direction. Saudi Arabia responded sharply by saying crude could "go to
$200" if the US imposes sanctions and Saudi chooses to retaliate in any one of several measures (less oil production, allowing Russia to have a military base, weapons purchases from Russia, etc. I don't see crude going to $200 anytime soon. This is not 1973 as OPEC was united against US and Europe with support for Israel. The US was caught flat footed as there was very low domestic energy production but today production is strong. I see the risk not in higher crude but with instability in the region if MbS loses control of power. The markets do not want to see an "Arab Spring" in Saudi Arabia. The markets will want this to go away like other negative catalysts have in recent years. We'll see if it does fade from headlines in the coming days but let's just add this to the pile of potential negative catalysts.
Risk remains after Friday's bounce especially with Q3 earnings starting to pick up in volume. So far, the big banks were not
bought after reporting generally inline quarters. They didn't give big guidance and I expect the theme of weak guidance to be the biggest risk for the equity markets.
Please note, there will not be a Hedge Fund Telemetry Daily Note on Friday as I am traveling to Austin for the US Formula 1 race. For those in Austin, let me know if you want to get breakfast on Saturday.
- US Markets - Sentiment still very low. Setup's on day 8 of 9 with SPX and NDX but Russell has downside red Countdown
- Hedge Fund Telemetry Trade
Ideas - ROST, ORCL, IBM, AMZN, LULU
- Saudi Arabia Market and collateral damage - Softbank
- Vanguard Total US Market and World Market ex US - Update
- Netflix and IBM ahead of earnings
- Sector Focus - Financials on support
- PPO Monitor - Percentage Price Oscillator Force Ranked Sector Rotation - Defensive still on top
- Bloomberg Technical Pattern Recognition Screen
- Currency Update - Range bound for now
- European Market Update - New lows
- Global Market Update - Sidelines for now
- Asian Market Update - Nikkei still looks lower
- Crude Update - No response with Saudi situation and threats
- Gold Update - Looking good long
- Bond Update - Reversals on yields down after recent upside DeMark exhaustion signals
- DeMark Screens - Daily, Weekly, Monthly upside/downside exhaustion signals within the S&P 500 and Euro Stoxx 600 New weekly signals updated
|
|
|
|
|
Here's a link to the Hedge Fund Telemetry market sentiment page with 40 charts of sentiment including equities, bonds, currencies, and commodities updated each day. When the new website launches we will be adding new charts and historical sentiment data for Euro Stoxx 50, UK FTSE 100, German DAX, French Cac 40. We will be adding Japanese Bonds, German Bunds, and a few more.
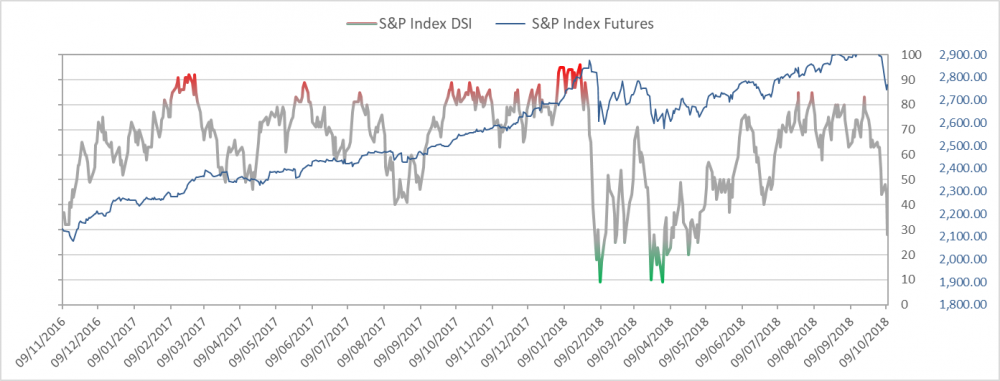
SPX bullish sentiment is at 16%. New Sentiment charts coming this week.
|
|
|
|
|
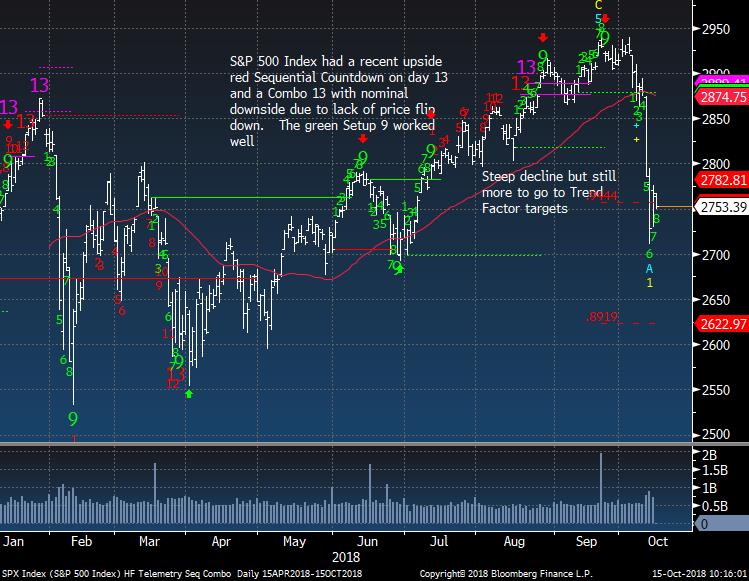
SPX daily on day 8 of 9 Setup. If the 9 doesn't bounce a new red Countdown will start
|
|
|
|
|
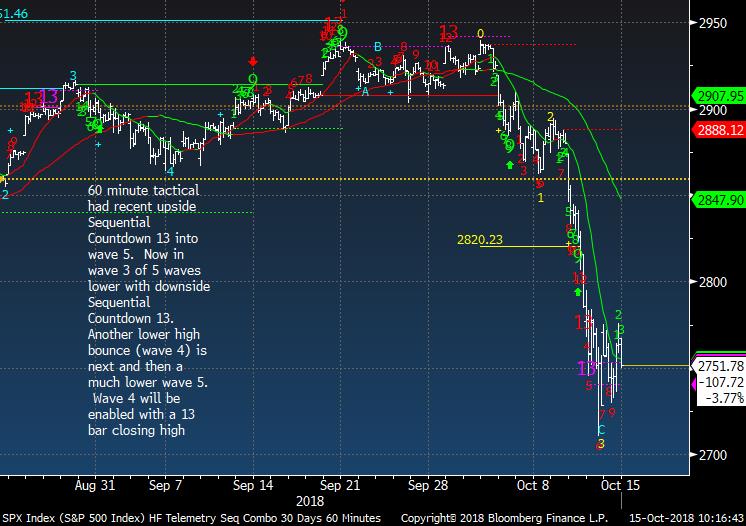
SPX 60 minute tactical time frame still no wave 4 yet
|
|
|
|
|
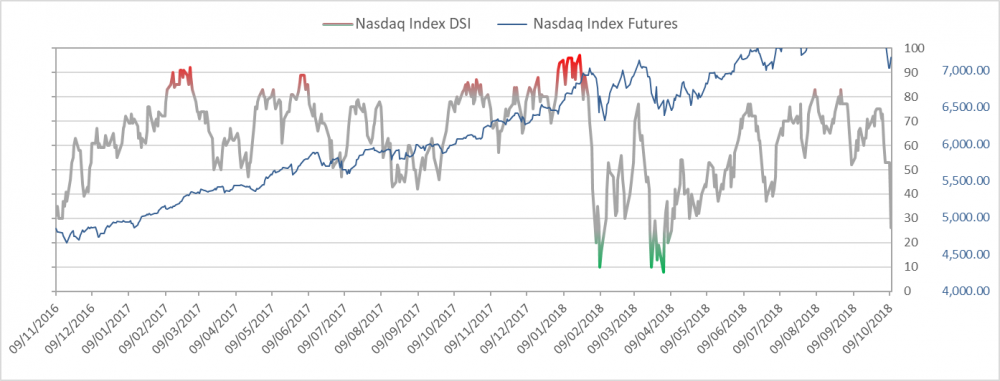
Nasdaq bullish sentiment is at 17%
|
|
|
|
|
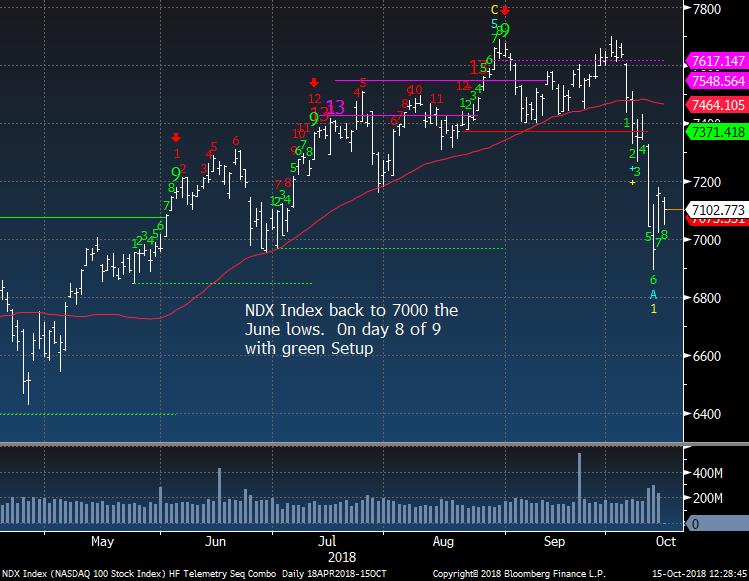
NDX Index daily also on day 8 of 9 with Setup
|
|
|
|
|
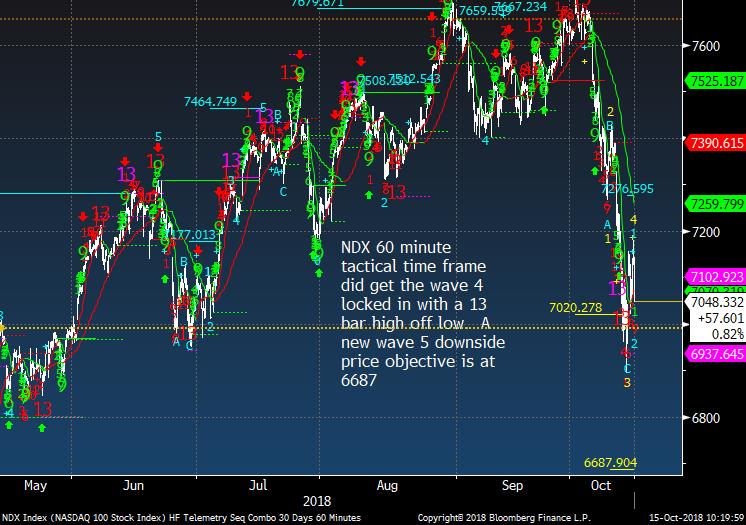
NDX 60 minute tactical time frame crunched up to show the downside wave 5 price objective
|
|
|
|
|
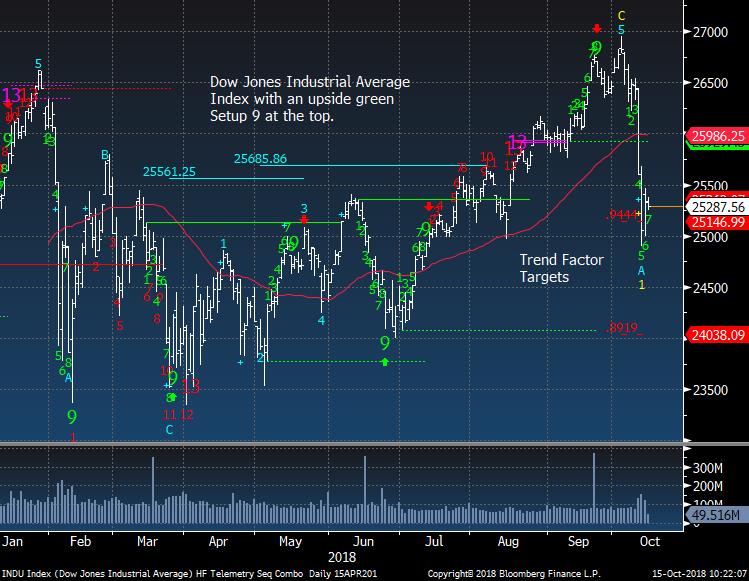
Dow Jones Industrial Average at first Trend Factor target
|
|
|
|
|
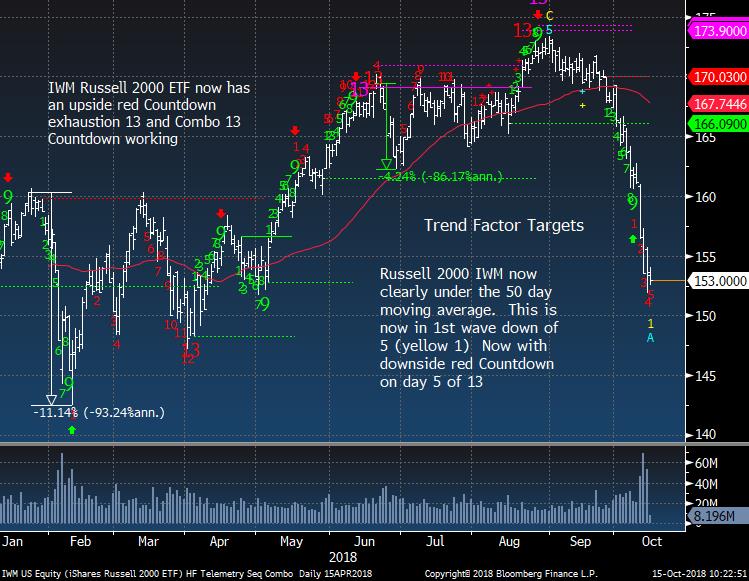
IWM Russell 2000 looks the worst of all of the indexes as there is a downside red Sequential Countdown
|
|
|
|
|
|
|
Hedge Fund Telemetry Trade Ideas
|
|
|
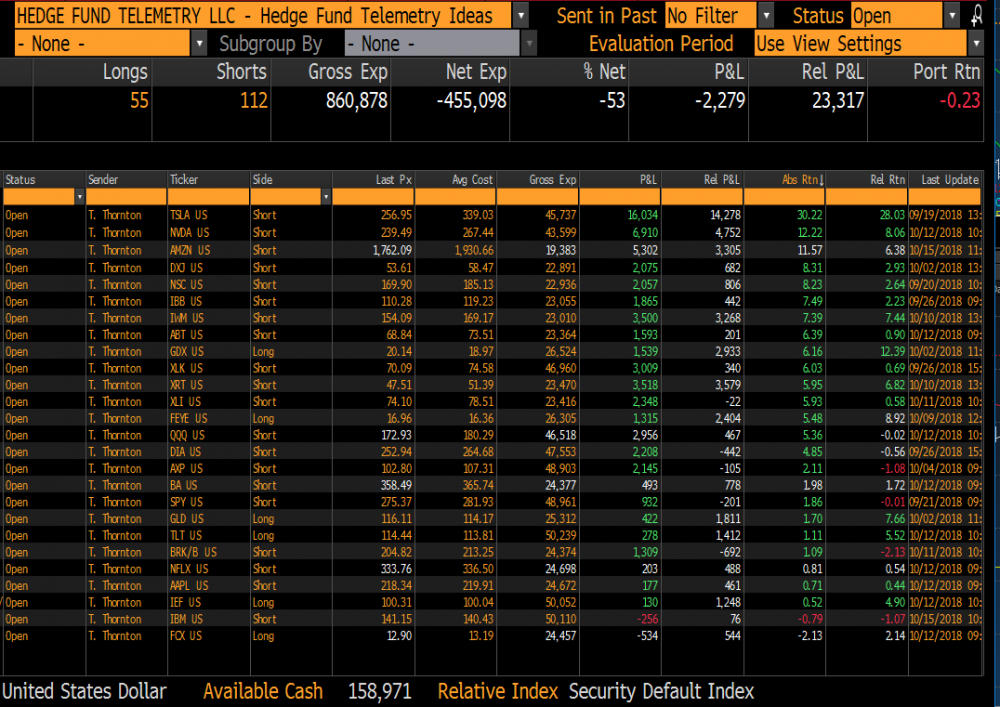
Trade Ideas Sheet - Long and short US equity ideas including ETF's. We will be overhauling the Trade Ideas Sheets for long only, short only, ETF's when the new website rolls out soon. There will also be a clearer email distribution with changes.
Trade Ideas Changes: CLOSED ROST SHORT +.5%, LULU SHORT +10%, ORCL SHORT +6.5%, REDUCED AMZN TO 2.5% FROM 5% SHORT. DOUBLED UP IBM SHORT TO 5% FROM 2.5%
Stops on everything. TSLA 285, GDX 17.35 , FEYE 16.00, NVDA 250, QQQ 178, XLK 75, SPY 285, XLY 113, AXP 109, XRT 50, IWM 163, XLV 94, BRK/B 110, DIA 260, XLI 77 IBB 116, ABT 75, AMZN 1850 DXJ 56 , GLD 111, IEF 98 TLT 112 , AAPL 225, BA 370, IBM 150, NFLX 360
|
|
|
|
|
|
|
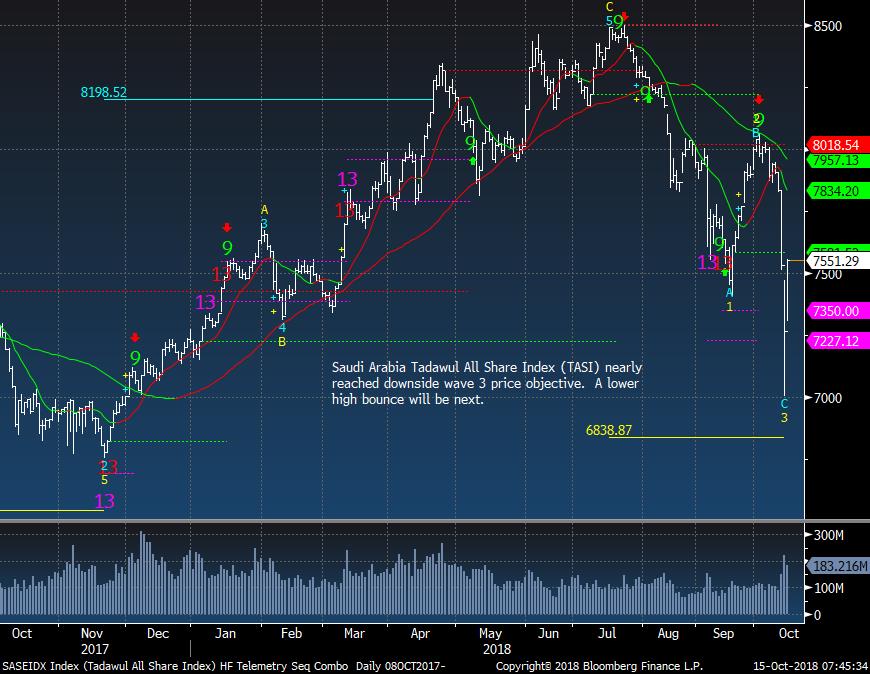
Saudi Arabia Market and collateral damage with Softbank
|
|
|
Saudi Arabia market breaking
|
|
|
|
|
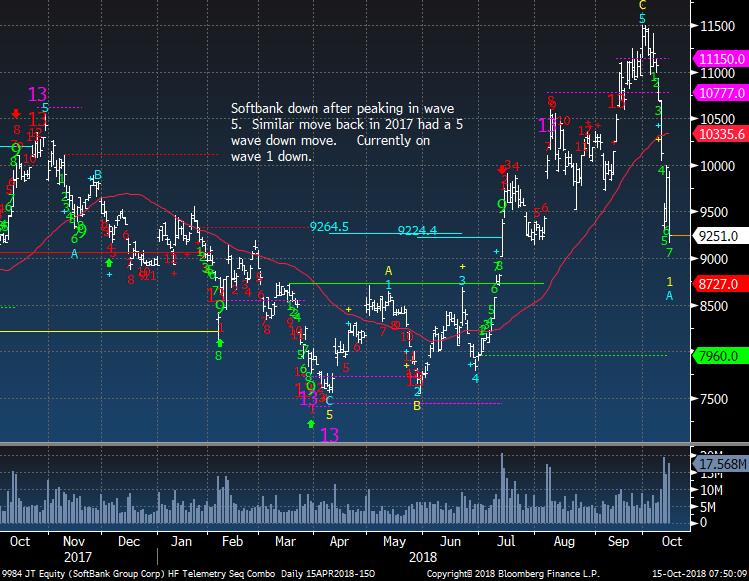
Softbank in Japan has been using Saudi capital to invest.
|
|
|
|
|
|
|
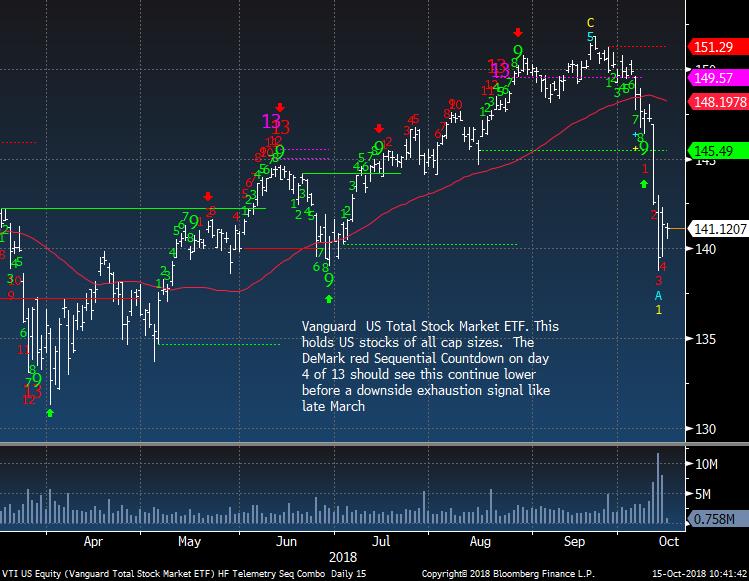
Vanguard Total US and Global Ex US ETF's - Update
|
|
|
US Total Stock Market ETF has severely broken and has downside Countdowns in progress which is really concerning
|
|
|
|
|
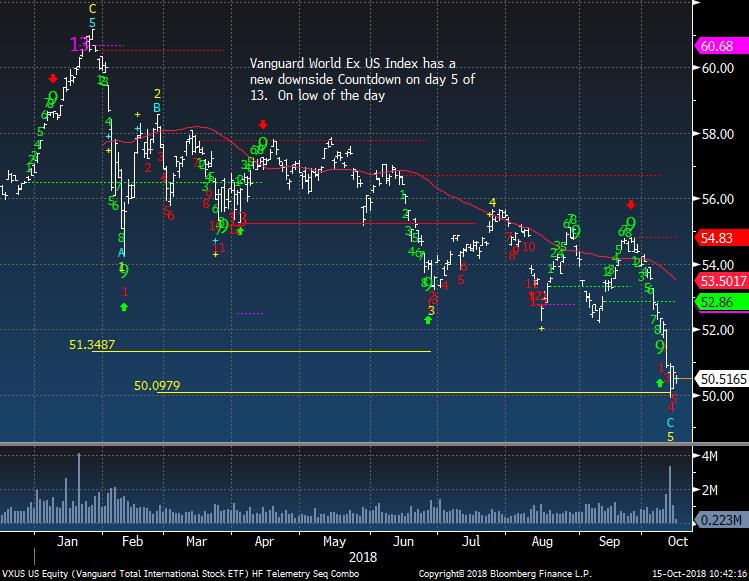
World Ex US also has downside Countdowns in progress and has very little if any support here
|
|
|
|
|
|
|
Netflix ahead of earnings tomorrow
|
|
|
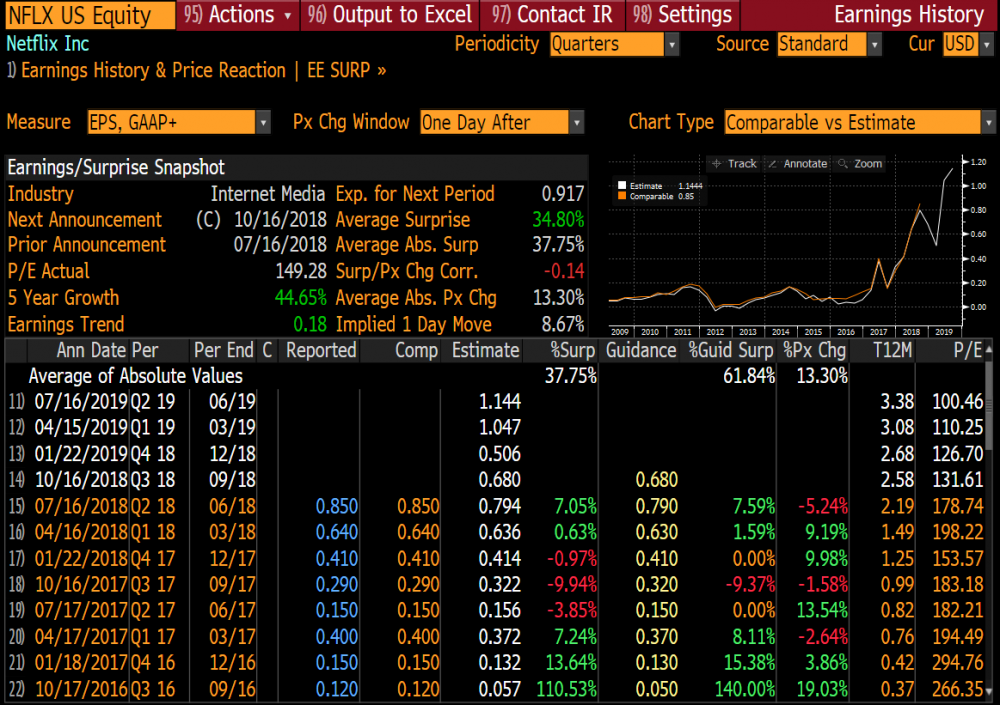
NFLX is a wild stock on earnings. The implied move is 8.67%. It's all about subscriber growth and guidance. Last quarter sub growth surprised and was much weaker. Analysts said it was just a one off quarter and sub growth would come right back so I still think people want to believe this story. The long time CFO also announced his retirement intra quarter so perhaps he's leaving at the top.
|
|
|
|
|
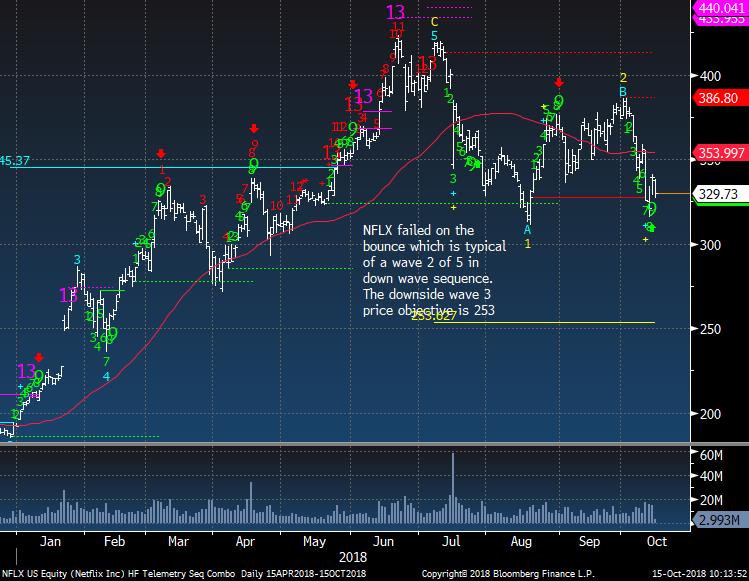
NFLX is right on support going into earnings
|
|
|
|
|
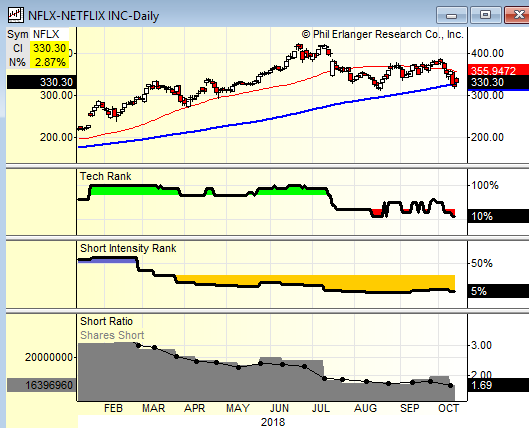
NFLX still has very low short interest according to Erlanger Research. The risk of a squeeze is low
|
|
|
|
|
|
|
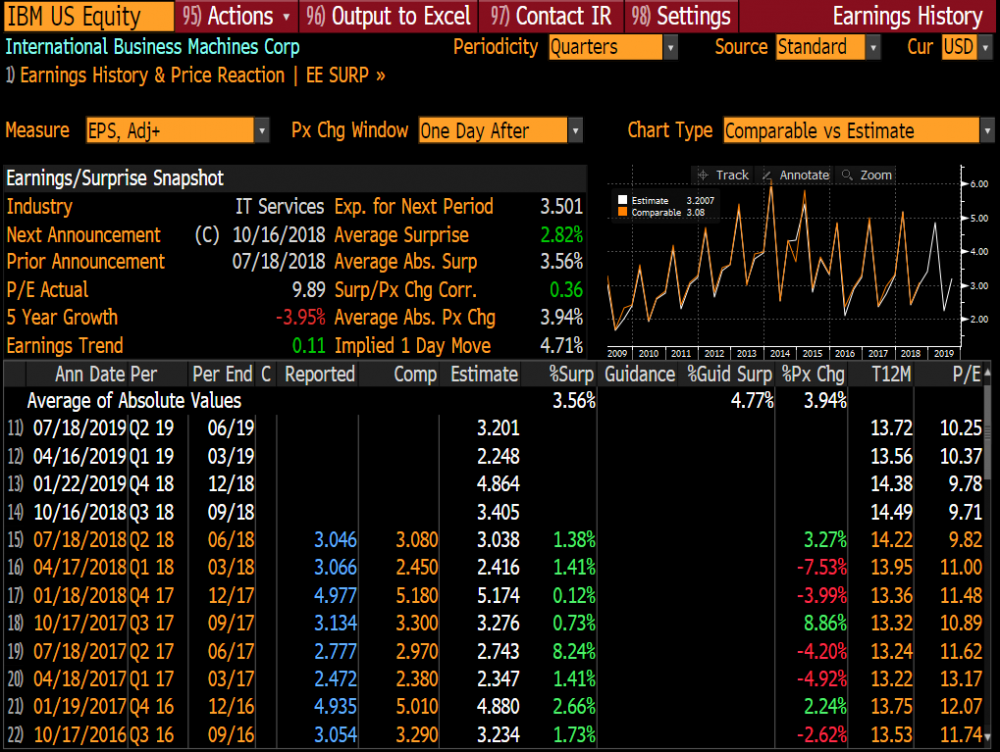
IBM ahead of earnings tomorrow
|
|
|
IBM is a boring stock. It's cheap but has no growth and for a tech stock that's not good. The implied move is 4.71%.
|
|
|
|
|
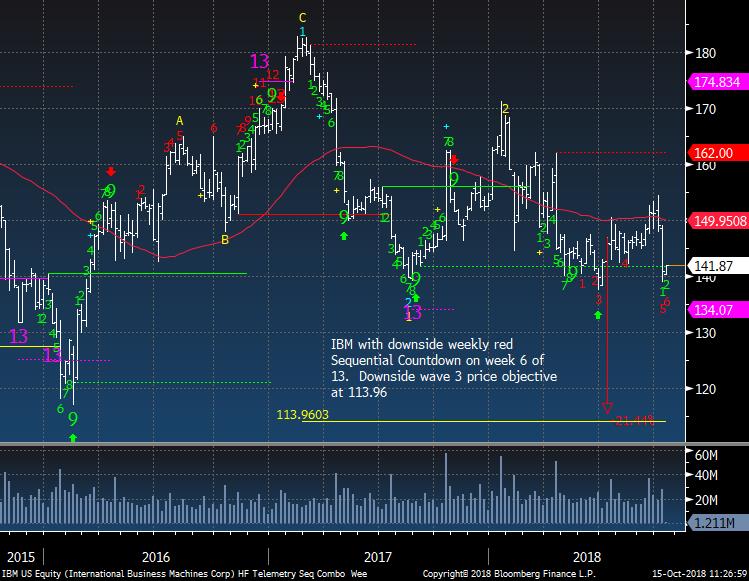
IBM is right at support with this weekly chart. If this breaks, you have to believe many of the long term holders are going to raise the white flag and give up.
|
|
|
|
|
|
|
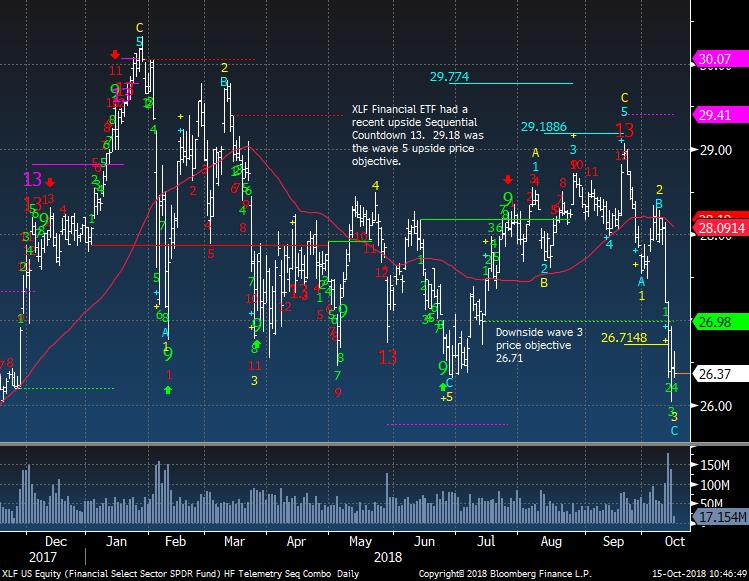
US Sector Focus - Financials
|
|
|
Earnings have been OK but XLF ETF is now right at support. I'd like to short this into a bounce
|
|
|
|
|
|
|
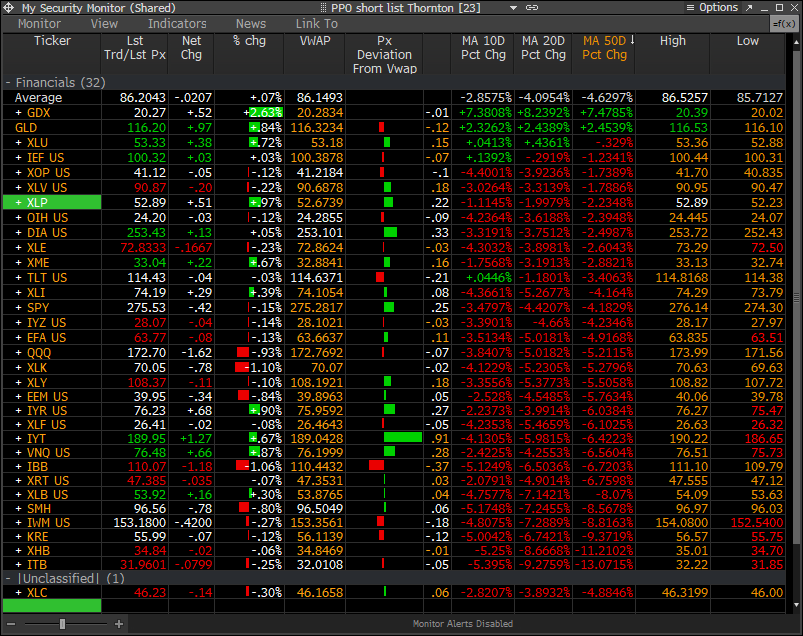
PPO Monitor - Percentage Price Oscillator
|
|
|
The PPO Monitor is a proprietary monitor developed to force rank Indexes, Sectors, and Stocks. It ranks top down by strongest to weakest by percentage above/below the 50 day moving average. Shorter term signals can be seen when the 10 and 20 day moving averages turn up (green) or down (red) which often are followed by the 50 day moving average. This is useful to watch for historically overbought/oversold percentage above/below the 50 day moving average. It is
non correlated with the DeMark Indicators however we have found upside/downside exhaustion signals often occur when something rises to the top or drifts to the bottom of the monitor - increasing the timing aspect. We share this monitor with clients with Bloomberg Terminals. An added feature is that each market/ETF can be expanded with each component force ranked in the same way. A couple other features include price deviation from intraday VWAP (useful for intraday reversals) and new 20 day highs/lows on right side. Please inquire if you would like to be permissioned to use the PPO Monitor.
Today's highlights: Still see risk off ETF's at the top.
|
|
|
|
|
|
|
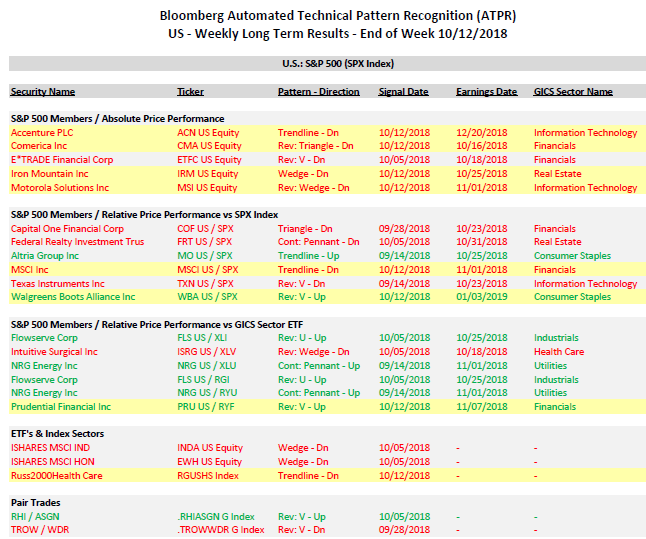
Bloomberg Automated Technical Pattern Recognition Screens
|
|
|
S&P 500 Members/Absolute Price Performance and Relative Price Performance vs S&P 500 and Sector ETF's. ETF's vs Index Sectors. Pair Trades. Long side is first symbol, short side is second symbol. If you would like a PDF from Bloomberg with full details of how this is formulated, please email. We will be doing a webinar in the coming weeks specifically on this system.
|
|
|
|
|
|
|
|
|
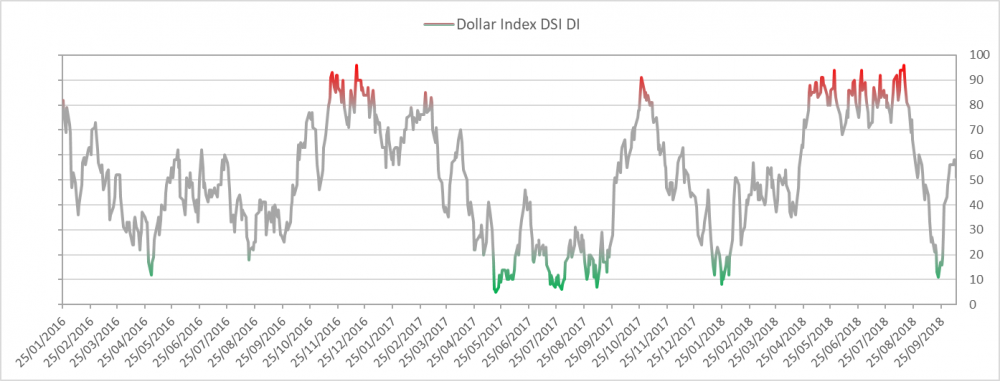
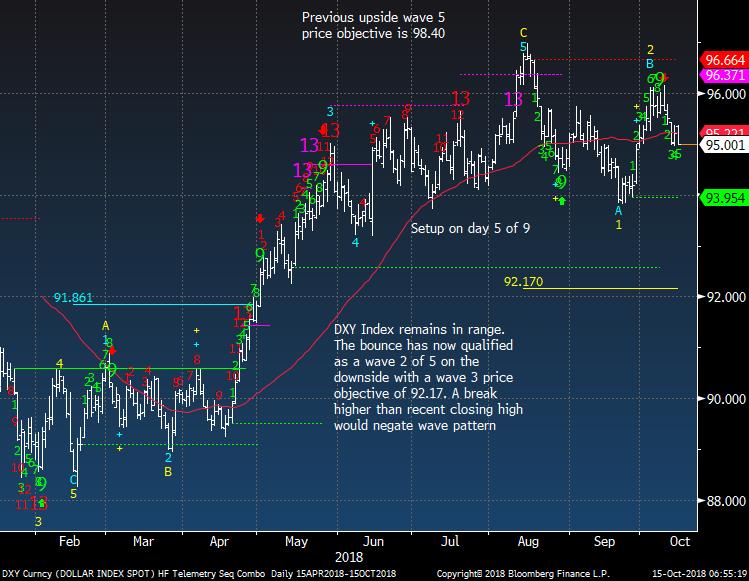
US Dollar bullish sentiment is at 55%
|
|
|
|
|
US Dollar Index still range bound
|
|
|
|
|
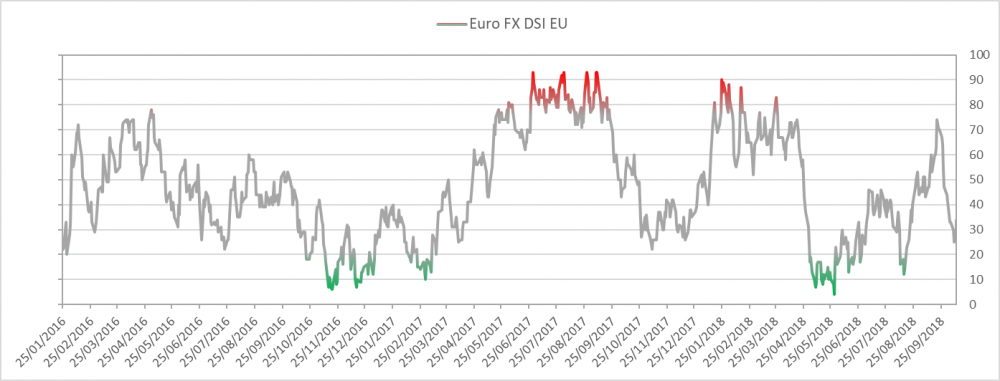
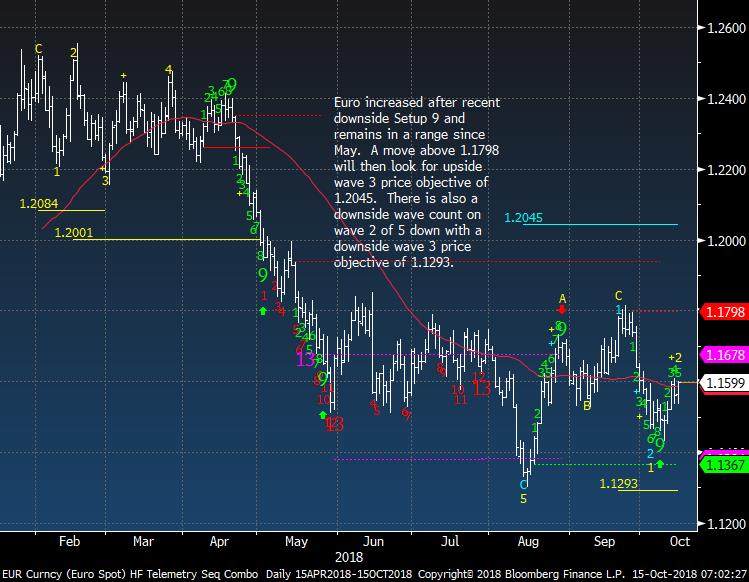
Euro bullish sentiment is at 30%
|
|
|
|
|
|
|
|
|
|
|
|
|
|
|
|
|
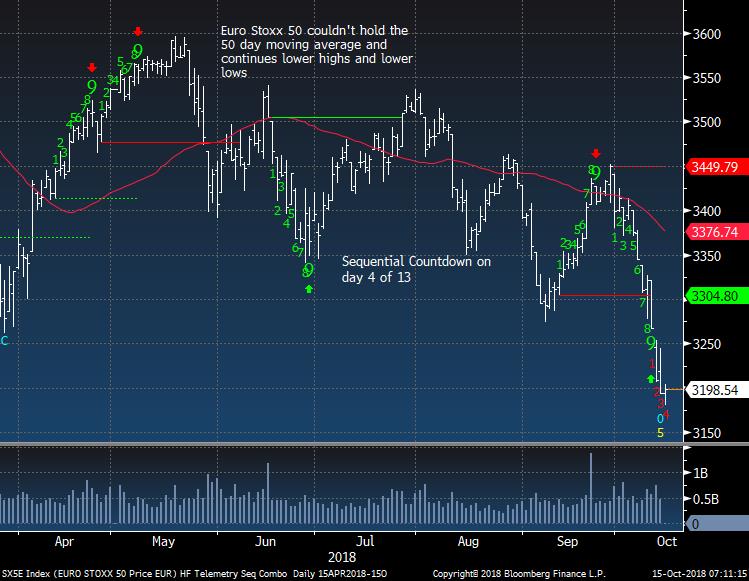
Euro Stoxx 50 more new lows
|
|
|
|
|
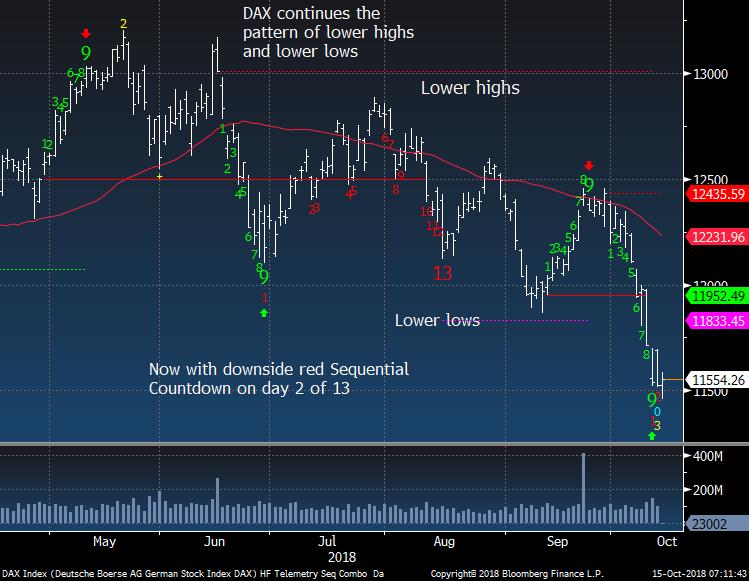
German DAX similar difficult place
|
|
|
|
|
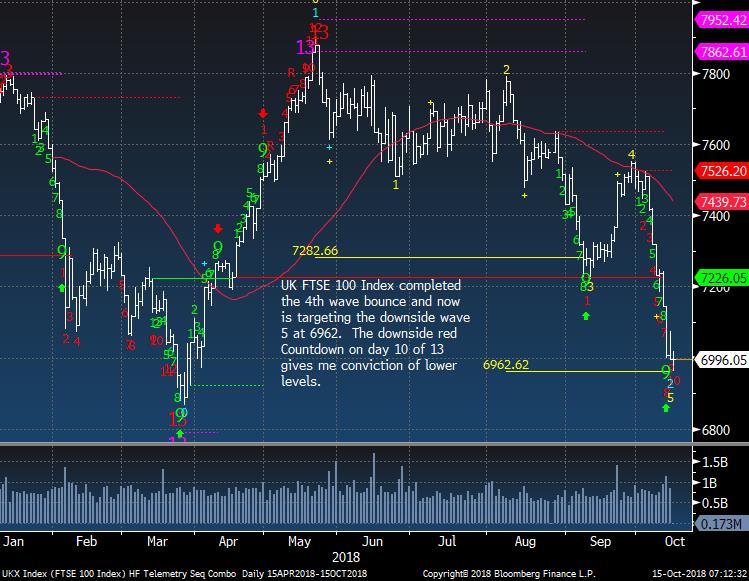
UK FTSE 100 nearing 5th downside wave price objective
|
|
|
|
|
|
|
|
|
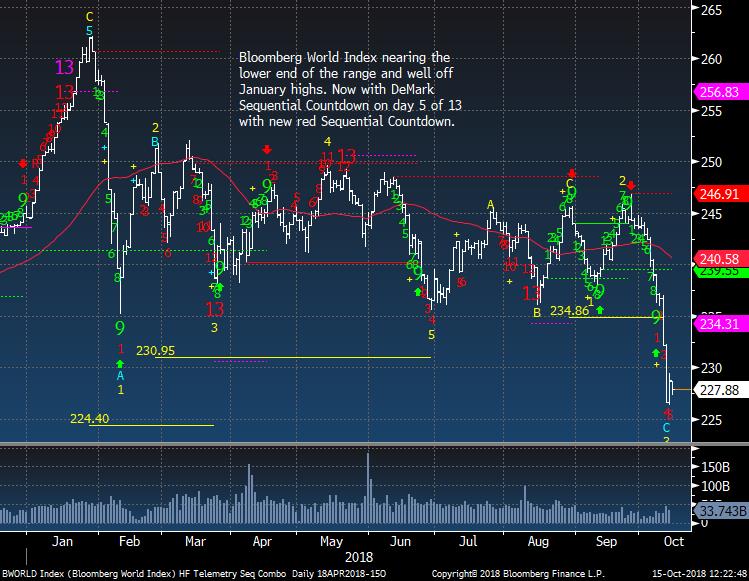
Bloomberg World Index shows a lot of over head resistance on global stocks in the past 10 months of choppy down markets
|
|
|
|
|
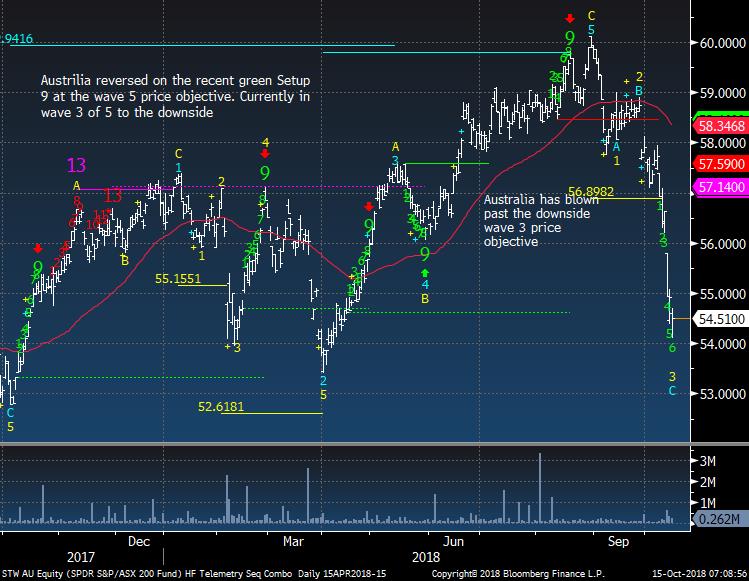
Australia severe quick breakdown
|
|
|
|
|
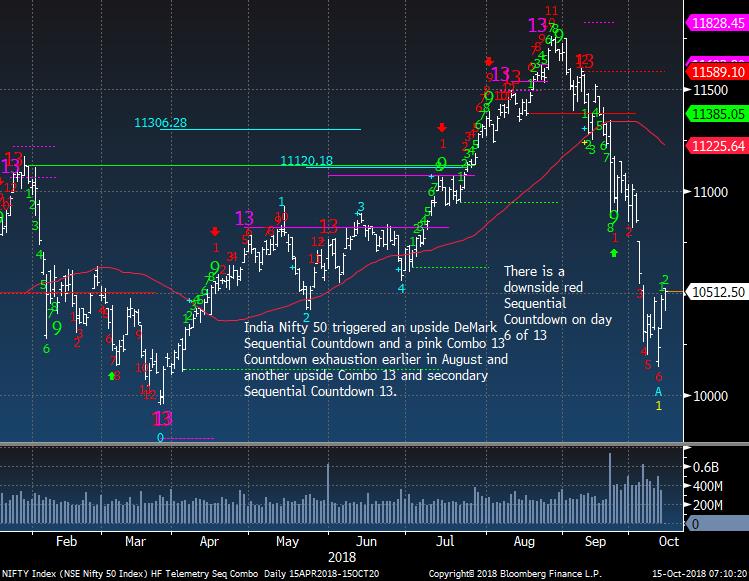
India should make a lower high wave 2 bounce soon
|
|
|
|
|
|
|
|
|
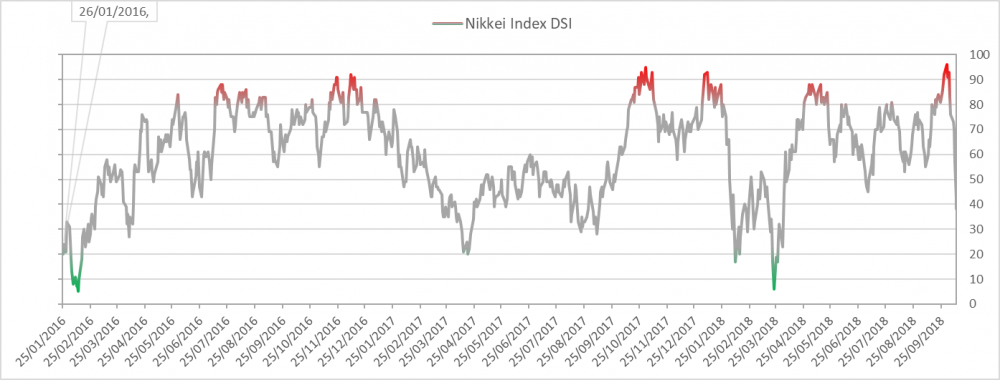
Nikkei bullish sentiment is at 42% down from a recent bell ringer 96% peak
|
|
|
|
|
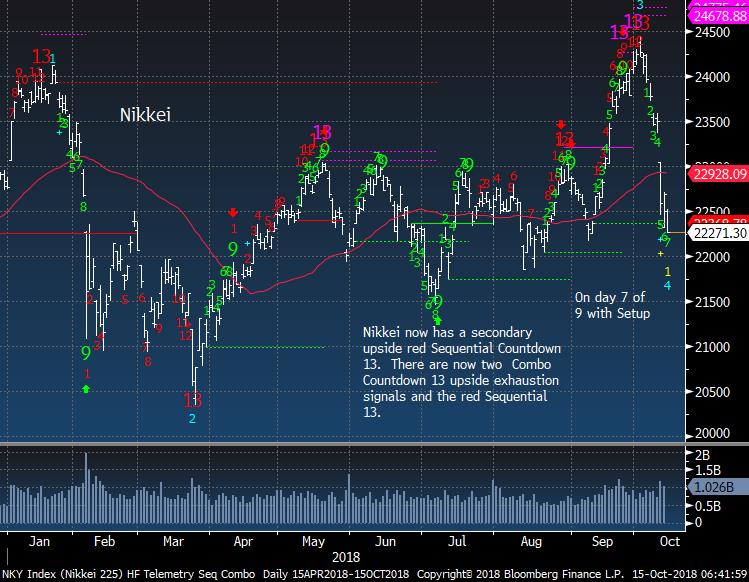
Nikkei excellent work by the DeMark Indicators
|
|
|
|
|
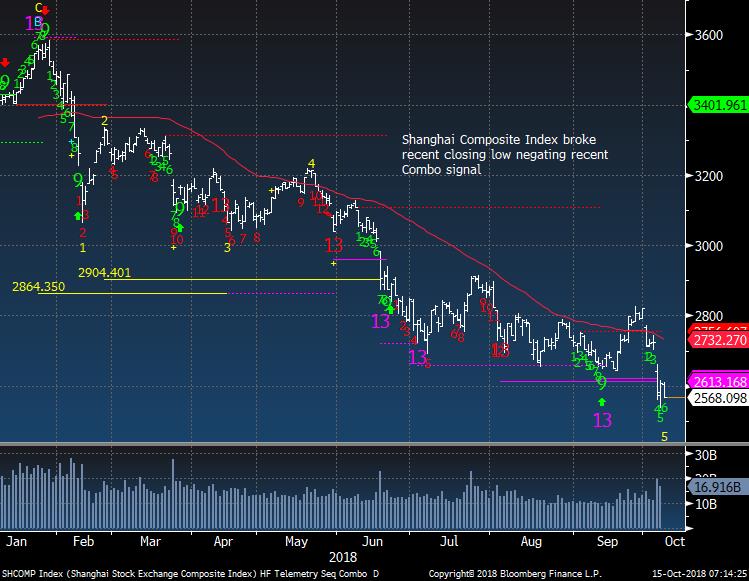
Shanghai can't break the downtrend
|
|
|
|
|
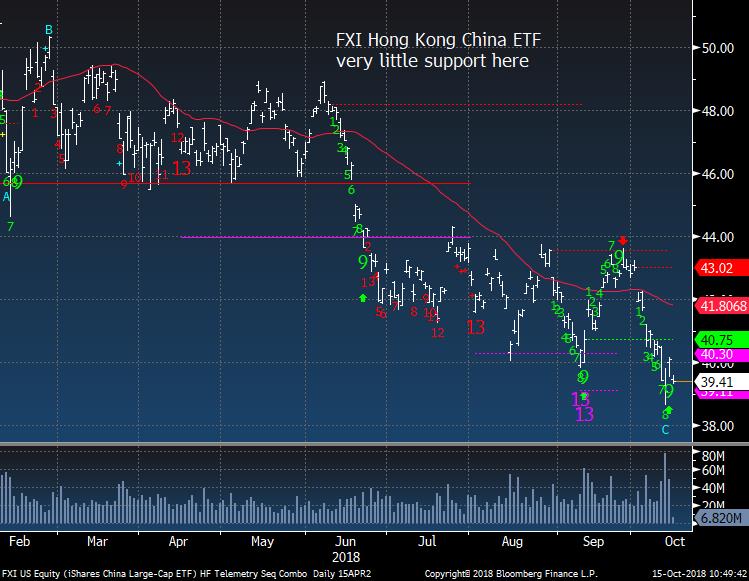
China / Hong Kong FXI ETF holding above recent low but I'm on the sidelines for now
|
|
|
|
|
|
|
|
|
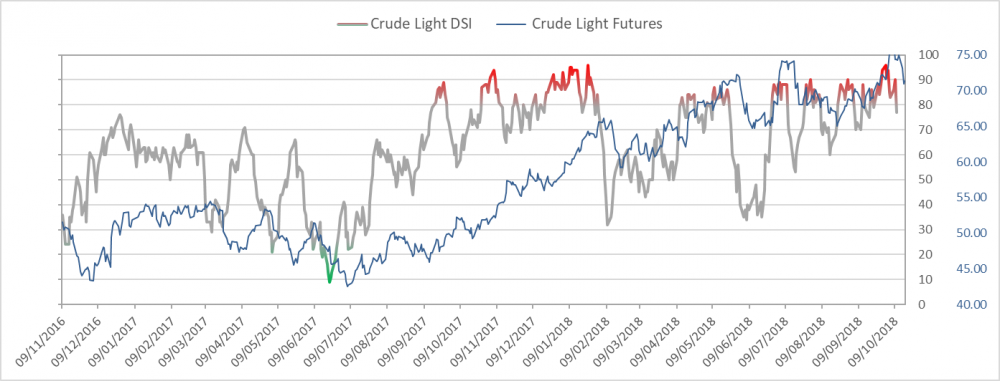
Crude bullish sentiment is at 66% and down from 96% recent high
|
|
|
|
|
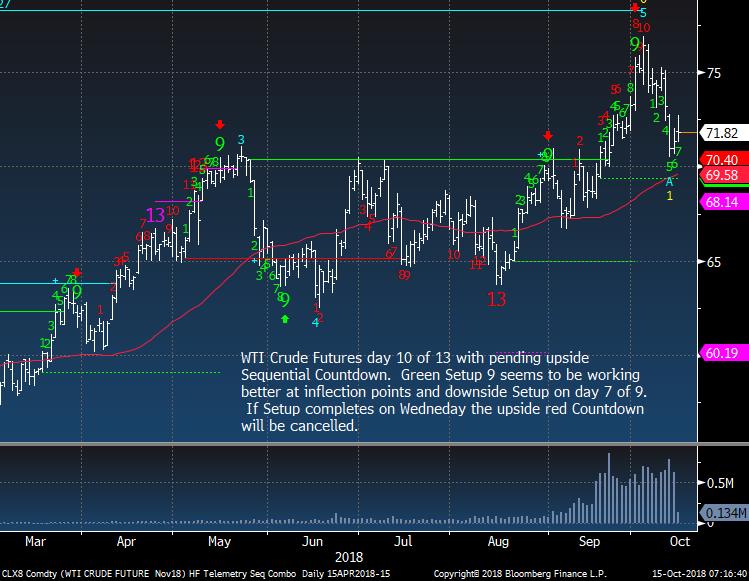
WTI Crude Futures had no response with Saudi news
|
|
|
|
|
|
|
|
|
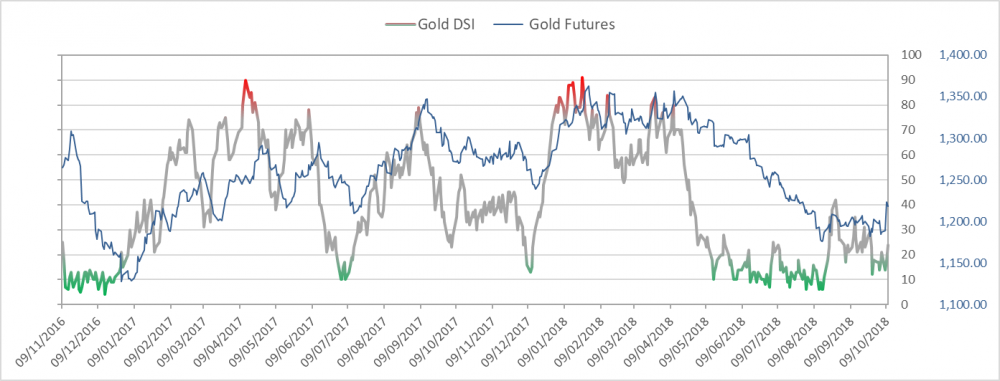
Gold bullish sentiment is at 33%
|
|
|
|
|
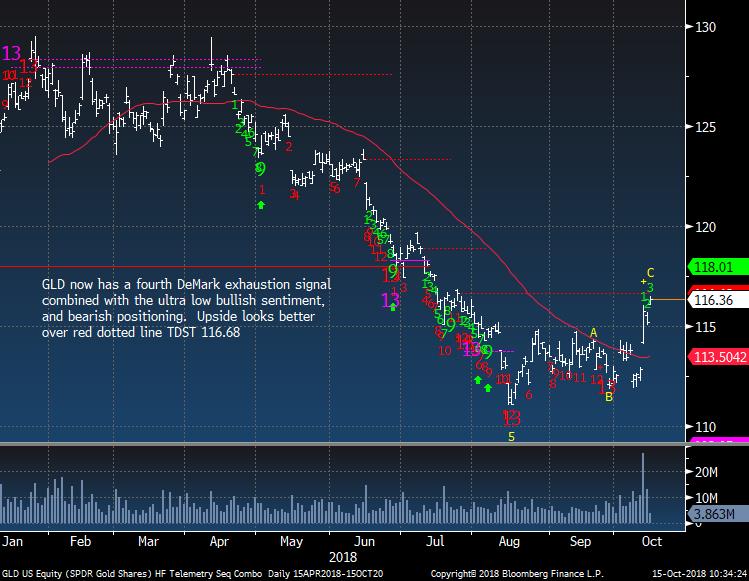
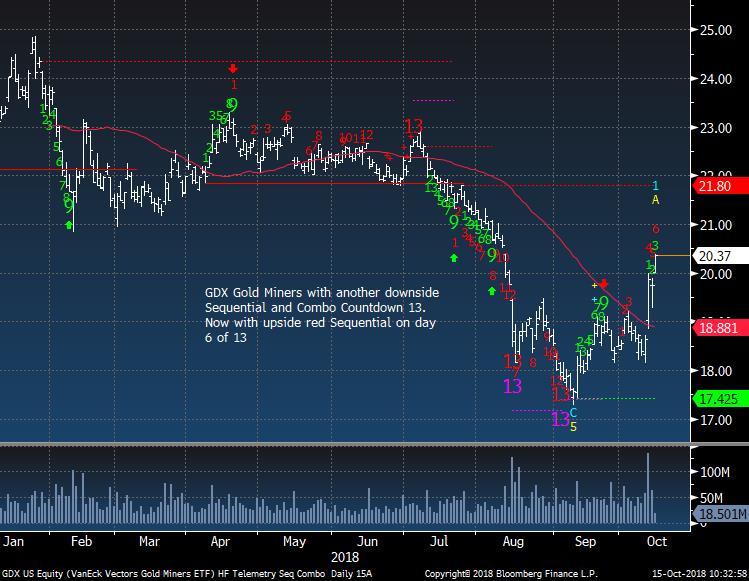
Gold still acting pretty good
|
|
|
|
|
Gold Miners GDX ETF continues higher
|
|
|
|
|
|
|
|
|
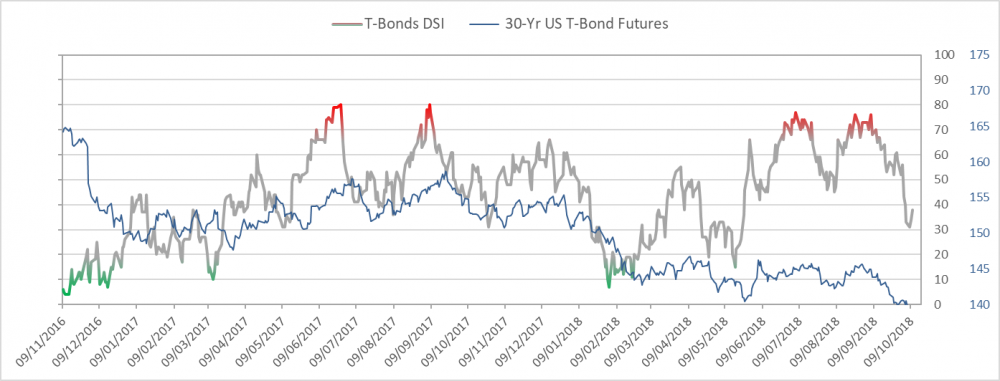
Bond bullish sentiment is at 47%
|
|
|
|
|
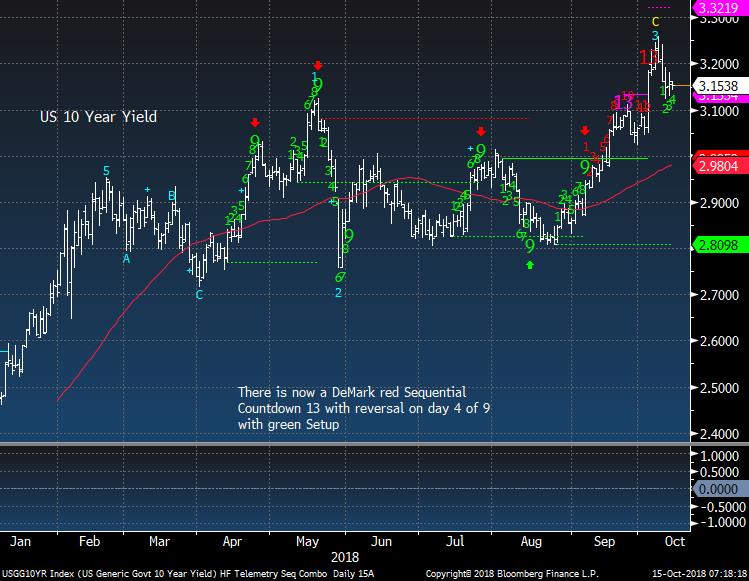
US 10 Year Yield reversing lower
|
|
|
|
|
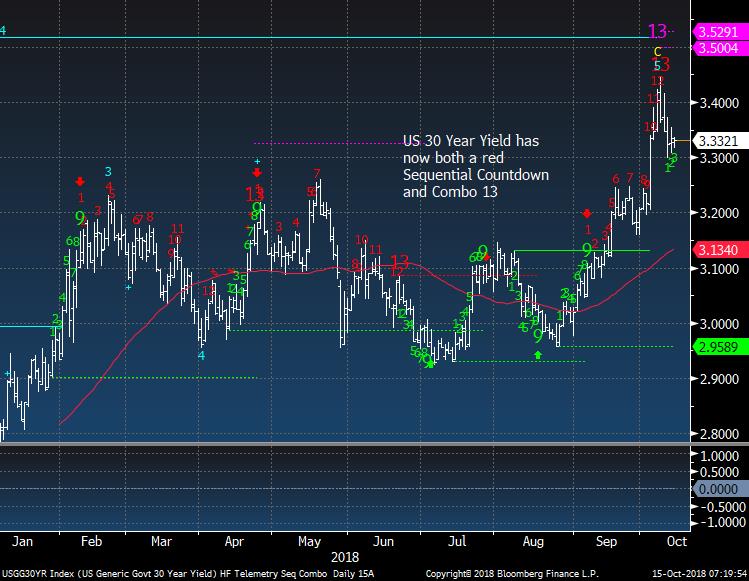
US 30 Year Yield reversing lower
|
|
|
|
|
|
|
|
|
|
|
DEMARK SCREENS - Daily, Weekly, Monthly Upside/Downside Exhaustion Signals
|
|
|
Daily/Weekly DeMark upside/downside exhaustion signals (Sequential) updated daily, Weekly signals on Monday's and monthly on the first day of the new month. Price flips occur when a stock closes higher/lower than four previous closes and increases conviction of a price turn.
The upside 13's are sell signals and downside 13's are buy signals. Price flip's are confirmation signals that increases potential for a price trend change. For example, if you are long a stock and there is an upside 13, you will want to take cautious action by selling down or out of a position. If initiating a short sale with the upside 13's, we tend to start with a 1/2 size and add with the downside price flip. The opposite is true for when there are downside 13's. Take a 1/2 size position
and add with the upside price flip. The DeMark Indicators are designed to assist the user with buying into weakness and selling into strength to anticipate trend exhaustion. Selling into a rally and buying into a decline often afford the opportunity to exit a trade without too serious a loss if wrong.
S&P 500 Universe:
DAILY UPSIDE 13: NONE
DAILY DOWNSIDE 13: GS, PNC, SO VAR
DAILY UPSIDE WITH PRICE FLIP REVERSAL DOWN: NONE
DAILY DOWNSIDE WITH PRICE FLIP REVERSAL UP:
NONE
Updated: 10/15/18
WEEKLY UPSIDE 13: NONE
WEEKLY
DOWNSIDE 13: IVZ, SYMC, WHR
Updated: 10/1/18
MONTHLY UPSIDE 13: ADSK, ALL, CCI, CME, DE, DLR, DTE, ETN, GLW, HPQ, INTU, PH, TPR, TXT, UPS, XLNX
MONTHLY DOWNSIDE 13: NONE
Euro Stoxx 600 Universe:
DAILY UPSIDE
13: NONE
DAILY DOWNSIDE 13: GJF NO, HEIO NA
DAILY UPSIDE WITH PRICE FLIP REVERSAL DOWN: NONE
DAILY DOWNSIDE WITH PRICE FLIP REVERSAL UP: SW FP, ZAL GR
Updated: 10/15/18
WEEKLY UPSIDE 13: MUV2 GR
WEEKLY DOWNSIDE 13: BAS GR, FHZN SW, FRA GR, IMB LN, JMT PL, ONTEX BB, OSR GR
Updated: 10/1/18
MONTHLY UPSIDE 13: BNZL LN, EXPN LN, FPE3 GR, SBMO NA, SECUB SS, SWEDA SS
MONTHLY DOWNSIDE 13: BAYN GR, HMB SS, TEF SM
|
|
|
Unsubscribe me from Hedge Fund Telemetry
Hedge Fund Telemetry LLC, P.O. Box 4675, Greenwich, CT 06861, United States
CONFIDENTIALITY NOTE and DISCLAIMER: This message is for the named person's use only. It may contain confidential, proprietary or legally privileged material. No confidentiality or privilege is waived by any accidental or unintentional transmission. If you receive this message in error, please immediately delete it and all copies of it from your system, destroy any hard copies and notify the sender. You must not, directly or indirectly, use, disclose,
distribute, print or copy any part of this message if you are not the intended recipient. Hedge Fund Telemetry LLC. cannot guarantee the confidentiality of the material transmitted; therefore, information of a sensitive or confidential nature should not be transmitted. There is risk in trading markets. Hedge Fund Telemetry LLC reports are based on information gathered from various sources and believed to be reliable, but are not guaranteed as to accuracy and completeness. The information is subject to change without notice and Hedge Fund Telemetry LLC has no obligation to provide any updates or changes. Hedge Fund Telemetry LLC is providing this data for informational and educational purposes and does not believe that it is sufficient to base an investment decision on. This information should not be regarded as a solicitation or recommendation of any particular security or to engage in any trading strategy. One should always check with your licensed financial
advisor to determine suitability of any investments.
|
|
|
|
|