|
|
|
|
|
|
|
|
|
|
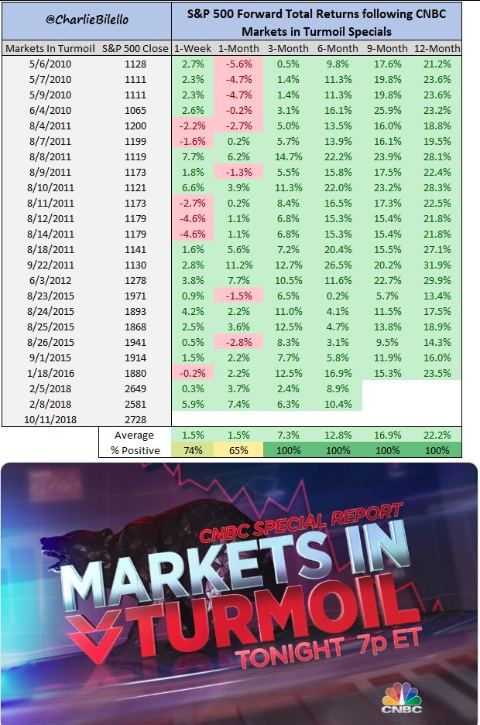
Today the global markets are bouncing after quite a difficult week. But the bounce in Europe has turned negative at the close and the US markets gapped up and are now fading below VWAP (volume weighted average price) levels (see the PPO monitor below). CNBC ran the "Market's In Turmoil" special which actually has a good record of being run at bottoms yet they might have pulled the rip cord too early. The big US banks reported for the most part inline with a few issues including
still weak loan growth/mortgage banking lackluster, increasing expenses, trading guidance weak despite a beat on equities yet very weak FICC trading. The early gains were sold as they have been for several quarters. A few upgrades with the mega cap names including Amazon, Microsoft, Netflix have helped but all of them are also today's VWAP. I've been thinking a short term bounce is very likely with some things showing oversold conditions. S&P and Nasdaq 100 bullish sentiment dropped to 10% which is what I have been expecting. The risk is sentiment remains low for a period of time as it remained high a few months ago. Sentiment is a condition and not a trigger to buy. There are many people citing oversold conditions but markets that don't bounce when oversold, sell off harder.
I am very concerned that there is an increasing possibility for a global crash. With essentially every global market under pressure and hitting new lows, there isn't
support. The US has been the market for global managers to gravitate towards as the US economy remains strong. (seem the Vanguard ETF's - global ex US and US only) And the Fed has raised rates eight times and how long can you fight the Fed? Marty Zweig, one of my long time market hero's was on Wall Street Week on October 16th 1987 and called for a crash. He was hesitant to call a crash since "it's like yelling fire in a theater" but the weight of the
evidence was overwhelming. The episode of Wall Street Week is amazing to watch today as many of the concerns are similar to the setup today. Rising interest rates, Fed tightening, over speculation and a market that had already come down off the highs by 10%. Liquidity from what I read from every derivative desk is a major concern since the depth of book is shallow on futures as well ETF's. It will be interesting to see how passive fund investors will handle a failed bounce. I don't believe the general public has made adjustments due to the current pullback as awareness is low. This has also been a market that was lead higher with stocks and sectors that had very low short interest which never is a good sign as we found out last January/February. Without short interest the possibility for a vacuum lower absent the natural buyer is strong. If you have prepared for this type of market action, the stress level is a lot lower. Having tight stops,
downside hedges, and an overweight with the typical cash allocation will get you though this period. There will be a lot of incredible opportunities ahead to buy at lower levels. Just be patient.
- US Markets - Sentiment at oversold levels 10% for both SPX and NDX. Bad looking bounce
- Hedge Fund Telemetry Trade Ideas - Made a bunch of changes
- US and the World - Two very
important charts to watch
- Breadth is not good
- A couple of stocks I'm watching today
- Financials and a sad chart of financial jobs
- Sector Focus - Semi's still look lower
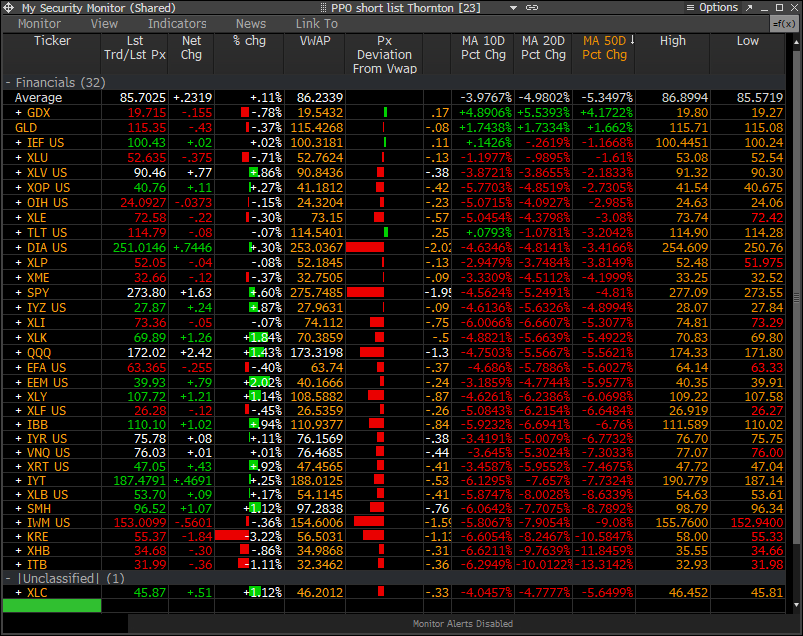
- PPO Monitor - Percentage Price Oscillator Force Ranked Sector Rotation - VWAP action showing fade
- Bloomberg Technical Pattern Recognition Screen
- Currency Update - Still range bound
- European Market Update - New lows with downside Countdowns in progress
- Asian Market Update - Nikkei still looks lower
- Crude Update - Sentiment dropping
- Gold and Copper Update - Sentiment improving
- Bond Update - Reversals after recent DeMark exhaustion signals - buy bonds
- DeMark Screens - Daily, Weekly, Monthly upside/downside exhaustion signals within the S&P 500 and Euro Stoxx 600 September Monthly data updated
|
|
|
|
|
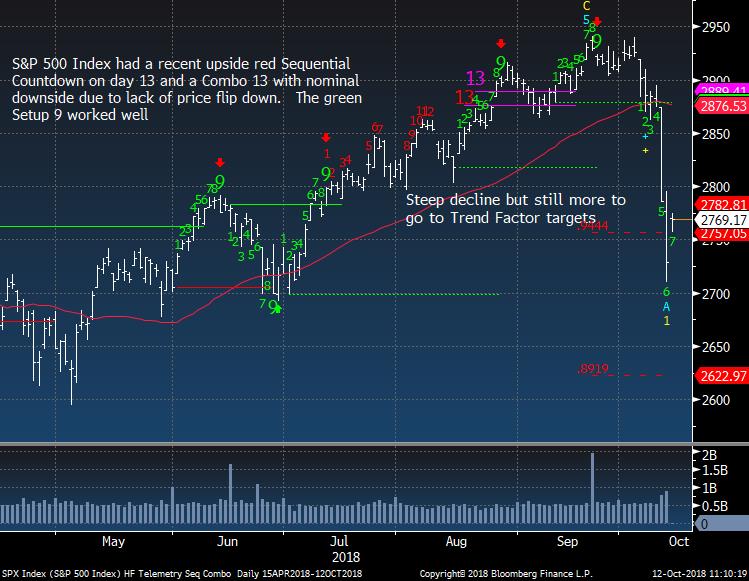
SPX daily very steep decline and this does not look done going down
|
|
|
|
|
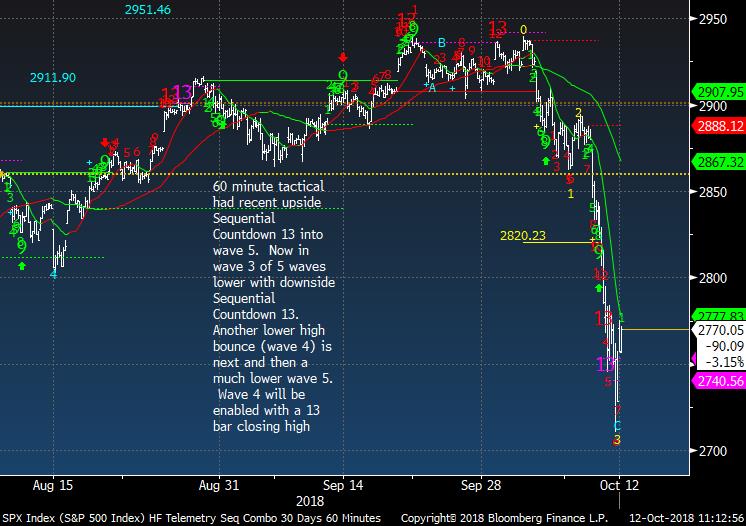
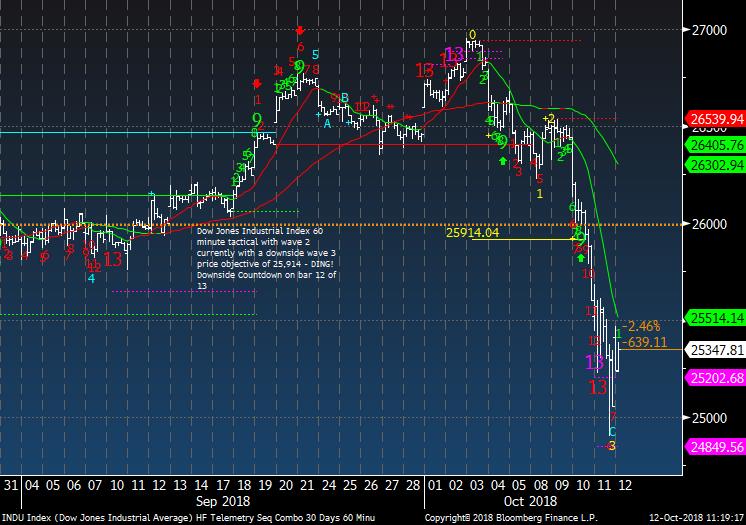
SPX 60 minute tactical time frame missing a bounce into wave 4.
|
|
|
|
|
Markets in Turmoil performance. I am afraid they ran this special too early
|
|
|
|
|
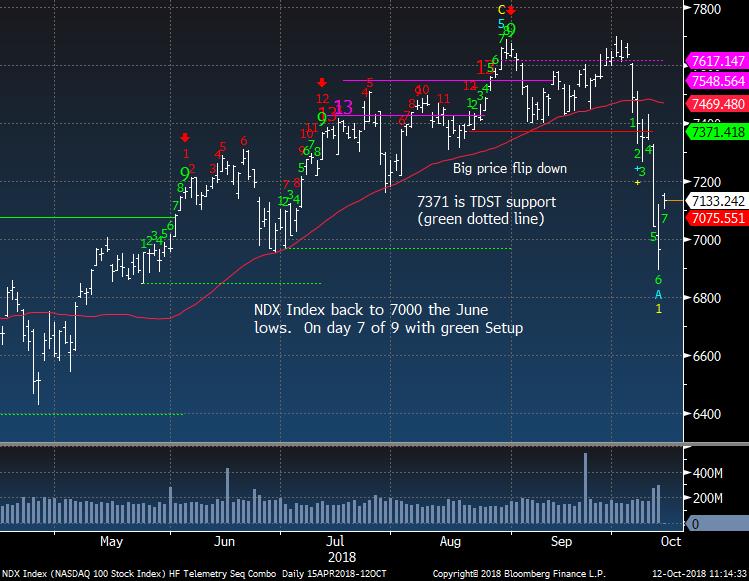
NDX Index very steep decline
|
|
|
|
|
NDX tactical 60 minute time frame bounce is absent of durability
|
|
|
|
|
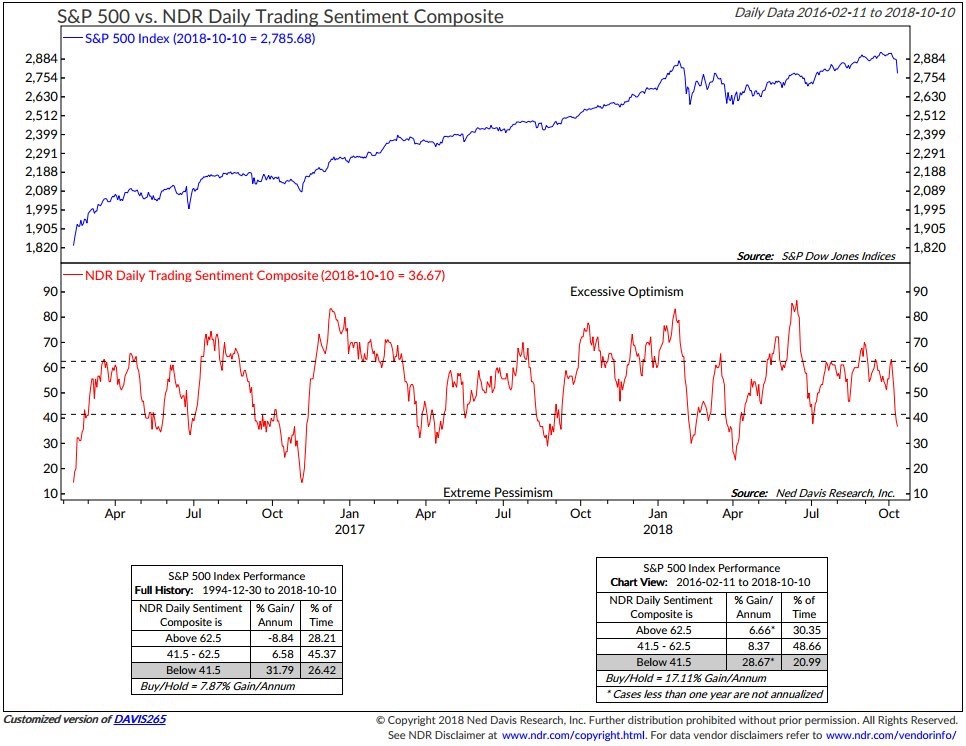
Ned Davis sentiment not at deep oversold levels yet
|
|
|
|
|
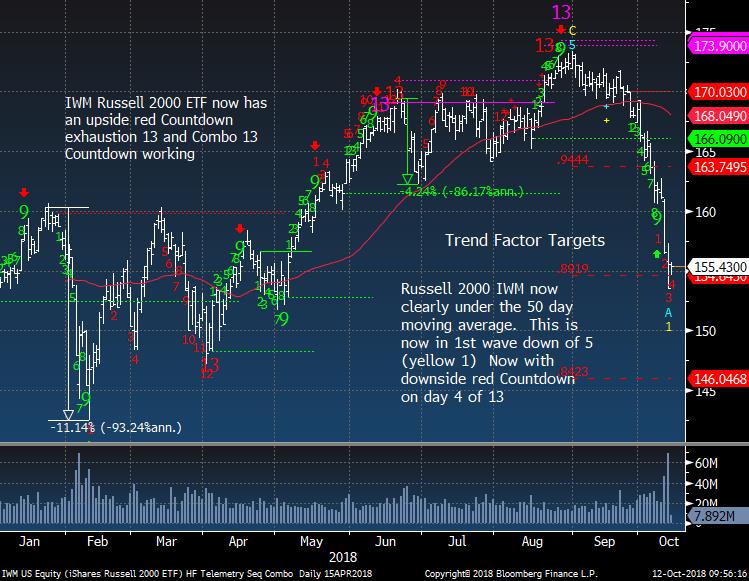
IWM Russell 2000 has a downside Countdown in progress
|
|
|
|
|
|
|
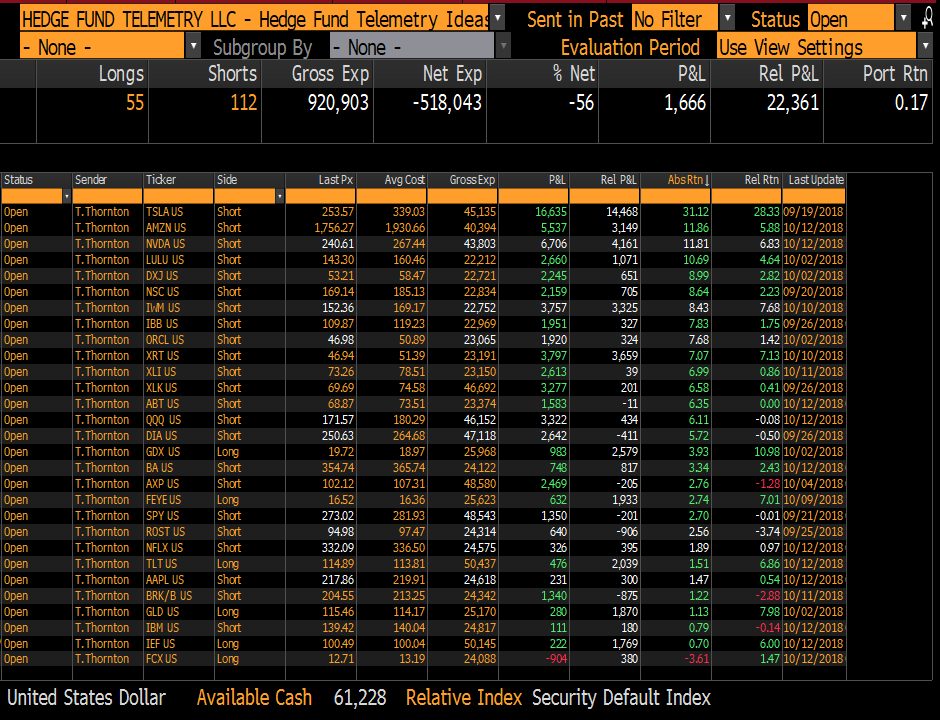
Hedge Fund Telemetry Trade Ideas
|
|
|
Trade Ideas Sheet - Long and short US equity ideas including ETF's. We will be overhauling the Trade Ideas Sheets for long only, short only, ETF's when the new website rolls out soon. There will also be a clearer email distribution with changes.
Trade Ideas Changes: SOLD LONG FB (WOULD RATHER NOT BE IN OVERSOLD STOCK), ADDED SHORT 2.5% SIZE AAPL, BA, IBM, NFLX. DOUBLED UP TO 5% FROM 2.5% SHORTS: QQQ, NVDA, AMZN. LONGS: IEF, TLT - FYI TIGHTENED UP ALL STOPS BELOW
Stops on everything. TSLA 285, GDX 17.35 , FEYE 16.00, NVDA 250, QQQ 178, XLK 75, SPY 285, XLY 113, AXP 109, XRT 50, IWM 163, XLV 94, BRK/B 110, DIA 260, XLI 77 IBB 116, ROST 100.50, ABT 75, ORCL 49, LULU 150, AMZN 1850 DXJ 56 , GLD 111, IEF 98 TLT 112 ,
AAPL 225, BA 370, IBM 150, NFLX 360
|
|
|
|
|
|
|
US and the World - Very Important Charts To Watch
|
|
|
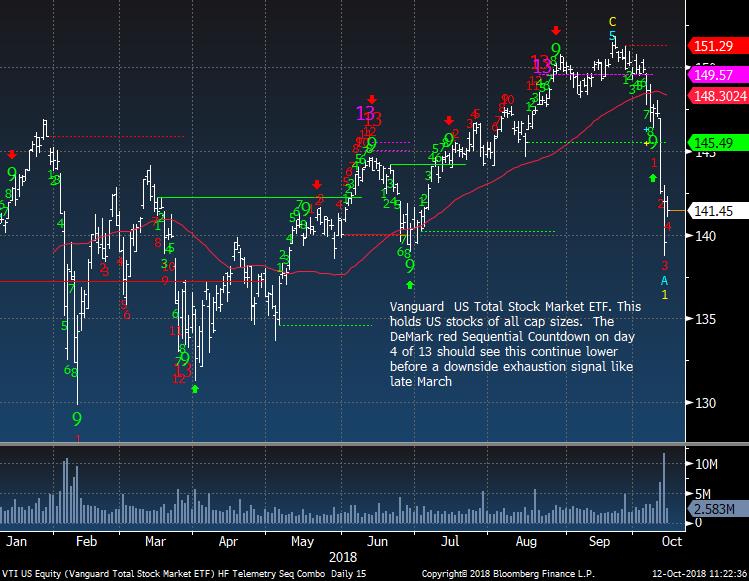
These charts are what I'm concerned about for a potential global crash. The US total stock market ETF has a downside Countdown in progress
|
|
|
|
|
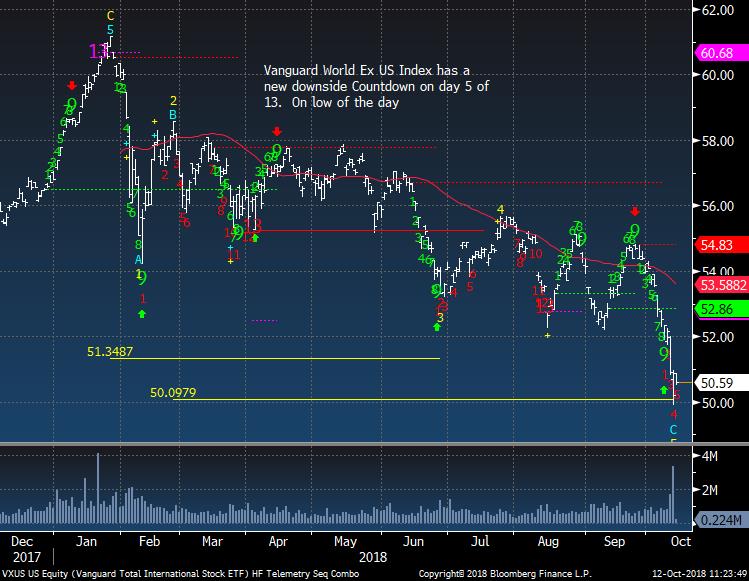
The world ex US has no support below
|
|
|
|
|
|
|
|
|
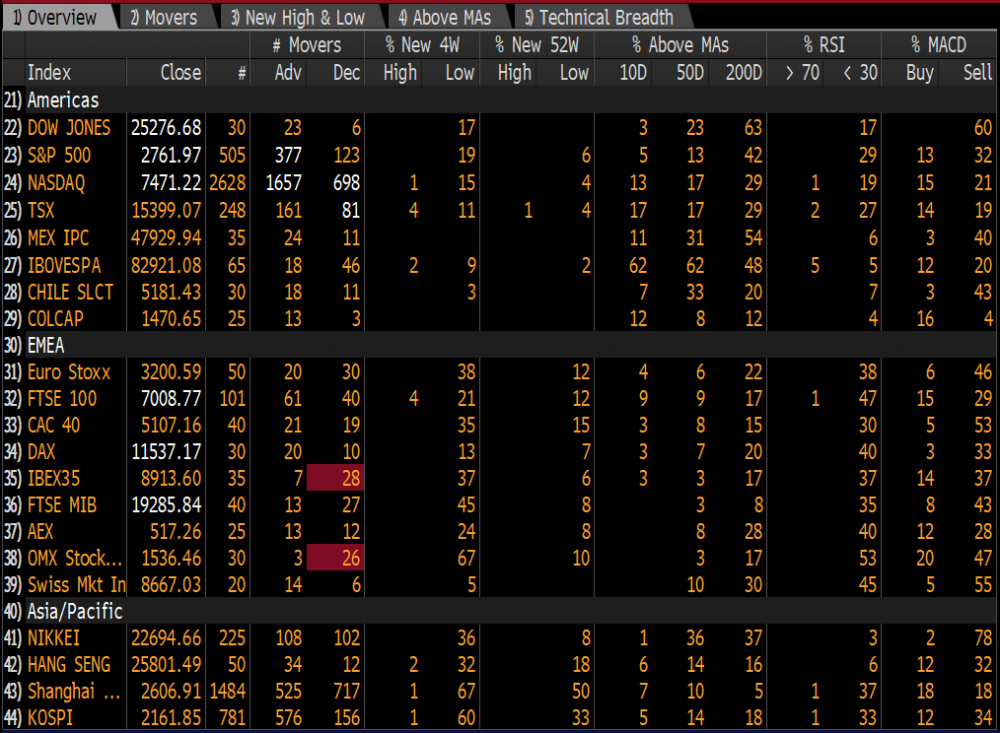
A lot going on here with the WEIB function on Bloomberg. Still a high % new 4 week lows globally. Percentage above the 10, 50 and 200 day is low and oversold but if this can't turn up a dislocation can happen.
|
|
|
|
|
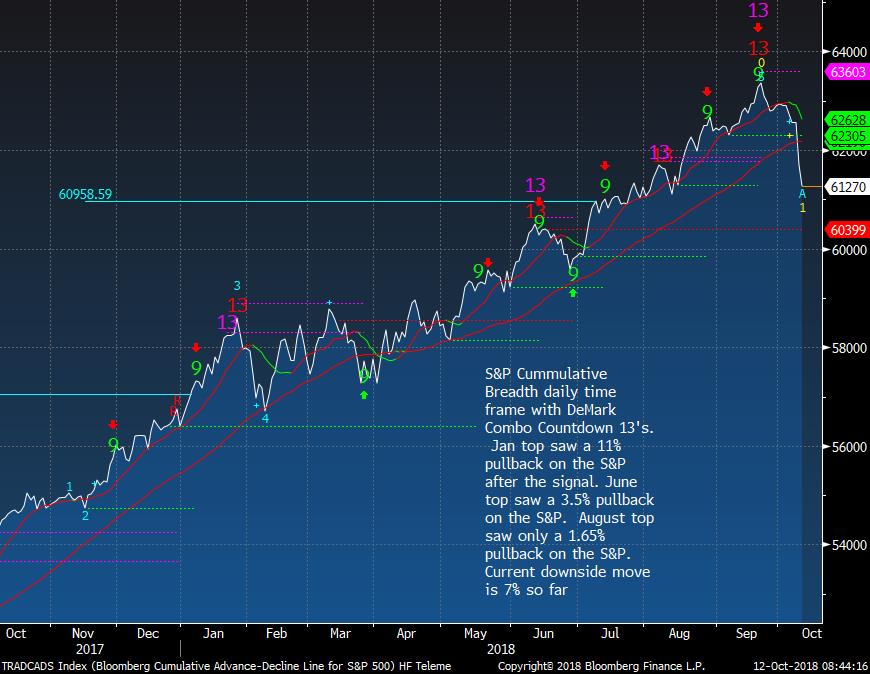
S&P cumulative breadth using the DeMark Indicators worked well again spotting the exact top ahead of this pullback
|
|
|
|
|
|
|
A couple stocks I looking at today
|
|
|
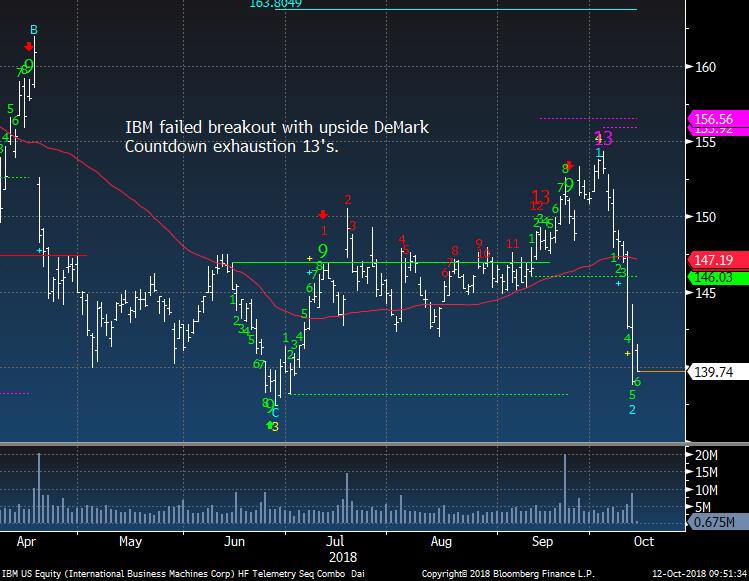
IBM daily failed upside breakout as expected. 140 is support and below I expect lower levels
|
|
|
|
|
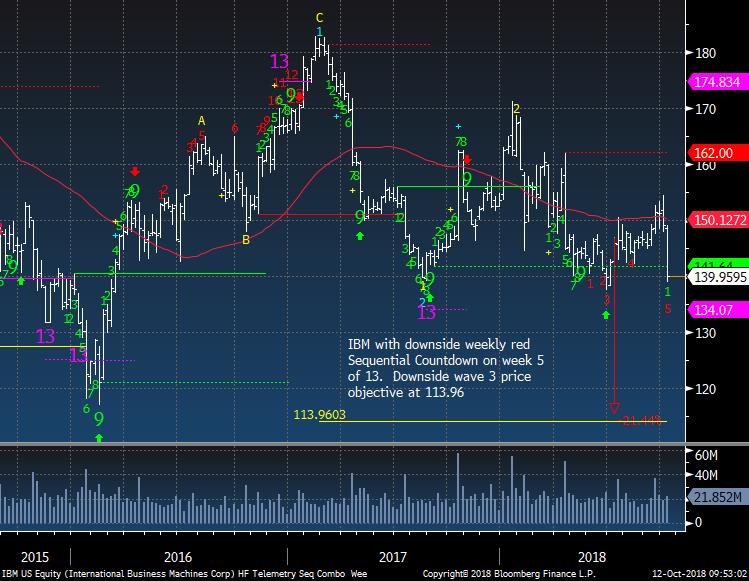
IBM weekly has been a chart I've been watching for a while. On week 5 of 13 on the downside
|
|
|
|
|
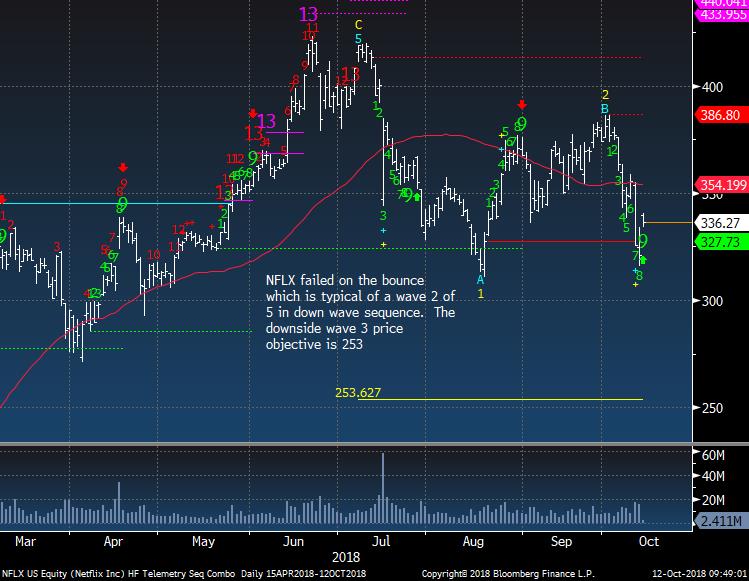
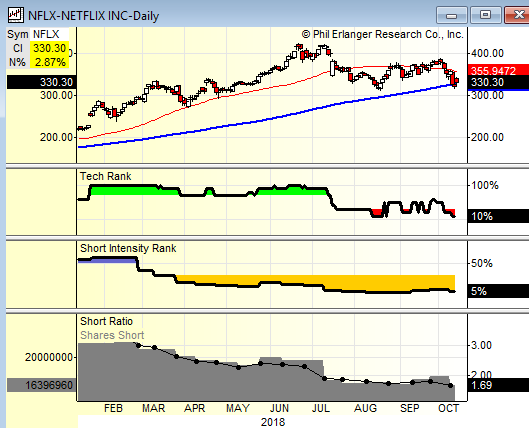
NFLX at support but I'm shorting 2.5% as short interest is still pretty low
|
|
|
|
|
NFLX reports Tuesday and going into earnings with even lower short interest than last earnings report. Risk of a squeeze higher is low
|
|
|
|
|
|
|
Financials and a sad chart of financial job layoffs
|
|
|
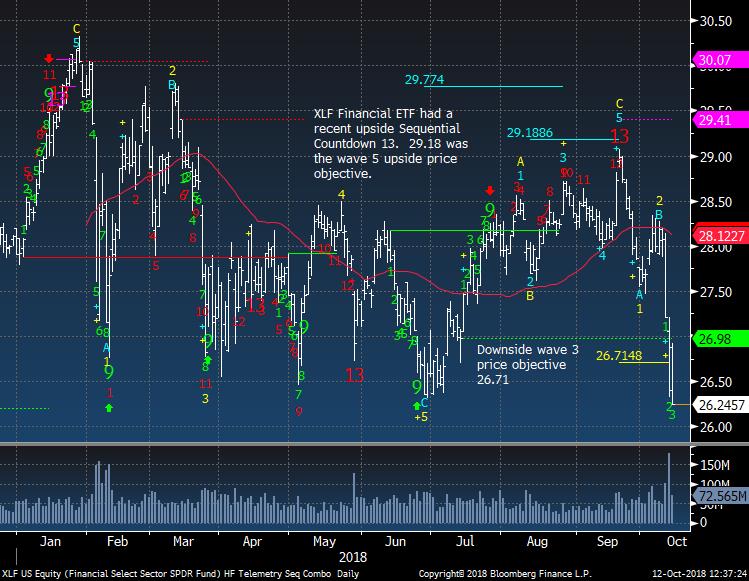
The big banks are fading after earnings and this was a big hope for the markets that earnings would lift the sector and the overall markets. You have to have the banks working for a healthy market in my view
|
|
|
|
|
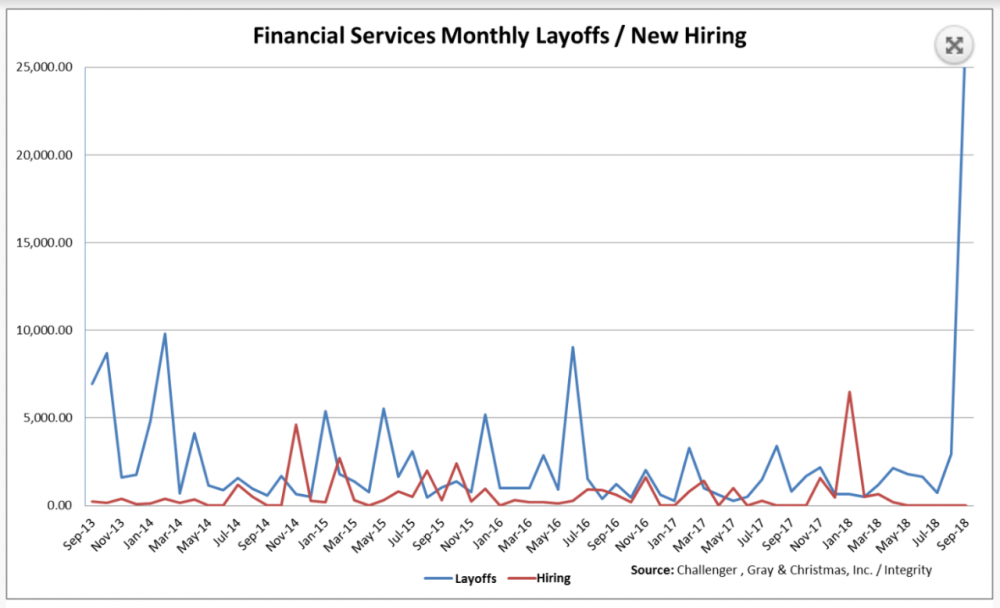
This is just horrible. Terrible for NYC and area real estate too
|
|
|
|
|
|
|
US Sector Focus - Semiconductors
|
|
|
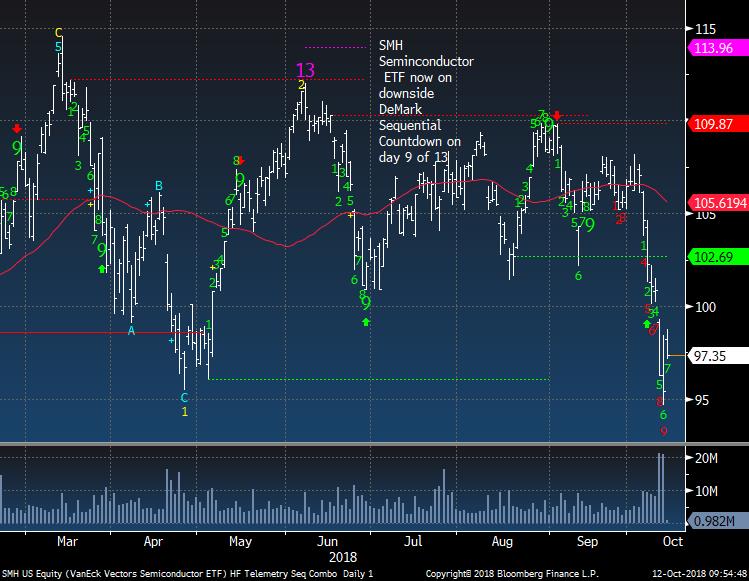
Bounced but still likely lower ahead
|
|
|
|
|
|
|
PPO Monitor - Percentage Price Oscillator
|
|
|
The PPO Monitor is a proprietary monitor developed to force rank Indexes, Sectors, and Stocks. It ranks top down by strongest to weakest by percentage above/below the 50 day moving average. Shorter term signals can be seen when the 10 and 20 day moving averages turn up (green) or down (red) which often are followed by the 50 day moving average. This is useful to watch for historically overbought/oversold percentage above/below the 50 day moving average. It is
non correlated with the DeMark Indicators however we have found upside/downside exhaustion signals often occur when something rises to the top or drifts to the bottom of the monitor - increasing the timing aspect. We share this monitor with clients with Bloomberg Terminals. An added feature is that each market/ETF can be expanded with each component force ranked in the same way. A couple other features include price deviation from intraday VWAP (useful for intraday reversals) and new 20 day highs/lows on right side. Please inquire if you would like to be permissioned to use the PPO Monitor.
Today's highlights: While a lot of sectors are up many of them are under their VWAP levels which means there is still more supply to sell
|
|
|
|
|
|
|
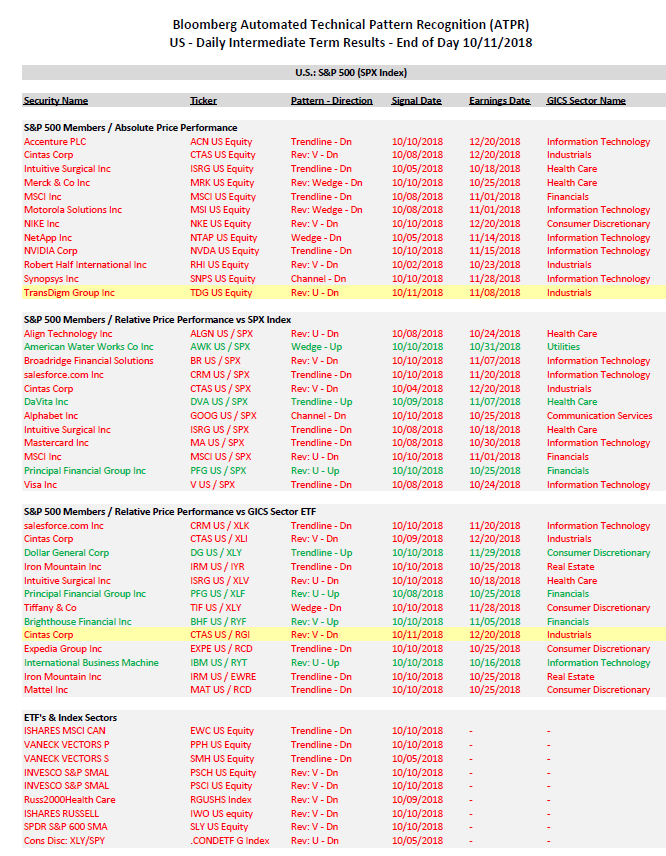
Bloomberg Automated Technical Pattern Recognition Screens
|
|
|
S&P 500 Members/Absolute Price Performance and Relative Price Performance vs S&P 500 and Sector ETF's. ETF's vs Index Sectors. Pair Trades. Long side is first symbol, short side is second symbol. They are finding more downside patterns in screening.
|
|
|
|
|
|
|
|
|
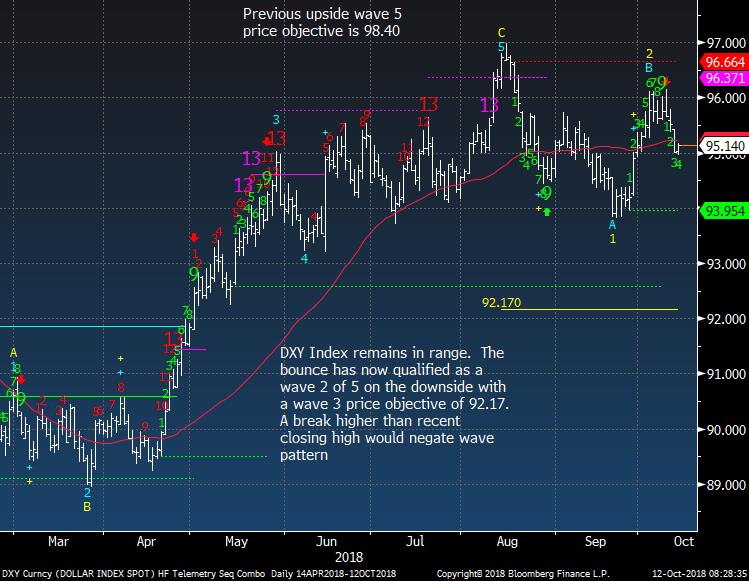
US Dollar Index bullish sentiment is at 51% and USD remains in a tight range
|
|
|
|
|
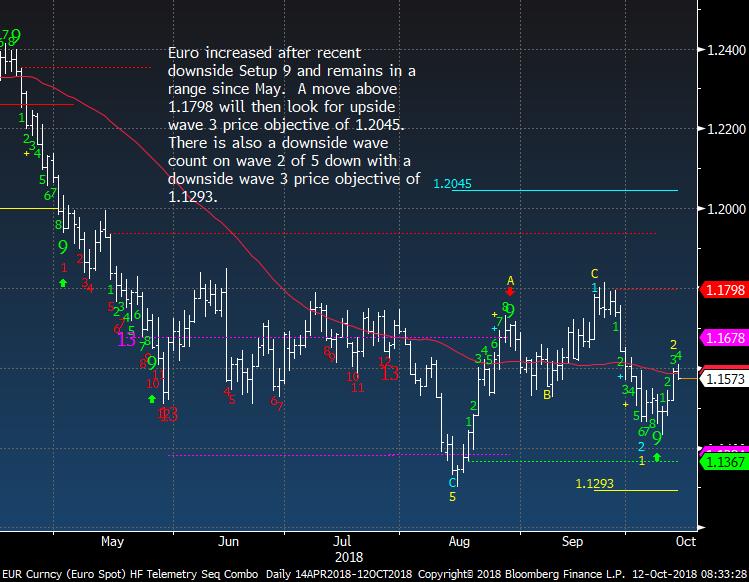
Euro Spot bullish sentiment is at 34% and also remains in a tight range
|
|
|
|
|
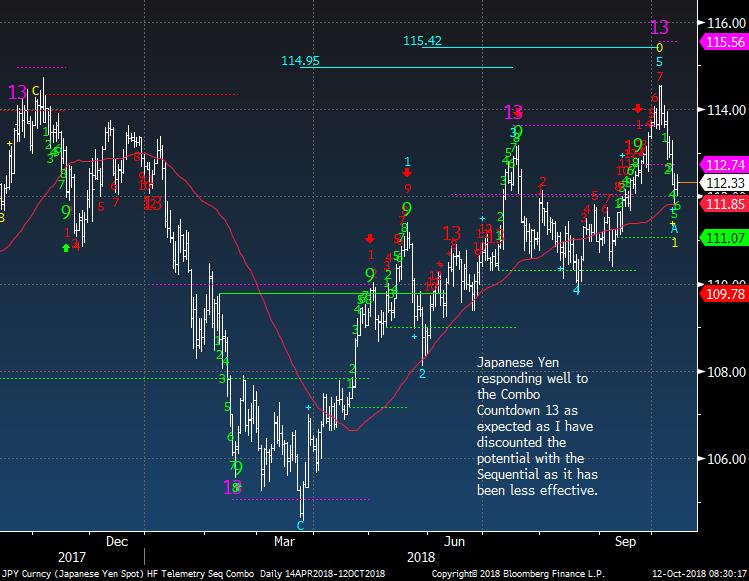
Yen weakness stopped with upside Combo 13
|
|
|
|
|
|
|
|
|
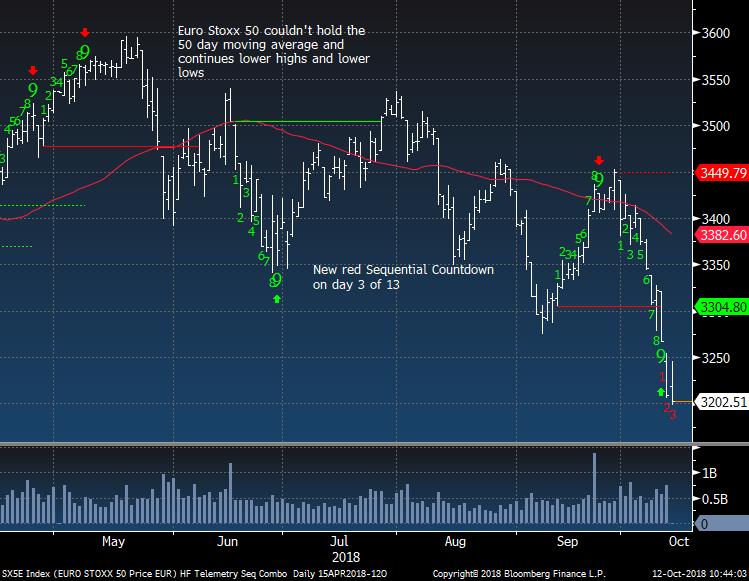
Euro Stoxx 50 new lows with downside Countdown only on day 3 of 13
|
|
|
|
|
|
|
|
|
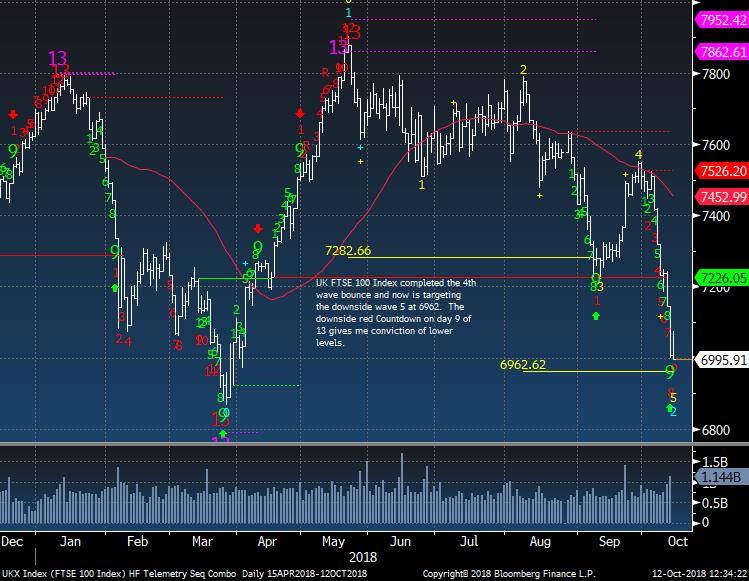
UK FTSE near downside price objective but more downside likely before exhaustion signal
|
|
|
|
|
|
|
|
|
|
|
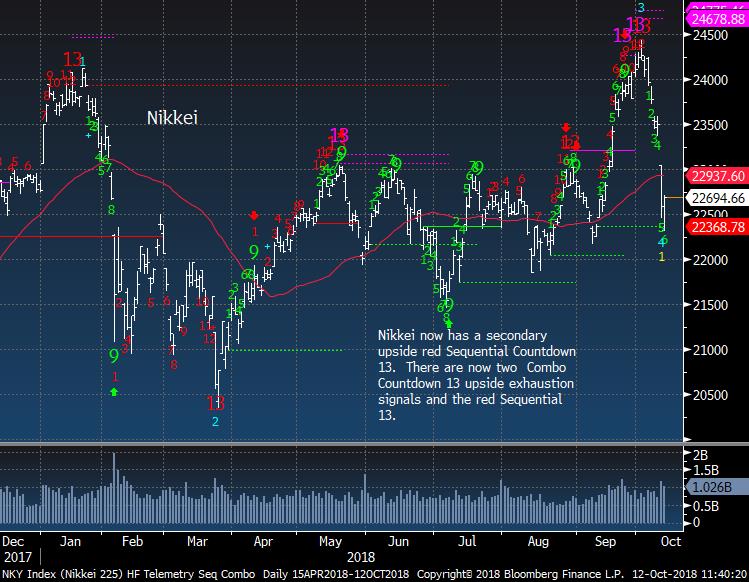
Nikkei another great reaction after the upside DeMark exhaustion signals
|
|
|
|
|
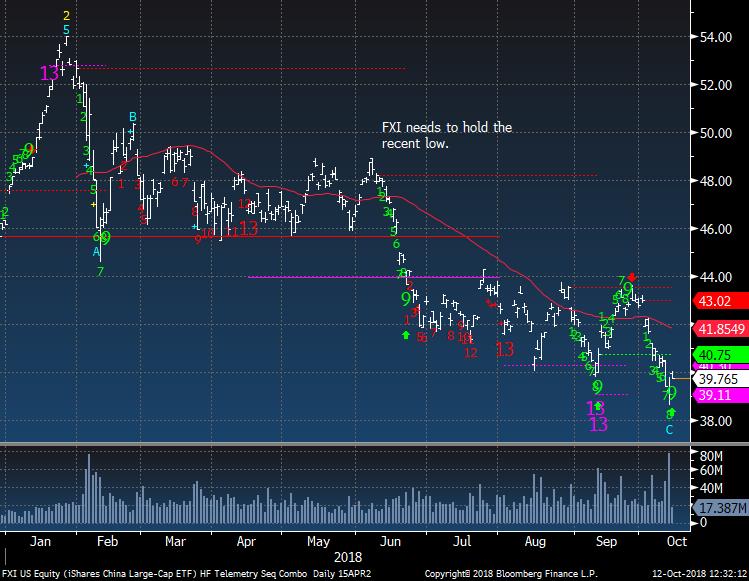
China / Hong Kong FXI ETF holding lows but for how long?
|
|
|
|
|
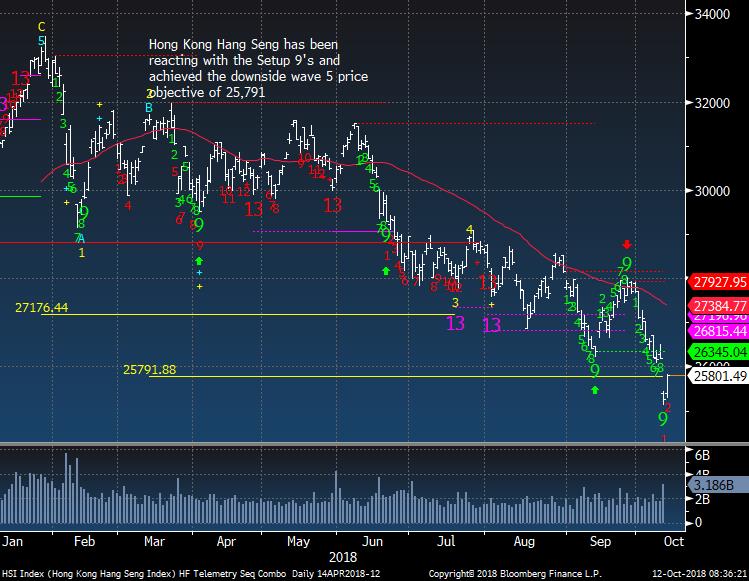
Hong Kong will be one to watch tonight for failure
|
|
|
|
|
|
|
|
|
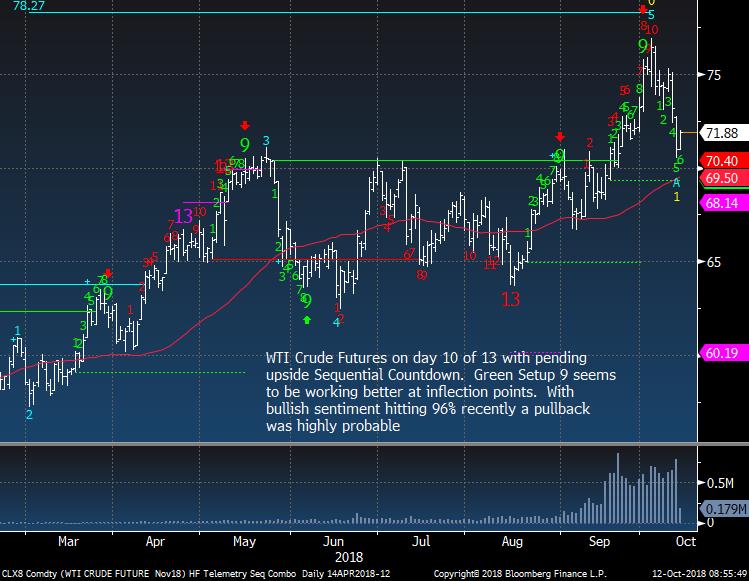
WTI Crude Futures bullish sentiment is at 62% down from a recent high of 96%
|
|
|
|
|
|
|
|
|
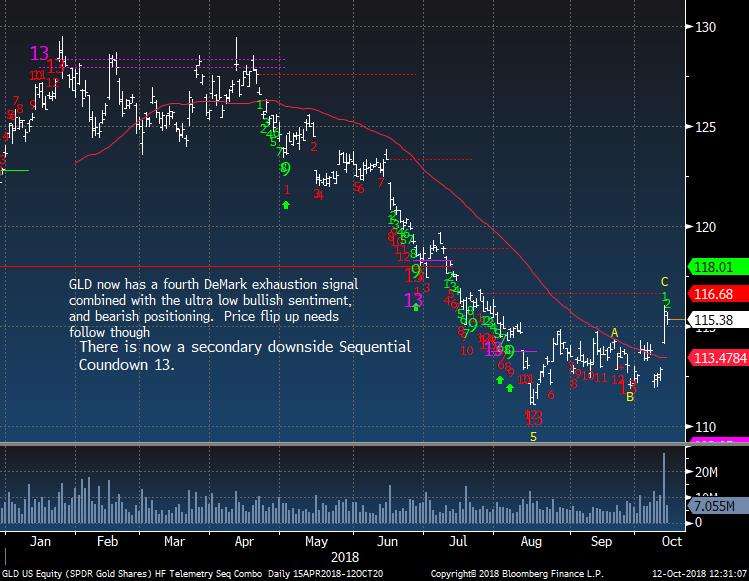
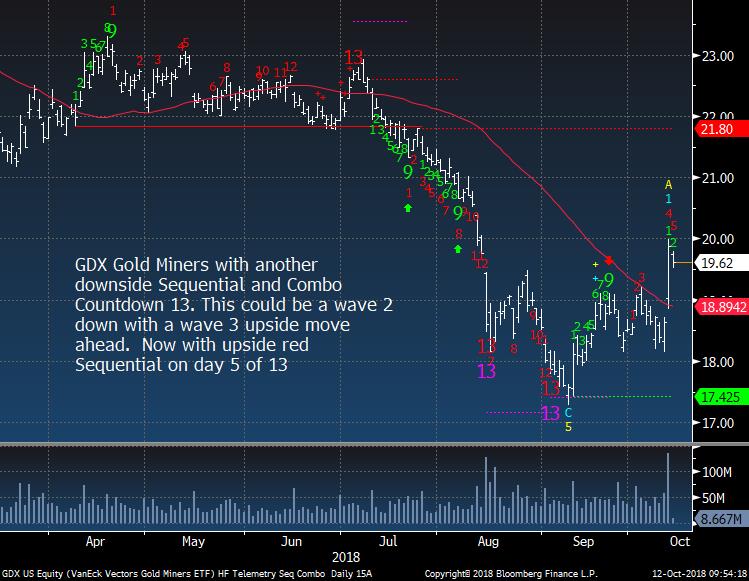
Gold bullish sentiment is at 38% and increased from 24% the previous day
|
|
|
|
|
GDX Gold Miners had a big day yesterday and needs to continue higher in the coming days
|
|
|
|
|
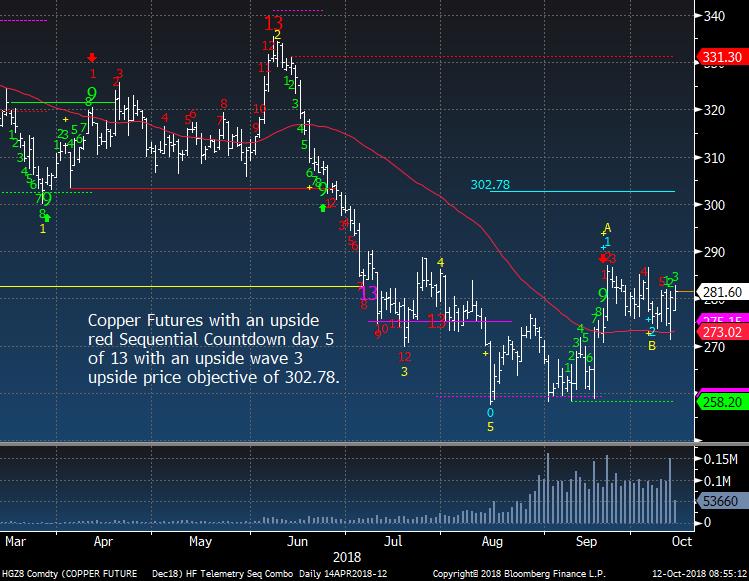
Copper bullish sentiment is at 36% and needs to clear 50% to accelerate price higher
|
|
|
|
|
|
|
|
|
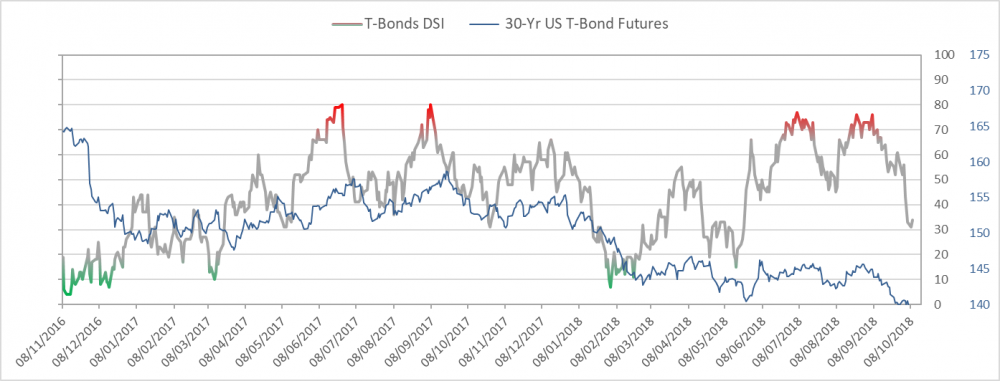
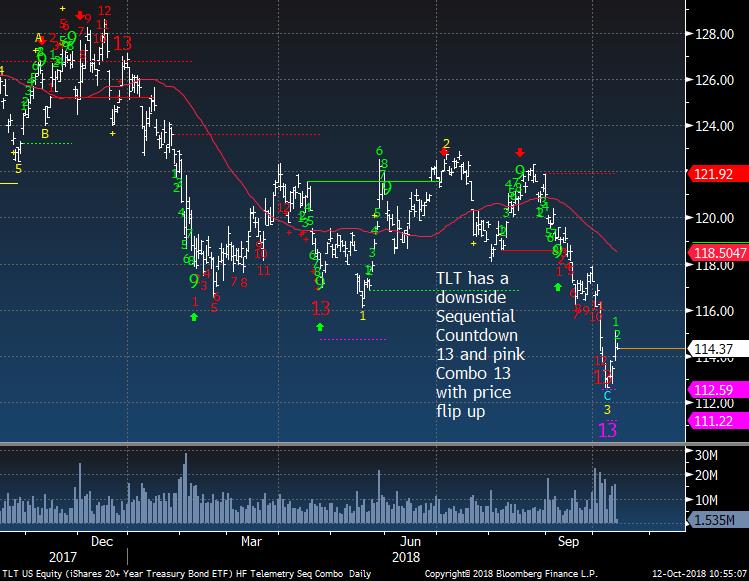
Bond bullish sentiment is at 50%
|
|
|
|
|
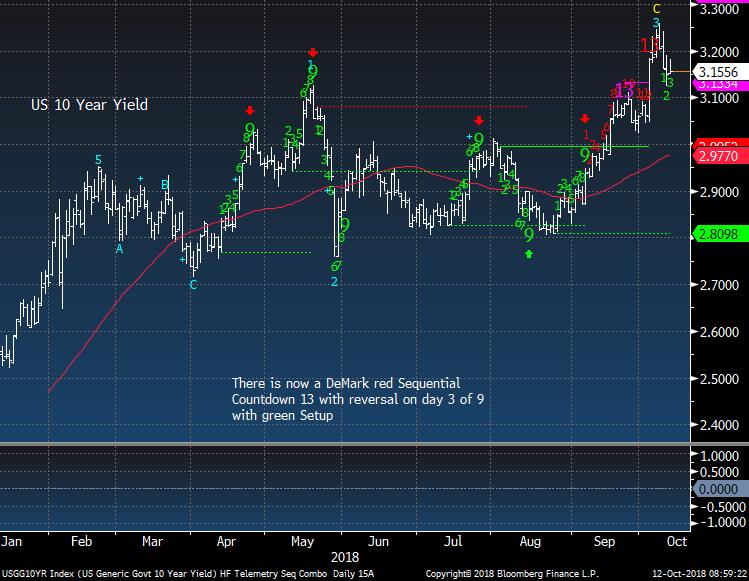
US 10 Year Yield should work lower
|
|
|
|
|
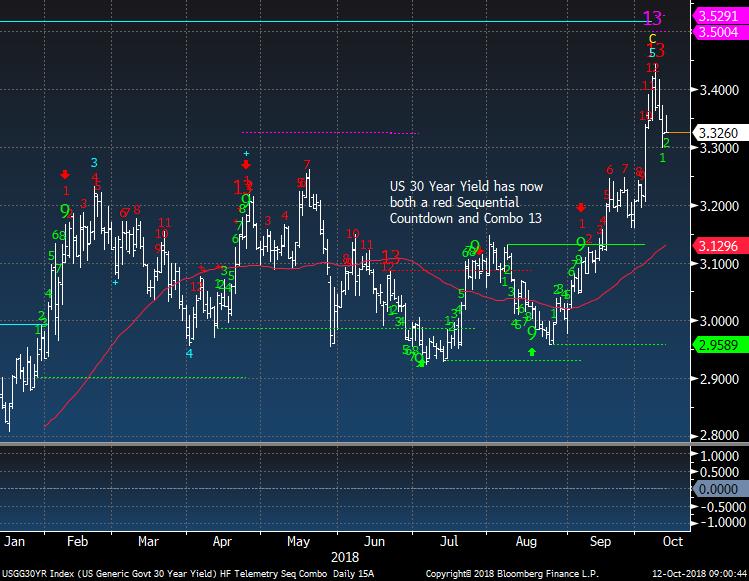
US 30 Year Yield same story
|
|
|
|
|
|
|
|
|
|
|
DEMARK SCREENS - Daily, Weekly, Monthly Upside/Downside Exhaustion Signals
|
|
|
Daily/Weekly DeMark upside/downside exhaustion signals (Sequential) updated daily, Weekly signals on Monday's and monthly on the first day of the new month. Price flips occur when a stock closes higher/lower than four previous closes and increases conviction of a price turn.
The upside 13's are sell signals and downside 13's are buy signals. Price flip's are confirmation signals that increases potential for a price trend change. For example, if you are long a stock and there is an upside 13, you will want to take cautious action by selling down or out of a position. If initiating a short sale with the upside 13's, we tend to start with a 1/2 size and add with the downside price flip. The opposite is true for when there are downside 13's. Take a 1/2 size position
and add with the upside price flip. The DeMark Indicators are designed to assist the user with buying into weakness and selling into strength to anticipate trend exhaustion. Selling into a rally and buying into a decline often afford the opportunity to exit a trade without too serious a loss if wrong.
S&P 500 Universe:
DAILY UPSIDE 13: NONE
DAILY DOWNSIDE 13: AMG, LKQ, TPR, VLO, WMB
DAILY UPSIDE WITH PRICE FLIP REVERSAL DOWN: ES
DAILY DOWNSIDE WITH PRICE FLIP REVERSAL UP: NONE
Updated: 10/8/18
WEEKLY UPSIDE 13: ABC, AES, DISCA, DISCK, EW
WEEKLY DOWNSIDE 13: GM, MAC MHK
Updated:
10/1/18
MONTHLY UPSIDE 13: ADSK, ALL, CCI, CME, DE, DLR, DTE, ETN, GLW, HPQ, INTU, PH, TPR, TXT, UPS, XLNX
MONTHLY DOWNSIDE 13: NONE
Euro Stoxx 600 Universe:
DAILY UPSIDE 13: DLG GR
DAILY DOWNSIDE 13: BBA LN, ELM LN, GSK LN, HEN3 GR, HSBA LN, INF LN, LOGN SW, POM FP, QIA GR, TUI LN, UTDI GR
DAILY UPSIDE WITH PRICE FLIP REVERSAL DOWN: REE SM
DAILY DOWNSIDE WITH PRICE FLIP REVERSAL UP: PNDORA DC
Updated: 10/8/18
WEEKLY UPSIDE 13: NONE
WEEKLY DOWNSIDE 13: AMS SW, GPOR LN
Updated: 10/1/18
MONTHLY UPSIDE 13: BNZL LN, EXPN LN, FPE3 GR, SBMO NA, SECUB SS, SWEDA SS
MONTHLY DOWNSIDE 13: BAYN GR, HMB SS, TEF SM
|
|
|
Unsubscribe me from Hedge Fund Telemetry
Hedge Fund Telemetry LLC, P.O. Box 4675, Greenwich, CT 06861, United States
CONFIDENTIALITY NOTE and DISCLAIMER: This message is for the named person's use only. It may contain confidential, proprietary or legally privileged material. No confidentiality or privilege is waived by any accidental or unintentional transmission. If you receive this message in error, please immediately delete it and all copies of it from your system, destroy any hard copies and notify the sender. You must not, directly or indirectly, use, disclose,
distribute, print or copy any part of this message if you are not the intended recipient. Hedge Fund Telemetry LLC. cannot guarantee the confidentiality of the material transmitted; therefore, information of a sensitive or confidential nature should not be transmitted. There is risk in trading markets. Hedge Fund Telemetry LLC reports are based on information gathered from various sources and believed to be reliable, but are not guaranteed as to accuracy and completeness. The information is subject to change without notice and Hedge Fund Telemetry LLC has no obligation to provide any updates or changes. Hedge Fund Telemetry LLC is providing this data for informational and educational purposes and does not believe that it is sufficient to base an investment decision on. This information should not be regarded as a solicitation or recommendation of any particular security or to engage in any trading strategy. One should always check with your licensed financial
advisor to determine suitability of any investments.
|
|
|
|
|