|
|
|
|
|
|
|
|
One of the more predicable things that happens, when the Fed raises rates, is blaming the Fed for any subsequent stock market pullback or economic softening. Go back to 1929, 1937, 2001, 2008, and even in 2015 when tapering talk was discussed. They always blame the Fed. Yesterday President Trump said the Fed was "loco" and "has gone crazy for
raising rates". Fed Chairman Powell is doing what the Fed should do after 9 years of ultra low rates. Having the ability to come in at times of stress is what the Fed does (and they need more bullets to fire) and a pullback like we've seen over the past few weeks isn't going to change his mandate. He didn't do anything in February with a deeper pullback into March and expectations remain the same for future hikes.
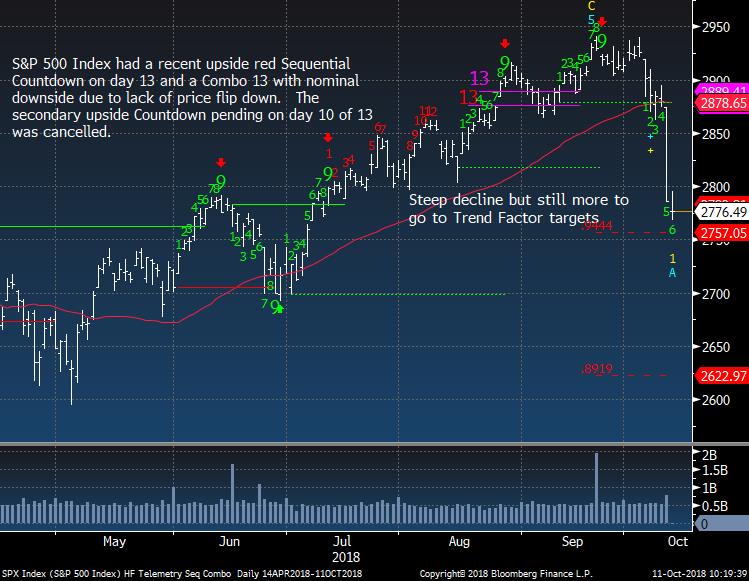
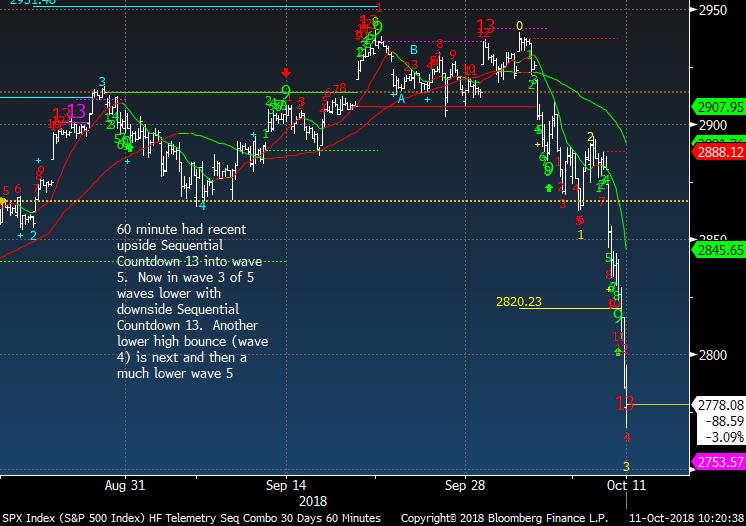
Another very predicable thing is the people calling to buy the dips offering a ton of studies and reasons. People on both Bloomberg and CNBC today have been overwhelmingly saying to buy the dip as things are "oversold". These are people who saw no risk a few weeks ago or overbought conditions and never said to take down risk. The fear in the market is not yet there in my opinion to call for a durable bottom. The tactical 60 minute charts of the S&P and Nasdaq 100 are due for a bounce but it's going to be a wave 4 of 5 corrective
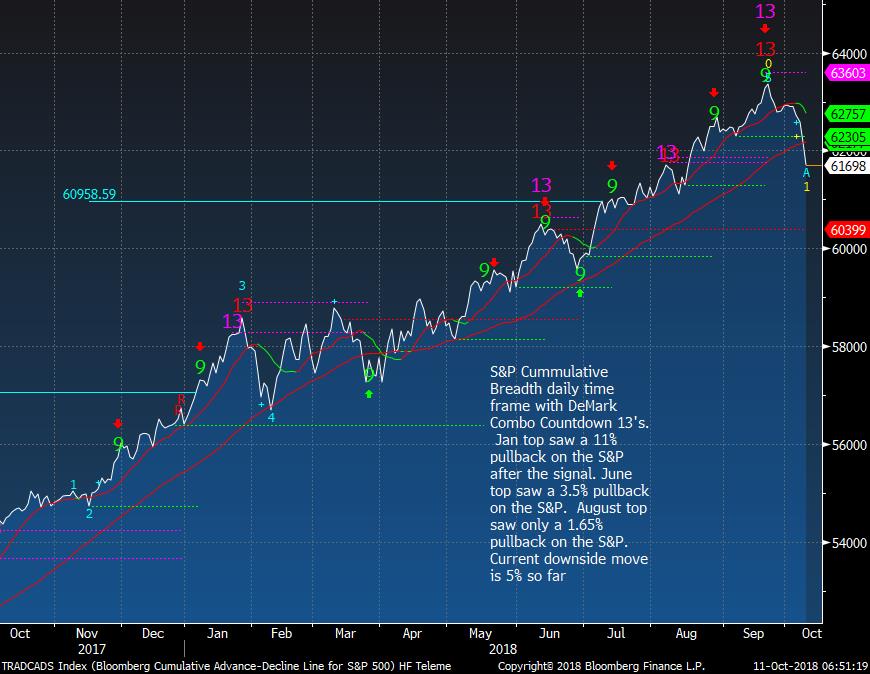
lower high bounce followed by a lower low. On a daily time frame this first move down is wave 1 of 5 and a corrective lower high wave 2 is ahead. S&P bullish sentiment is at 28% and this isn't oversold enough. The percentage of stocks above the 50 day has dropped hard but it still can go lower. Yesterday had a very strong breadth thrust on the downside that had 248 S&P stocks make 20 day lows. This is a large number that adds to my conviction that a lower high bounce is possible ahead. Tomorrow the big US banks will report and the bar is relatively low this quarter. Overall the earnings are expected to be OK but where are we in the cycle is the big question. Diminishing marginal return on rate increases seemed to have hit a breaking point. Not getting that incremental increase in margin. Loan growth not taking off. Credit quality has remained stellar. Better hope banks don't report any mild issues there because that is the last shoe to
drop.
I've reduced some short exposure this morning on the Trade Ideas Sheet with the belief a lower high bounce is ahead. If I am wrong and things continue lower which is totally possible with foreign markets under pressure breaking all support levels my exposure will be fine. I still believe strongly having a decent sized percentage of cash at this time is appropriate. This period of volatility is not over and by no means is the all clear flag waving.
- US Markets - Sentiment is not oversold yet. Tactical 60 minute charts should see a lower high bounce soon
- Hedge Fund Telemetry Trade Ideas - Took some profits on some shorts and added FB long
- The Anatomy of Nasdaq Declines - From Ned Davis
- Will the US drag the world lower?
- Credit Spreads Update
- Facebook - New Long Idea
- PPO Monitor - Percentage Price Oscillator Force Ranked Sector Rotation - Defensive stocks on top now
- Bloomberg Technical Pattern Recognition Screen
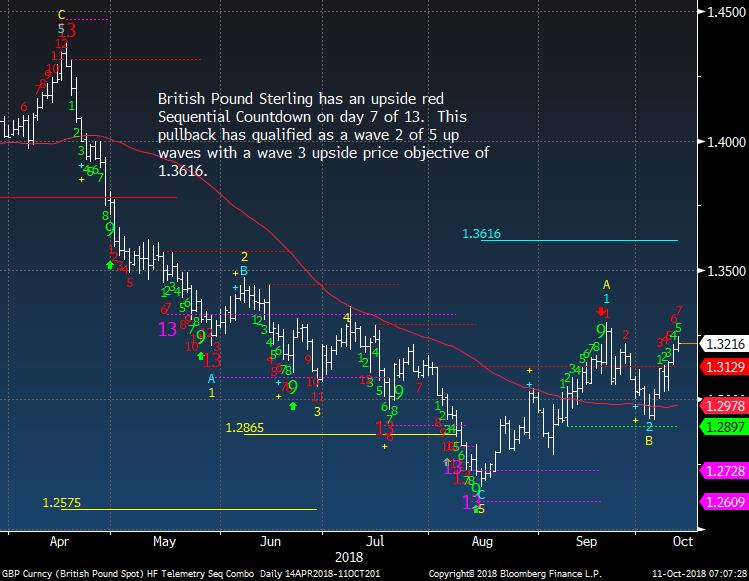
- Currency Update - UK Pound looks higher
- European Market Update - Indexes making new lows with no bottom in sight
- Global Market Update - Korea and India still look lower
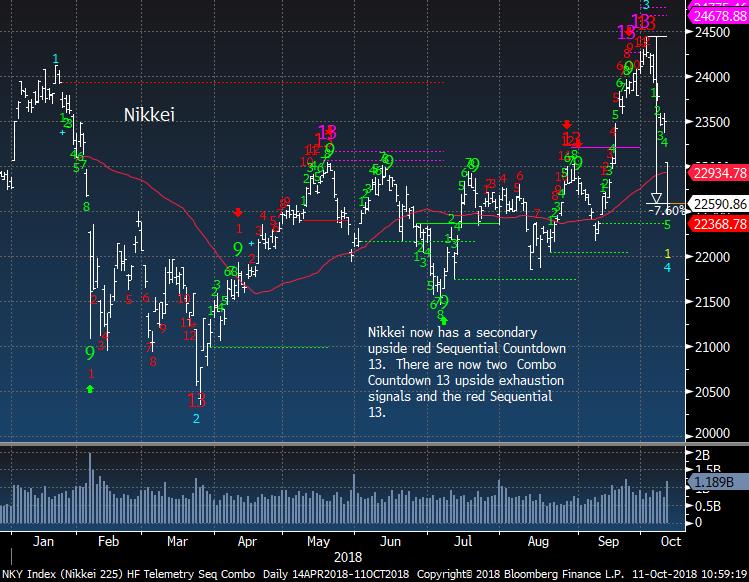
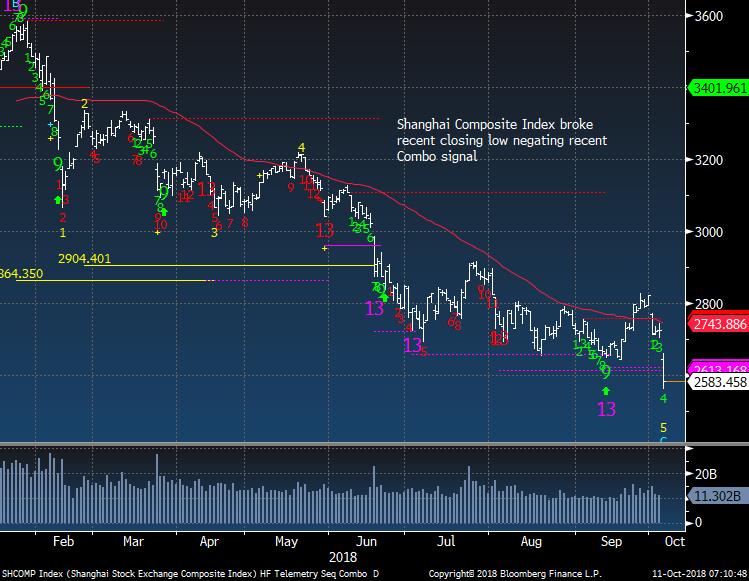
- Asian Market Update - Nikkei short now +7.5% and Shanghai breaking down again
- Crude Update - Sentiment coming down and price will follow
- Gold Update - Looking good on the long side
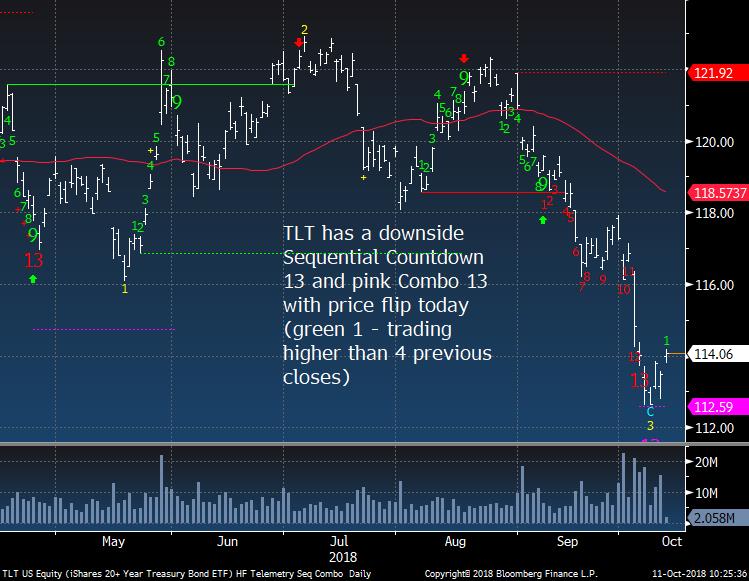
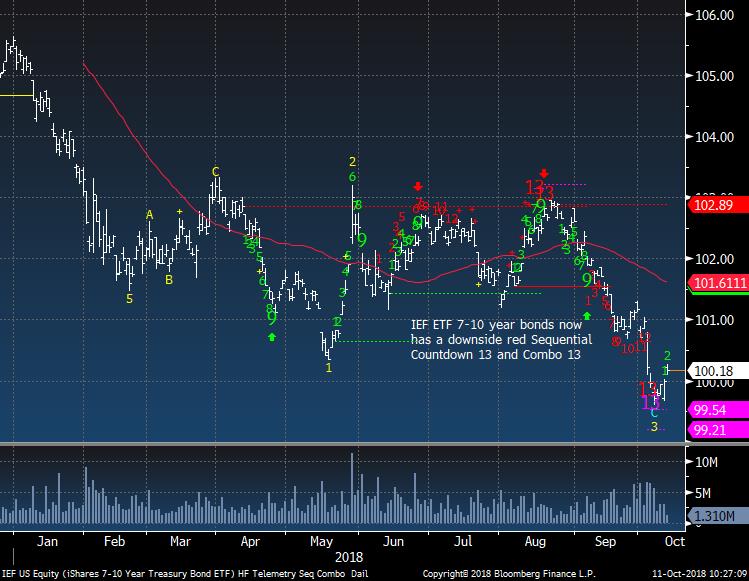
- Bond Update - A bond bounce is here
- DeMark Screens - Daily, Weekly, Monthly upside/downside exhaustion signals within the S&P 500 and Euro Stoxx 600
|
|
|
|
|
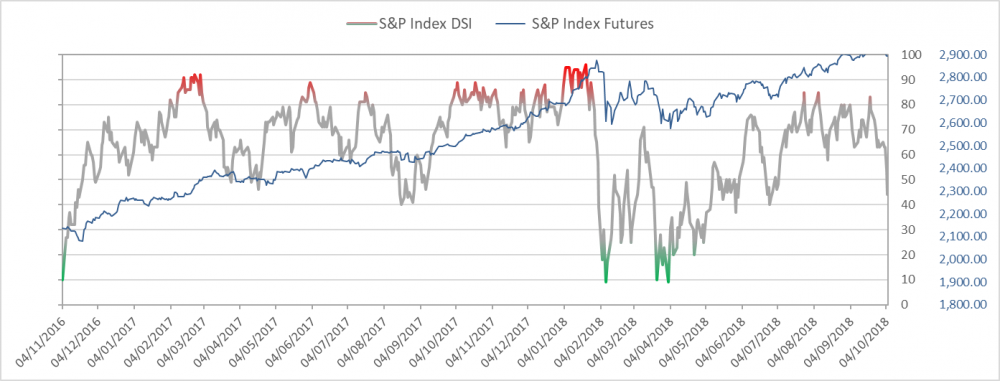
Here's a link to the Hedge Fund Telemetry market sentiment page with 40 charts of sentiment including equities, bonds, currencies, and commodities updated each day. When the new website launches we will be adding new charts and historical sentiment data for Euro Stoxx 50, UK FTSE 100, German DAX, French Cac 40. We will be adding Japanese Bonds, German Bunds, and a few more.
SPX bullish sentiment is at 28%. I can't wait to launch our new sentiment charts. These Excel based charts are horrible. Sorry new site coming soon.
|
|
|
|
|
|
|
|
|
SPX 60 minute tactical time frame
|
|
|
|
|
|
|
|
|
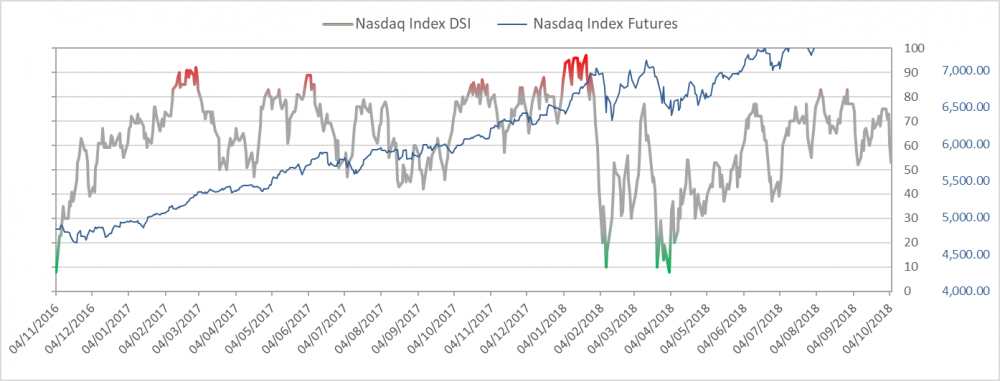
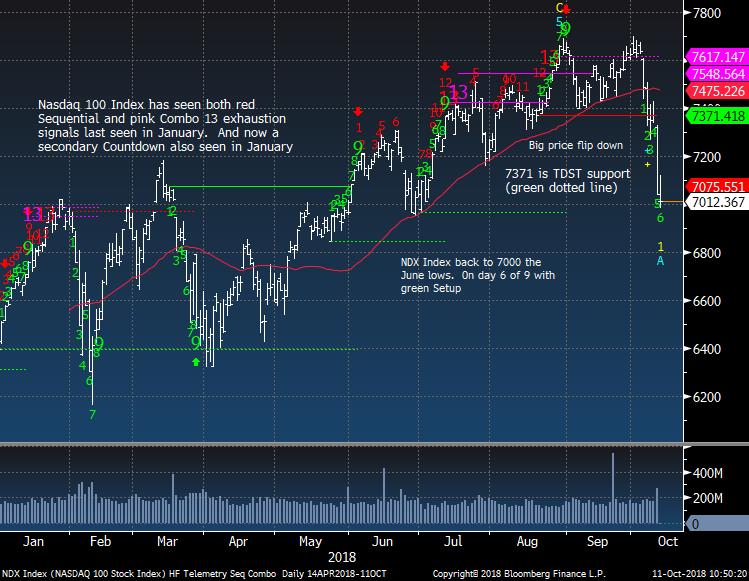
Nasdaq bullish sentiment is at 26%
|
|
|
|
|
|
|
|
|
|
|
|
|
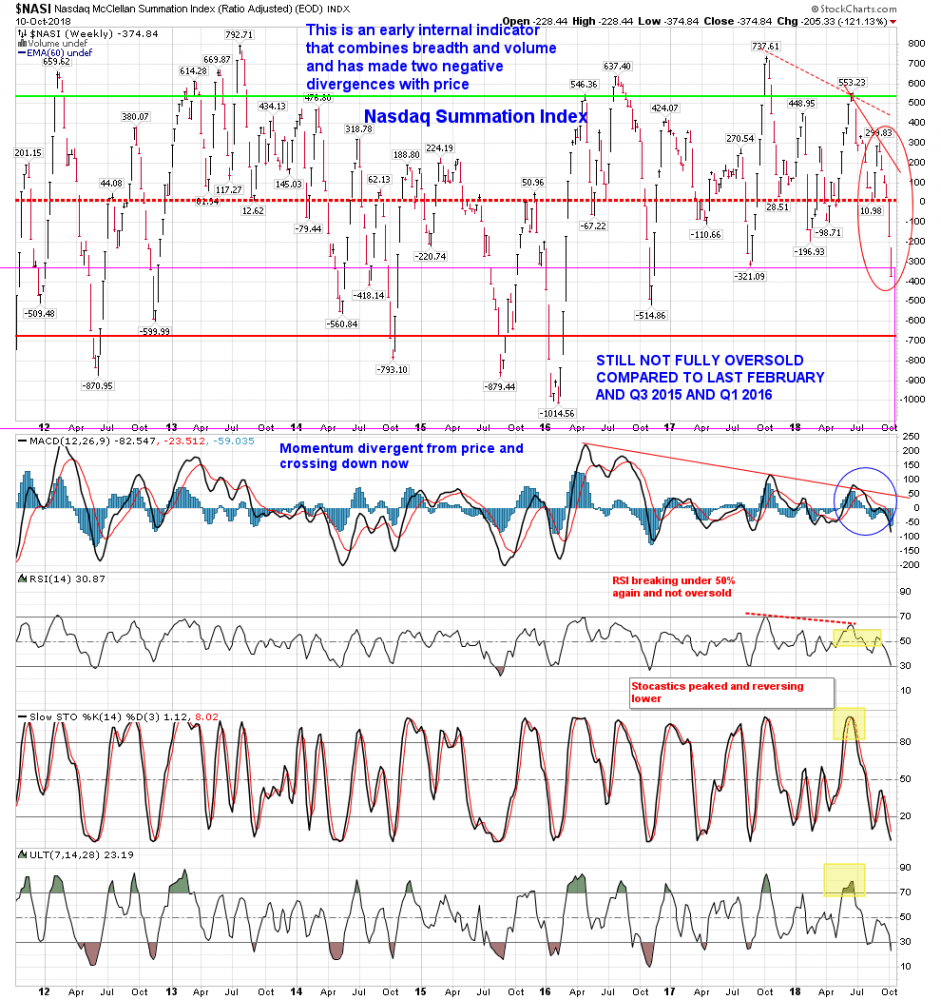
Nasdaq Summation Index NOT oversold enough
|
|
|
|
|
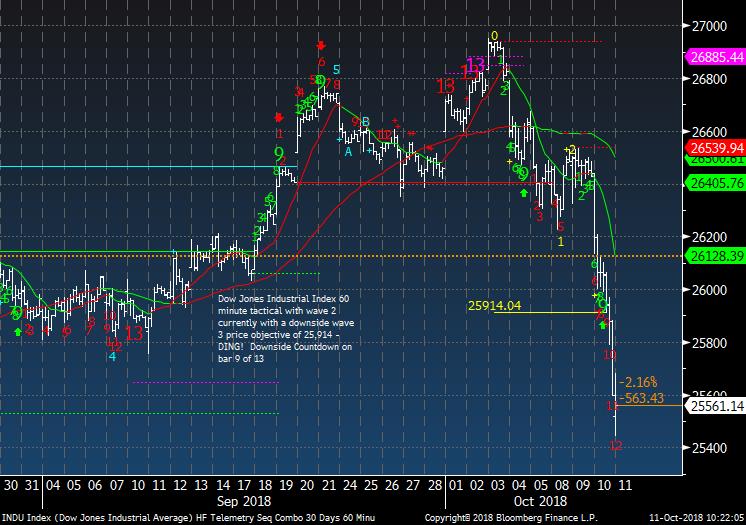
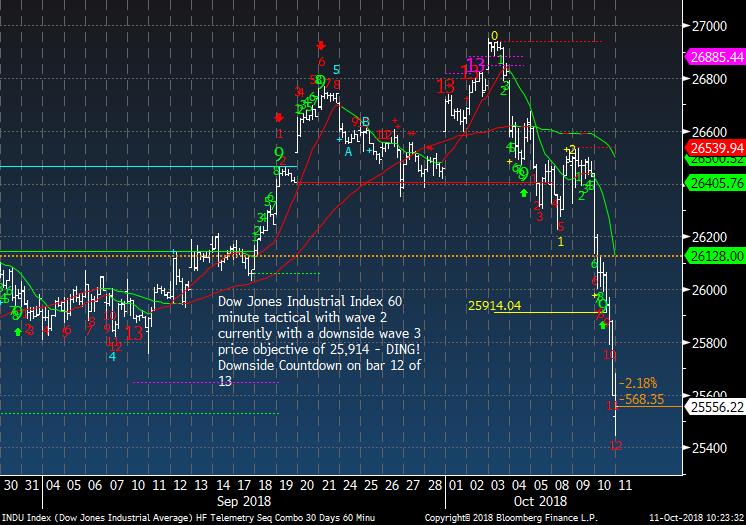
Dow Jones Industrial Average 60 minute time frame
|
|
|
|
|
|
|
Hedge Fund Telemetry Trade Ideas
|
|
|
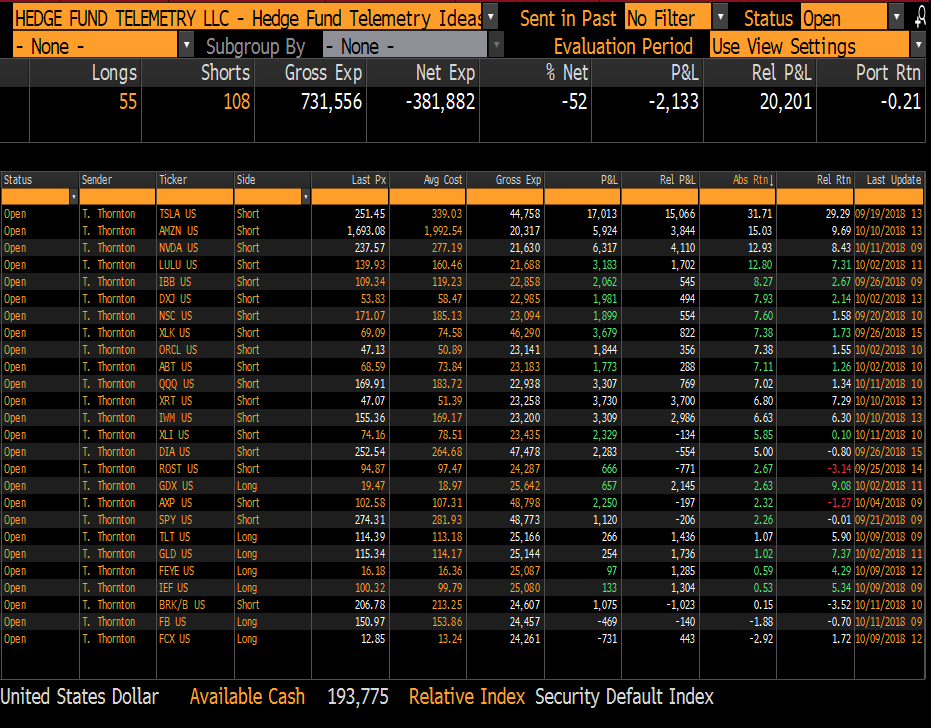
Trade Ideas Sheet - Long and short US equity ideas including ETF's. We will be overhauling the Trade Ideas Sheets for long only, short only, ETF's when the new website rolls out soon. There will also be a clearer email distribution with changes.
Trade Ideas Changes: REDUCED SIZE TO 2.5% BRK/B +2%, XLI +4.5%, QQQ +5.5%, NVDA +10%, Covered: XLF +5.75%, AMD +21%. ADDED NEW 2.5% LONG FB
Stops on everything. TSLA 320, GDX 17.35 , FEYE 16.00, NVDA 295, QQQ 190 (raised stop), XLK 79 (raised stop), SPY 295, XLY 118, AXP 114, XRT 53, IWM 172, XLV 95, BRK/B 225, DIA 275, XLI 81.50, IBB 123, AMD 30 (lowered stop), ROST 100.50, ABT 76, ORCL 53, LULU 165, AMZN 1990 (lowered stop to breakeven), DXJ 61, GLD 111, FB 148
|
|
|
|
|
|
|
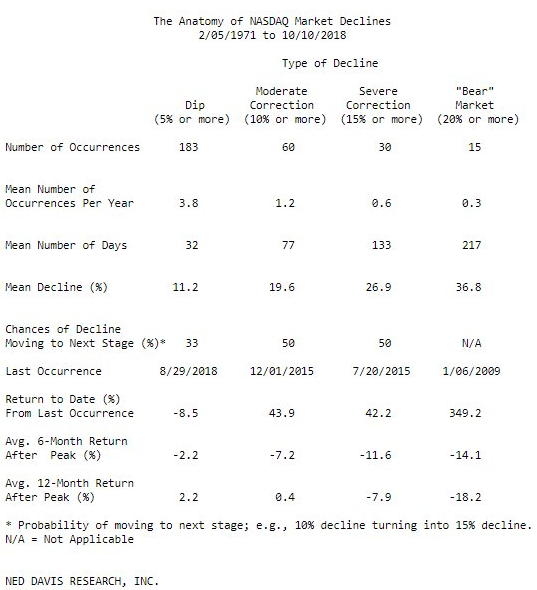
The Anatomy of NASDAQ Market Declines
|
|
|
From Ned Davis Research "Since 1971, when the Nasdaq has lost -5%, the probability of it turning into a -10% decline has been 33%. Of those that did turn into a -10% dip, 50% went on to lose 15%. And another 50% of severe corrections became full blown bear markets."
|
|
|
|
|
|
|
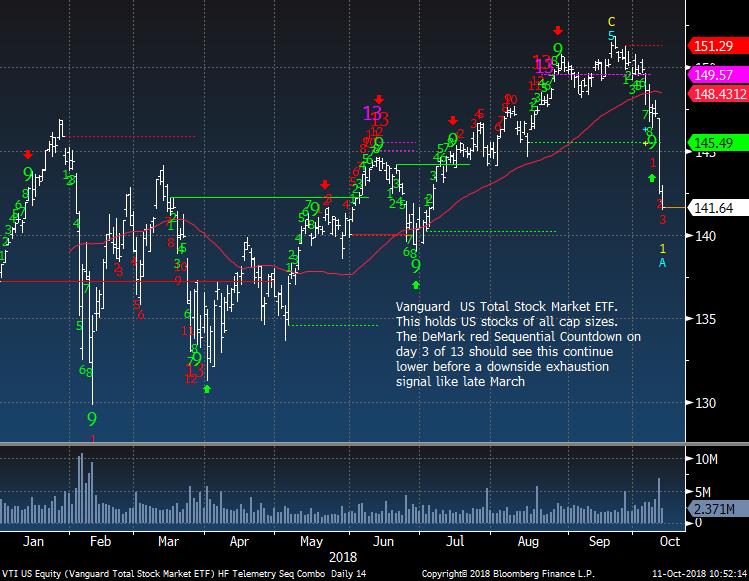
Will the US drag the world lower?
|
|
|
This is the total US market ETF now on day 3 of 13 with a downside Countdown and still well above the February lows. Keep in mind in the last week the market has lost 4 months of gains
|
|
|
|
|
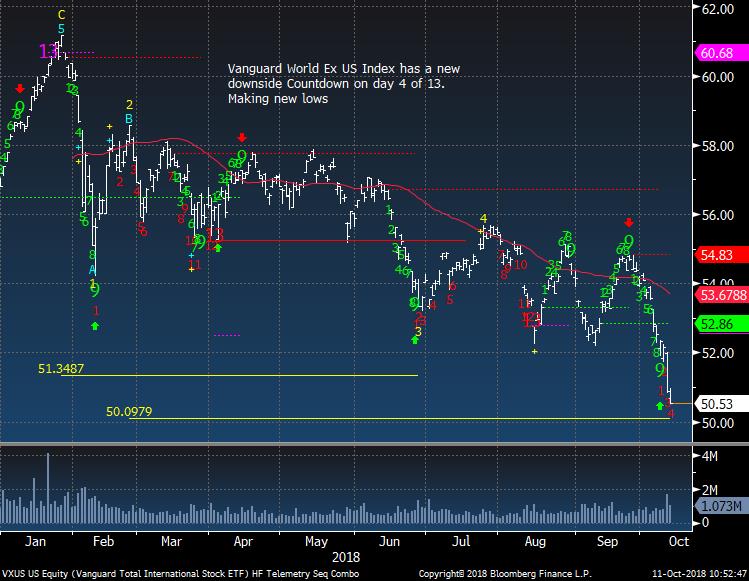
The world ex US is making new lows on day 4 of 13 with its Countdown. This is making new lows and there is no support below
|
|
|
|
|
|
|
|
|
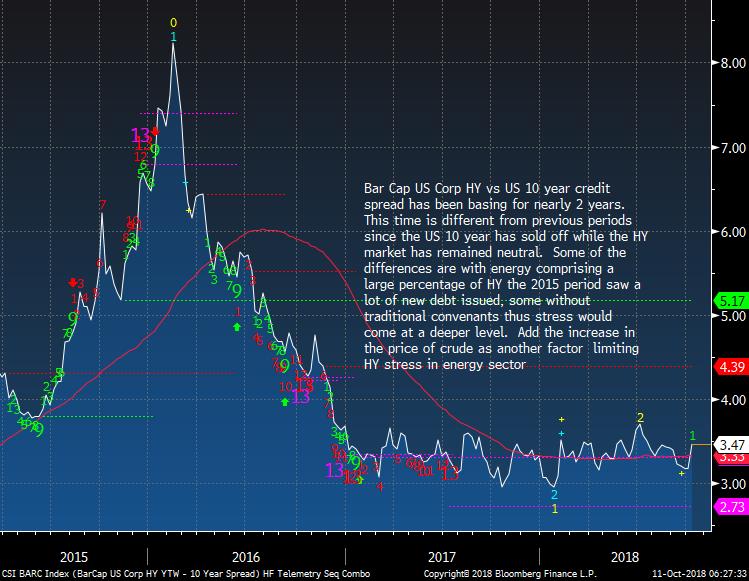
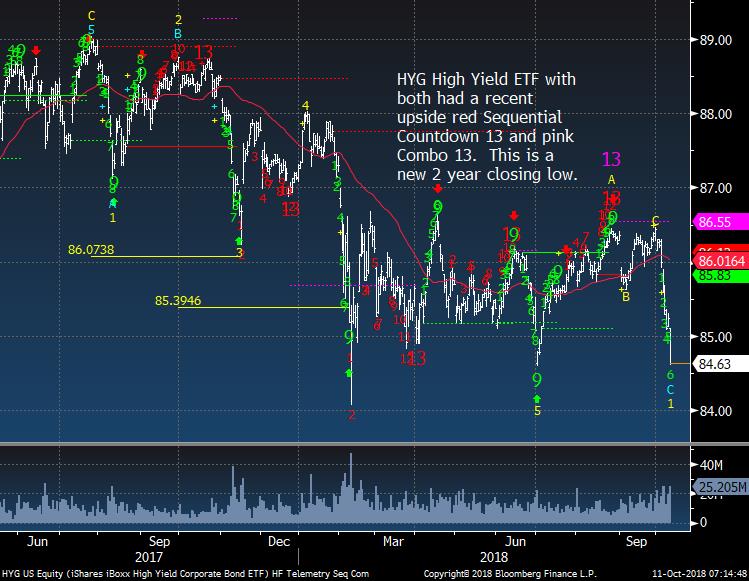
Credit spreads have been contained and I offer a few reasons why as well some concerns on how they could widen quickly. People are way too complacent in my view since US Treasuries and High Yield have both been hit hard and that is very different from other periods when US Treasuries rallied into a risk off period.
|
|
|
|
|
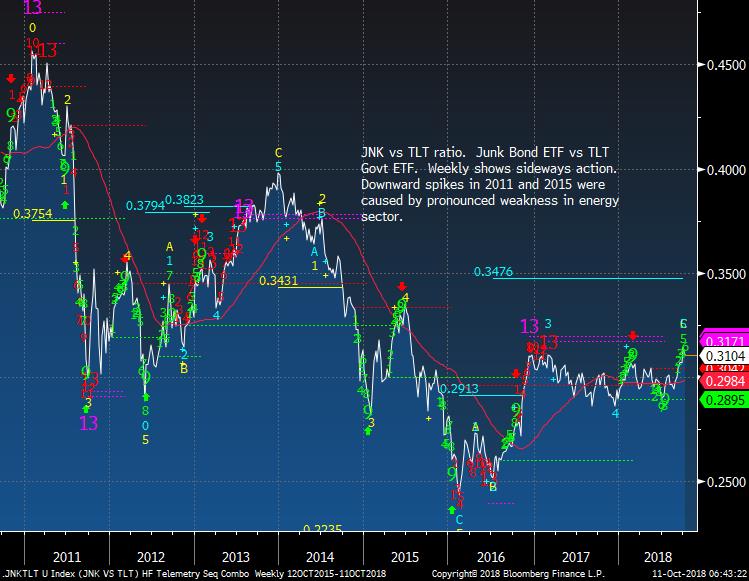
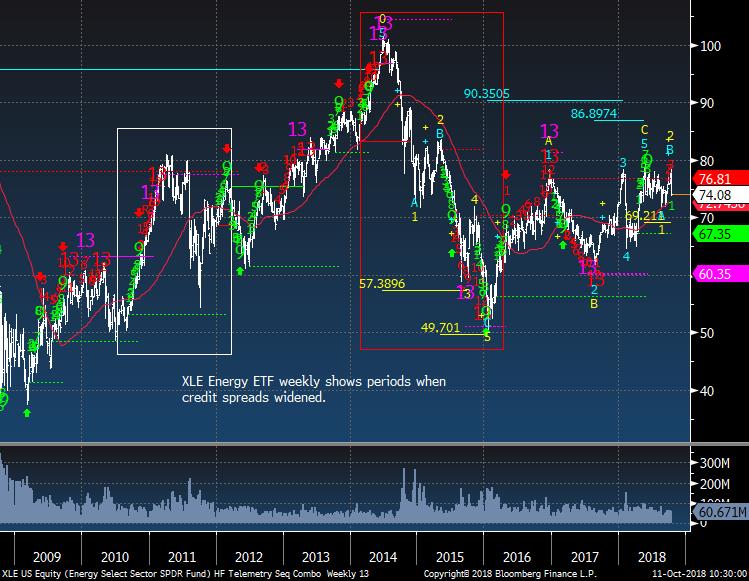
This is the JNK vs TLT ratio which isn't a great comparison. BUT... look at the widening (lower) in 2011 and 2014-2015 periods. These periods saw big pullbacks in the energy sector and the energy sector is 10% of the JNK
|
|
|
|
|
|
|
|
|
Energy XLE ETF with periods where spreads blew out. Both of these periods had huge losses in the market.
|
|
|
|
|
|
|
|
|
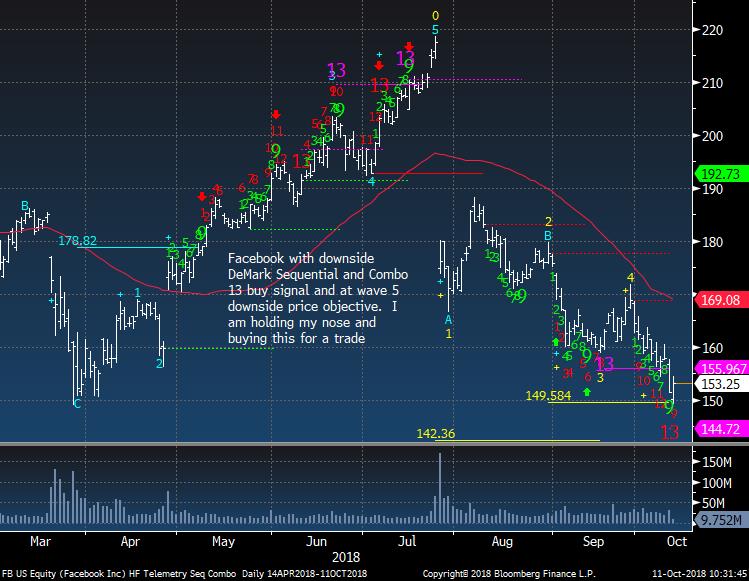
I hate FB and I'm buying a small sized long with the downside 13 and 9 today. My stop is tight at 148 and if stopped we'll move on.
|
|
|
|
|
|
|
Some Ratios I'm looking At Today
|
|
|
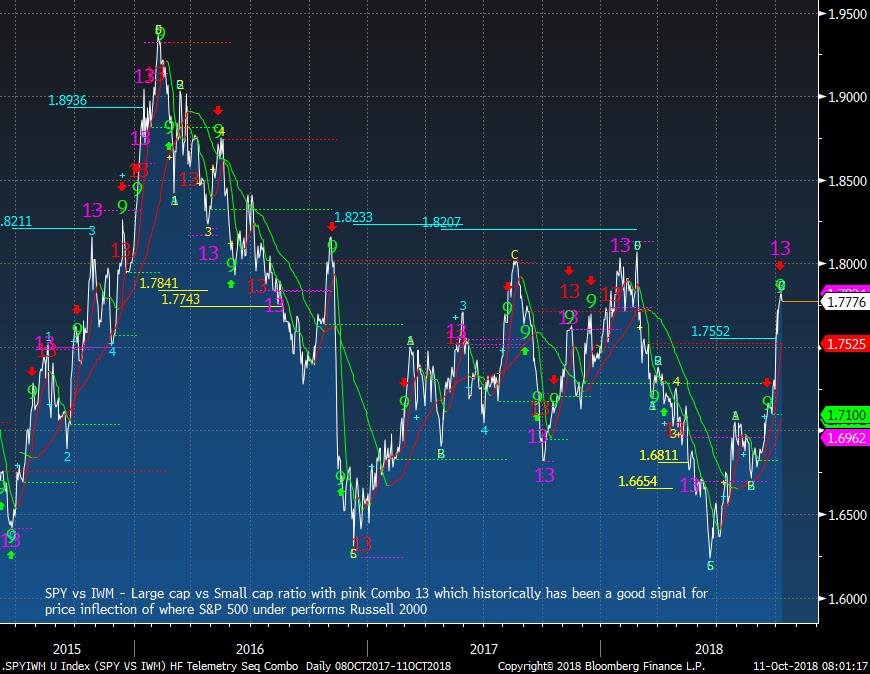
SPY vs IWM ratio has seen pronounced outperformance by large cap and that could be ending
|
|
|
|
|
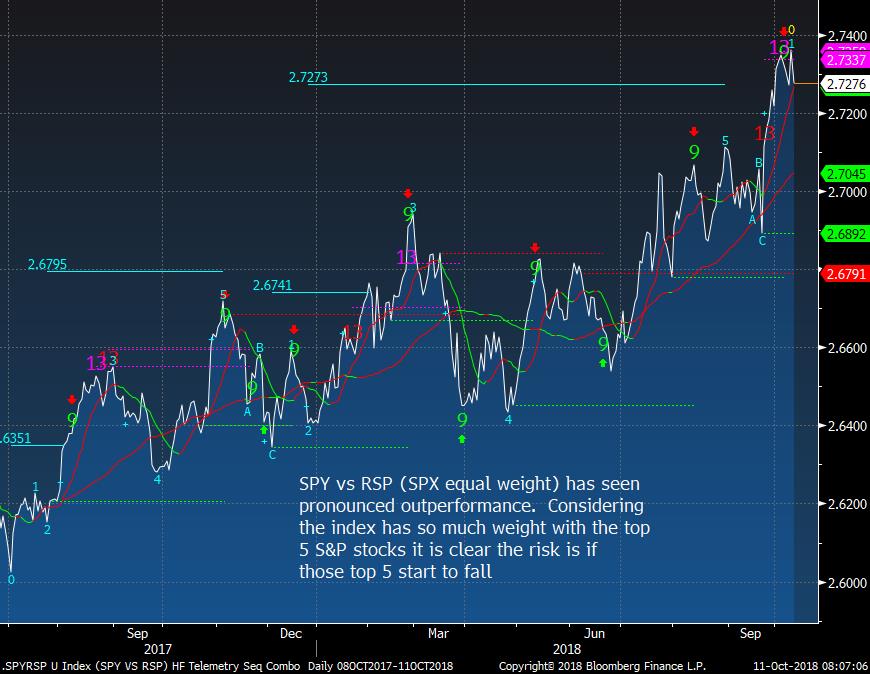
SPY vs RSP (equal weight) also has seen strong outperformance which could be ending
|
|
|
|
|
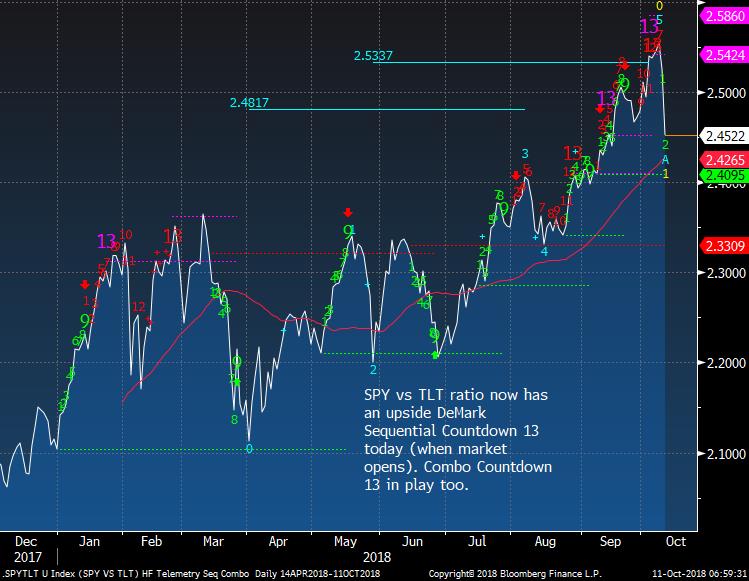
SPY vs TLT with a big reversal and other periods with this signal saw weak equities vs bonds
|
|
|
|
|
|
|
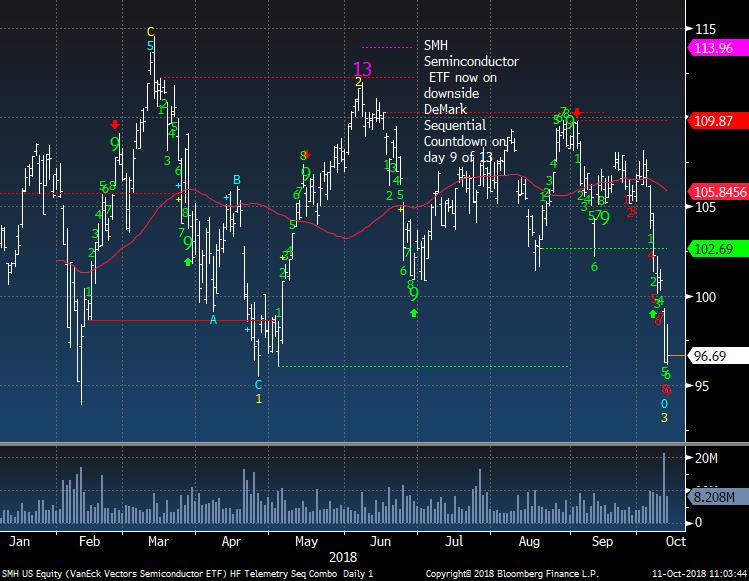
US Sector Focus - Semiconductors
|
|
|
|
|
|
|
|
|
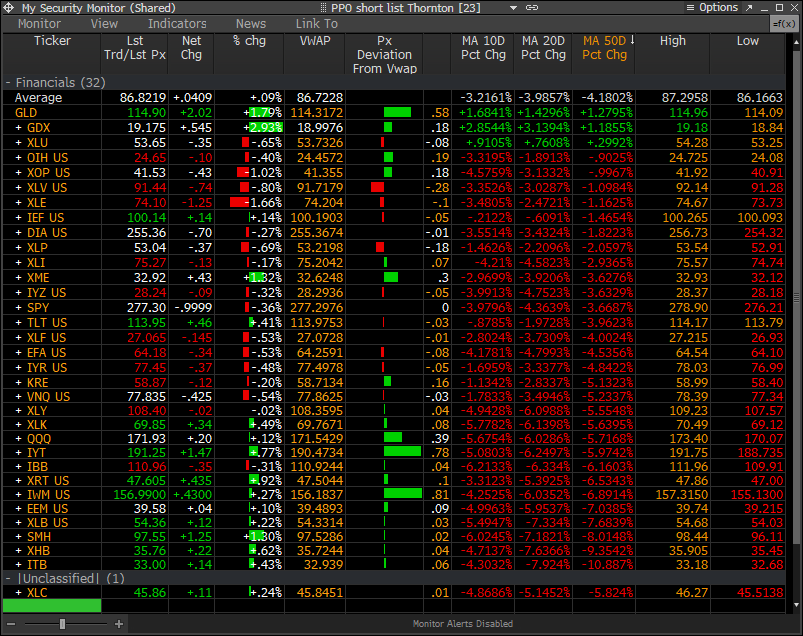
PPO Monitor - Percentage Price Oscillator
|
|
|
The PPO Monitor is a proprietary monitor developed to force rank Indexes, Sectors, and Stocks. It ranks top down by strongest to weakest by percentage above/below the 50 day moving average. Shorter term signals can be seen when the 10 and 20 day moving averages turn up (green) or down (red) which often are followed by the 50 day moving average. This is useful to watch for historically overbought/oversold percentage above/below the 50 day moving average. It is
non correlated with the DeMark Indicators however we have found upside/downside exhaustion signals often occur when something rises to the top or drifts to the bottom of the monitor - increasing the timing aspect. We share this monitor with clients with Bloomberg Terminals. An added feature is that each market/ETF can be expanded with each component force ranked in the same way. A couple other features include price deviation from intraday VWAP (useful for intraday reversals) and new 20 day highs/lows on right side. Please inquire if you would like to be permissioned to use the PPO Monitor.
Today's highlights: As designed the sector rotation into risk off has appeared once again with Gold and Gold Miners at the top. Utilities are up there too. Energy which was at the top is weakening as expected.
|
|
|
|
|
|
|
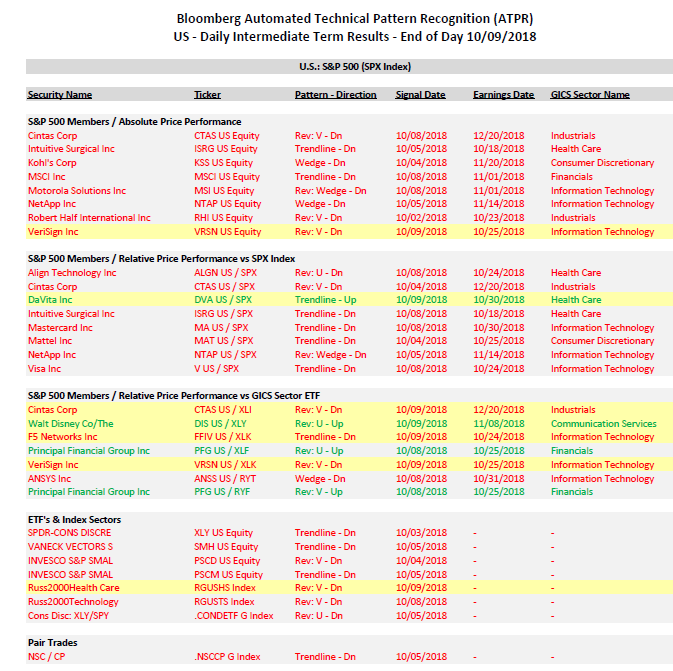
Bloomberg Automated Technical Pattern Recognition Screens
|
|
|
S&P 500 Members/Absolute Price Performance and Relative Price Performance vs S&P 500 and Sector ETF's. ETF's vs Index Sectors. Pair Trades. Long side is first symbol, short side is second symbol.
|
|
|
|
|
|
|
|
|
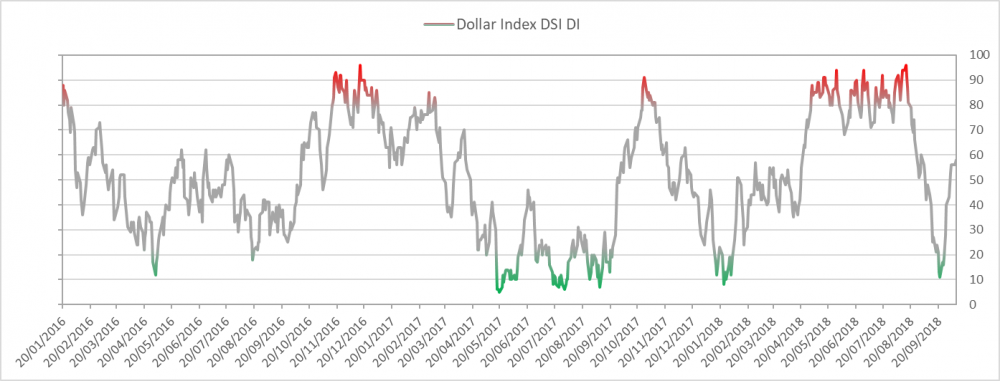
US Dollar bullish sentiment remains at 58%
|
|
|
|
|
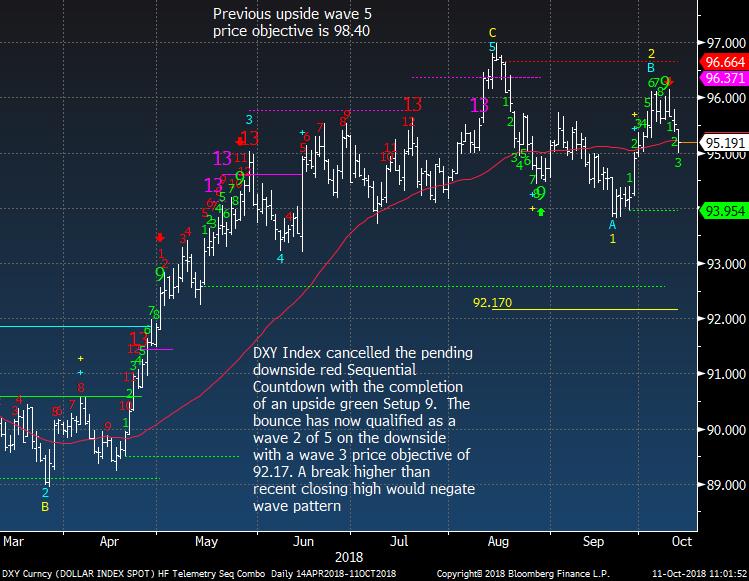
US Dollar Index still range bound
|
|
|
|
|
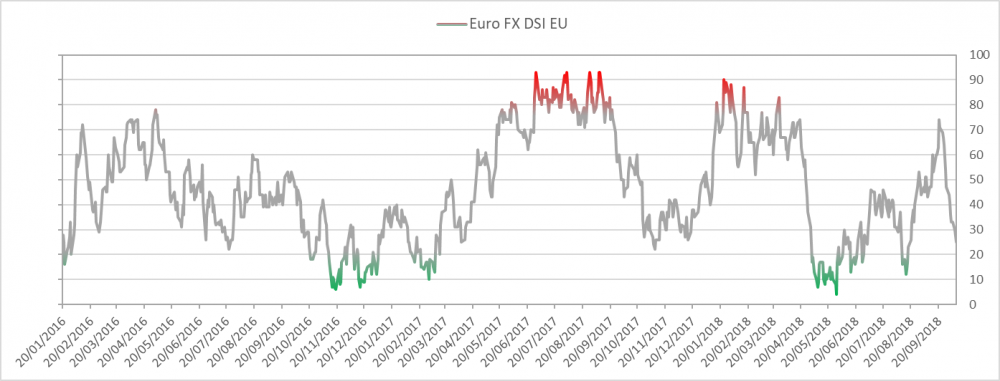
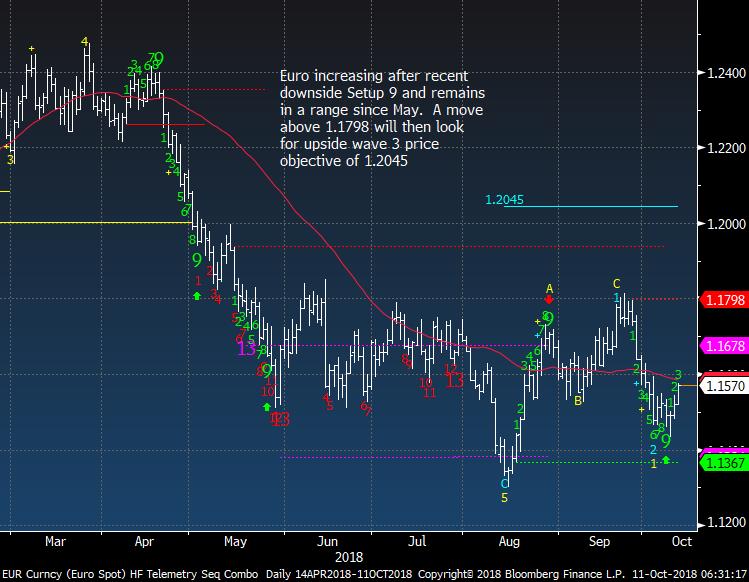
Euro bullish sentiment is at
|
|
|
|
|
|
|
|
|
British Pound should work higher
|
|
|
|
|
|
|
|
|
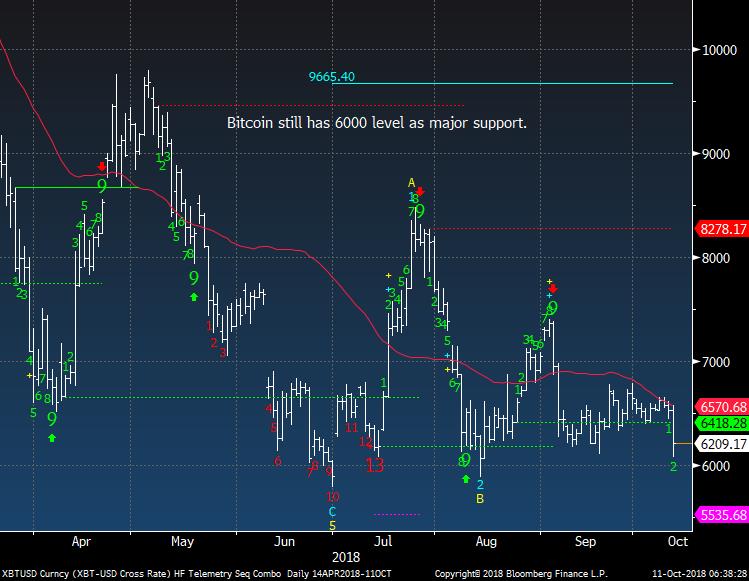
Bitcoin with some risk off action. 6000 is still the line in the sand
|
|
|
|
|
|
|
|
|
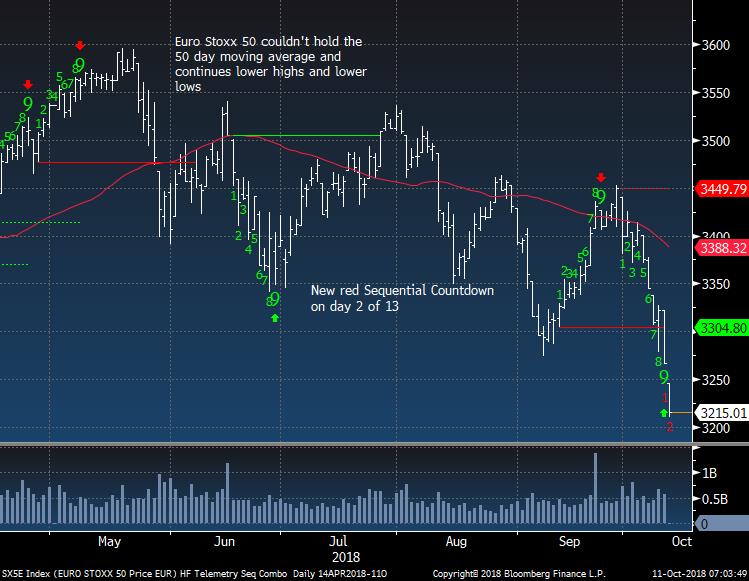
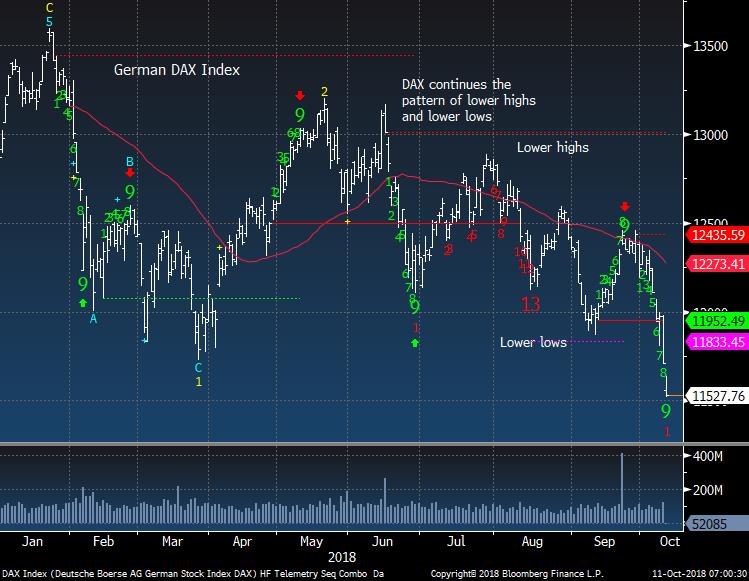
Euro Stoxx 50 is going lower
|
|
|
|
|
|
|
|
|
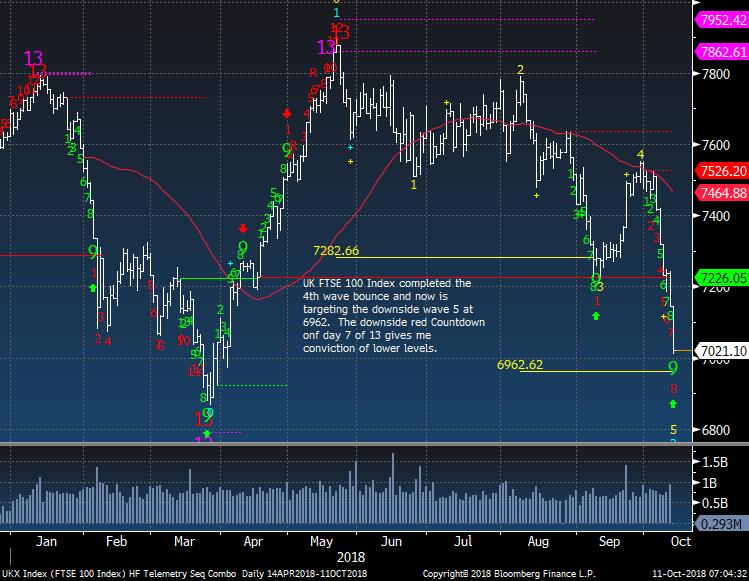
UK FTSE 100 nearing downside wave 5 price objective
|
|
|
|
|
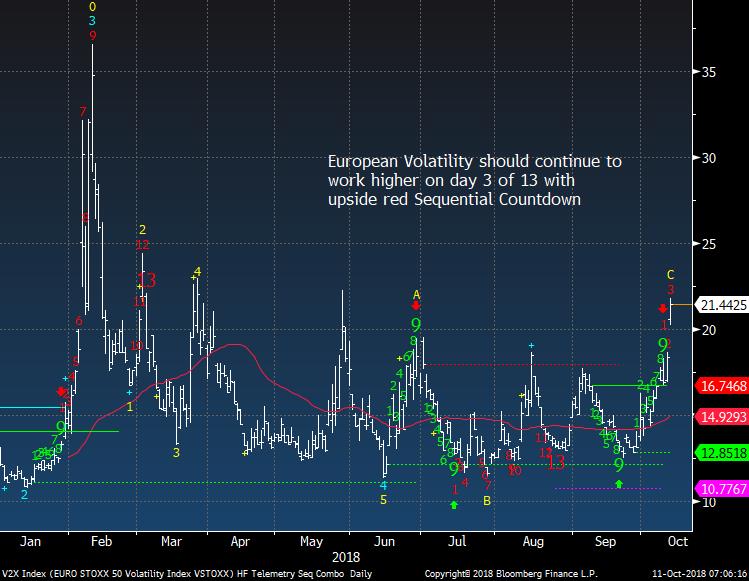
European Volatility looks higher
|
|
|
|
|
|
|
|
|
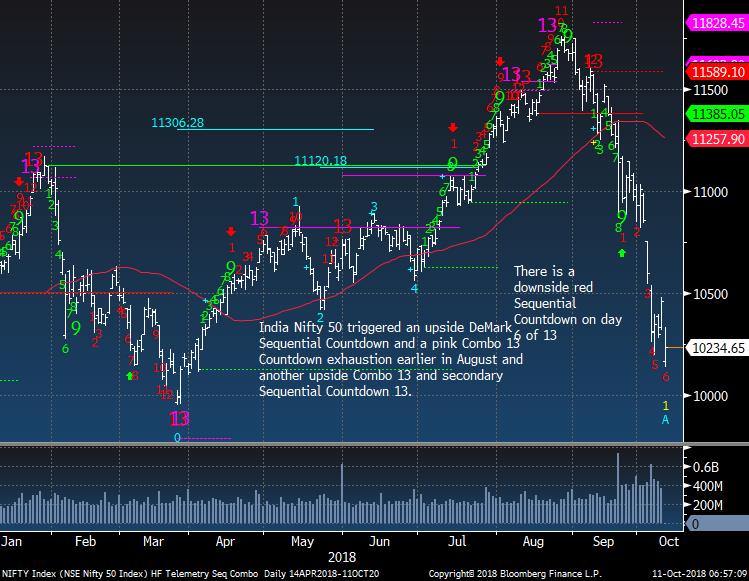
India Nifty 50 still should work lower
|
|
|
|
|
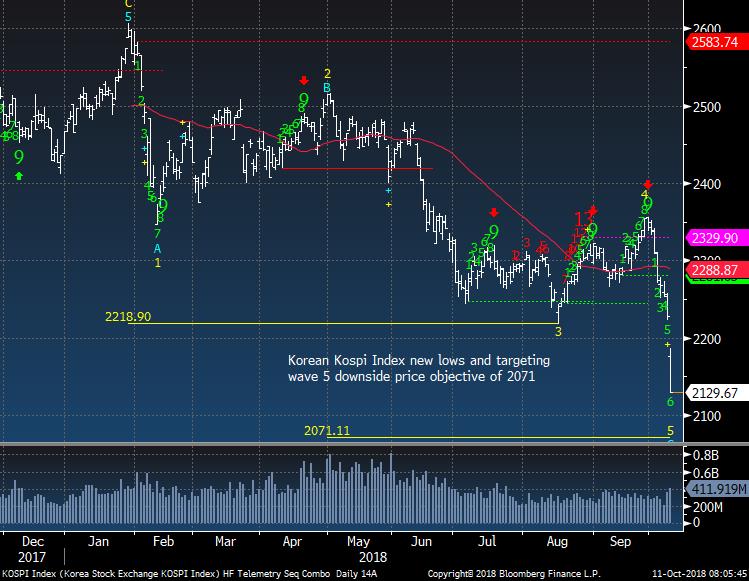
Korean Kospi is now in wave 5 down
|
|
|
|
|
|
|
|
|
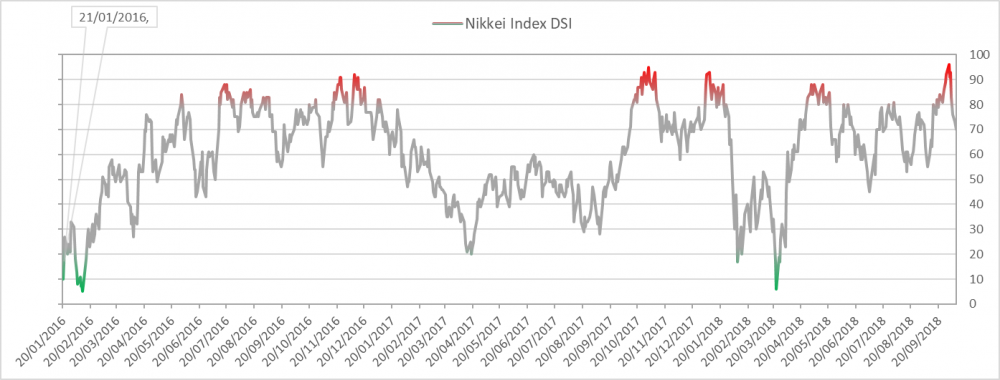
Nikkei bullish sentiment is at 57% down from a recent bell ringer 96%
|
|
|
|
|
Nikkei has been very good with the DeMark Indicators
|
|
|
|
|
Shanghai breaking down again
|
|
|
|
|
|
|
|
|
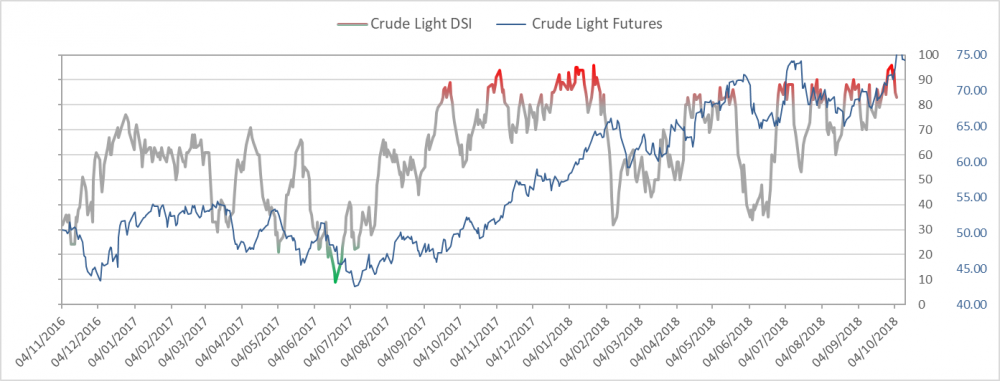
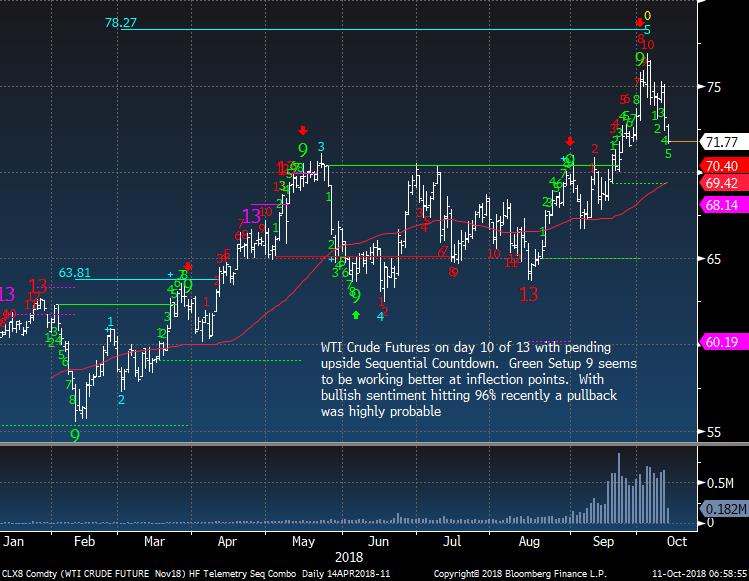
Crude bullish sentiment is at 77% down from a recent high of 96%
|
|
|
|
|
WTI Crude Futures should work lower
|
|
|
|
|
|
|
|
|
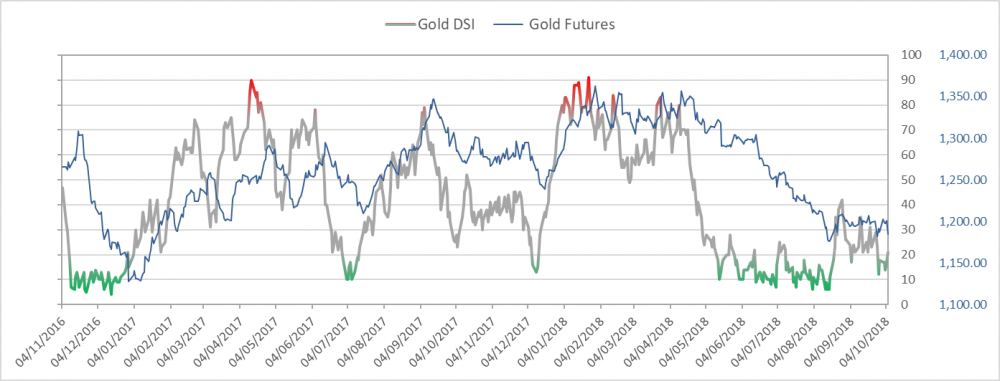
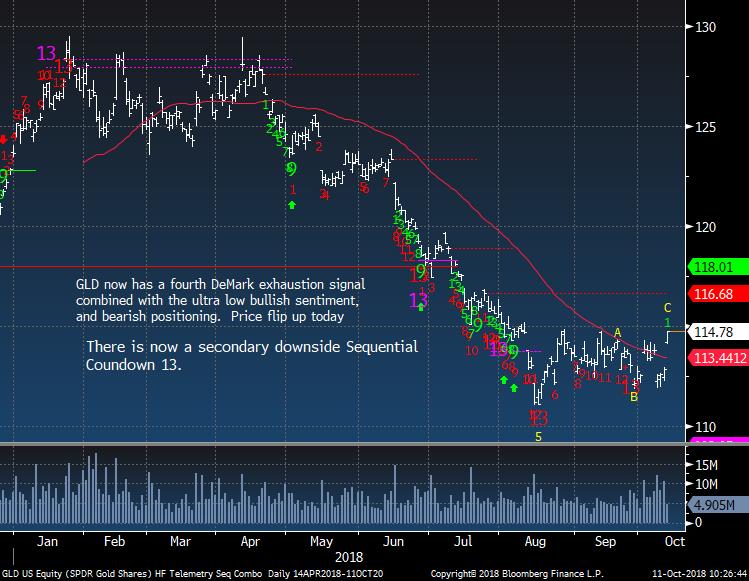
Gold bullish sentiment is at 24%
|
|
|
|
|
Gold is acting great today
|
|
|
|
|
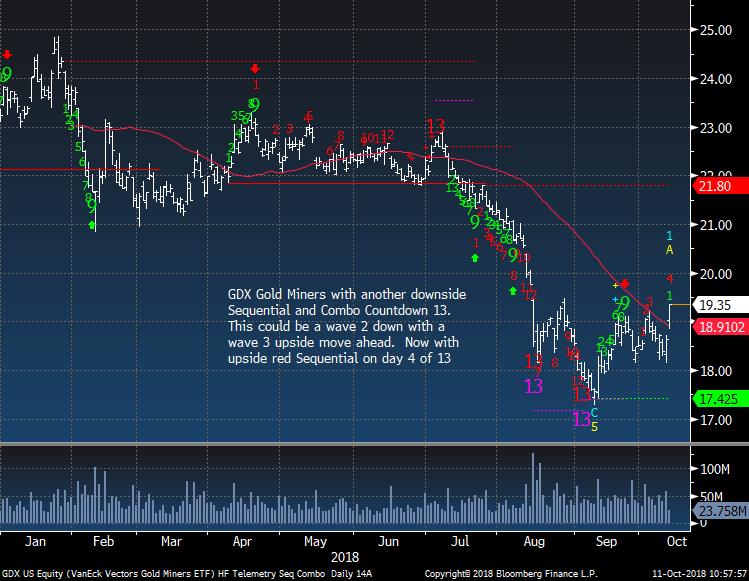
Gold Miners still can be bought
|
|
|
|
|
|
|
|
|
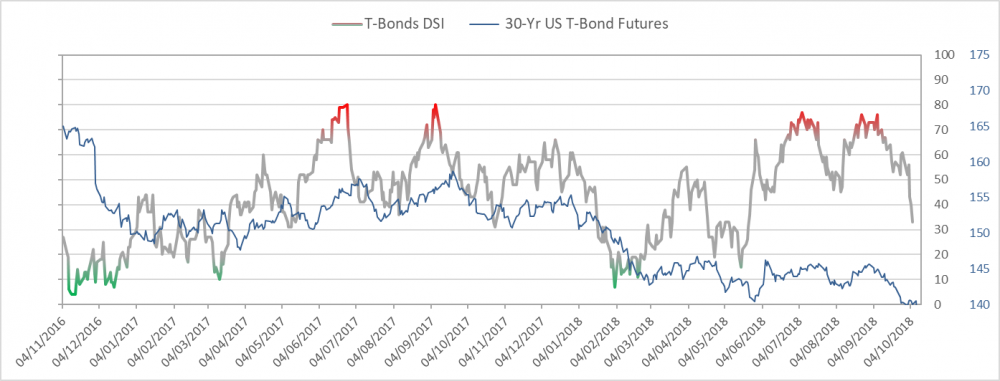
Bond bullish sentiment is at 38%
|
|
|
|
|
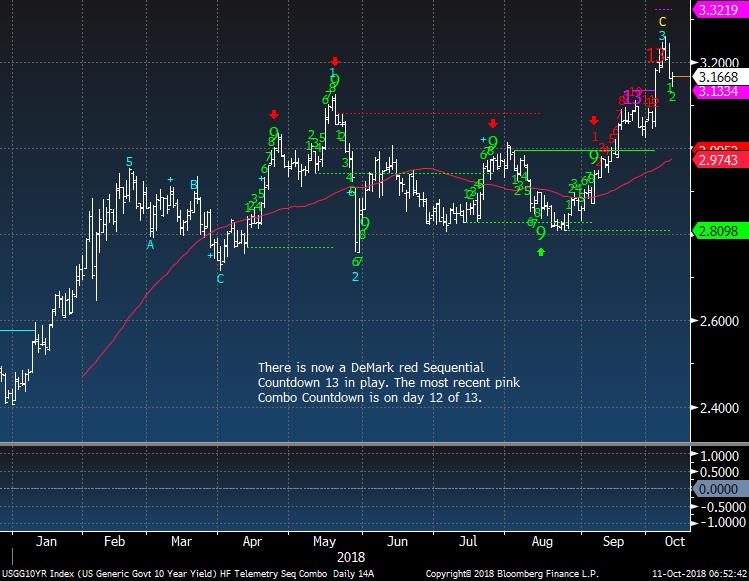
US 10 Year Yield should work lower
|
|
|
|
|
|
|
|
|
|
|
|
|
|
|
DEMARK SCREENS - Daily, Weekly, Monthly Upside/Downside Exhaustion Signals
|
|
|
Daily/Weekly DeMark upside/downside exhaustion signals (Sequential) updated daily, Weekly signals on Monday's and monthly on the first day of the new month. Price flips occur when a stock closes higher/lower than four previous closes and increases conviction of a price turn.
The upside 13's are sell signals and downside 13's are buy signals. Price flip's are confirmation signals that increases potential for a price trend change. For example, if you are long a stock and there is an upside 13, you will want to take cautious action by selling down or out of a position. If initiating a short sale with the upside 13's, we tend to start with a 1/2 size and add with the downside price flip. The opposite is true for when there are downside 13's. Take a 1/2 size position
and add with the upside price flip. The DeMark Indicators are designed to assist the user with buying into weakness and selling into strength to anticipate trend exhaustion. Selling into a rally and buying into a decline often afford the opportunity to exit a trade without too serious a loss if wrong.
S&P 500 Universe:
DAILY UPSIDE 13: COP, YUM
DAILY DOWNSIDE 13: CDNS, FB, MHK, PS, WFC
DAILY UPSIDE WITH PRICE FLIP REVERSAL DOWN: BLL, COP, ESRX, PFE, YUM
DAILY DOWNSIDE WITH PRICE FLIP REVERSAL UP: COTY
Updated: 10/8/18
WEEKLY UPSIDE 13: ABC, AES, DISCA, DISCK, EW
WEEKLY DOWNSIDE 13: GM, MAC MHK
Updated:
10/1/18
MONTHLY UPSIDE 13: ADSK, ALL, CCI, CME, DE, DLR, DTE, ETN, GLW, HPQ, INTU, PH, TPR, TXT, UPS, XLNX
MONTHLY DOWNSIDE 13: NONE
Euro Stoxx 600 Universe:
DAILY UPSIDE 13: NONE
DAILY DOWNSIDE 13: AMS SW, ENGI FP, EOAN GR, PFG LN, SPD LN, ZAL GR
DAILY UPSIDE WITH PRICE FLIP REVERSAL DOWN: NONE
DAILY DOWNSIDE WITH PRICE FLIP REVERSAL UP: BLND, DC/ LN, LAND LN, LI FP, LLOY LN
Updated: 10/8/18
WEEKLY UPSIDE 13: NONE
WEEKLY DOWNSIDE 13:
AMS SW, GPOR LN
Updated: 10/1/18
MONTHLY UPSIDE 13: BNZL LN, EXPN LN, FPE3 GR, SBMO NA, SECUB SS, SWEDA SS
MONTHLY DOWNSIDE 13: BAYN GR, HMB SS, TEF SM
|
|
|
Unsubscribe me from Hedge Fund Telemetry
Hedge Fund Telemetry LLC, P.O. Box 4675, Greenwich, CT 06861, United States
CONFIDENTIALITY NOTE and DISCLAIMER: This message is for the named person's use only. It may contain confidential, proprietary or legally privileged material. No confidentiality or privilege is waived by any accidental or unintentional transmission. If you receive this message in error, please immediately delete it and all copies of it from your system, destroy any hard copies and notify the sender. You must not, directly or indirectly, use, disclose,
distribute, print or copy any part of this message if you are not the intended recipient. Hedge Fund Telemetry LLC. cannot guarantee the confidentiality of the material transmitted; therefore, information of a sensitive or confidential nature should not be transmitted. There is risk in trading markets. Hedge Fund Telemetry LLC reports are based on information gathered from various sources and believed to be reliable, but are not guaranteed as to accuracy and completeness. The information is subject to change without notice and Hedge Fund Telemetry LLC has no obligation to provide any updates or changes. Hedge Fund Telemetry LLC is providing this data for informational and educational purposes and does not believe that it is sufficient to base an investment decision on. This information should not be regarded as a solicitation or recommendation of any particular security or to engage in any trading strategy. One should always check with your licensed financial
advisor to determine suitability of any investments.
|
|
|
|
|