|
|
|
|
|
|
Daily Note Live - Follow Up
|
|
|
Thanks to all the attended today's Hedge Fund Telemetry Daily Note Live Webinar. I covered a lot of markets from global equities, bonds, currencies, commodities as well some sectors and stocks. One of these days I'll figure out how to run the webinar software so skip a few minutes into it, while I figured out how to put on the sound. Did I mention I hate technology? Here is the link for the replay.
A bounce is likely ahead into wave 4 with the shorter term tactical 60 minute charts while the first wave on the daily charts should bounce with a lower high bounce. A few option trades I've mentioned from early September I'm still holding: VIX Oct 15/20 call spread (potential for 3x looking good) QQQ Oct 180/165 put spreads (potential for 10x still a way to go) SPY Oct 285-270 put spreads (7x potential) This is
a risky market now and I hope everyone trades carefully. This is a brief note and I'll have a full note out tomorrow. Again, thanks for all of your support.
- US Markets - Sentment is not oversold and market starting new 5 waves down.
- Hedge Fund Telemetry Trade Ideas - Took profits on half AMZN, IWM, XRT - could re add on a bounce
- VIX Index Update
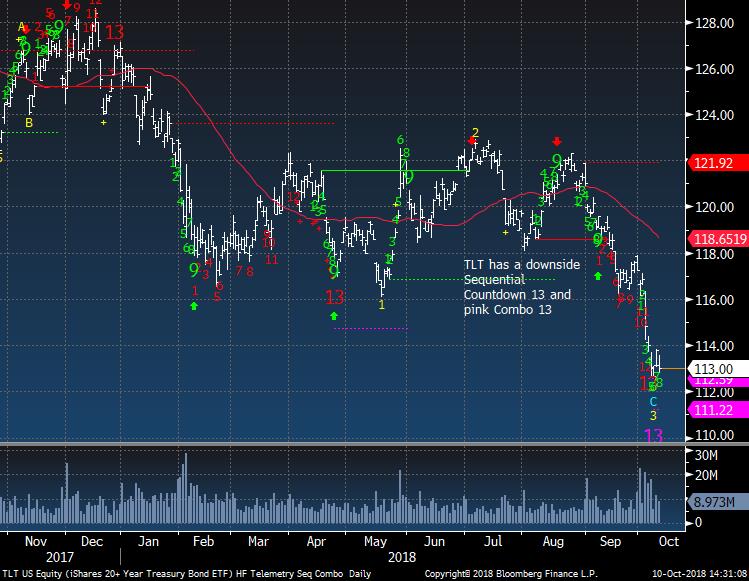
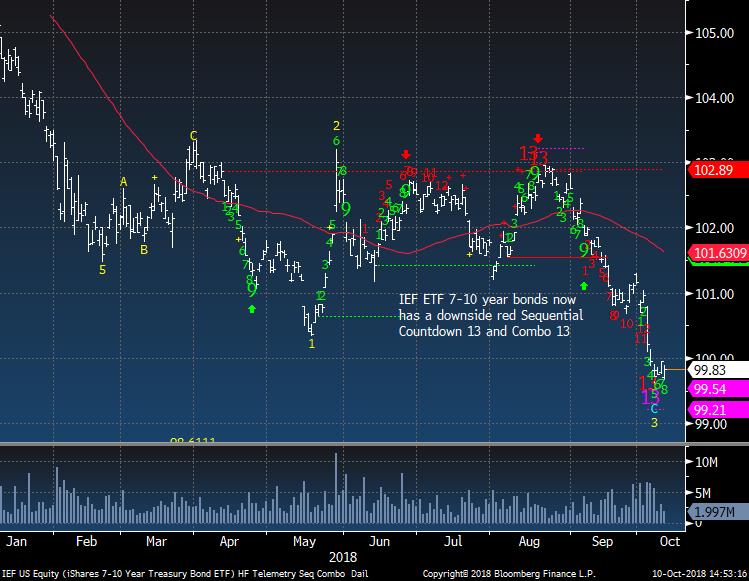
- Bond ETF's
- PPO Monitor - Percentage Price Oscillator Force Ranked Sector Rotation
- Bloomberg Technical Pattern Recognition Screen
- DeMark Screens - Daily, Weekly, Monthly upside/downside exhaustion signals within the S&P 500 and Euro Stoxx 600 VERY FEW SIGNALS MEANS MARKET UNDER PRESSURE. TOMORROW COULD SEE SOME DOWNSIDE SIGNALS START TO TRIGGER
|
|
|
|
|
Here's a link to the Hedge Fund Telemetry market sentiment page with 40 charts of sentiment including equities, bonds, currencies, and commodities updated each day. When the new website launches we will be adding new charts and historical sentiment data for Euro Stoxx 50, UK FTSE 100, German DAX, French Cac 40. We will be adding Japanese Bonds, German Bunds, and a few more.
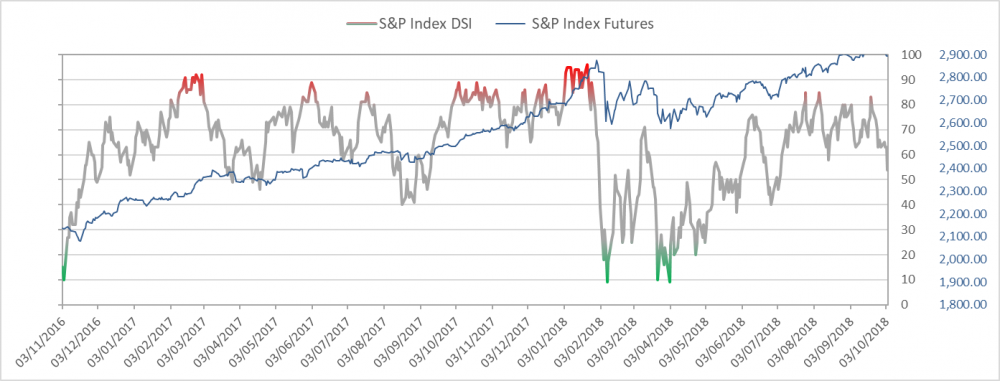
SPX bullish sentiment is at 44% and expect a deep drop today later.
|
|
|
|
|
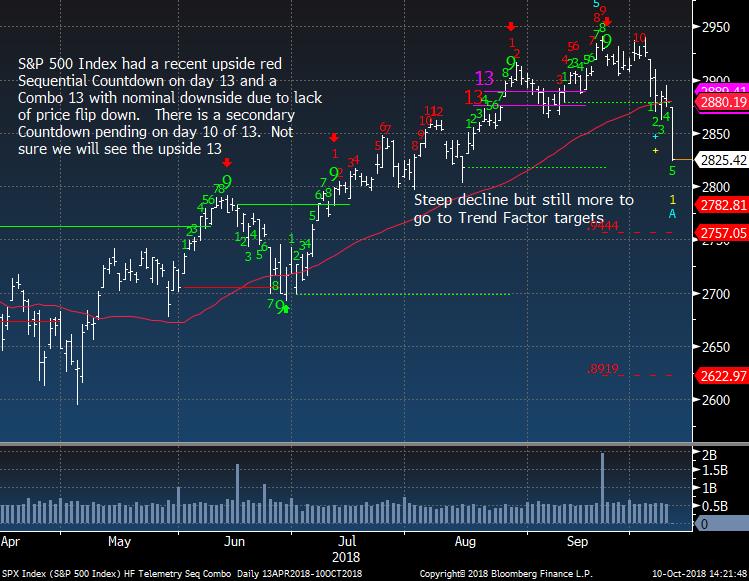
SPX daily really steep drops tend to continue.
|
|
|
|
|
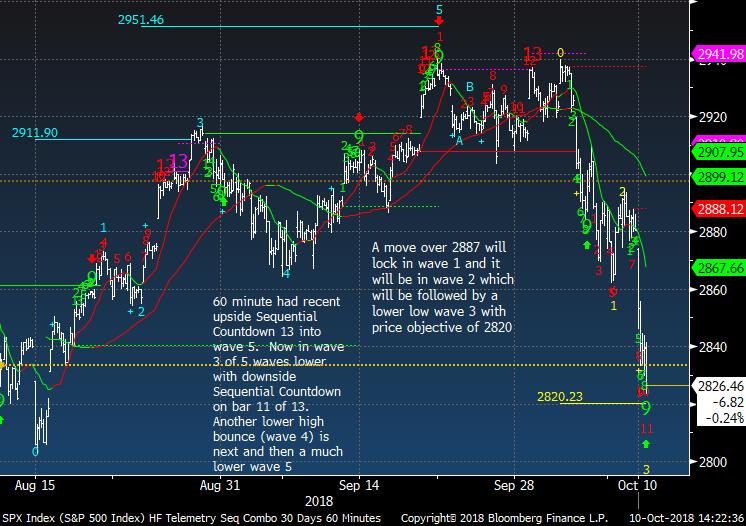
SPX 60 minute tactical time frame should see a bounce very soon but this is not the low to buy for anything other than a trade
|
|
|
|
|
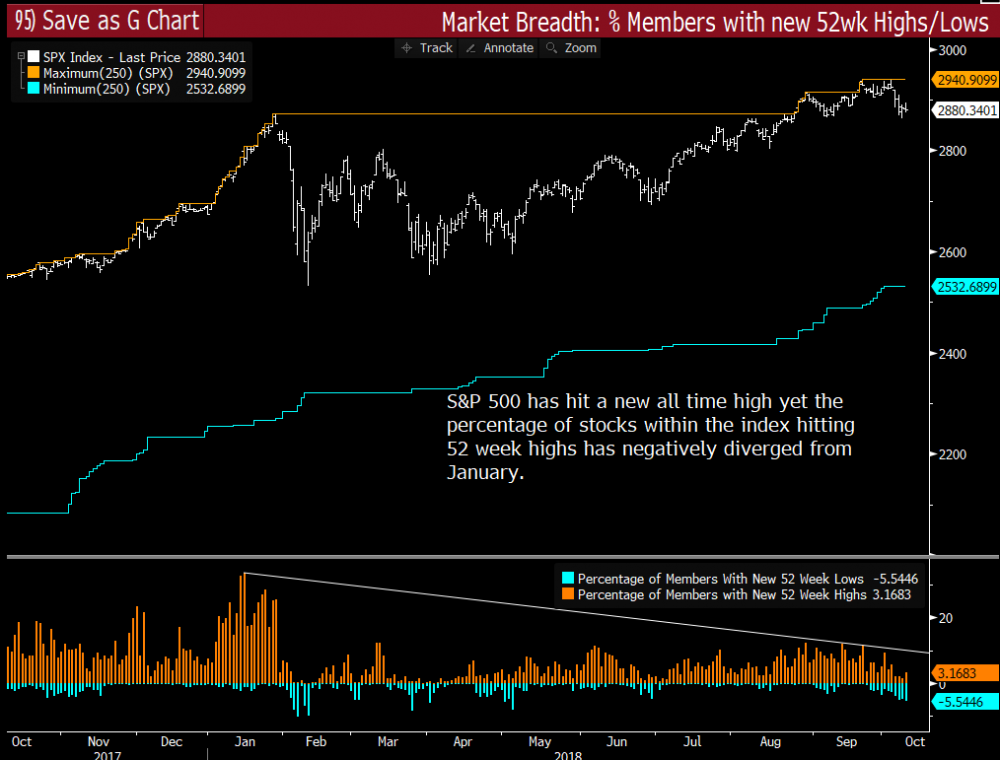
This divergence really mattered
|
|
|
|
|
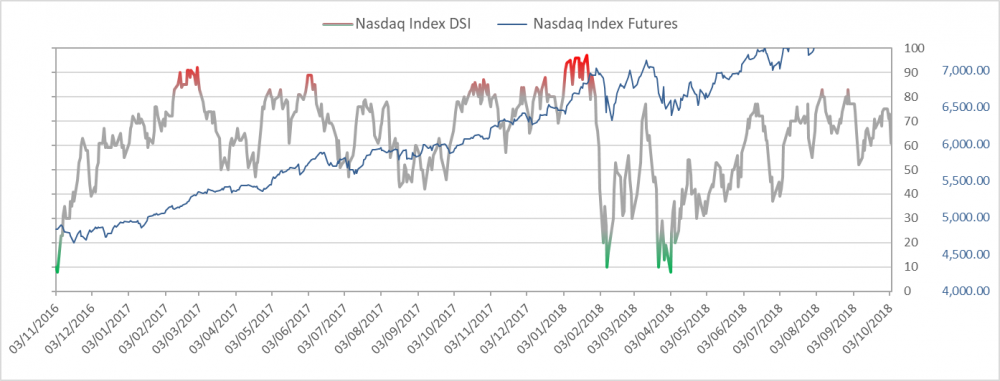
Nasdaq bullish sentiment is at 53% - more downside ahead
|
|
|
|
|
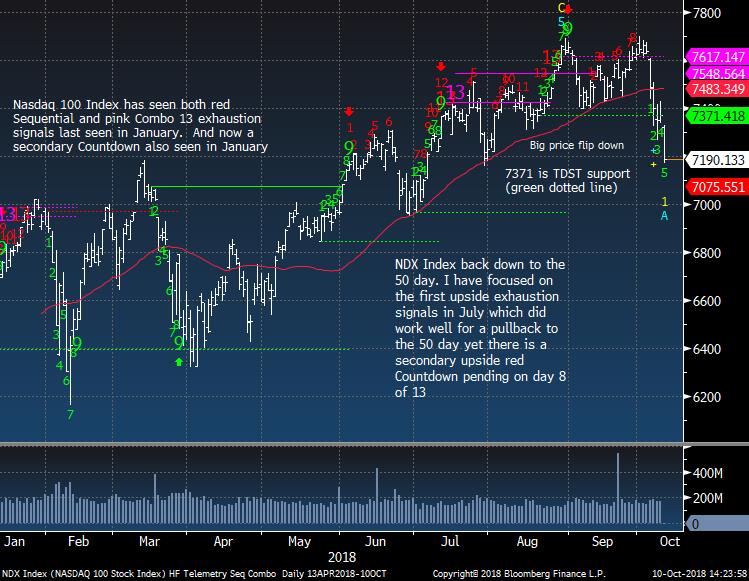
NDX Index has support at 7000 but this is just the first of 5 waves down
|
|
|
|
|
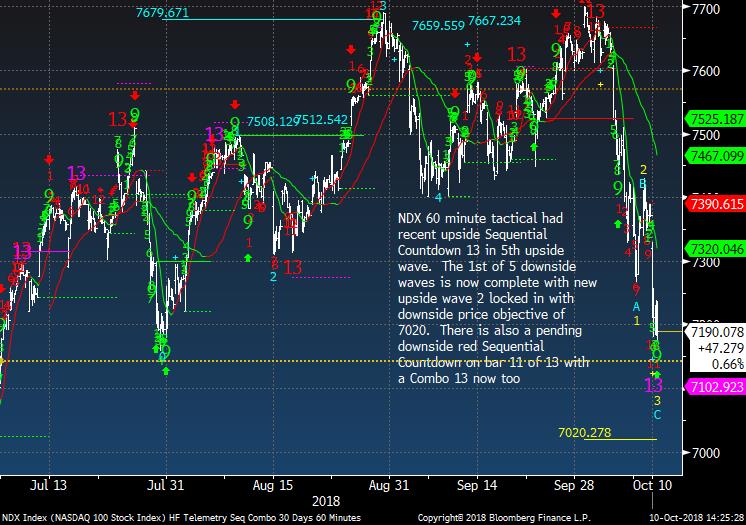
NDX 60 minute tactical getting oversold short term but again it will likely be a short term lower high bounce
|
|
|
|
|
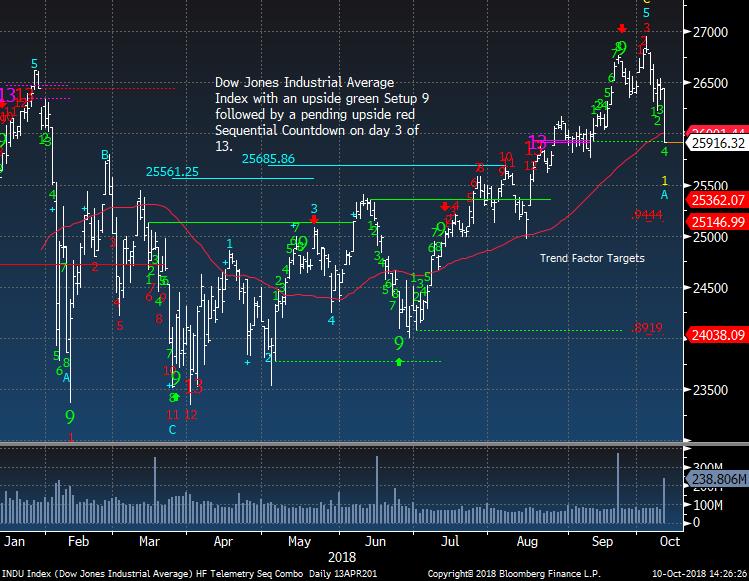
Dow Jones Industrial Average has an upside Countdown that I have been doubting would complete. I've used DeMark for long enough to know when to fade some pending signals
|
|
|
|
|
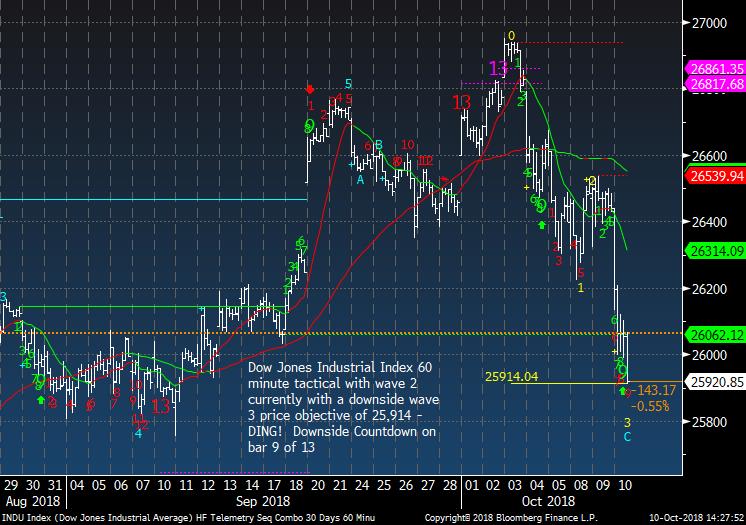
Dow 60 minute tactical at the wave 3 price objective but could overshoot before the wave 4 bounce
|
|
|
|
|
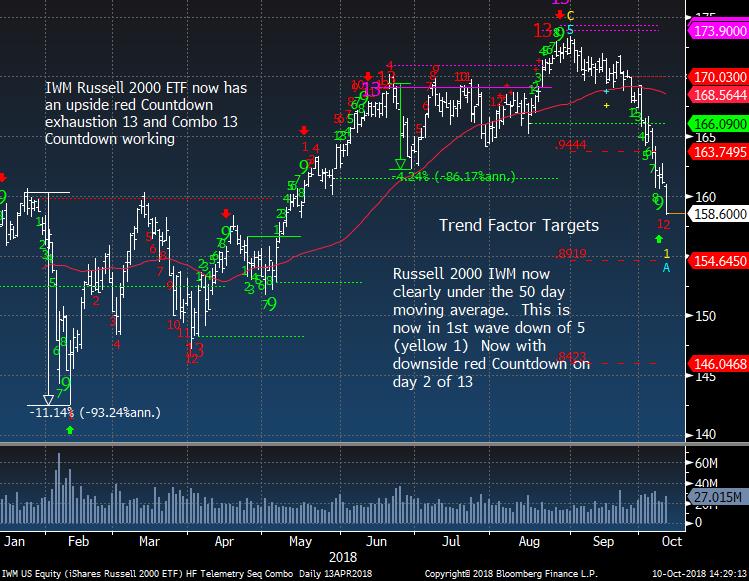
IWM Russell 2000 is in trouble with the downside red Countdown on day 2 of 13
|
|
|
|
|
|
|
Hedge Fund Telemetry Trade Ideas
|
|
|
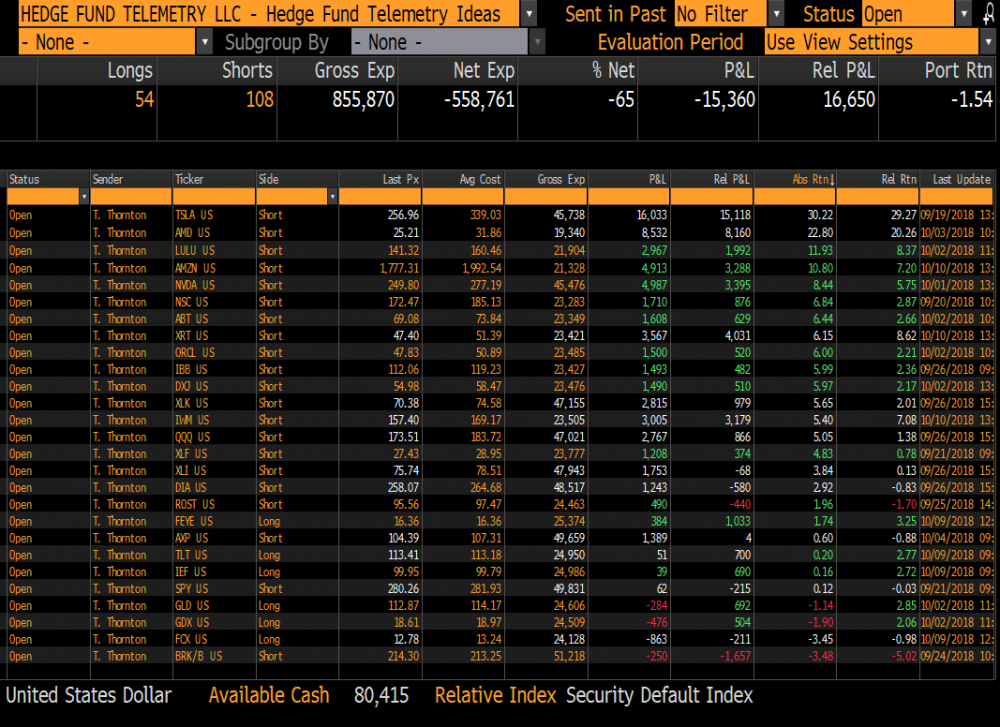
Trade Ideas Sheet - Long and short US equity ideas including ETF's. We will be overhauling the Trade Ideas Sheets for long only, short only, ETF's when the new website rolls out soon. There will also be a clearer email distribution with changes.
Trade Ideas Changes: REDUCED SHORTS FROM 5% TO 2.5% WEIGHT: AMZN +9.15%, IWM +4.5%, XRT +5.5%
Stops on everything. TSLA 320, GDX 17.35 , FEYE 16.00, NVDA 295, QQQ 190 (raised stop), XLK 79 (raised stop), SPY 295, XLY 118, AXP 114, XRT 53, IWM 172, XLV 95, BRK/B 225, DIA 275, XLI 81.50, IBB 123, AMD 30 (lowered stop), ROST 100.50, ABT 76, ORCL 53, LULU 165, AMZN 1990 (lowered stop to breakeven), DXJ 61, GLD 111
|
|
|
|
|
|
|
|
|
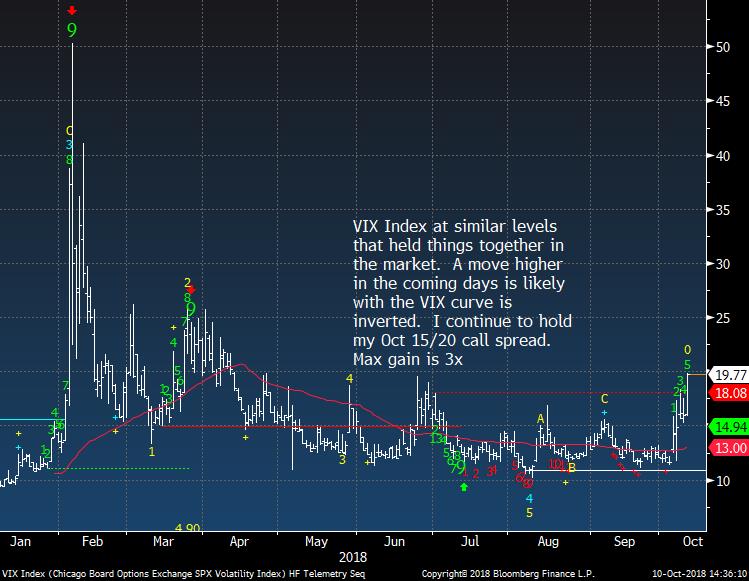
Will this continue? If it can move higher above 20 for a few more days then things can get wild
|
|
|
|
|
|
|
|
|
Oversold and I'm holding both the TLT and IEF long with a 2.5% weighting each
|
|
|
|
|
|
|
|
|
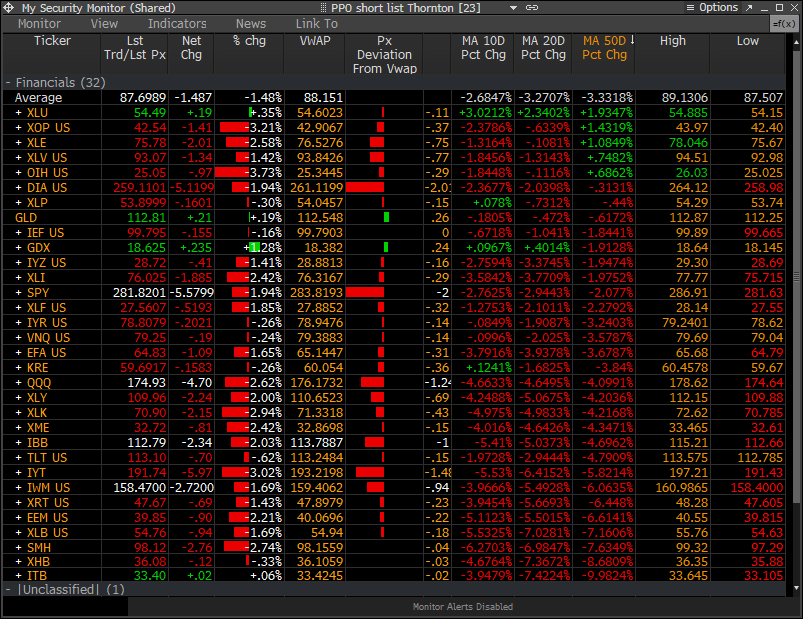
PPO Monitor - Percentage Price Oscillator
|
|
|
The PPO Monitor is a proprietary monitor developed to force rank Indexes, Sectors, and Stocks. It ranks top down by strongest to weakest by percentage above/below the 50 day moving average. Shorter term signals can be seen when the 10 and 20 day moving averages turn up (green) or down (red) which often are followed by the 50 day moving average. This is useful to watch for historically overbought/oversold percentage above/below the 50 day moving average. It is
non correlated with the DeMark Indicators however we have found upside/downside exhaustion signals often occur when something rises to the top or drifts to the bottom of the monitor - increasing the timing aspect. We share this monitor with clients with Bloomberg Terminals. An added feature is that each market/ETF can be expanded with each component force ranked in the same way. A couple other features include price deviation from intraday VWAP (useful for intraday reversals) and new 20 day highs/lows on right side. Please inquire if you would like to be permissioned to use the PPO Monitor.
Today's highlights: Still more 20 day lows and now most ETF sectors are under the moving averages. When the average of all get >5% below the 50 day then oversold readings start to show up. Only 3.3 below now.
|
|
|
|
|
|
|
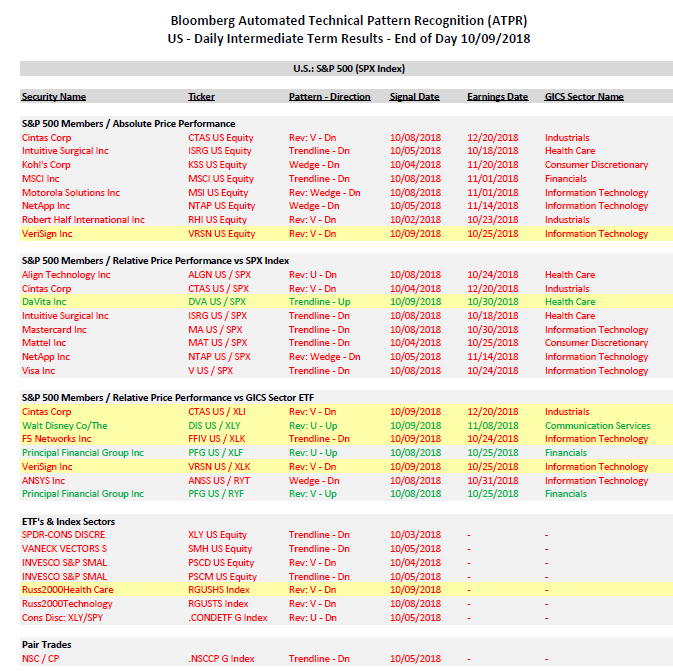
Bloomberg Automated Technical Pattern Recognition Screens
|
|
|
S&P 500 Members/Absolute Price Performance and Relative Price Performance vs S&P 500 and Sector ETF's. ETF's vs Index Sectors. Pair Trades. Long side is first symbol, short side is second symbol. If you want a PDF from Bloomberg that explains this strategy, please email us. We are going to do a webinar in the next two weeks with the Bloomberg analyst who created this strategy.
|
|
|
|
|
|
|
|
|
DEMARK SCREENS - Daily, Weekly, Monthly Upside/Downside Exhaustion Signals
|
|
|
Daily/Weekly DeMark upside/downside exhaustion signals (Sequential) updated daily, Weekly signals on Monday's and monthly on the first day of the new month. Price flips occur when a stock closes higher/lower than four previous closes and increases conviction of a price turn.
The upside 13's are sell signals and downside 13's are buy signals. Price flip's are confirmation signals that increases potential for a price trend change. For example, if you are long a stock and there is an upside 13, you will want to take cautious action by selling down or out of a position. If initiating a short sale with the upside 13's, we tend to start with a 1/2 size and add with the downside price flip. The opposite is true for when there are downside 13's. Take a 1/2 size position
and add with the upside price flip. The DeMark Indicators are designed to assist the user with buying into weakness and selling into strength to anticipate trend exhaustion. Selling into a rally and buying into a decline often afford the opportunity to exit a trade without too serious a loss if wrong.
S&P 500 Universe:
DAILY UPSIDE 13: ES, FL, PFE
DAILY DOWNSIDE 13: NONE
DAILY UPSIDE WITH PRICE FLIP REVERSAL DOWN: NOC
DAILY DOWNSIDE WITH PRICE FLIP REVERSAL UP: LH
Updated: 10/8/18
WEEKLY UPSIDE 13: ABC, AES, DISCA, DISCK, EW
WEEKLY DOWNSIDE 13: GM, MAC MHK
Updated: 10/1/18
MONTHLY UPSIDE 13: ADSK, ALL, CCI, CME, DE, DLR, DTE, ETN, GLW, HPQ, INTU, PH, TPR, TXT, UPS, XLNX
MONTHLY DOWNSIDE 13: NONE
Euro Stoxx 600 Universe:
DAILY UPSIDE 13: NONE
DAILY DOWNSIDE 13: AMS SW, ENGI FP, EOAN GR
DAILY UPSIDE WITH PRICE FLIP REVERSAL DOWN: NONE
DAILY DOWNSIDE WITH PRICE FLIP REVERSAL UP: MRL SM, SDF GR
Updated: 10/8/18
WEEKLY UPSIDE 13: NONE
WEEKLY DOWNSIDE 13: AMS SW, GPOR LN
Updated: 10/1/18
MONTHLY UPSIDE 13: BNZL LN, EXPN LN, FPE3 GR, SBMO NA, SECUB SS, SWEDA SS
MONTHLY DOWNSIDE 13: BAYN GR, HMB SS, TEF SM
|
|
|
Unsubscribe me from Hedge Fund Telemetry
Hedge Fund Telemetry LLC, P.O. Box 4675, Greenwich, CT 06861, United States
CONFIDENTIALITY NOTE and DISCLAIMER: This message is for the named person's use only. It may contain confidential, proprietary or legally privileged material. No confidentiality or privilege is waived by any accidental or unintentional transmission. If you receive this message in error, please immediately delete it and all copies of it from your system, destroy any hard copies and notify the sender. You must not, directly or indirectly, use, disclose,
distribute, print or copy any part of this message if you are not the intended recipient. Hedge Fund Telemetry LLC. cannot guarantee the confidentiality of the material transmitted; therefore, information of a sensitive or confidential nature should not be transmitted. There is risk in trading markets. Hedge Fund Telemetry LLC reports are based on information gathered from various sources and believed to be reliable, but are not guaranteed as to accuracy and completeness. The information is subject to change without notice and Hedge Fund Telemetry LLC has no obligation to provide any updates or changes. Hedge Fund Telemetry LLC is providing this data for informational and educational purposes and does not believe that it is sufficient to base an investment decision on. This information should not be regarded as a solicitation or recommendation of any particular security or to engage in any trading strategy. One should always check with your licensed financial
advisor to determine suitability of any investments.
|
|
|
|
|
|
|