|
|
|
|
|
|
|
|
|
|
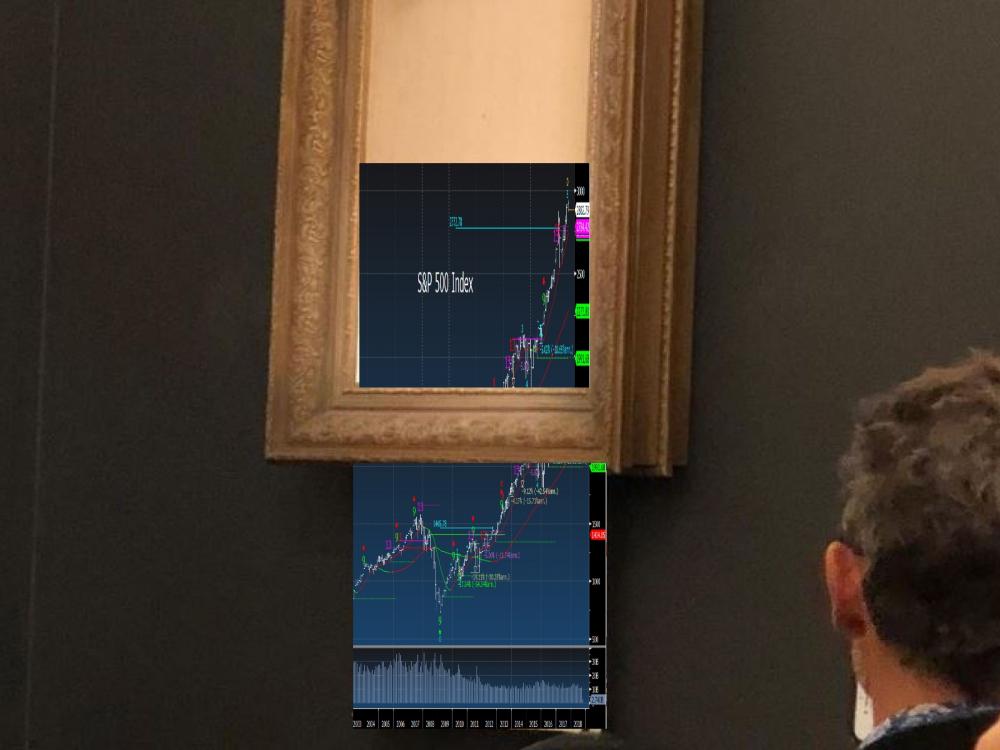
Over the weekend, Banksy, the anonymous underground graffiti artist pulled off one of the best pranks ever in the art market. One of his paintings with a girl with a balloon sold at auction for $1.4 million and after the hammer half the painting dropped through the bottom via a hidden shredder. Banksy's appeal is that he wildly ironic and dark and I love it. He's anti consumer and doesn't play by the rules and if you haven't seen the video online here it is. Naturally the price is worth double after the stunt.
If you've been paying attention to markets outside of the US, they have been going through a shredder in the past year. Markets ex US just look terrible which I've been showing all year with the Vanguard World ex US ETF. With interest rates in the US moving higher in a rapid pace last week spooked the US equity markets, especially with the very crowded FANG mega cap tech/consumer
stocks. Small cap and Mid cap sectors are seeing significant pullbacks too in the past month. Save hiding places are few and far between in this environment and currently there are no signs of oversold conditions or oversold bullish sentiment. I continue to recommend a larger than normal cash percentage weighting.
This Wednesday, we are doing a webinar at 10:15 am EST with a replay available after if you can't watch live. We'll go over current markets and sentiment. Here's the link to sign up. We also are working on modeling out shorter term S&P and Nasdaq 100 trading strategies which you can see below under US indexes. More details on this in the coming days.
- US Markets - Sentiment starting to break the majority level under 50%.
- Hedge Fund Telemetry Trade Ideas - No changes today. I remain at my most bearish positioning since January
- A
couple of ratios I'm watching today - SPY vs IWM, SPY vs TLT
- US vs the world - US is starting to roll over while the rest of the world has looked terrible all year
- Bad Breadth - US divergences
- US Sector Update - Biotech
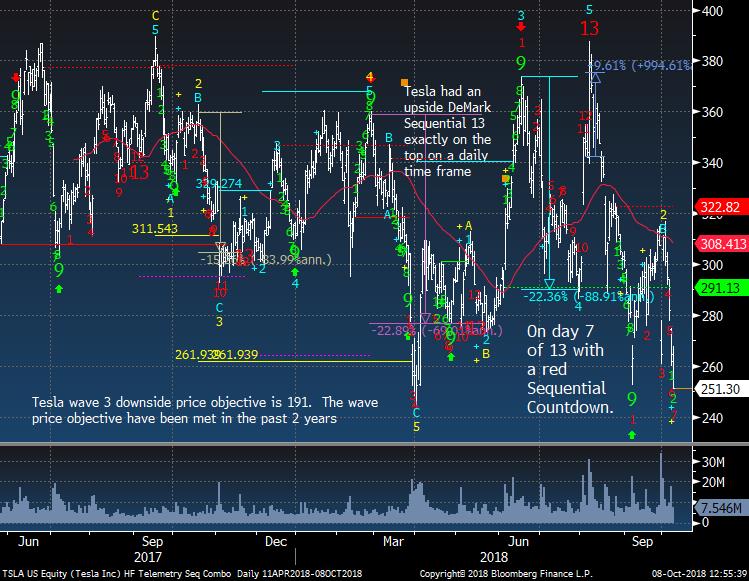
- Tesla Update - Talk of DIP financing is the last thing Tesla bulls will want to see.
- PPO Monitor - Percentage Price Oscillator Force Ranked Sector Rotation - MAJORITY under all moving averages and MAJORITY of ETF's hitting 20 day lows today.
- Bloomberg Technical Pattern Recognition Screen
- Currency Update - Very critical moment but tomorrow is more important for follow through or stall
- European Market Update - Steep drops should break down further
- Global Market Update - Very weak
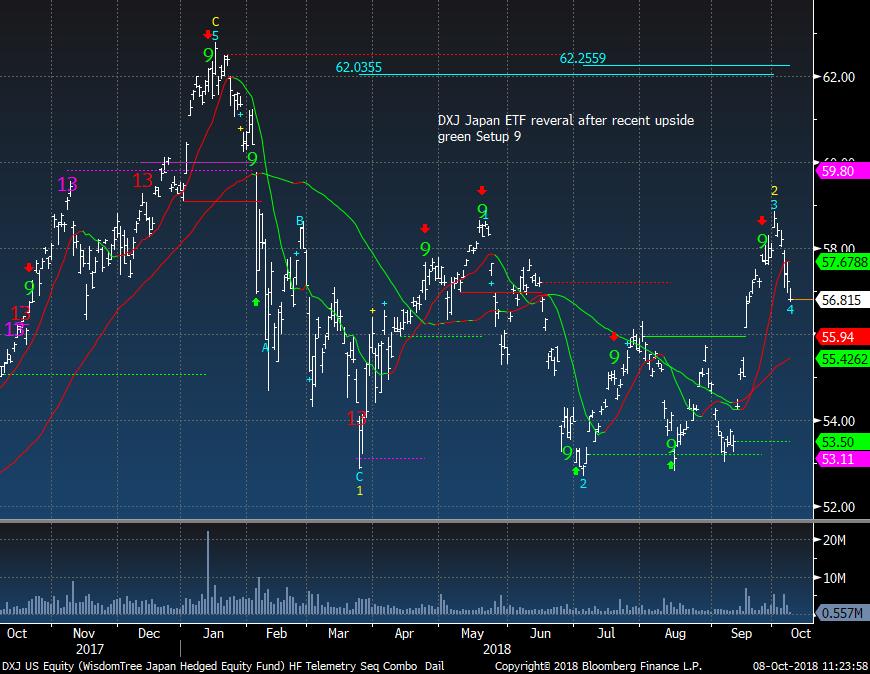
- Asian Market Update - Japan should work lower
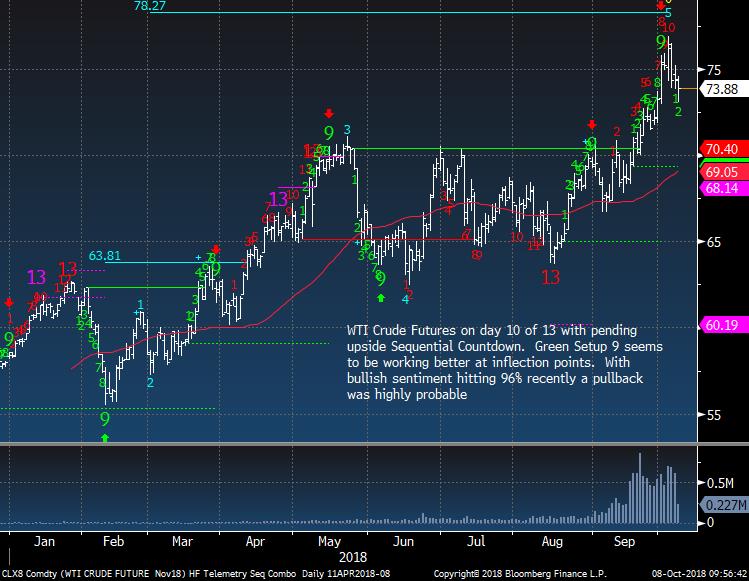
- Crude Update - Stalling and sentiment remains extreme but starting to drop
- Gold Update - Gap down today but remains sideways for the most part
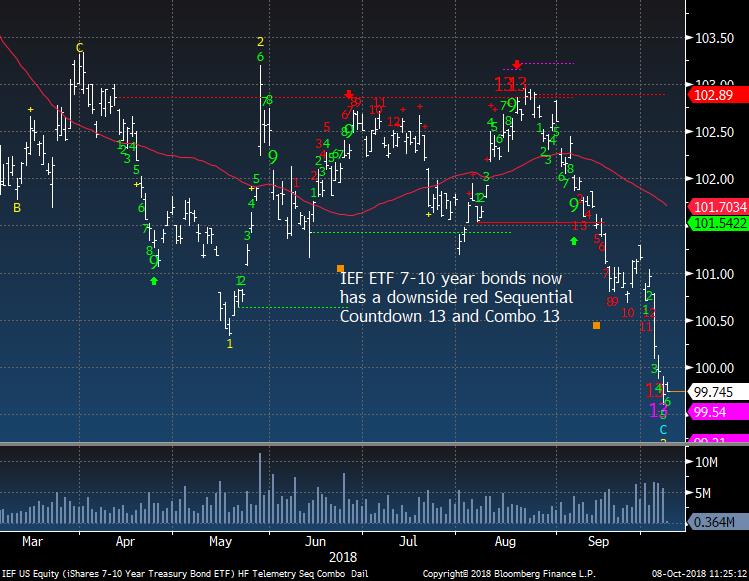
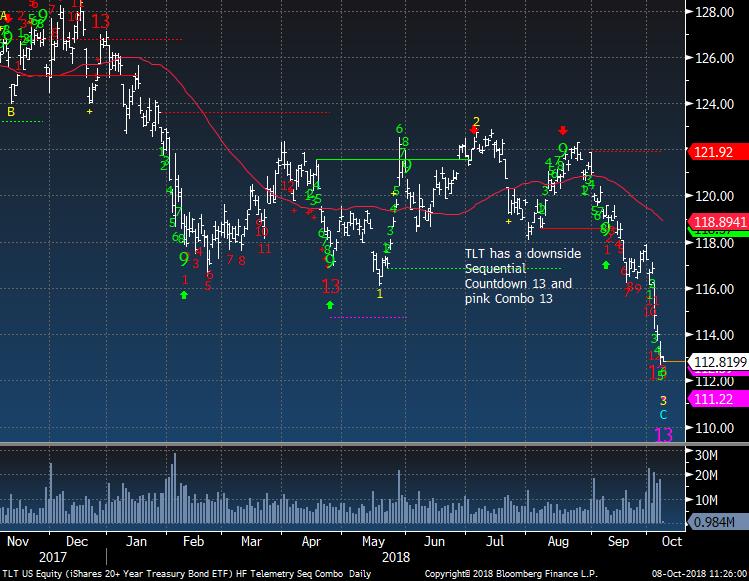
- Bond Update - US Bond market closed today but ETF's triggering Combo exhaustion signals
- DeMark Screens - Daily, Weekly, Monthly upside/downside exhaustion signals within the S&P 500 and Euro Stoxx 600 Last week's data updated
|
|
|
|
|
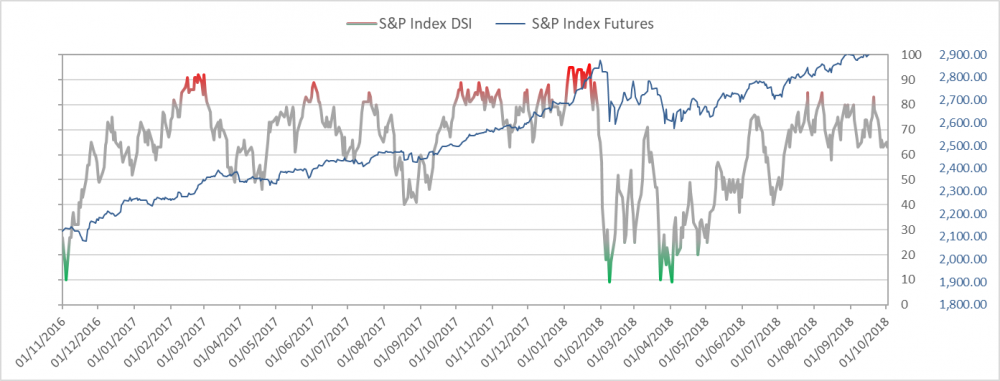
Here's a link to the Hedge Fund Telemetry market sentiment page with 40 charts of sentiment including equities, bonds, currencies, and commodities updated each day. When the new website launches we will be adding new charts and historical sentiment data for Euro Stoxx 50, UK FTSE 100, German DAX, French Cac 40. We will be adding Japanese Bonds, German Bunds, and a few more.
SPX bullish sentiment is at 44% now below the 50% majority line
|
|
|
|
|
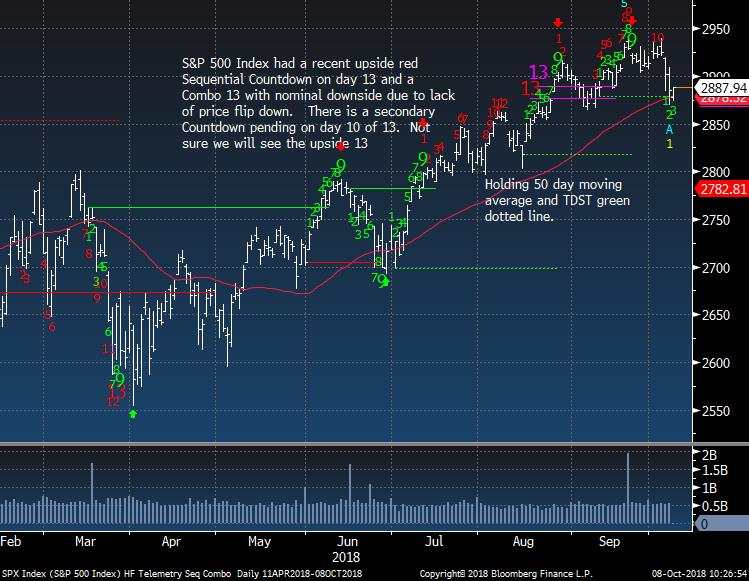
SPX daily right at the 50 day
|
|
|
|
|
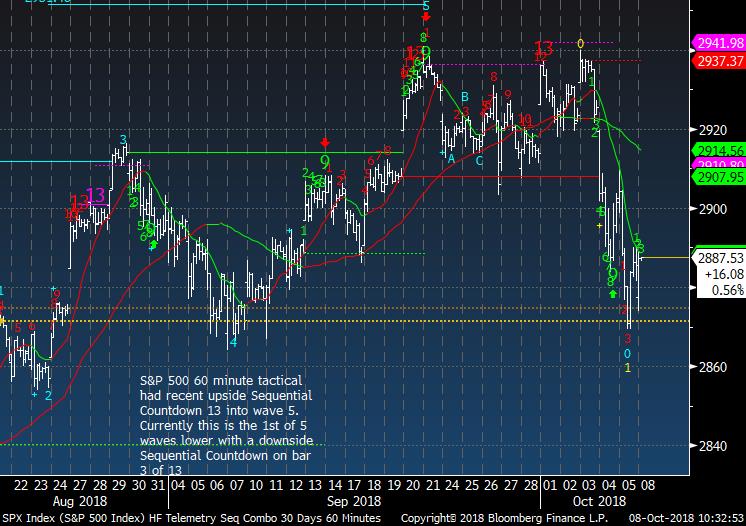
SPX 60 minute tactical time frame is really a great way to trade shorter term using both the upside / downside DeMark Sequential and Combo and within a 5 wave move. We're going to add this strategy and document it on the new website for clients to follow. Currently this traced out an upside 5 wave move with several upside exhaustion signals and this recent move lower is wave 1 of 5 lower.
|
|
|
|
|
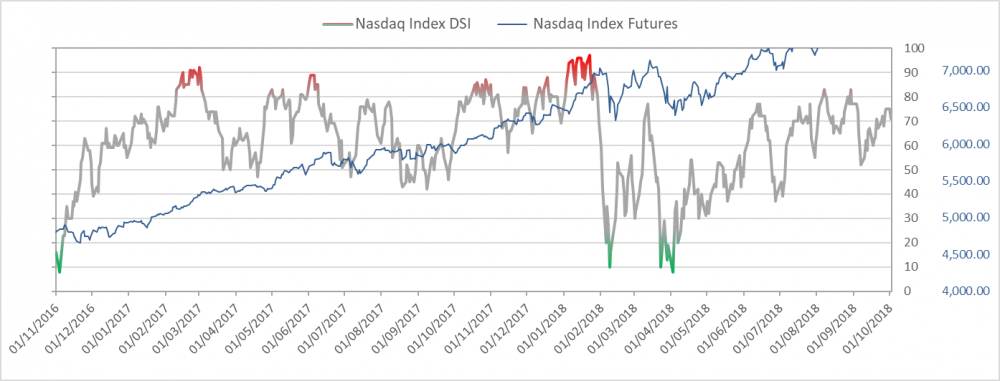
Nasdaq bullish sentiment is at 53% and will likely break the 50% majority line.
|
|
|
|
|
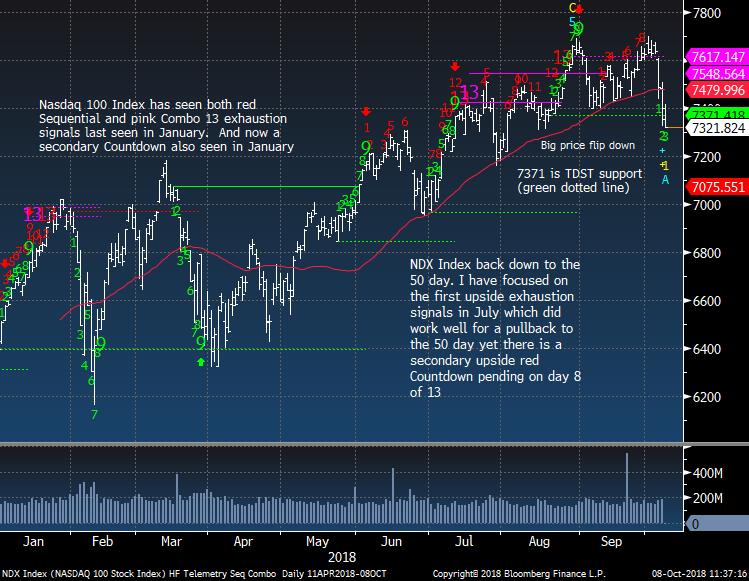
NDX Index is really falling in a double black diamond steep fashion
|
|
|
|
|
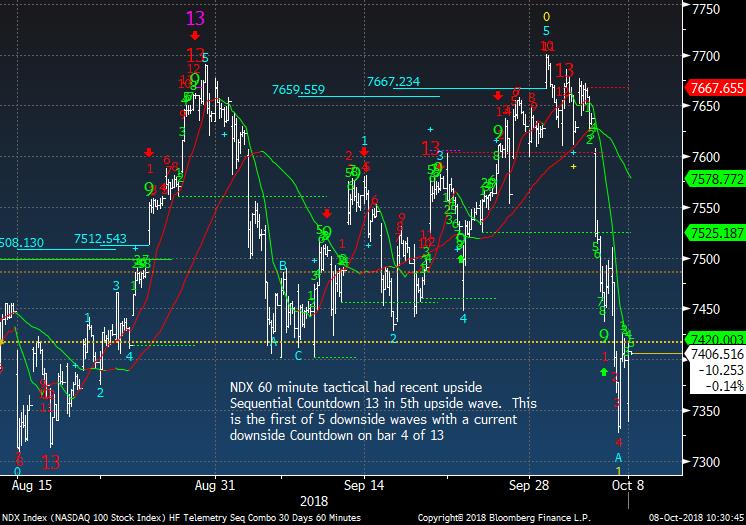
NDX 60 minute tactical similar to SPX with this being the first of 5 waves lower
|
|
|
|
|
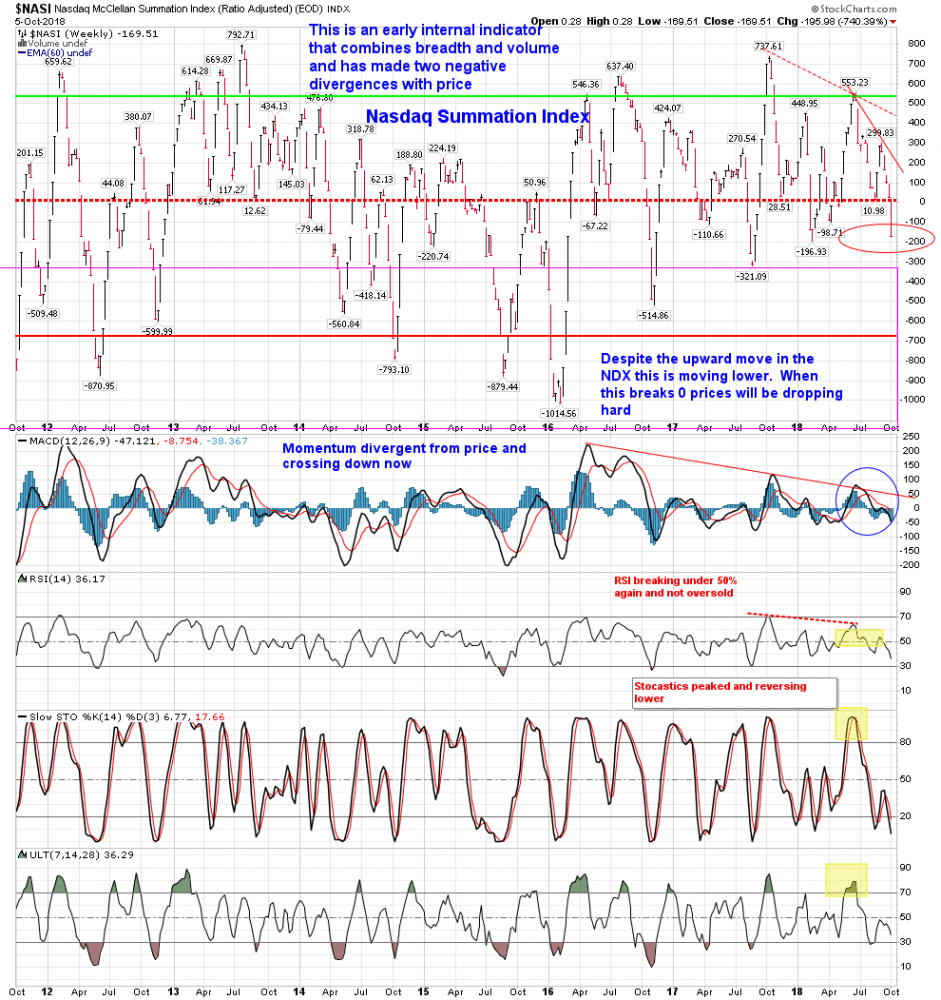
Nasdaq Summation Index is firmly below zero and it is when people discover risk. Quite a divergence ahead of the steep pullback in the past week and this is not oversold
|
|
|
|
|
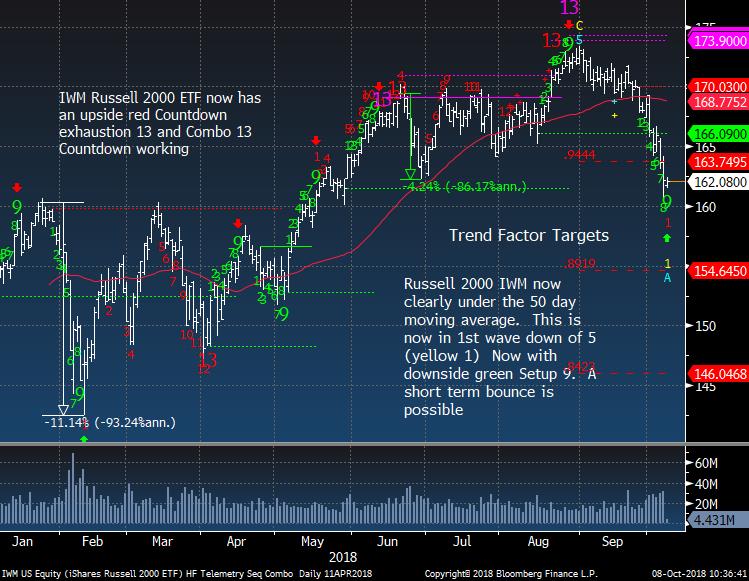
IWM Russell 2000 has the potential to bounce in the coming days with the today's green Setup 9 but if this continues lower a red Sequential Countdown will be in play
|
|
|
|
|
|
|
Hedge Fund Telemetry Trade Ideas
|
|
|
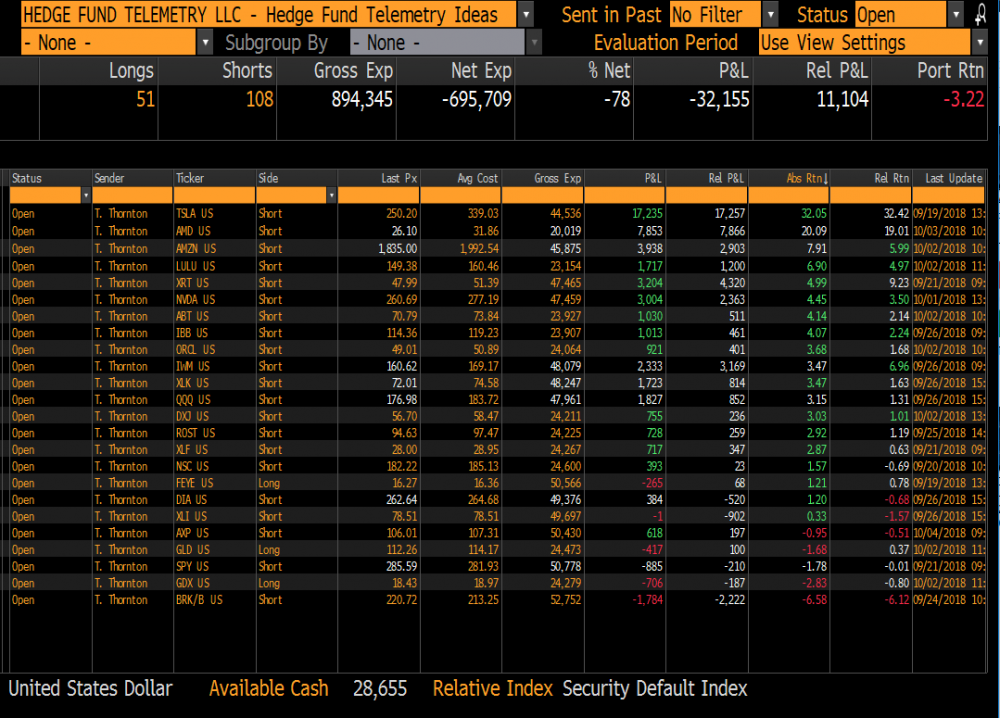
Trade Ideas Sheet - Long and short US equity ideas including ETF's. We will be overhauling the Trade Ideas Sheets for long only, short only, ETF's when the new website rolls out soon. There will also be a clearer email distribution with changes.
Trade Ideas Changes: NO changes today
Stops on everything. TSLA 320, GDX 17.35 , FEYE 16.00, NVDA 295, QQQ 190 (raised stop), XLK 79 (raised stop), SPY 295, XLY 118, AXP 114, XRT 53, IWM 172, XLV 95, BRK/B 225, DIA 275, XLI 81.50, IBB 123, AMD 30 (lowered stop), ROST 100.50, ABT 76, ORCL 53, LULU 165, AMZN 1990 (lowered stop to breakeven), DXJ 61, GLD 111
|
|
|
|
|
|
|
A couple ratio charts I'm watching today
|
|
|
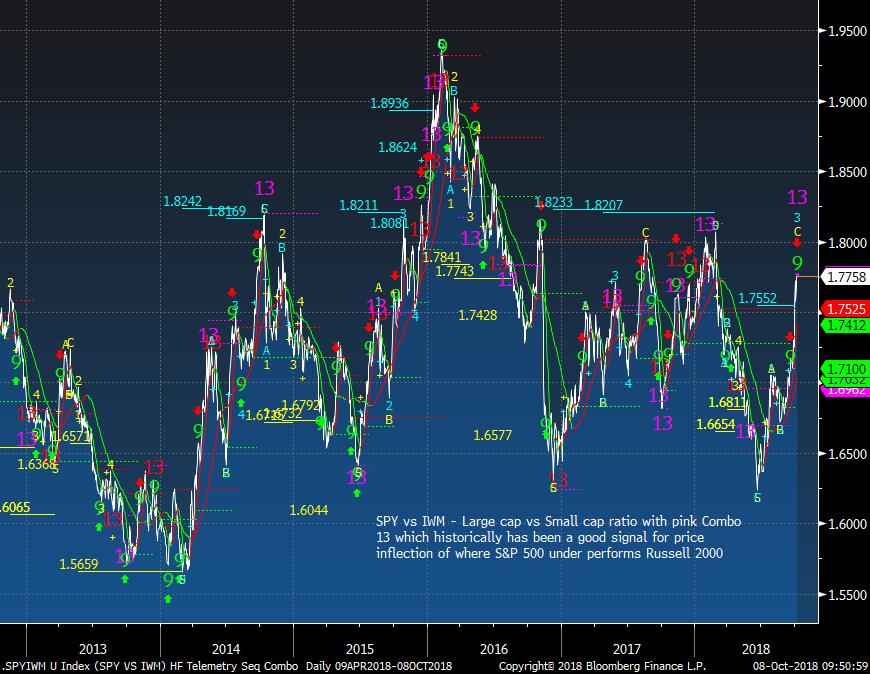
SPY vs IWM weekly has seen inflection with pink Combo 13's and green 9's
|
|
|
|
|
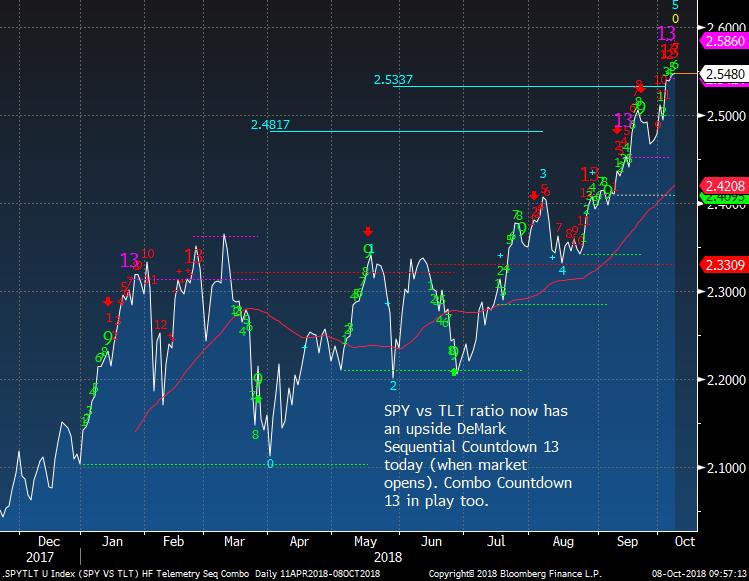
SPY vs TLT - stocks vs bonds daily with another pink Combo and red Sequential in play and at the upside wave 5 price objective. We'll see if this ratio turns like it did in January and February
|
|
|
|
|
|
|
|
|
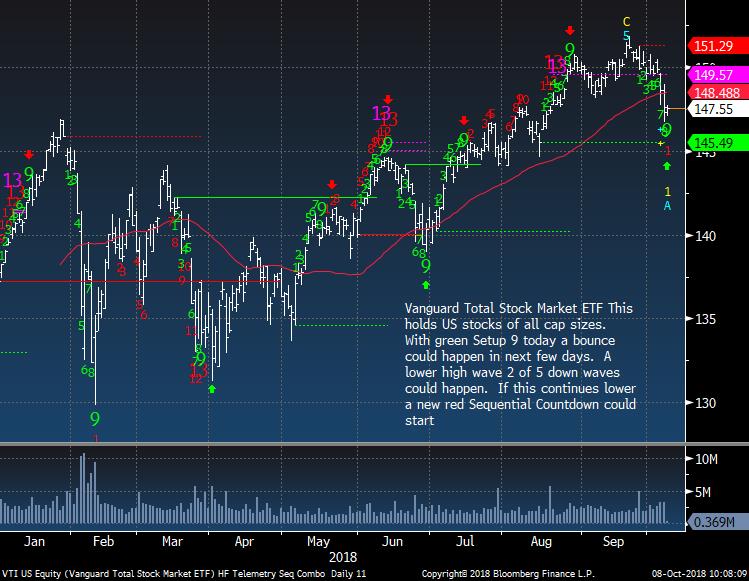
Total US market has started to roll over
|
|
|
|
|
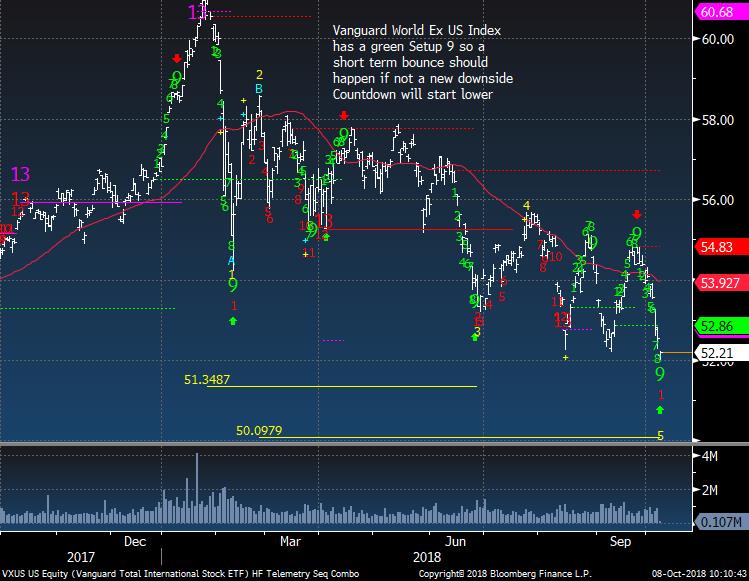
World ex US is making new lows. The rest of the world has been terrible. Some people have thought it's time to buy the rest of the world or emerging markets but it the US starts to fall it will take the global markets lower too. Perhaps by less but I don't want to bet on that pair trade
|
|
|
|
|
|
|
|
|
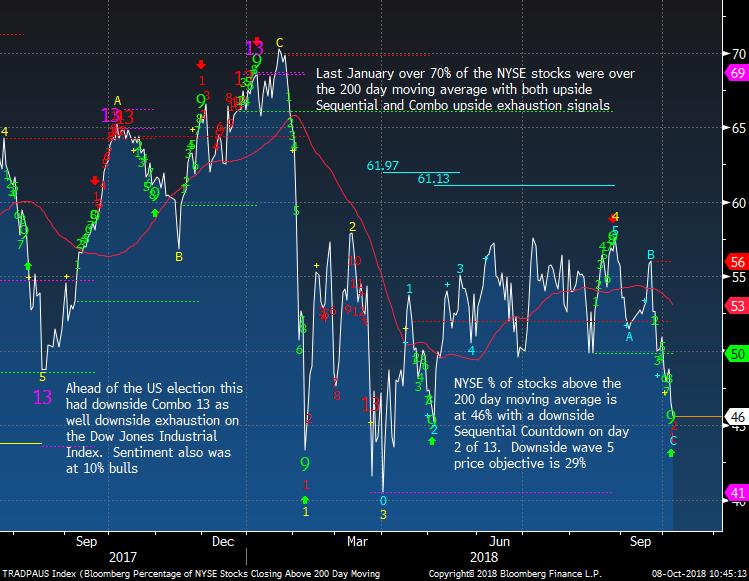
NYSE percentage of stocks above the 200 day continues to drop and diverge
|
|
|
|
|
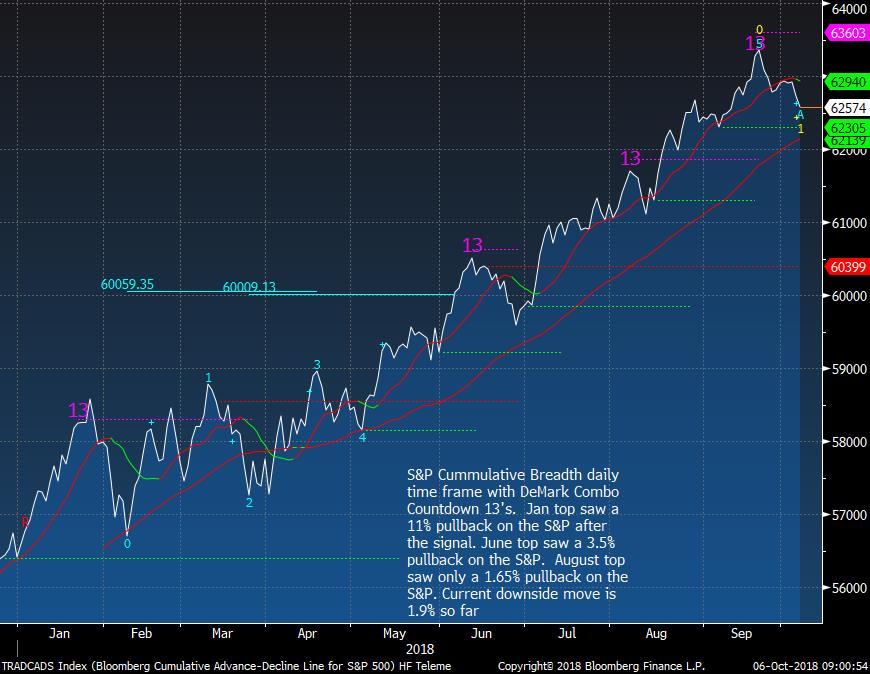
S&P cumulative breadth could have peaked
|
|
|
|
|
|
|
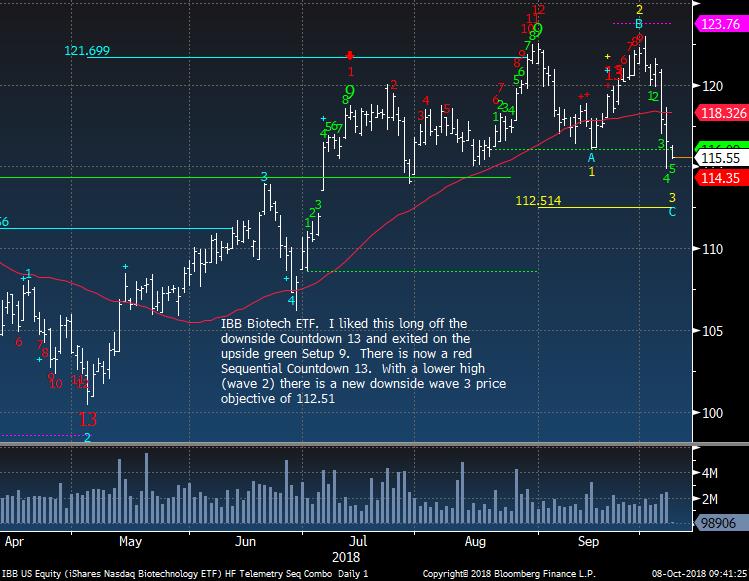
US Sector Focus - Biotech
|
|
|
IBB Biotech is breaking short term support.
|
|
|
|
|
|
|
|
|
Tesla continues to fall and has a downside DeMark Countdown in progress. There were rumors over the weekend that the company was possible going to do some sort of DIP financing. DIP financing is not the type of financing bulls will want to see as it usually is deployed ahead of bankruptcy filings. Every move lower will shake out more long term bulls.
|
|
|
|
|
|
|
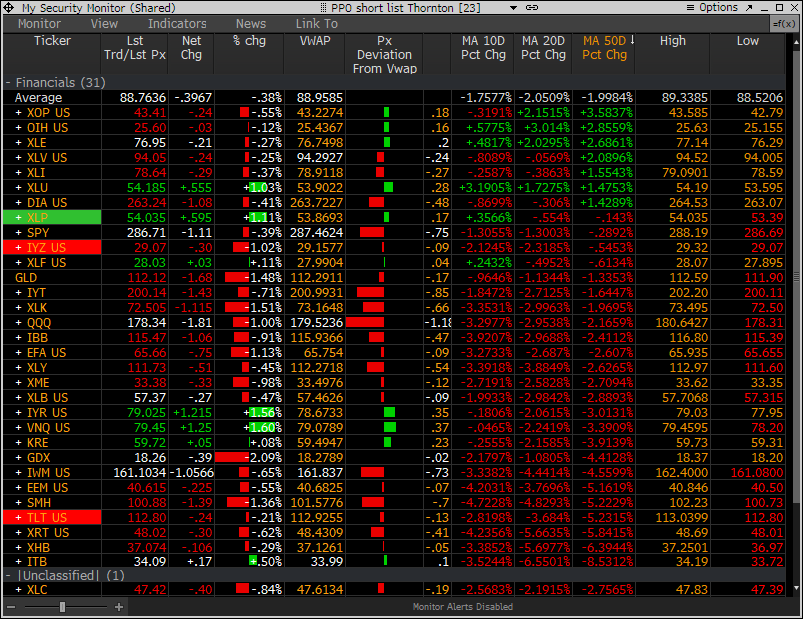
PPO Monitor - Percentage Price Oscillator
|
|
|
The PPO Monitor is a proprietary monitor developed to force rank Indexes, Sectors, and Stocks. It ranks top down by strongest to weakest by percentage above/below the 50 day moving average. Shorter term signals can be seen when the 10 and 20 day moving averages turn up (green) or down (red) which often are followed by the 50 day moving average. This is useful to watch for historically overbought/oversold percentage above/below the 50 day moving average. It is
non correlated with the DeMark Indicators however we have found upside/downside exhaustion signals often occur when something rises to the top or drifts to the bottom of the monitor - increasing the timing aspect. We share this monitor with clients with Bloomberg Terminals. An added feature is that each market/ETF can be expanded with each component force ranked in the same way. A couple other features include price deviation from intraday VWAP (useful for intraday reversals) and new 20 day highs/lows on right side. Please inquire if you would like to be permissioned to use the PPO Monitor.
Today's highlights: Almost all the sectors are under the 10, 20, and 50 day moving averages now and the majority of them have made 20 day lows today
|
|
|
|
|
|
|
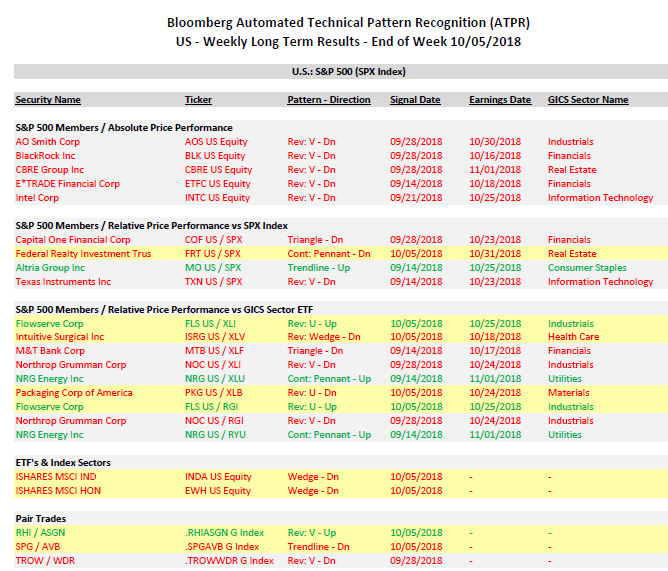
Bloomberg Automated Technical Pattern Recognition Screens
|
|
|
S&P 500 Members/Absolute Price Performance and Relative Price Performance vs S&P 500 and Sector ETF's. ETF's vs Index Sectors. Pair Trades. Long side is first symbol, short side is second symbol.
|
|
|
|
|
|
|
|
|
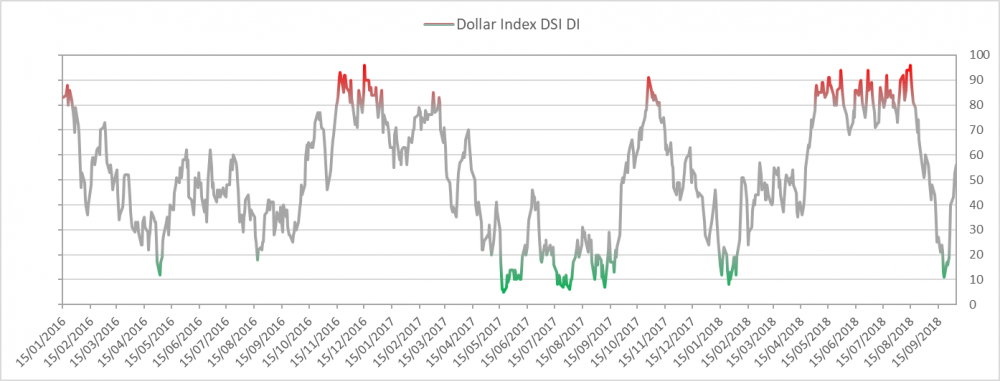
US Dollar bullish sentiment is at 56%
|
|
|
|
|
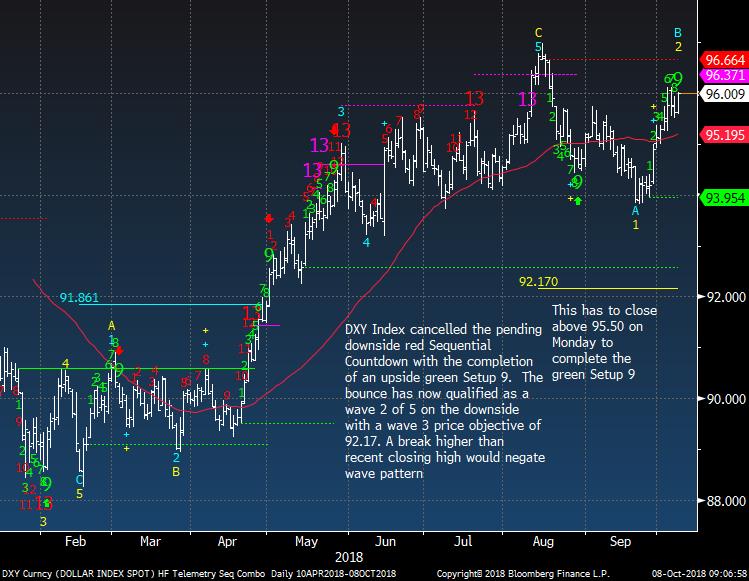
US Dollar Index up tomorrow will start a new red Sequential Countdown. Stay tuned
|
|
|
|
|
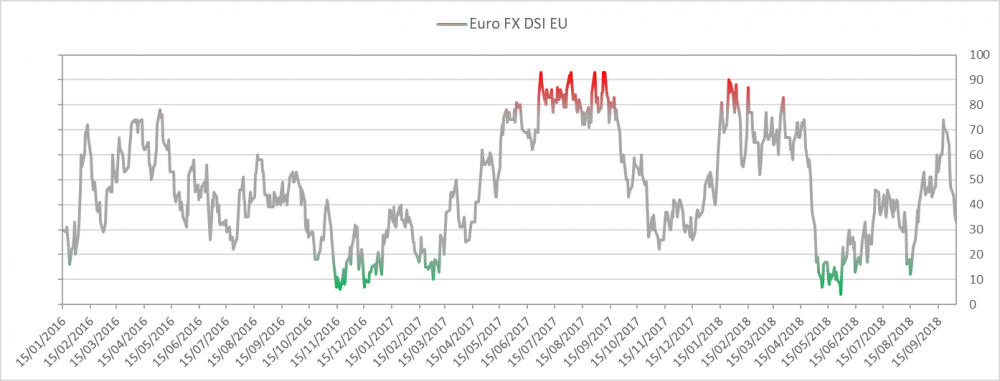
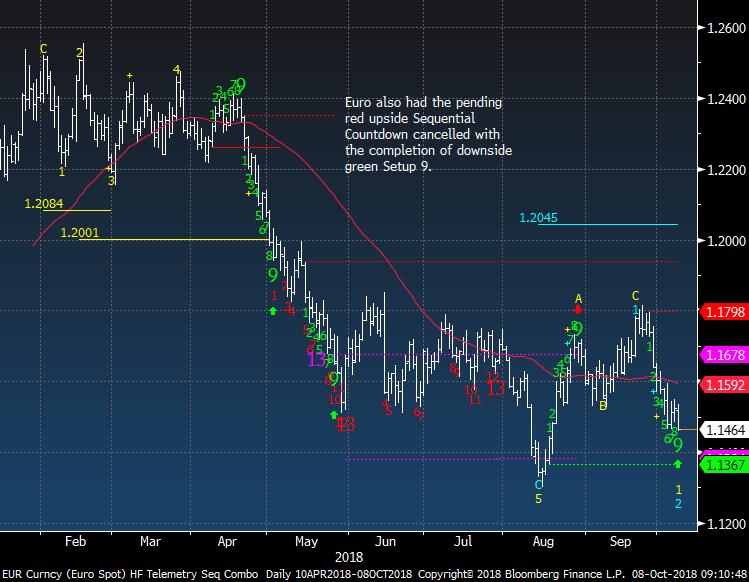
Euro bullish sentiment is at 33%
|
|
|
|
|
|
|
|
|
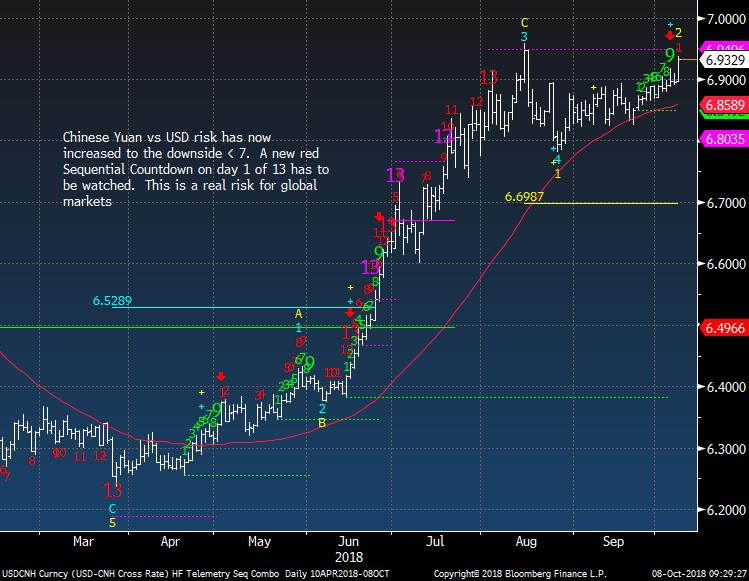
Yuan finally broke below the 6.9 level and will be interested if tomorrow it's down again. Serious implications if so
|
|
|
|
|
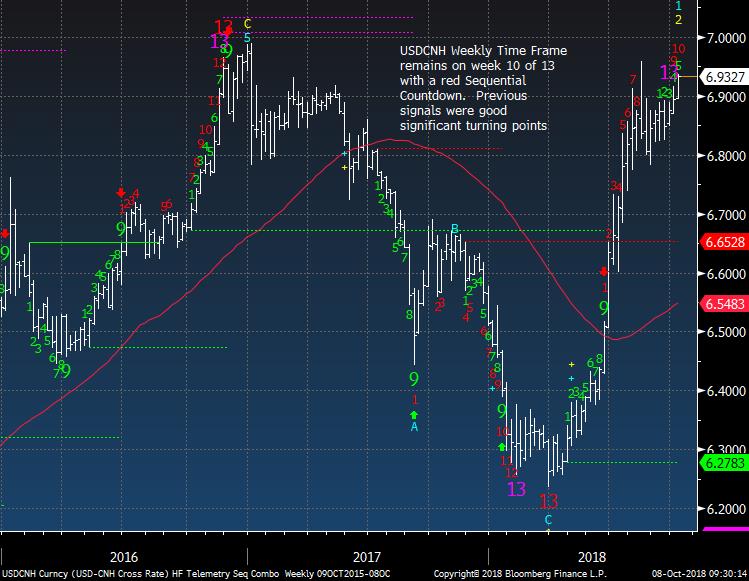
Yuan weekly has been a guide I've shown before as it still has some room with the DeMark Countdown before it is exhausted. The weekly signals have been excellent
|
|
|
|
|
|
|
|
|
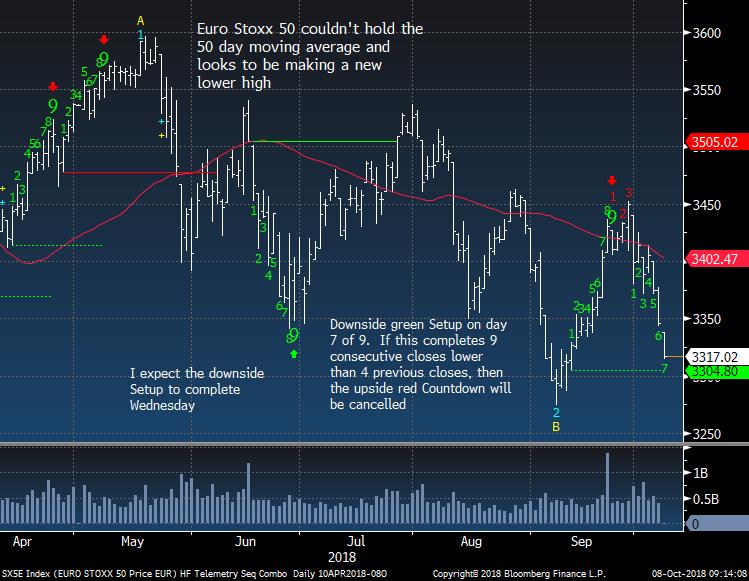
Euro Stoxx 50 continues to look horrible
|
|
|
|
|
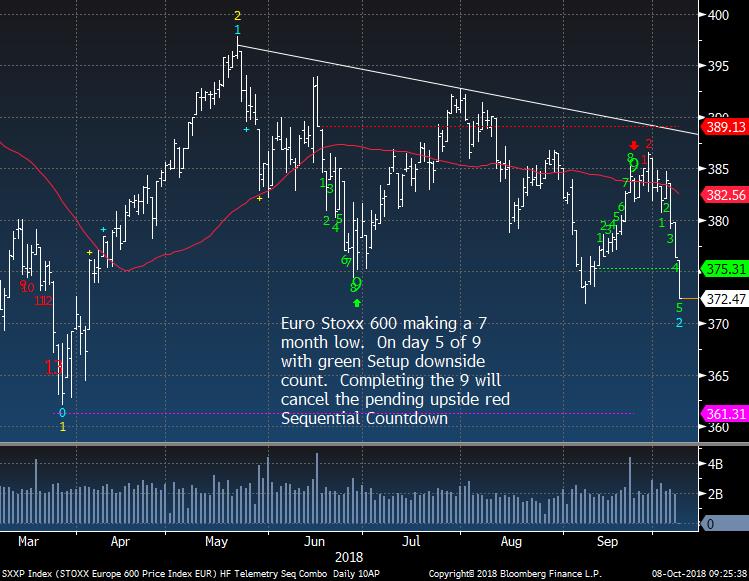
Euro Stoxx 600 new 7 month lows
|
|
|
|
|
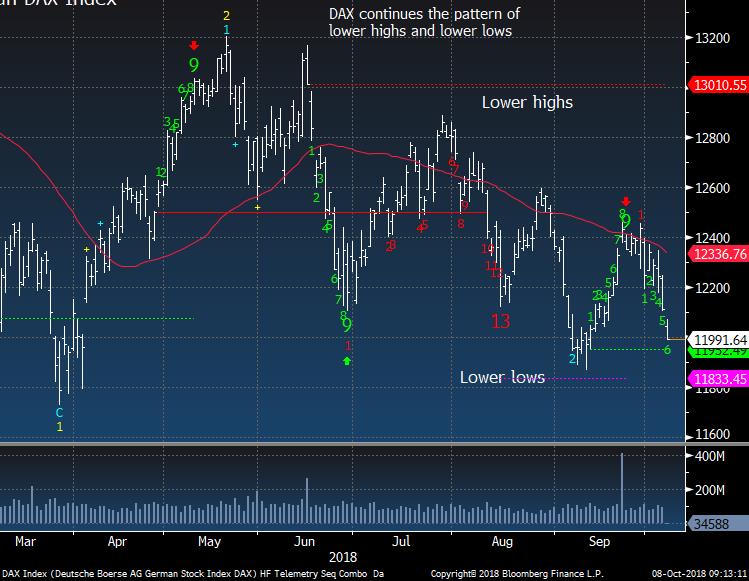
German DAX nearing support if you can call it support
|
|
|
|
|
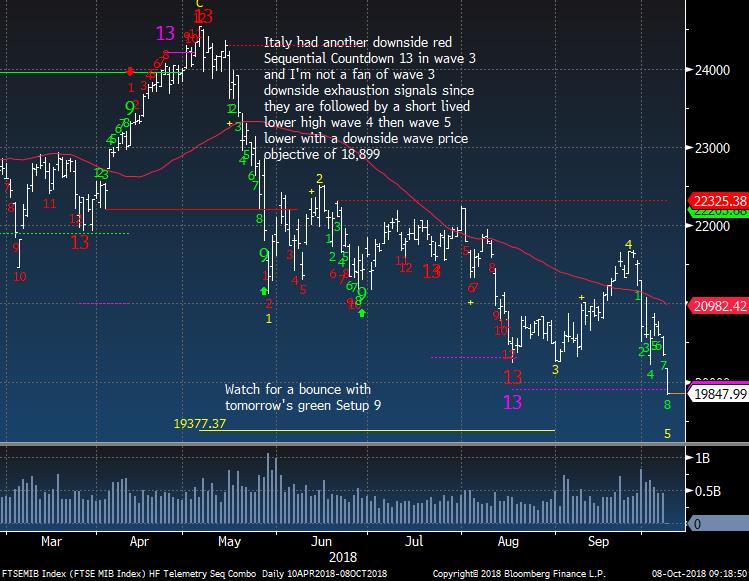
Italy broke support as expected and now the wave 5 target comes into play
|
|
|
|
|
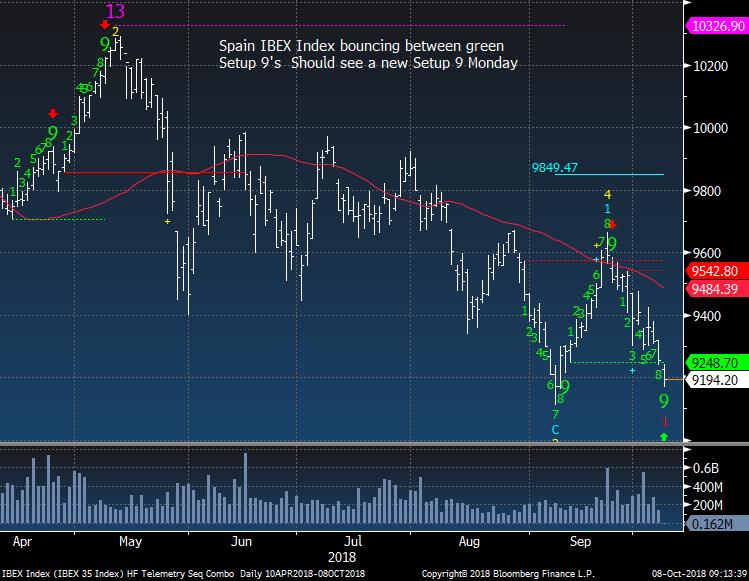
Spain with green Setup 9 but will it hold?
|
|
|
|
|
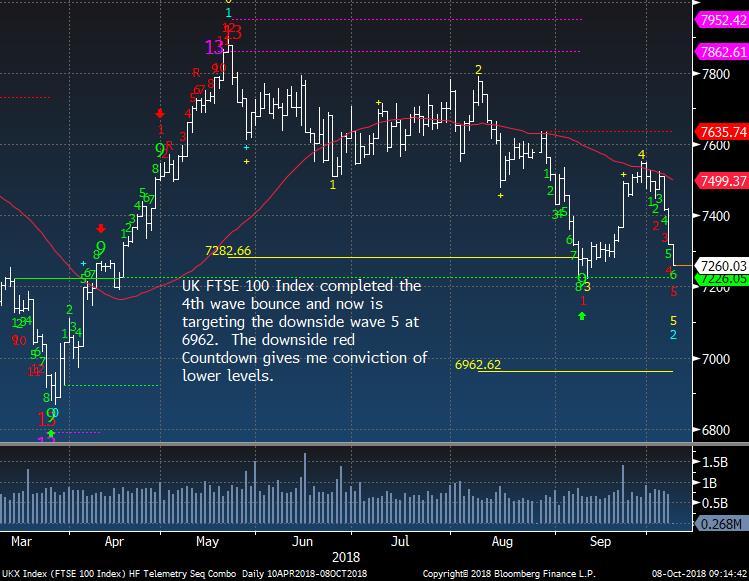
UK looks lower with Countdown in play
|
|
|
|
|
|
|
|
|
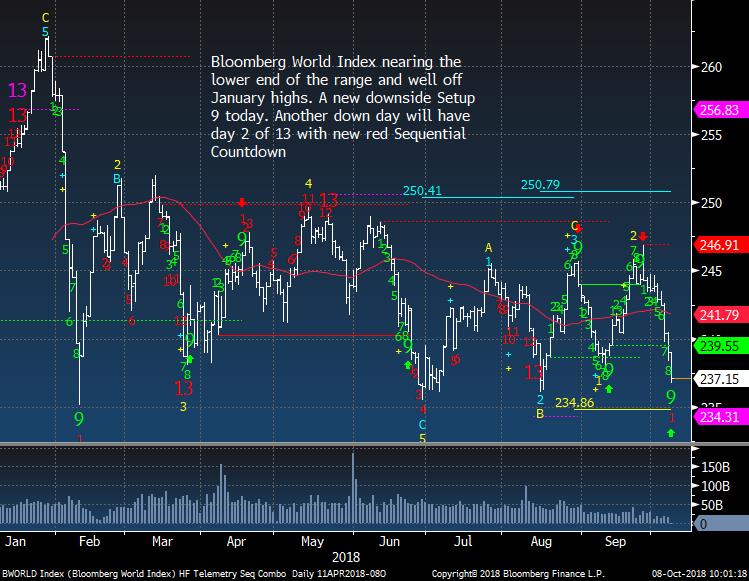
Bloomberg World Index at the lower end of the range
|
|
|
|
|
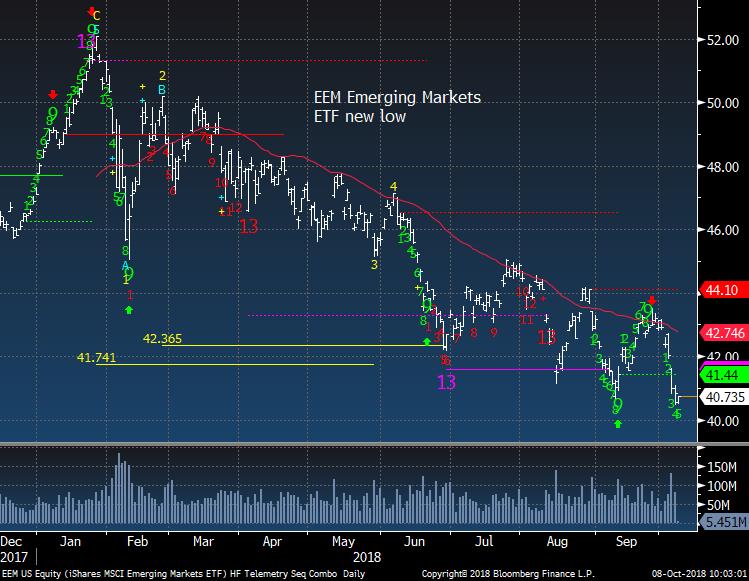
EEM Emerging Markets ETF new lows
|
|
|
|
|
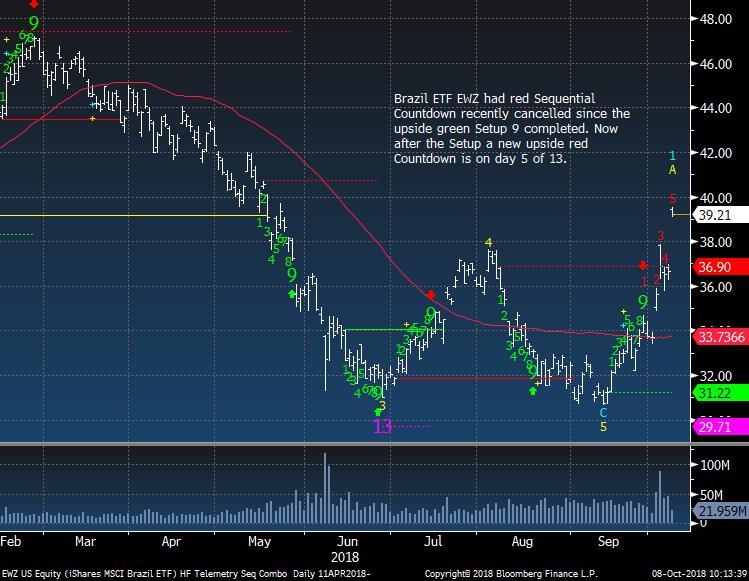
Last week I showed the Brazil ETF with the new upside Countdown starting but I really did not want to risk buying ahead of the election. Looks like the market likes who's leading.
|
|
|
|
|
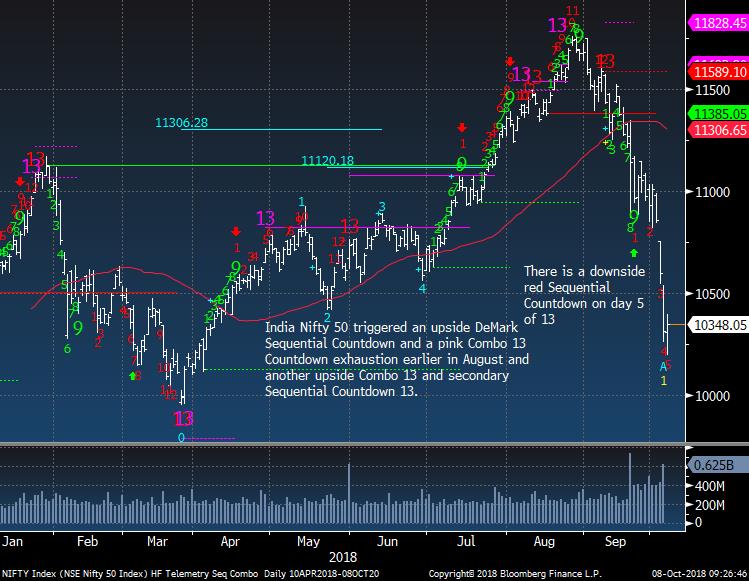
India still looks lower but could try and consolidate some of the recent losses
|
|
|
|
|
|
|
|
|
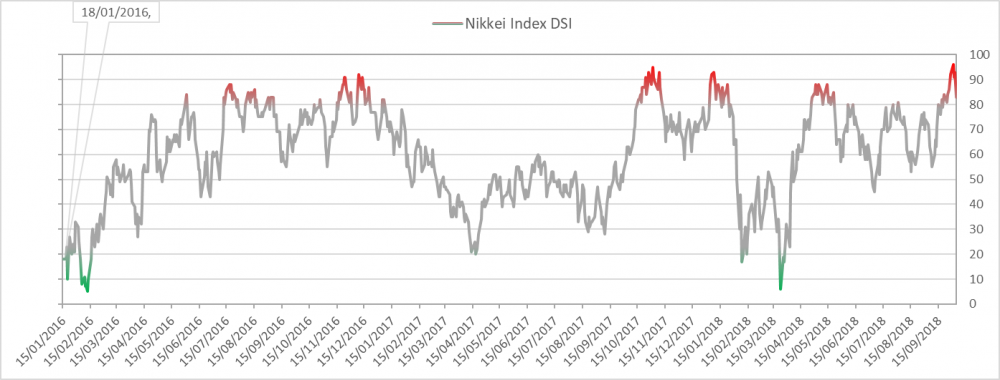
Nikkei bullish sentiment is at 76% down from the bell ringer 96% extreme reading
|
|
|
|
|
|
|
|
|
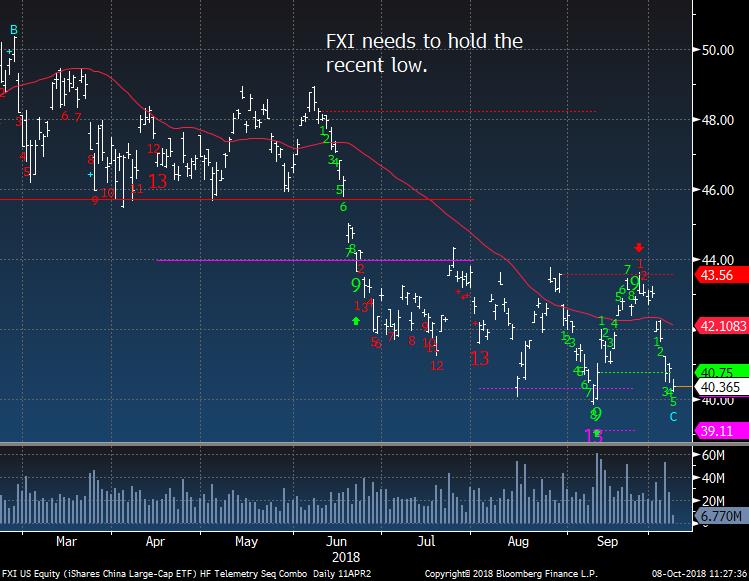
China / Hong Kong FXI ETF just can't get any momentum on the upside to stick
|
|
|
|
|
|
|
|
|
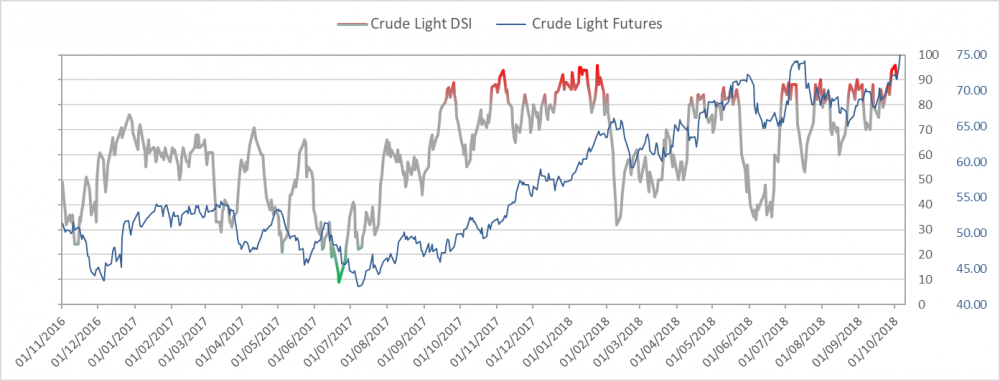
Crude bullish sentiment is at 83% and remains extreme
|
|
|
|
|
|
|
|
|
|
|
|
|
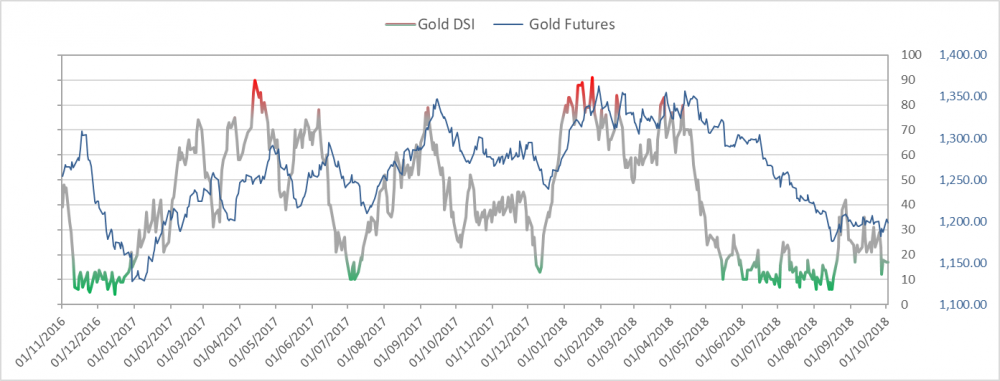
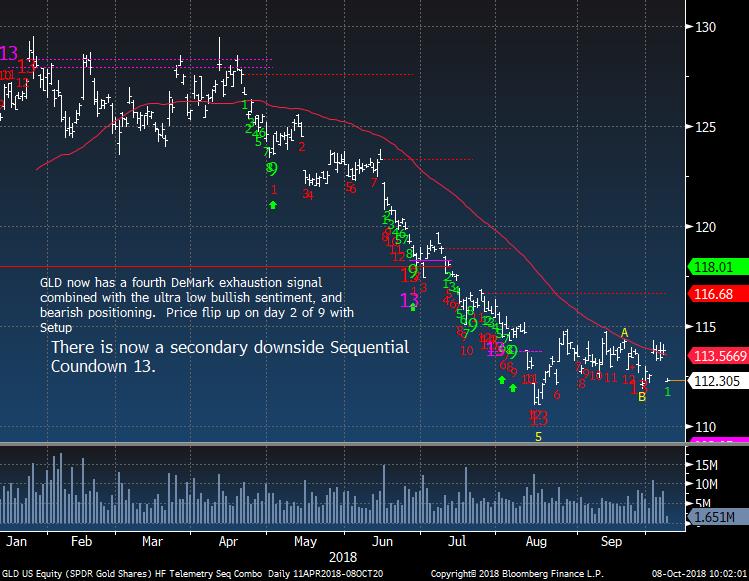
Gold bullish sentiment is at 21% and needs to move above 40% to get momentum to the upside
|
|
|
|
|
Gold gapped down but still is sideways for now
|
|
|
|
|
|
|
|
|
Bond bullish sentiment is at 33% and is getting closer to oversold levels - having an issue with the chart today.
|
|
|
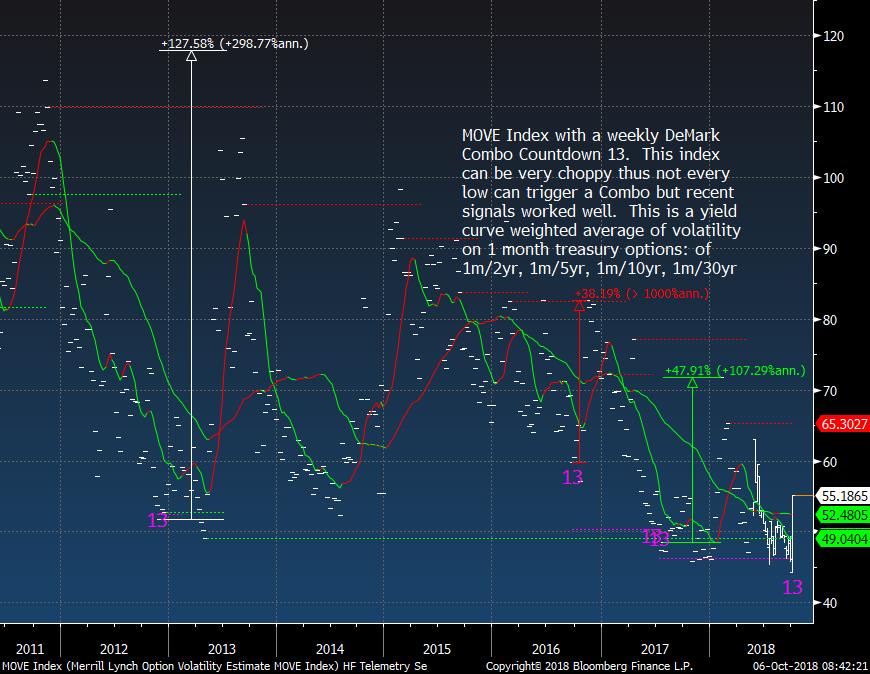
MOVE Index is a "bond VIX" and it's starting to move up on the weekly chart
|
|
|
|
|
|
|
|
|
|
|
|
|
|
|
DEMARK SCREENS - Daily, Weekly, Monthly Upside/Downside Exhaustion Signals
|
|
|
Daily/Weekly DeMark upside/downside exhaustion signals (Sequential) updated daily, Weekly signals on Monday's and monthly on the first day of the new month. Price flips occur when a stock closes higher/lower than four previous closes and increases conviction of a price turn.
The upside 13's are sell signals and downside 13's are buy signals. Price flip's are confirmation signals that increases potential for a price trend change. For example, if you are long a stock and there is an upside 13, you will want to take cautious action by selling down or out of a position. If initiating a short sale with the upside 13's, we tend to start with a 1/2 size and add with the downside price flip. The opposite is true for when there are downside 13's. Take a 1/2 size position
and add with the upside price flip. The DeMark Indicators are designed to assist the user with buying into weakness and selling into strength to anticipate trend exhaustion. Selling into a rally and buying into a decline often afford the opportunity to exit a trade without too serious a loss if wrong.
S&P 500 Universe:
DAILY UPSIDE 13: BLL
DAILY DOWNSIDE 13: MAS, QRVO, SWKS, VMC
DAILY UPSIDE WITH PRICE FLIP REVERSAL DOWN: CVS, HCA, HES, QCOM, XOM
DAILY DOWNSIDE WITH PRICE FLIP REVERSAL UP: NONE
Updated: 10/8/18
WEEKLY UPSIDE 13: ABC, AES, DISCA, DISCK, EW
WEEKLY DOWNSIDE 13: GM, MAC
MHK
Updated: 10/1/18
MONTHLY UPSIDE 13: ADSK, ALL, CCI, CME, DE, DLR,
DTE, ETN, GLW, HPQ, INTU, PH, TPR, TXT, UPS, XLNX
MONTHLY DOWNSIDE 13: NONE
Euro Stoxx 600 Universe:
DAILY UPSIDE 13: HSX LN, REE
SM
DAILY DOWNSIDE 13: DUE GR, EMSN SW, HEIA NA, HTO GA, LI FP, PST IM, RMV LN
DAILY UPSIDE WITH PRICE FLIP REVERSAL DOWN: DOKA SW, MRK GR, TLW LN
DAILY DOWNSIDE WITH PRICE FLIP REVERSAL UP: NONE
Updated: 10/8/18
WEEKLY UPSIDE 13: NONE
WEEKLY DOWNSIDE 13: AMS SW, GPOR LN
Updated: 10/1/18
MONTHLY UPSIDE 13: BNZL LN, EXPN LN, FPE3 GR, SBMO NA, SECUB SS, SWEDA SS
MONTHLY DOWNSIDE 13: BAYN GR, HMB SS, TEF SM
|
|
|
Unsubscribe me from Hedge Fund Telemetry
Hedge Fund Telemetry LLC, P.O. Box 4675, Greenwich, CT 06861, United States
CONFIDENTIALITY NOTE and DISCLAIMER: This message is for the named person's use only. It may contain confidential, proprietary or legally privileged material. No confidentiality or privilege is waived by any accidental or unintentional transmission. If you receive this message in error, please immediately delete it and all copies of it from your system, destroy any hard copies and notify the sender. You must not, directly or indirectly, use, disclose,
distribute, print or copy any part of this message if you are not the intended recipient. Hedge Fund Telemetry LLC. cannot guarantee the confidentiality of the material transmitted; therefore, information of a sensitive or confidential nature should not be transmitted. There is risk in trading markets. Hedge Fund Telemetry LLC reports are based on information gathered from various sources and believed to be reliable, but are not guaranteed as to accuracy and completeness. The information is subject to change without notice and Hedge Fund Telemetry LLC has no obligation to provide any updates or changes. Hedge Fund Telemetry LLC is providing this data for informational and educational purposes and does not believe that it is sufficient to base an investment decision on. This information should not be regarded as a solicitation or recommendation of any particular security or to engage in any trading strategy. One should always check with your licensed financial
advisor to determine suitability of any investments.
|
|
|
|
|