|
|
|
|
|
|
|
|
This story that came out today involving tiny semiconductor chips implanted into circuit boards by China to spy on US companies (and perhaps the US government) is really astounding but not that surprising. China has always used these types of tactics and fears over Chinese networking equipment have been around for years. Considering the story mentions
Apple and Amazon and 28 other US companies brings it close to home. This comes at a very tricky time as relations with China are extremely acrimonious. This is red meat for President Trump. There has been chatter that Trump and Xi would meet at the G20 but if it happens, it would only be to thaw the ice and perhaps restart talks. So much groundwork would have to happen before any trade deal is reached.
The bond market dipped rather sharply yesterday after the better ISM data showing a very strong US economy. This follows a better ADP jobs report which tends to lead the way for Friday's big NFP employment report. If this number is better than the 204k consensus then Fed Chairman Powell will continue his hawkish comments and perhaps other Fed speakers will also turn up the hawkish talk to prepare the markets for
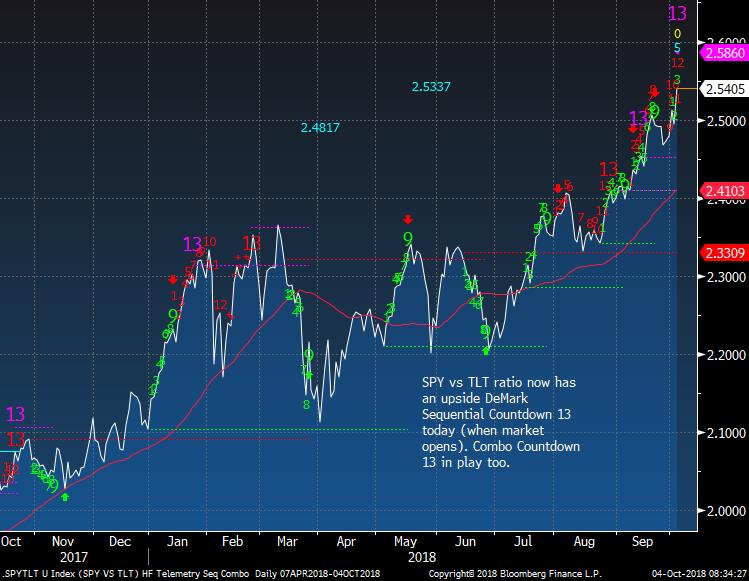
more rapid rate hikes. There have been two narratives with the bond markets that I do not believe. First, there was the old great rotation from bonds into stocks that I don't think is happening with both bonds and stocks down together. This has been a buyback driven market driven by ultra low interest rates so higher rates could limit future expansion in buybacks funded by debt. Second, the US 10 year Commitment of Traders report has shown a very large speculator short position and people like Jeff Gundlach as well recently Hedge Eye have jumped on the "short squeeze potential" bandwagon. I consulted with a bunch of friends who have shown me how some large players are long cash and short futures taking the spread (simplified explanation I know) and how in dis-aggregated data shows within the speculators asset managers are very long while hedge funds are very short so it is more of a wash. And proof is in the trading action. The 10 year has moved nearly
40bps from when Jeff Gundach in August came out with his thesis. Bond sentiment has dipped to 43% as of last night and still could go lower while there are many bond proxies with or near DeMark exhaustion signals. My view is to wait for an up day in the bond market first to dip your toes in on the long side. I have quite a few charts that are important today on the bottom of the report that you should definitely check out.
The equity markets are falling in the US and as I write this the S&P is now down over 1% and there hasn't been a 1% drop in over a quarter. I've feared a trap door type of day and even with the markets down relatively hard today, markets tend to fall harder (or crash) when oversold. Fear in the VIX index is starting to show but it's still to early to tell and certainly tomorrow's NFP report could bounce the equity markets or smack it lower. I just don't know. Again, please set tight stops on longs and have a decent percentage
of cash as there will be lower prices to buy. I'm going to do a webinar next week and will send out details Monday.
- US Markets - Sentiment remains too high to say oversold. Upside DeMark exhaustion signals near but might just run out of upside, Nasdaq Summation Index is now negative
and this is a bad sign, Preview of new sentiment charts!
- Hedge Fund Telemetry Trade Ideas - No changes with my most bearish exposure since January.
- Smart Index - My take on what to look for long term
- Apple
Update
- PPO Monitor - Percentage Price Oscillator Force Ranked Sector Rotation - More ETF's are under the 10 and 20 day showing real weakness and NOT oversold
- Bloomberg Technical Pattern Recognition Screen
- Currency Update - Chopping around
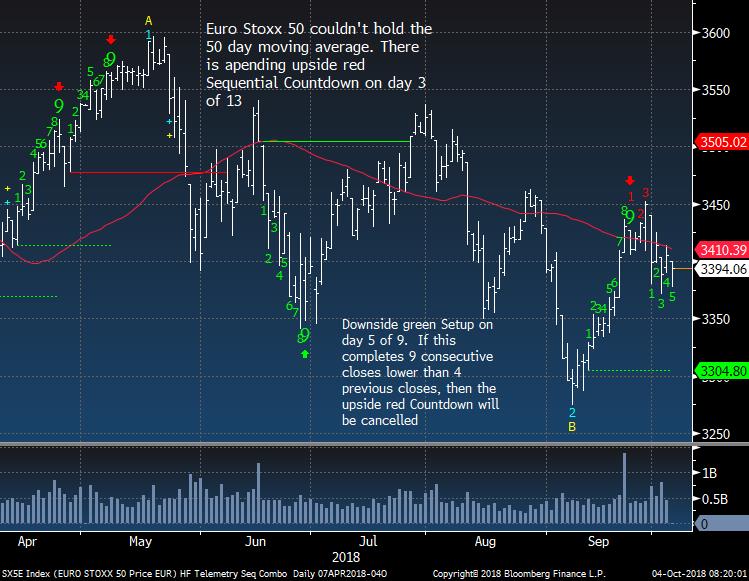
- European Market Update - lower highs continue
- Global Market Update - EEM fading again, India Nifty 50 really looks weak
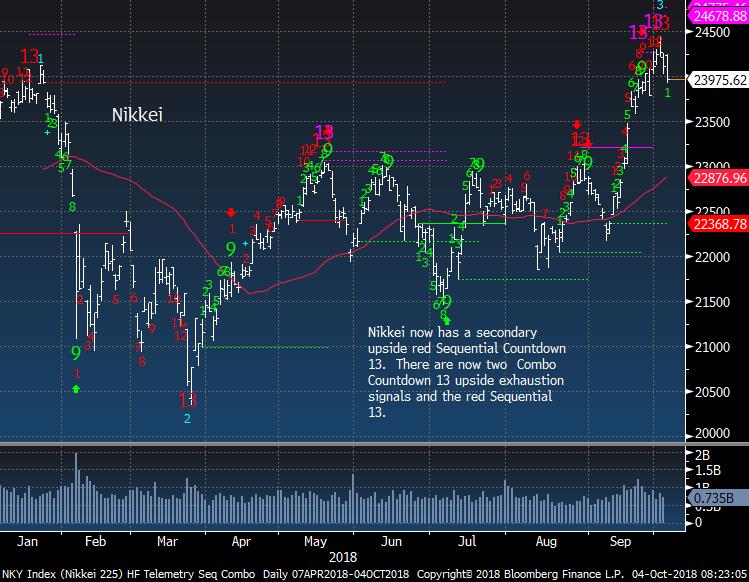
- Asian Market Update - Nikkei reversing after upside DeMark exhaustion, Nikkei and US 10 year correlation
- Crude Update - Brent with upside DeMark exhaustion and WTI is close. Sell your longs
- Gold Update - Still sideways which doesn't seem so bad today
- Bond Update - VERY IMPORTANT ACTION WITH MANY DEMARK EXHAUSTION
SIGNALS
- DeMark Screens - Daily, Weekly, Monthly upside/downside exhaustion signals within the S&P 500 and Euro Stoxx 600 September Monthly data updated
|
|
|
|
|
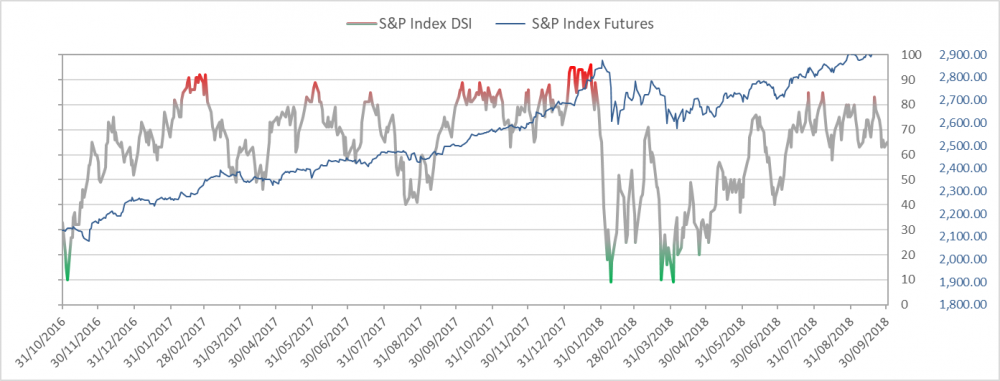
Here's a link to the Hedge Fund Telemetry market sentiment page with 40 charts of sentiment including equities, bonds, currencies, and commodities updated each day. When the new website launches we will be adding new charts and historical sentiment data for Euro Stoxx 50, UK FTSE 100, German DAX, French Cac 40. We will be adding Japanese Bonds, German Bunds, and a few more.
SPX bullish sentiment is at 63% and still pretty high - "Catch down" scenario in play
|
|
|
|
|
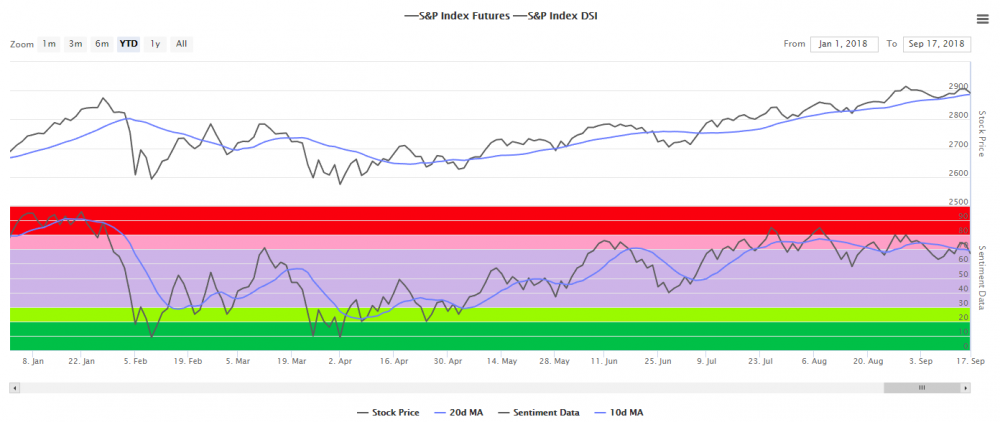
Here's a preview of the new sentiment charts we will have on the website very soon. We created these where you can adjust the dates for historical data. There are also both the market and sentiment on each of the 45 markets!
|
|
|
|
|
|
|
|
|
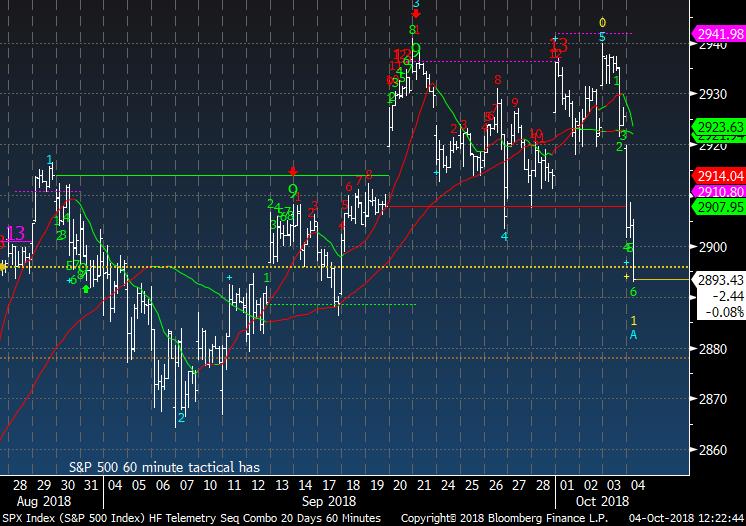
SPX 60 minute tactical chart was giving me over the last week concerns with the several upside DeMark exhaustion signals that trap door could come before the daily upside signals.
|
|
|
|
|
|
|
|
|
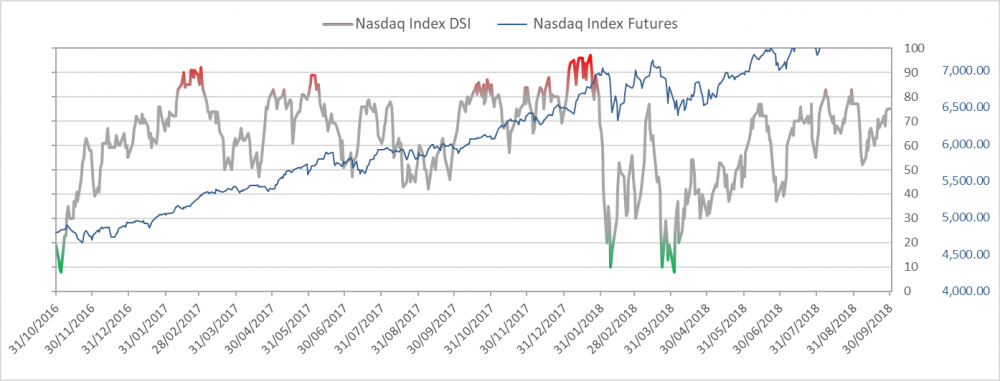
Nasdaq bullish sentiment is at 73% and will be crushed later today
|
|
|
|
|
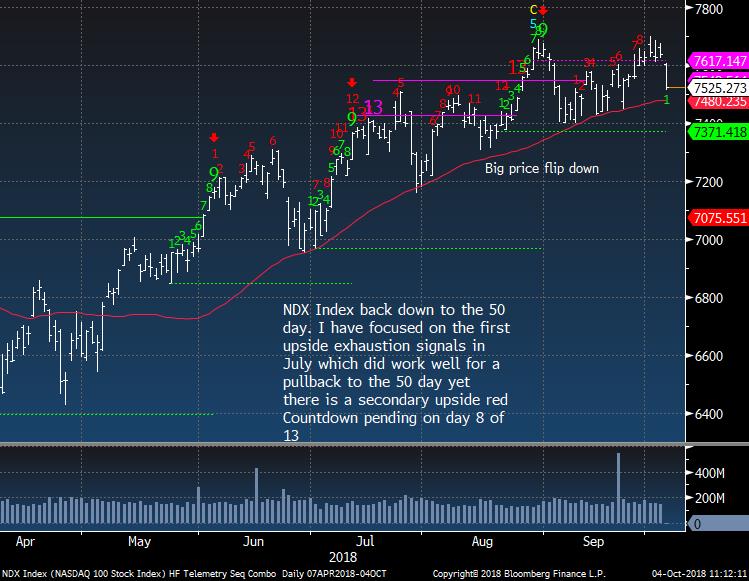
NDX Index price flip down
|
|
|
|
|
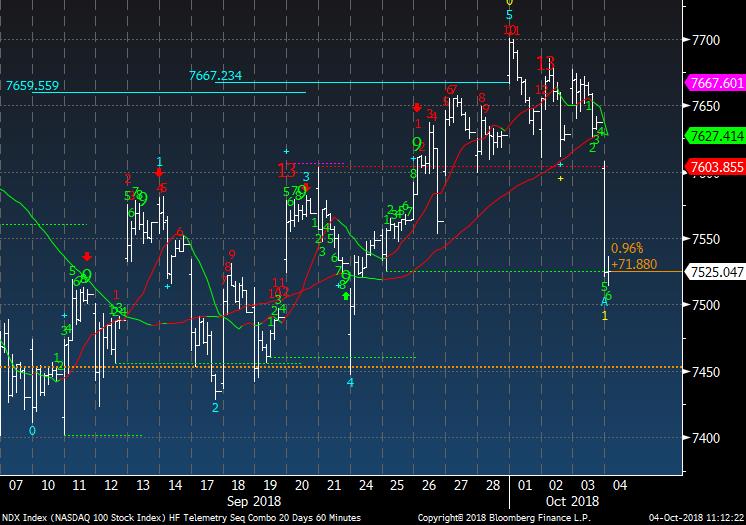
NDX also had 60 min time frame upside exhaustion signals too
|
|
|
|
|
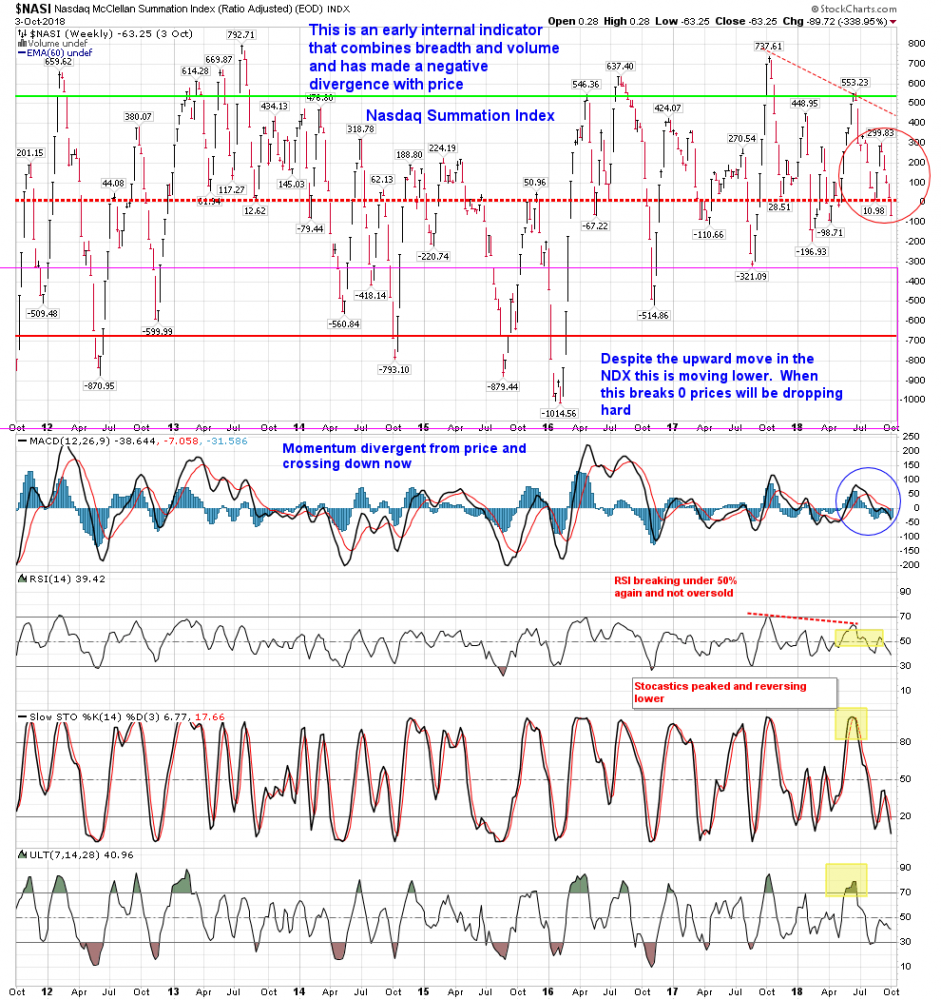
Nasdaq Summation Index is an early warning indicator that mixes breadth and volume. It was crazy to me that this was dropping while the index has remained bid. It's now under zero and this is when the market tends to drop faster and harder.
|
|
|
|
|
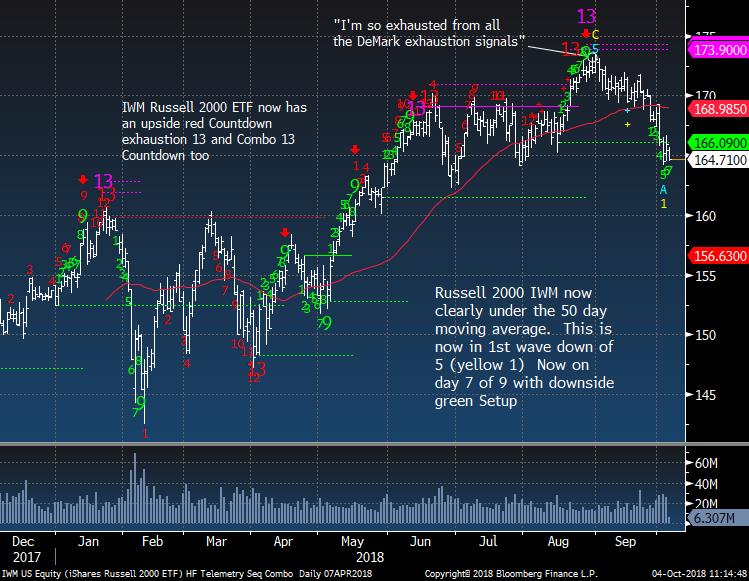
IWM Russell 2000 has rolled over. I had several non DeMark users mock me on Twitter recently about how the DeMark indicators don't work. I just ignore them and stay focused.
|
|
|
|
|
|
|
Hedge Fund Telemetry Trade Ideas
|
|
|
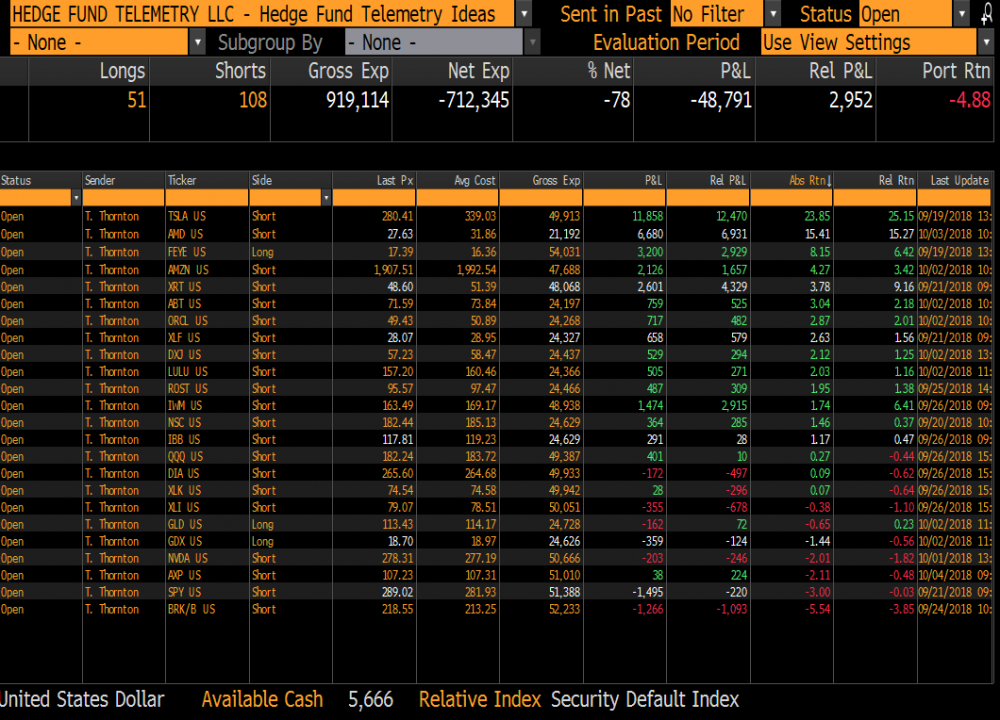
Trade Ideas Sheet - Long and short US equity ideas including ETF's. We will be overhauling the Trade Ideas Sheets for long only, short only, ETF's when the new website rolls out soon. There will also be a clearer email distribution with changes.
Trade Ideas Changes: No changes today.
Stops on everything. TSLA 320, GDX 17.35 , FEYE 16.00, NVDA 295, QQQ 190 (raised stop), XLK 79 (raised stop), SPY 295, XLY 118, AXP 114, XRT 53, IWM 172, XLV 95, BRK/B 225, DIA 275, XLI 81.50, IBB 123, AMD 30 (lowered stop), ROST 100.50, ABT 76, ORCL 53, LULU 165, AMZN 1990 (lowered stop to breakeven), DXJ 61, GLD 111
|
|
|
|
|
|
|
My take on the Smart Index
|
|
|
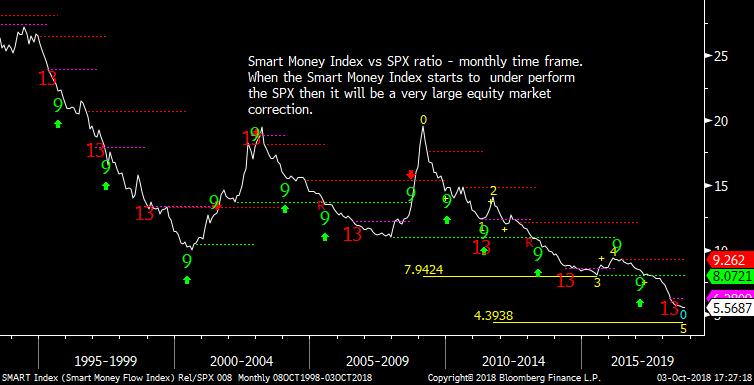
The Smart Index compares the first 30 minutes of the Dow vs the last hour. It's been dropping. This chart is a ratio of the Smart Index vs SPX on a monthly time frame. When the Smart Index starts to out perform the SPX and the line lifts the market is in a severe bear market. Hasn't happened... yet
|
|
|
|
|
|
|
|
|
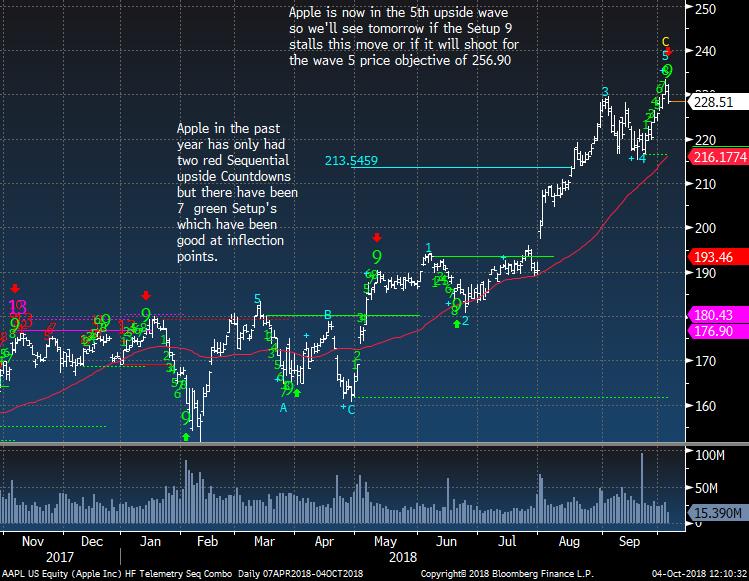
Apple has a green Setup 9 and I said yesterday that the Setup 9 could be a short term top
|
|
|
|
|
|
|
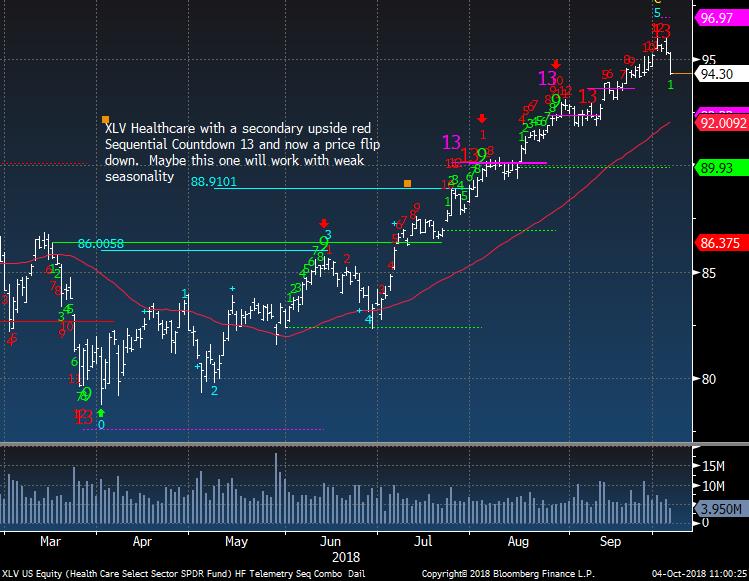
US Sector Focus - Healthcare
|
|
|
XLV has ignored several DeMark signals but today there is a big price flip down
|
|
|
|
|
|
|
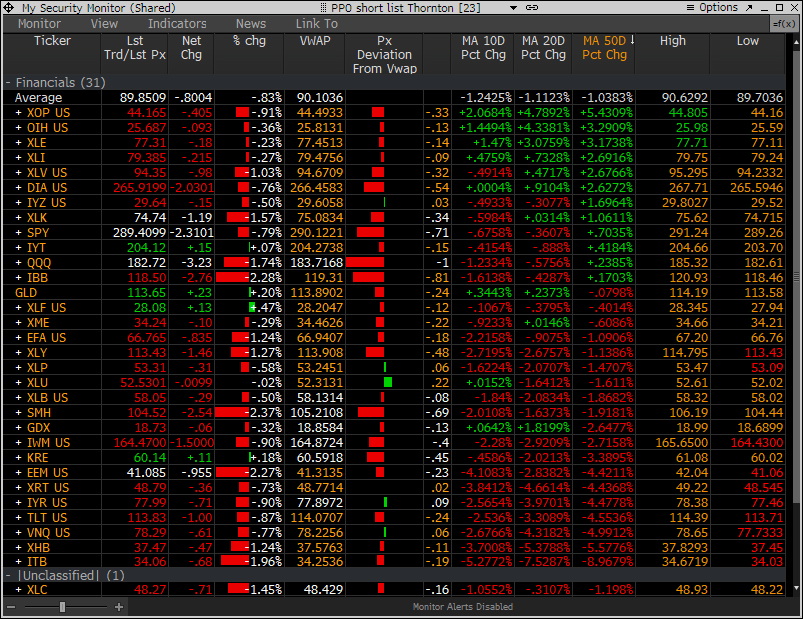
PPO Monitor - Percentage Price Oscillator
|
|
|
The PPO Monitor is a proprietary monitor developed to force rank Indexes, Sectors, and Stocks. It ranks top down by strongest to weakest by percentage above/below the 50 day moving average. Shorter term signals can be seen when the 10 and 20 day moving averages turn up (green) or down (red) which often are followed by the 50 day moving average. This is useful to watch for historically overbought/oversold percentage above/below the 50 day moving average. It is
non correlated with the DeMark Indicators however we have found upside/downside exhaustion signals often occur when something rises to the top or drifts to the bottom of the monitor - increasing the timing aspect. We share this monitor with clients with Bloomberg Terminals. An added feature is that each market/ETF can be expanded with each component force ranked in the same way. A couple other features include price deviation from intraday VWAP (useful for intraday reversals) and new 20 day highs/lows on right side. Please inquire if you would like to be permissioned to use the PPO Monitor.
Today's highlights: A lot more sectors are under the 10 and 20 day. And more than half are under the 50 day. A GOOD OVERSOLD READING IS WHEN THE AVERAGE BELOW THE 50 DAY IS 5%. IT'S ONLY 1% BELOW NOW.
|
|
|
|
|
|
|
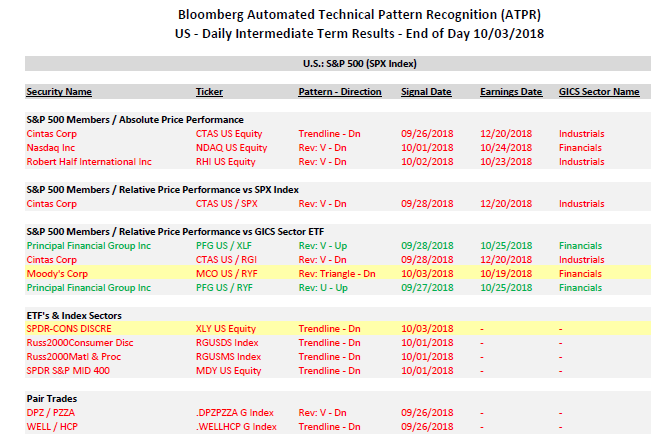
Bloomberg Automated Technical Pattern Recognition Screens
|
|
|
S&P 500 Members/Absolute Price Performance and Relative Price Performance vs S&P 500 and Sector ETF's. ETF's vs Index Sectors. Pair Trades. Long side is first symbol, short side is second symbol.
|
|
|
|
|
|
|
|
|
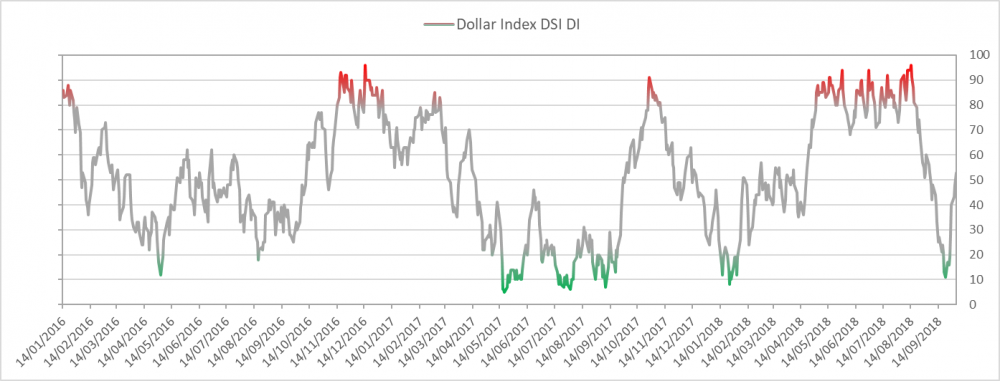
US Dollar bullish sentiment is at 53%
|
|
|
|
|
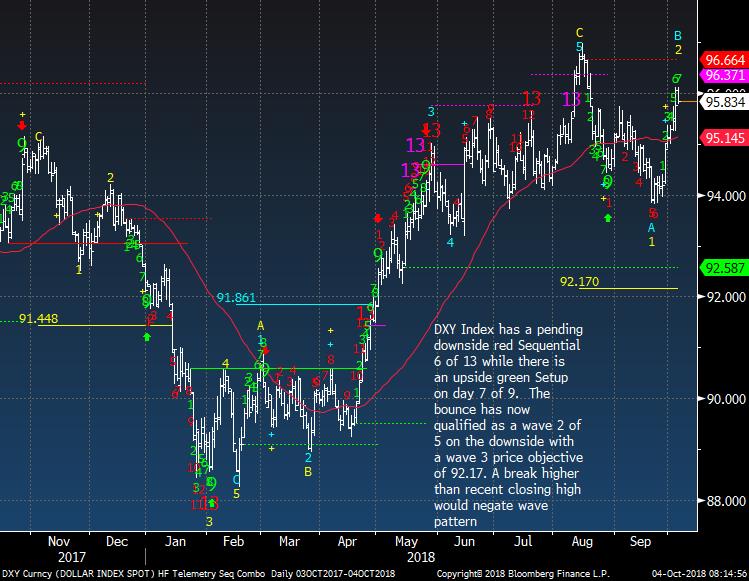
US Dollar Index has some important wave comments below
|
|
|
|
|
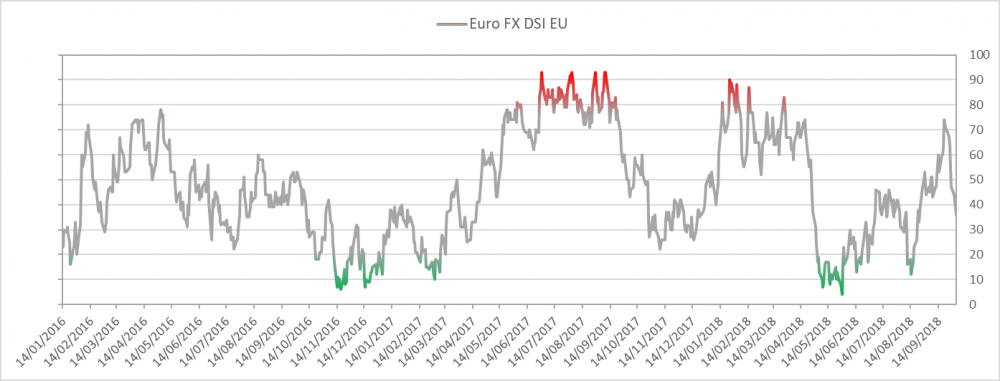
Euro bullish sentiment is at 36% and has dipped from recent high
|
|
|
|
|
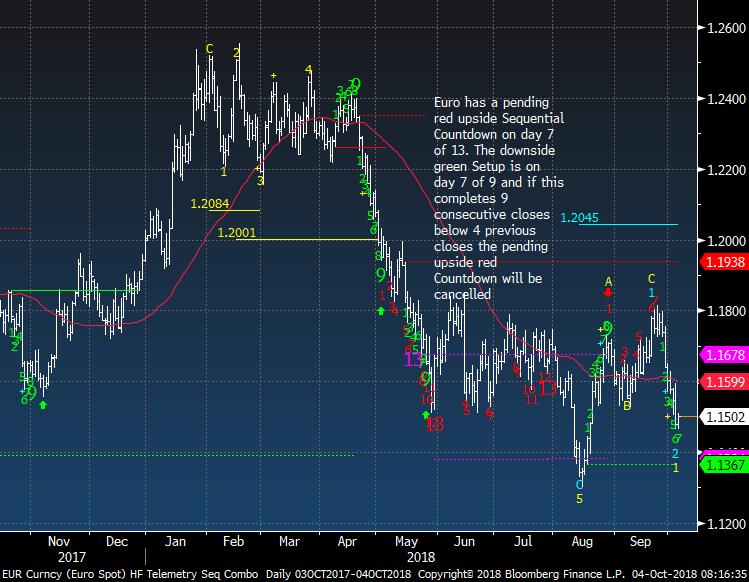
Euro Spot question is if this will hold the recent low
|
|
|
|
|
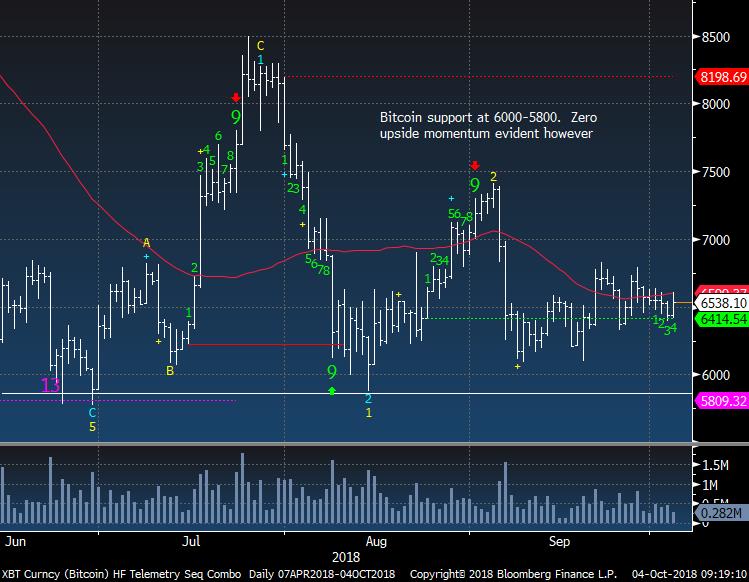
Bitcoin really just needs to hold the 6000-5800 level
|
|
|
|
|
|
|
|
|
Euro Stoxx 50 lower highs continue
|
|
|
|
|
|
|
|
|
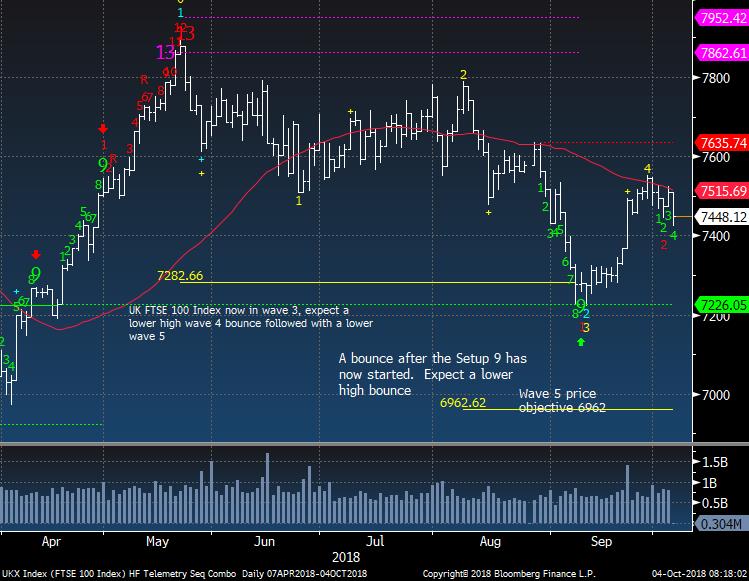
UK FTSE has a deeper wave 5 price target
|
|
|
|
|
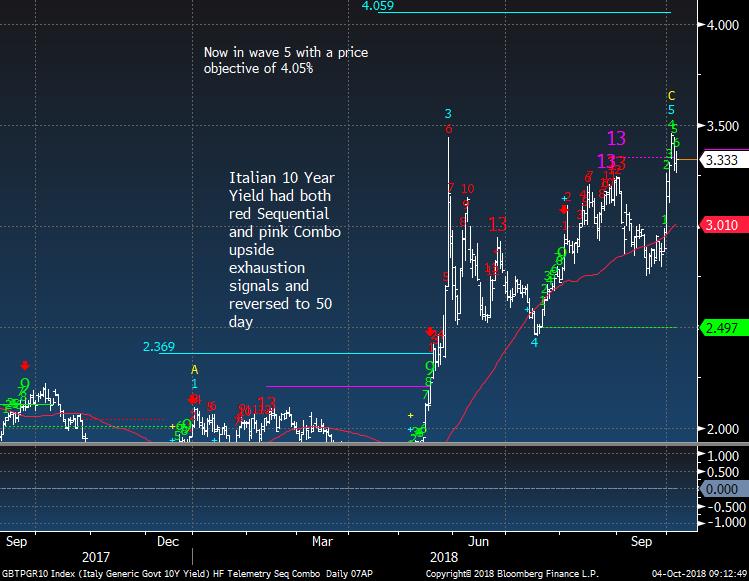
Italian 10 year could continue higher
|
|
|
|
|
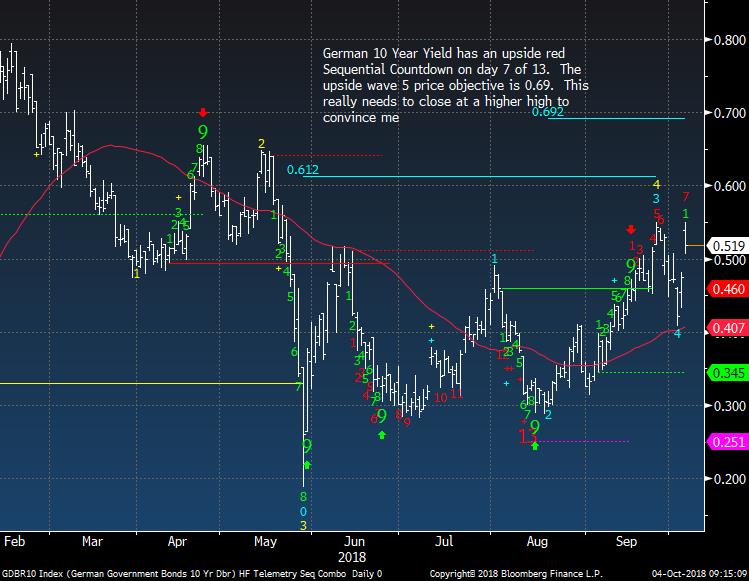
German 10 year could work higher too
|
|
|
|
|
|
|
|
|
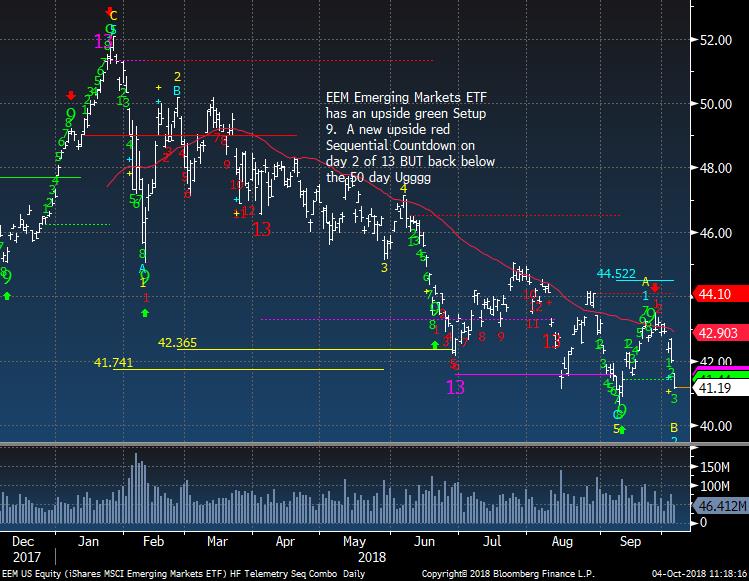
EEM Emerging Markets ETF just failed and if long I'd go to cash on this for now
|
|
|
|
|
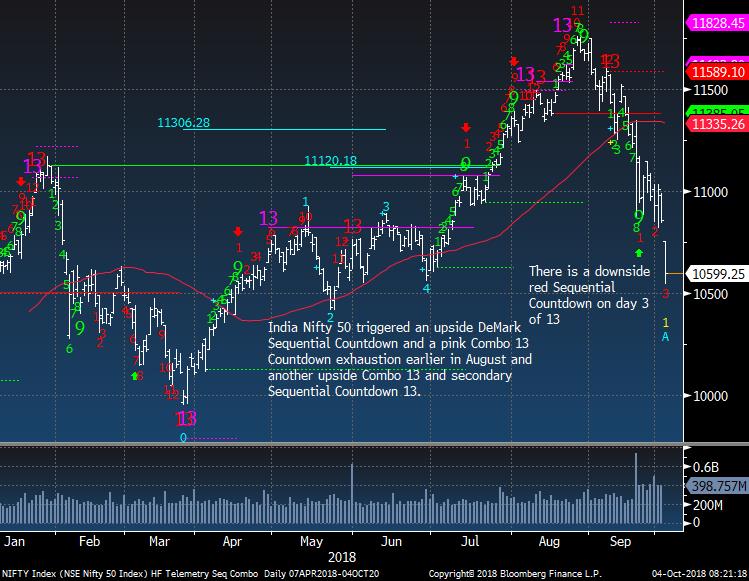
India Nifty 50 continues down and has more downside ahead
|
|
|
|
|
|
|
|
|
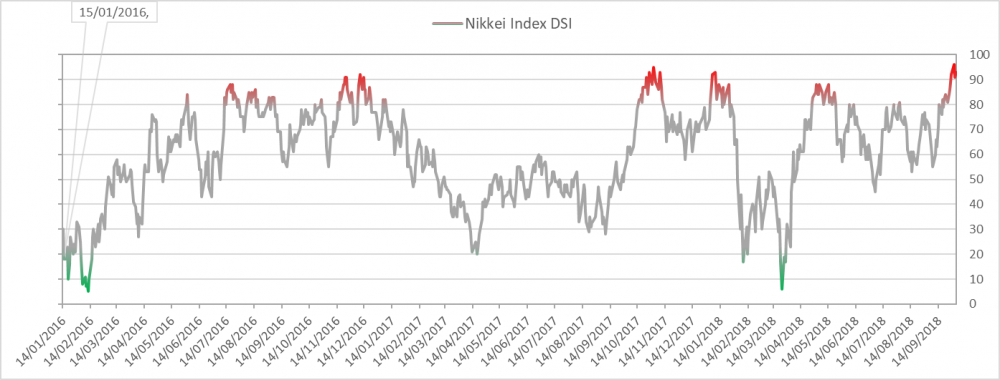
Nikkei bullish sentiment is at 93% and VERY extreme. This is going to come down hard
|
|
|
|
|
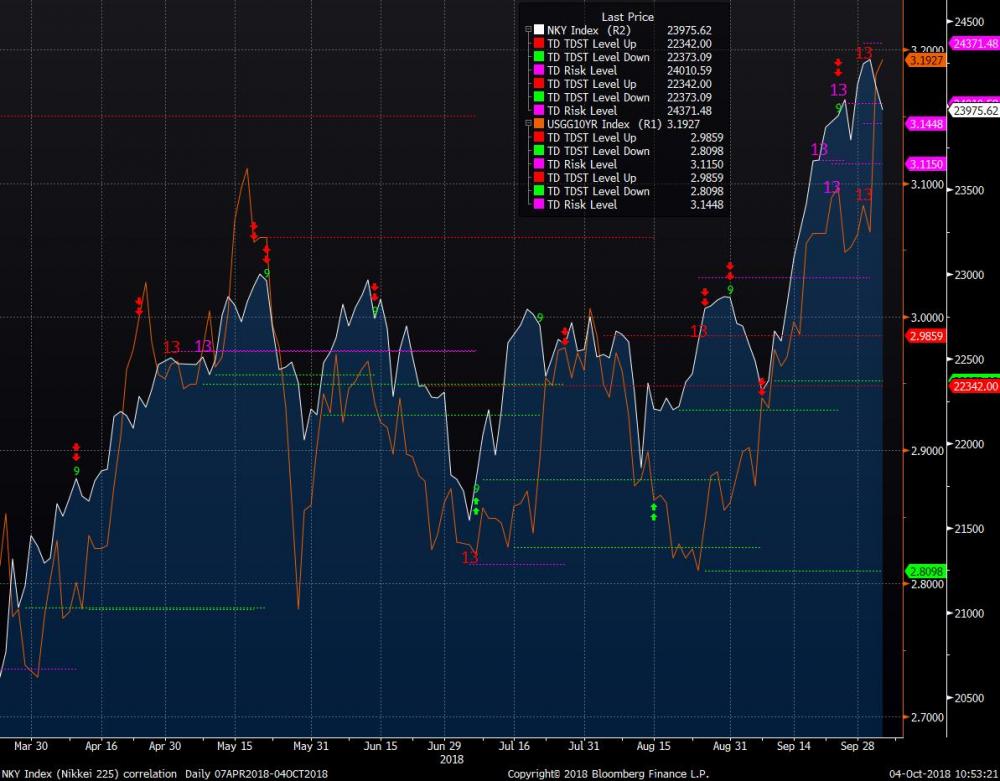
Nikkei and US 10 year yield correlation. Both have upside exhaustion signals too
|
|
|
|
|
|
|
|
|
|
|
|
|
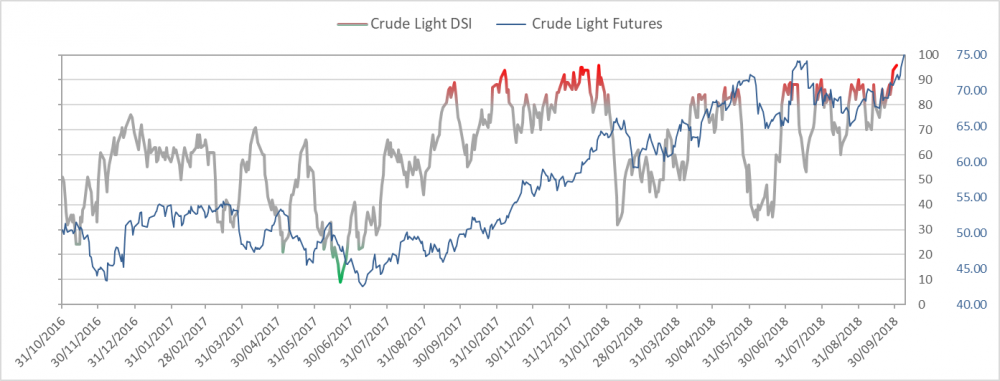
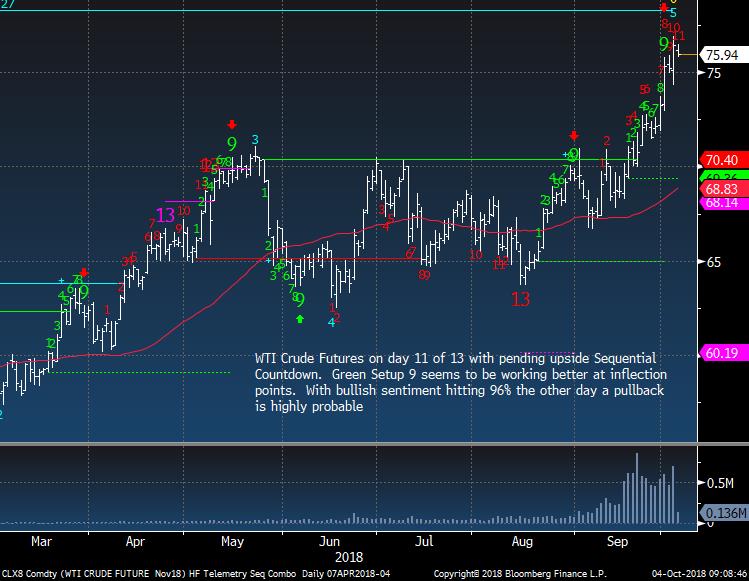
Crude bullish sentiment is at 94% and also VERY extreme
|
|
|
|
|
|
|
|
|
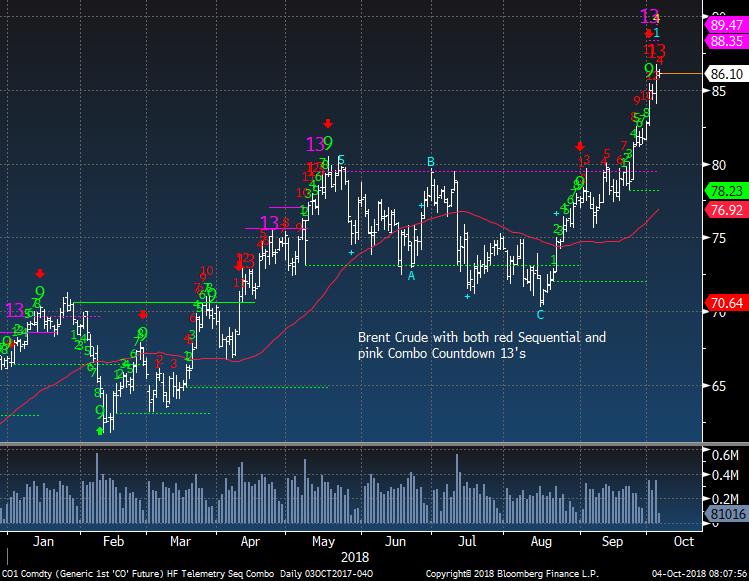
Brent Crude upside exhaustion signals. Sell
|
|
|
|
|
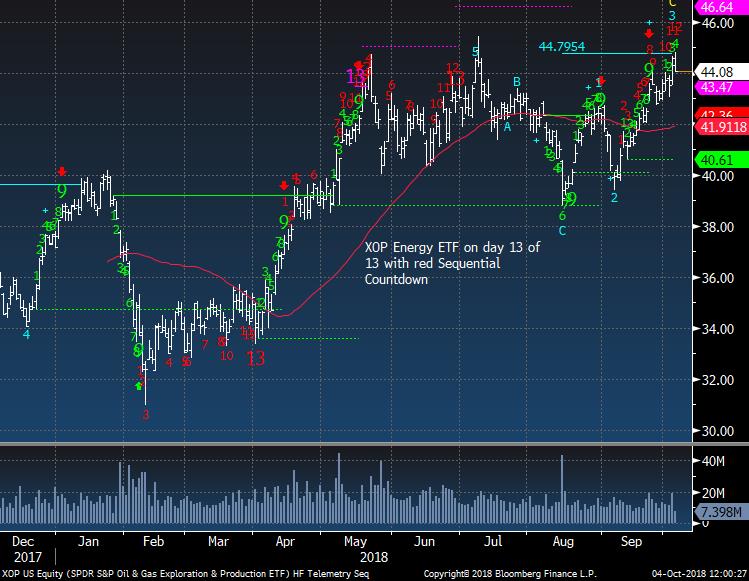
XOP Energy ETF is on the top of the PPO monitor and most overbought and is on day 12 of 13 too with an upside Countdown. Sell
|
|
|
|
|
|
|
|
|
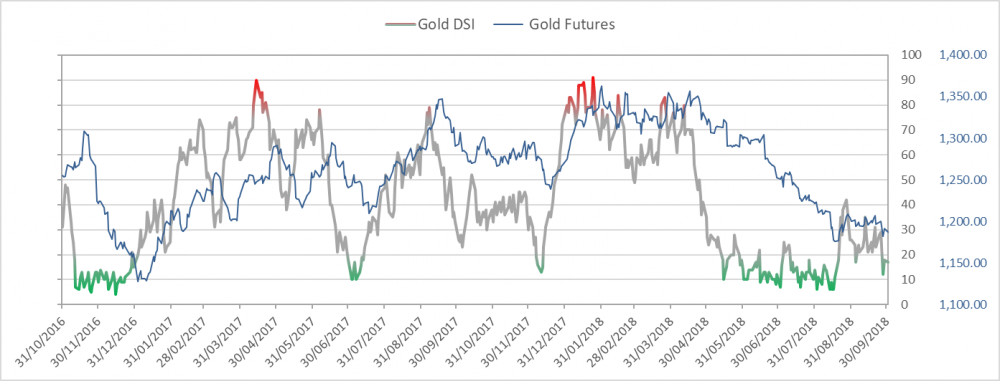
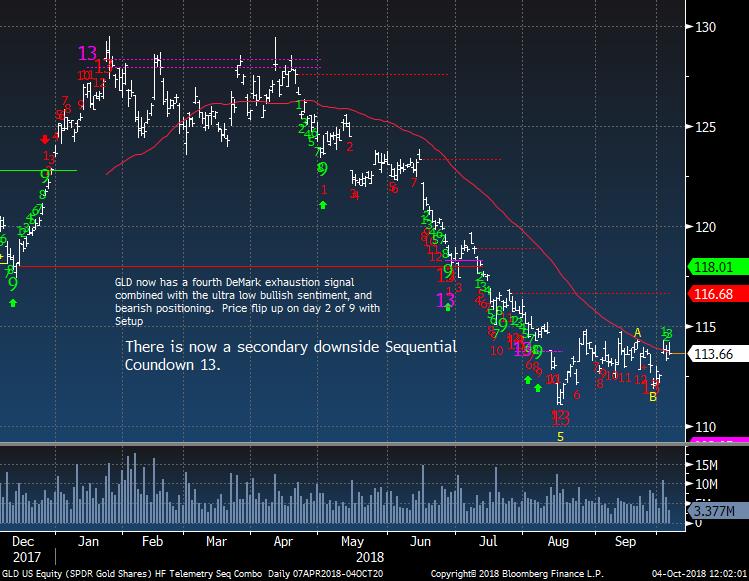
Gold bullish sentiment is at 14% and pretty oversold
|
|
|
|
|
Gold GLD is sideways to slightly up. That's OK with me as I'll stay long
|
|
|
|
|
|
|
|
|
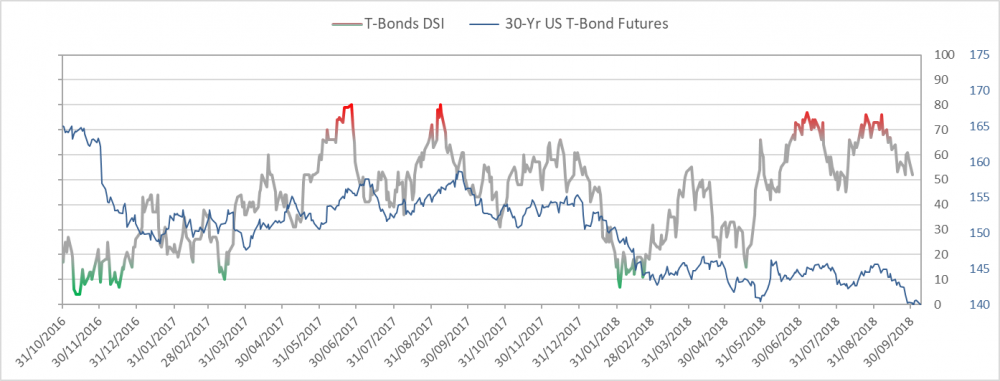
Bond bullish sentiment is at 43% and back to June lows. There is a risk this can continue to a very oversold level (20%)
|
|
|
|
|
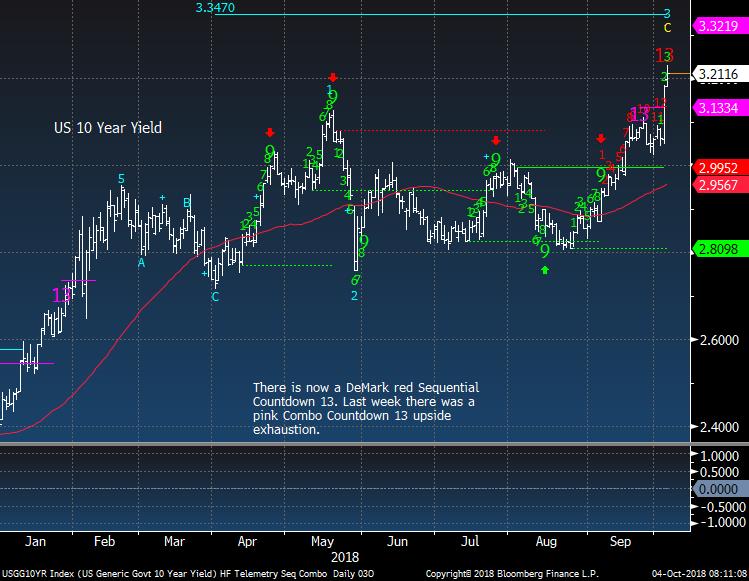
US 10 Year Yield upside exhaustion. I would WAIT for an up day on any of the bond proxies to start buying and even better a price flip to confirm to add
|
|
|
|
|
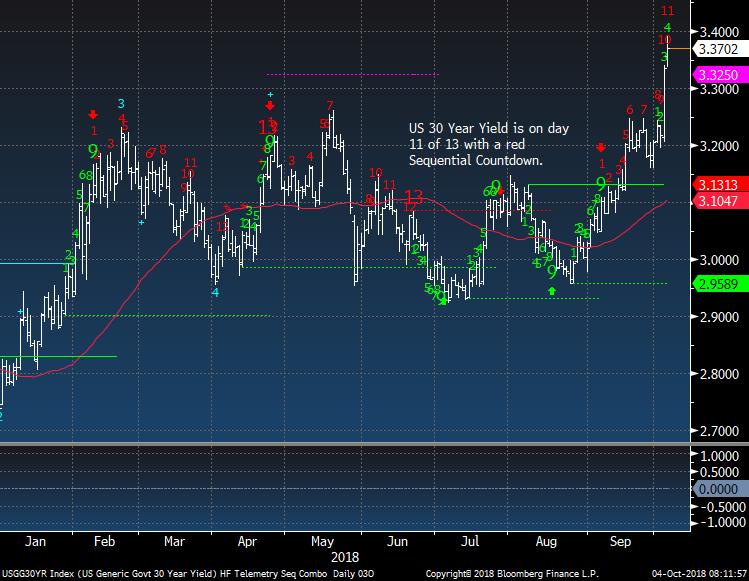
US 30 Year Yield on day 11 of 13
|
|
|
|
|
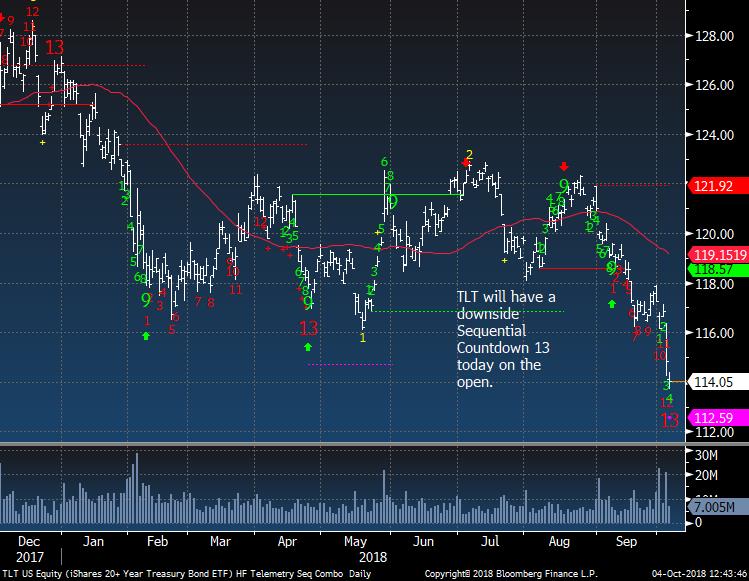
TLT downside Countdown 13
|
|
|
|
|
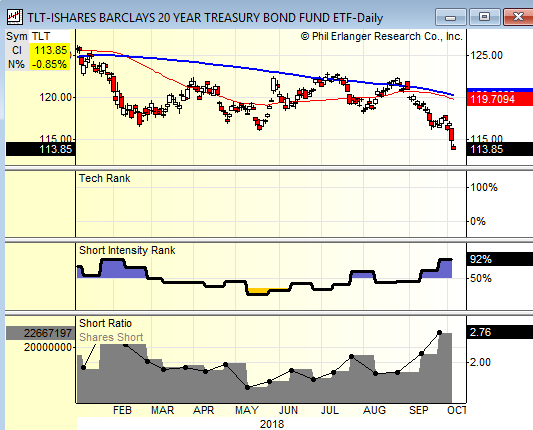
TLT short interest is relatively high with the Erlanger short intensity rank at 92%. This has potential for a squeeze
|
|
|
|
|
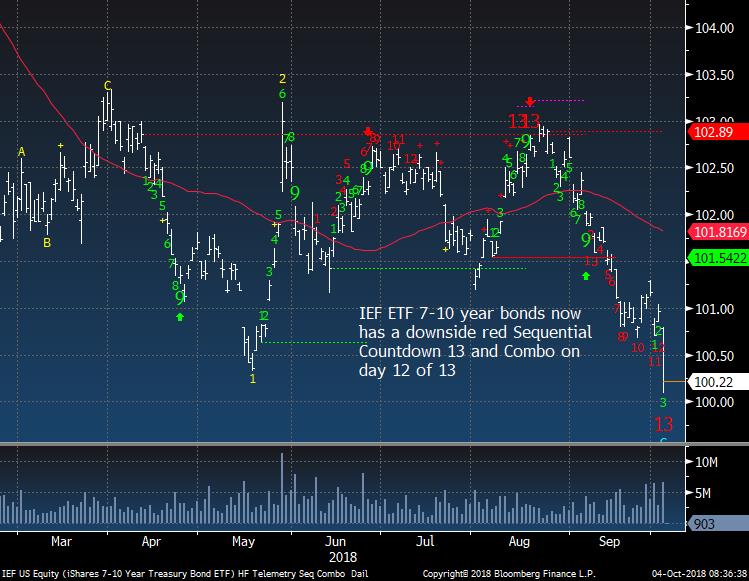
IEF also with a downside Countdown 13
|
|
|
|
|
|
|
DEMARK SCREENS - Daily, Weekly, Monthly Upside/Downside Exhaustion Signals
|
|
|
Daily/Weekly DeMark upside/downside exhaustion signals (Sequential) updated daily, Weekly signals on Monday's and monthly on the first day of the new month. Price flips occur when a stock closes higher/lower than four previous closes and increases conviction of a price turn.
The upside 13's are sell signals and downside 13's are buy signals. Price flip's are confirmation signals that increases potential for a price trend change. For example, if you are long a stock and there is an upside 13, you will want to take cautious action by selling down or out of a position. If initiating a short sale with the upside 13's, we tend to start with a 1/2 size and add with the downside price flip. The opposite is true for when there are downside 13's. Take a 1/2 size position
and add with the upside price flip. The DeMark Indicators are designed to assist the user with buying into weakness and selling into strength to anticipate trend exhaustion. Selling into a rally and buying into a decline often afford the opportunity to exit a trade without too serious a loss if wrong.
S&P 500 Universe:
DAILY UPSIDE 13: QCOM
DAILY DOWNSIDE 13: SCRL, WY
DAILY UPSIDE WITH PRICE FLIP REVERSAL DOWN: ABT, BDX, PKI, PLD, V
DAILY
DOWNSIDE WITH PRICE FLIP REVERSAL UP: CBRE, CMA, FITB
Updated: 10/1/18
WEEKLY UPSIDE 13: BSX, HOLX, NKE, TDG
WEEKLY DOWNSIDE 13: NONE
Updated: 10/1/18
MONTHLY UPSIDE 13: ADSK, ALL, CCI, CME, DE, DLR, DTE, ETN, GLW, HPQ, INTU, PH, TPR, TXT, UPS, XLNX
MONTHLY DOWNSIDE 13: NONE
Euro Stoxx 600 Universe:
DAILY UPSIDE 13: EDF FP, QQ/ LN, SEV FP
DAILY DOWNSIDE 13: LAND LN, MRL SM
DAILY UPSIDE WITH PRICE FLIP REVERSAL DOWN: LUX IM, MGGT LN, NCCB SS, SWEDA SS
DAILY DOWNSIDE WITH PRICE FLIP REVERSAL UP: ABI BB, INDV LN
Updated: 10/1/18
WEEKLY UPSIDE 13: HELN SW, SKY LN
WEEKLY DOWNSIDE 13: FNTN GR
Updated: 10/1/18
MONTHLY UPSIDE 13:
BNZL LN, EXPN LN, FPE3 GR, SBMO NA, SECUB SS, SWEDA SS
MONTHLY DOWNSIDE 13: BAYN GR, HMB SS, TEF SM
|
|
|
Unsubscribe me from Hedge Fund Telemetry
Hedge Fund Telemetry LLC, P.O. Box 4675, Greenwich, CT 06861, United States
CONFIDENTIALITY NOTE and DISCLAIMER: This message is for the named person's use only. It may contain confidential, proprietary or legally privileged material. No confidentiality or privilege is waived by any accidental or unintentional transmission. If you receive this message in error, please immediately delete it and all copies of it from your system, destroy any hard copies and notify the sender. You must not, directly or indirectly, use, disclose,
distribute, print or copy any part of this message if you are not the intended recipient. Hedge Fund Telemetry LLC. cannot guarantee the confidentiality of the material transmitted; therefore, information of a sensitive or confidential nature should not be transmitted. There is risk in trading markets. Hedge Fund Telemetry LLC reports are based on information gathered from various sources and believed to be reliable, but are not guaranteed as to accuracy and completeness. The information is subject to change without notice and Hedge Fund Telemetry LLC has no obligation to provide any updates or changes. Hedge Fund Telemetry LLC is providing this data for informational and educational purposes and does not believe that it is sufficient to base an investment decision on. This information should not be regarded as a solicitation or recommendation of any particular security or to engage in any trading strategy. One should always check with your licensed financial
advisor to determine suitability of any investments.
|
|
|
|
|