|
|
|
|
|
|
Five Very Important Data Points
|
|
|
Here's five important data points that I'm seeing right now.
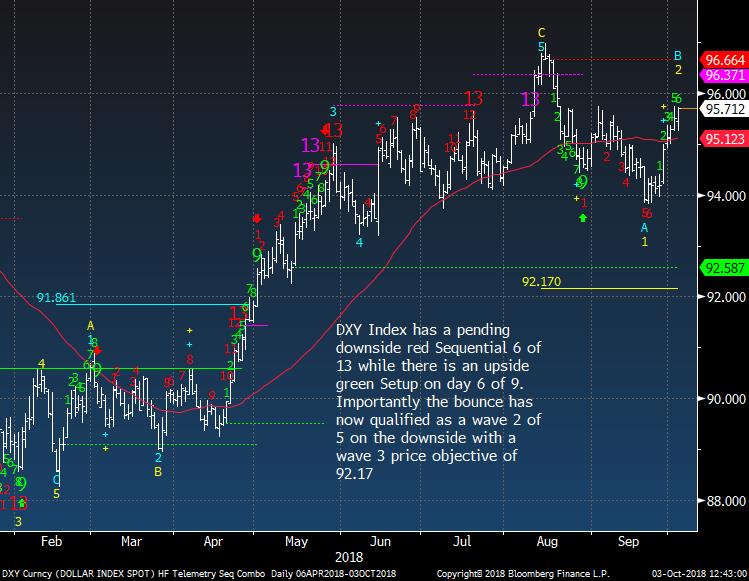
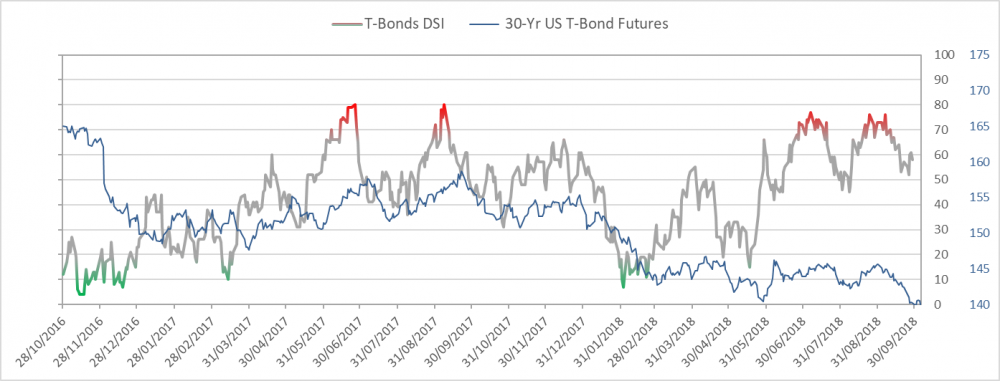
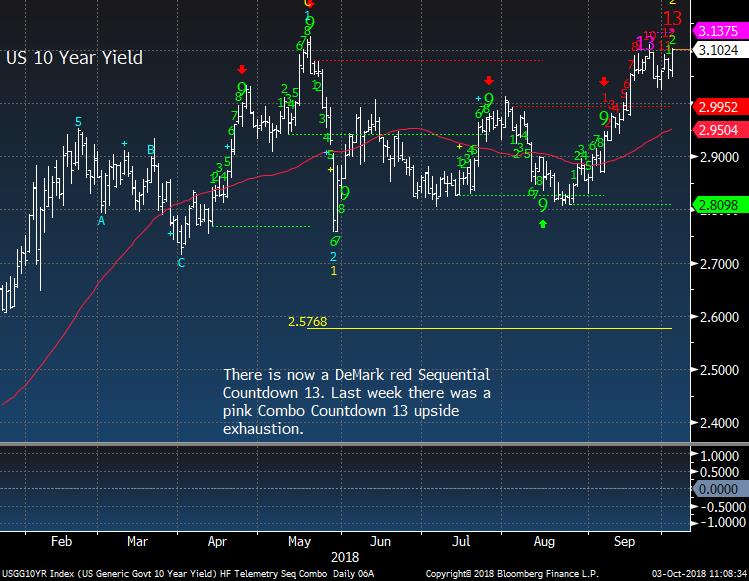
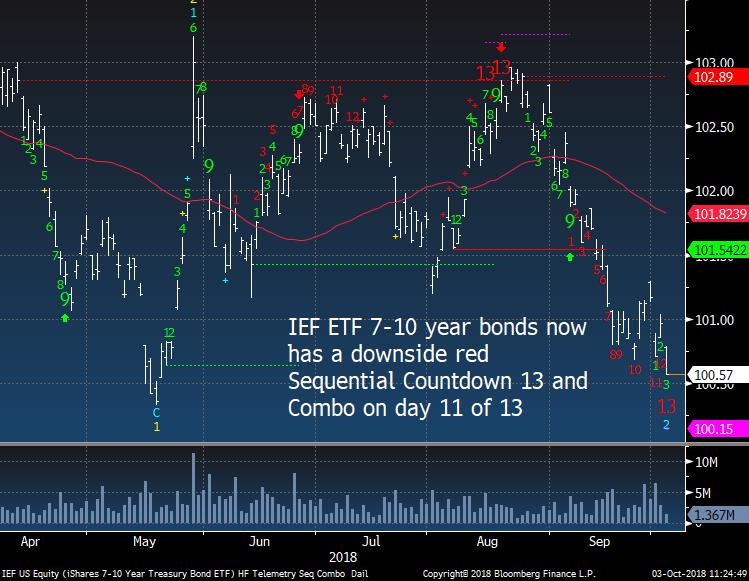
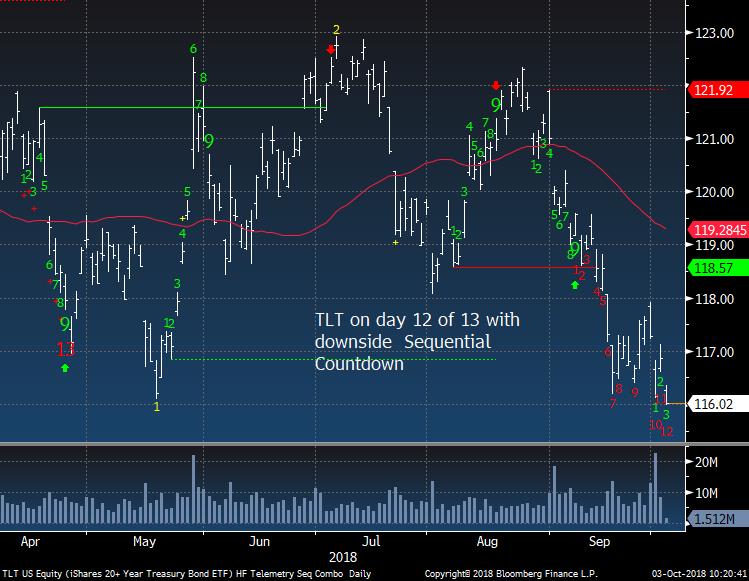
First, bonds are bottoming with yields nearly at peak levels. The US 10 year yield has an upside DeMark Countdown 13 today. The IEF (7-10 year ETF) has a downside Countdown 13 too. TLT is on day 12 of 13. Bullish sentiment for bonds has remained buoyant despite the bond weakness. The "large bearish COT positioning" potential short squeeze does not really exist as I have discussed recently but a bond bounce is highly probable.
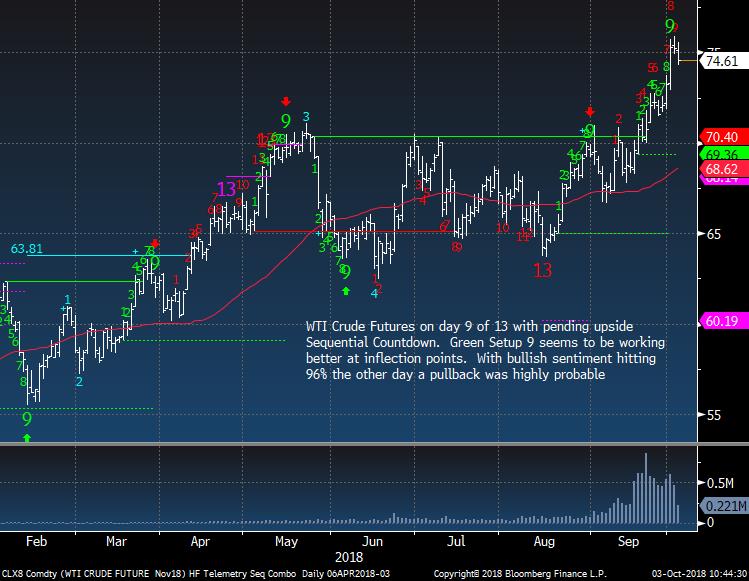
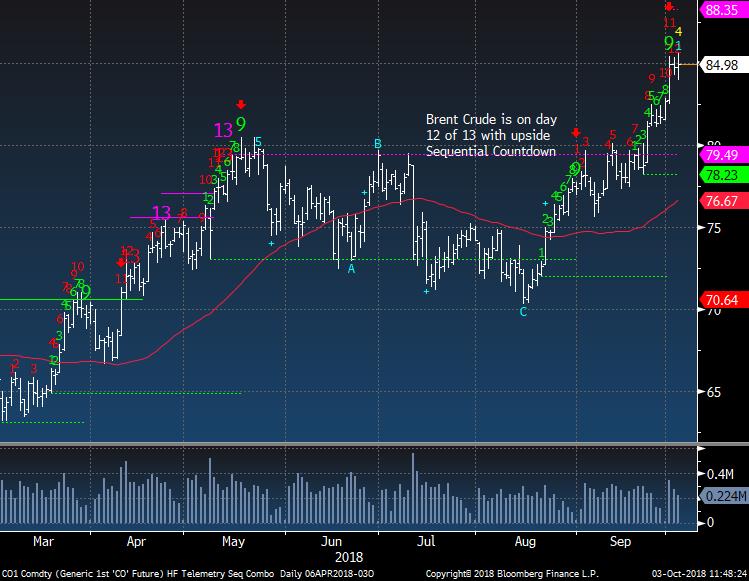
Second, crude bullish sentiment reached 96% this week. This is extreme and the other day I said it's a bell ringer. There still is a little potential for a little more upside since there is a pending upside DeMark Countdown late in the move with Brent and WTI. Energy stocks should follow on the downside soon too.
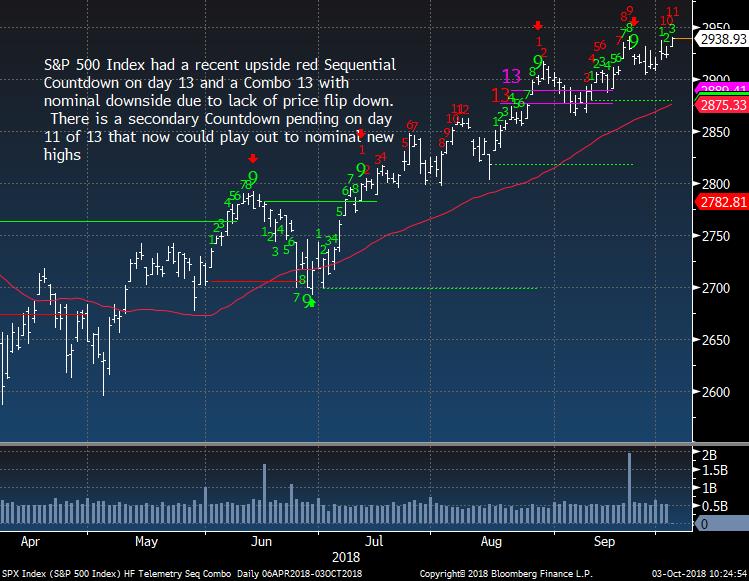
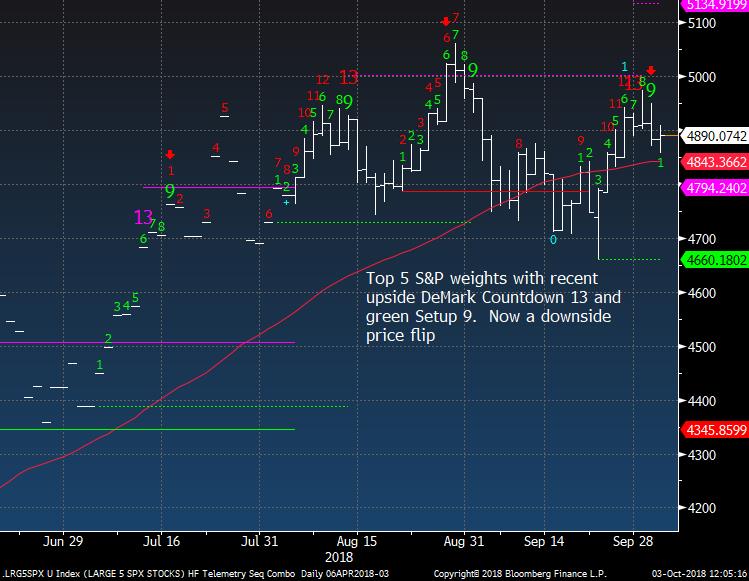
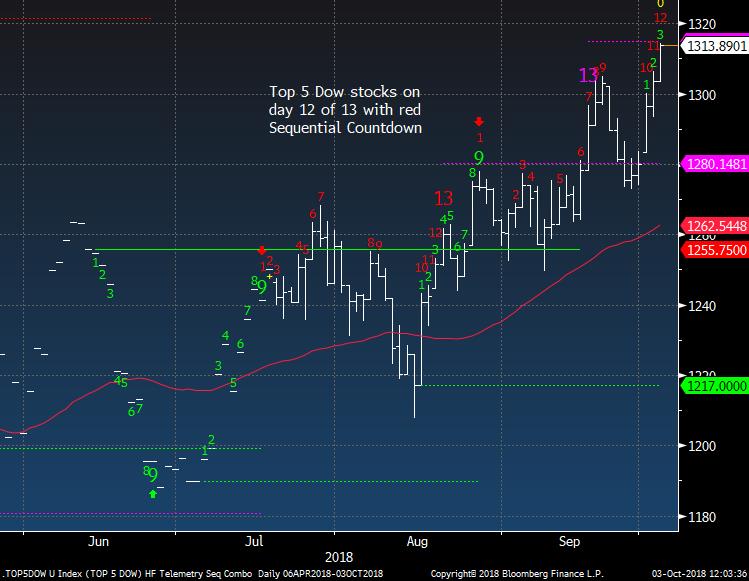
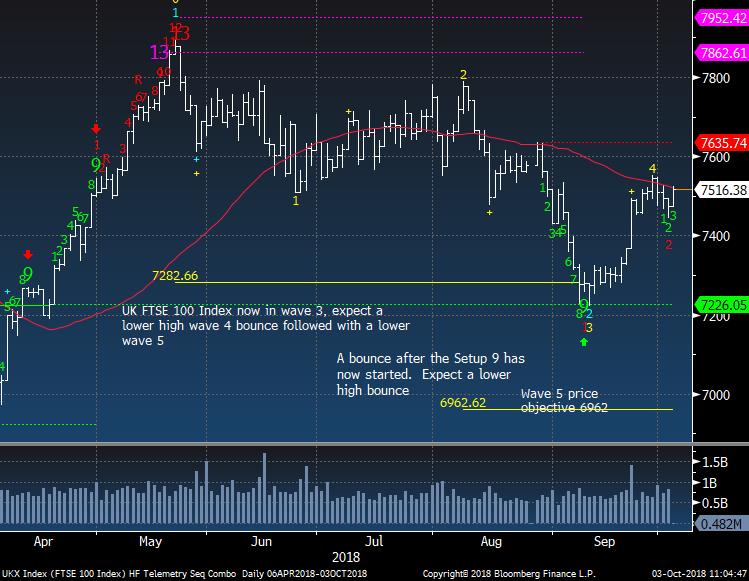
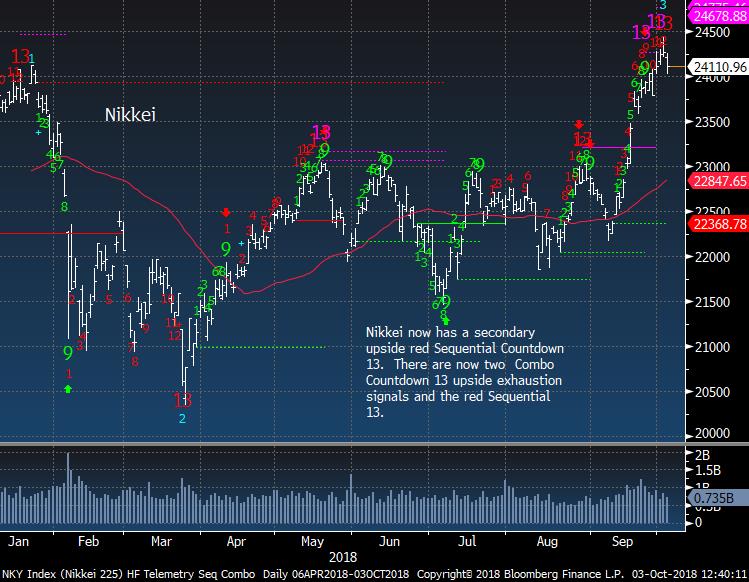
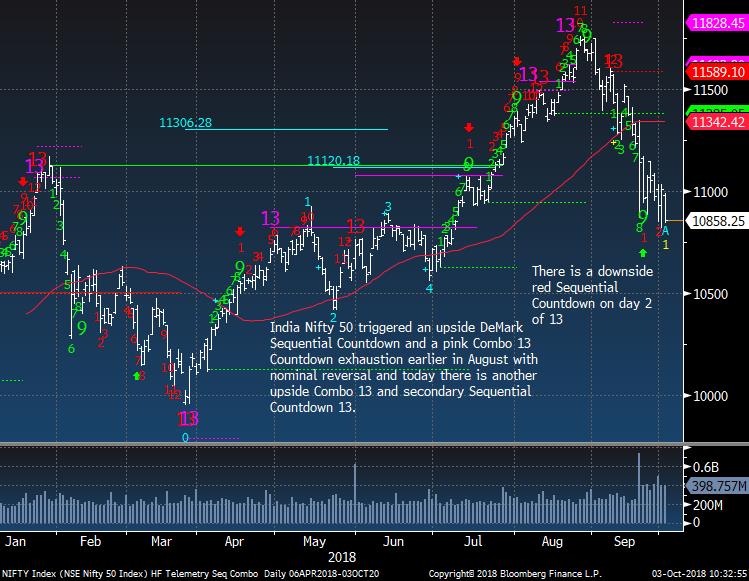
Third, the S&P 500, S&P 100, and the Nasdaq are nearing the daily upside DeMark Countdown 13's. The Dow is early on with a new upside Countdown but the top 5 stocks in the S&P which have done the majority of the upside attribution had an upside Countdown 13 and now a price flip lower. The top 5 Dow stocks is on day 12 of 13 so perhaps that early upside Countdown in the Dow will be cancelled. Add the Nikkei to the list of major indexes to those with recent upside Countdown 13's with a confluence with the Yen too. If you think these don't work, check out the history on the Nikkei or India Nifty 50.
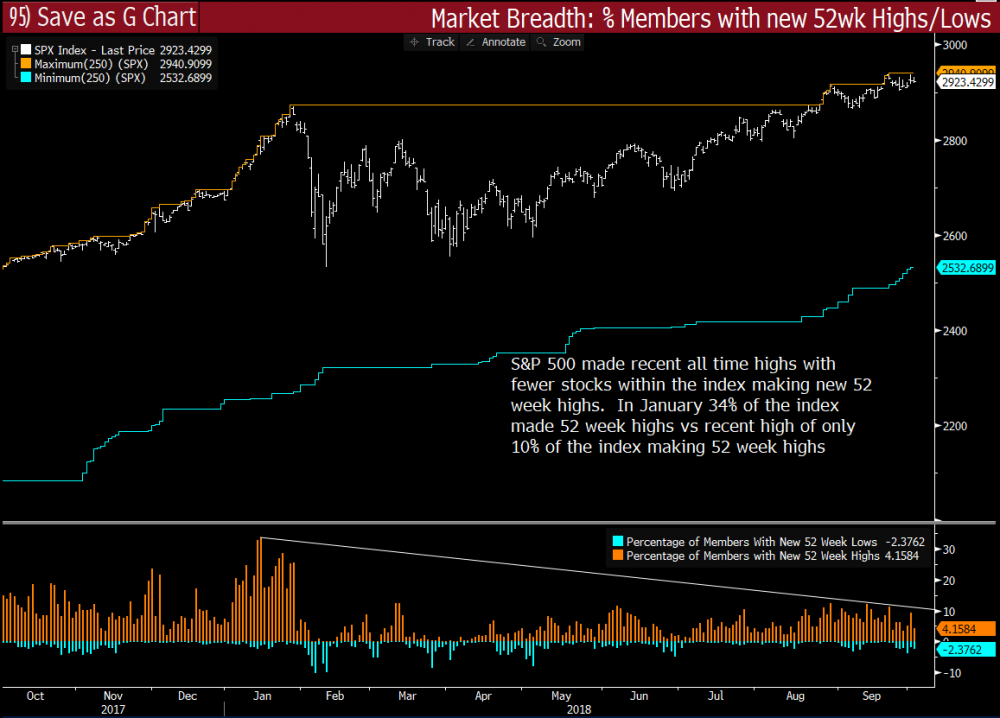
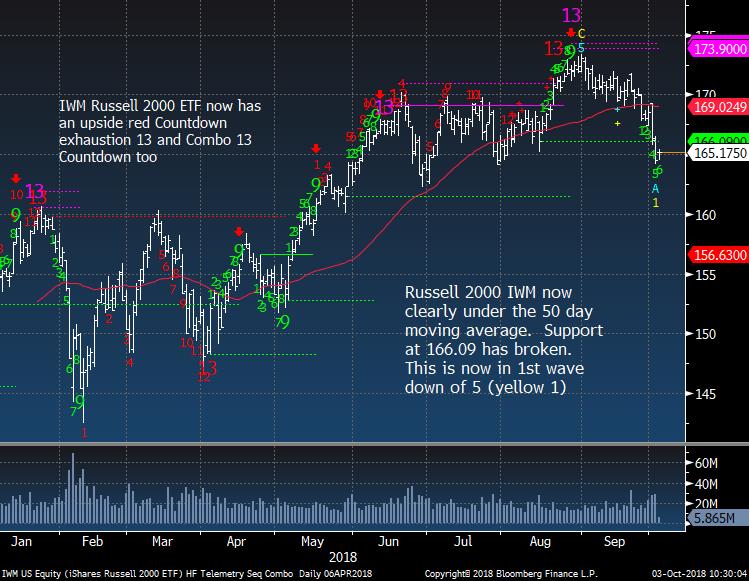
Fourth, market breadth is showing signs of internal weakness. Cumulative breadth peaked recently with some upside DeMark upside exhaustion signals. Russell 2000 has started to break. The % of stocks making 52 week highs with the indexes making new highs continues to notably diverge from January highs. Nasdaq Summation Index has now turned negative and usually when this happens markets can accelerate faster on the downside.
Lastly, Daily Sentiment Index data I post each day has been diverging from price and a "catch down" could happen at any moment. Investors Intelligence bullish sentiment is at 61%, a level that they call the "Danger Zone". More concerning is the low reading in those "expecting a correction" at 19%. This low level is similar to January levels. A sign of complacency. When those expecting a correction rises, they tend to shift to join the bearish side. Bears is at 18%.
In summary, I'm really concerned that a risk off trade is very close - out of stocks and into bonds. I continue to believe one needs to be very nimble with tight stops and a higher percentage of cash on the sidelines.
- US Markets - Divergences and a few more days left for daily upside exhaustion signals
- Hedge Fund Telemetry Trade Ideas - Covered half AMD short +16.5%
- Breadth Update
- SPY vs RSP and Top 5 S&P and Dow stocks custom indexes
- Stocks I'm watching today
- Sector Focus - Energy
- PPO Monitor - Percentage Price Oscillator Force Ranked Sector Rotation
- Bloomberg Technical Pattern Recognition Screen
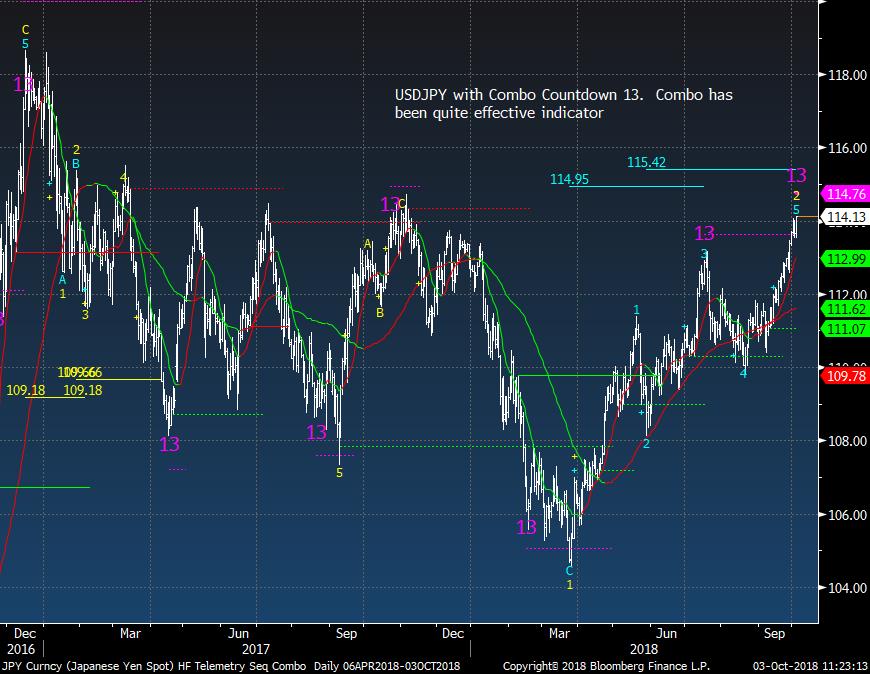
- Currency Update - USDJPY Yen looks like a bottom with Combo indicator
- European Market Update - Still sluggish
- Global Market Update - Back under 50 day for EEM
- Asian Market Update - Nikkei upside exhaustion after extreme bullish sentiment
- Crude Update - Sell your long with extreme sentiment
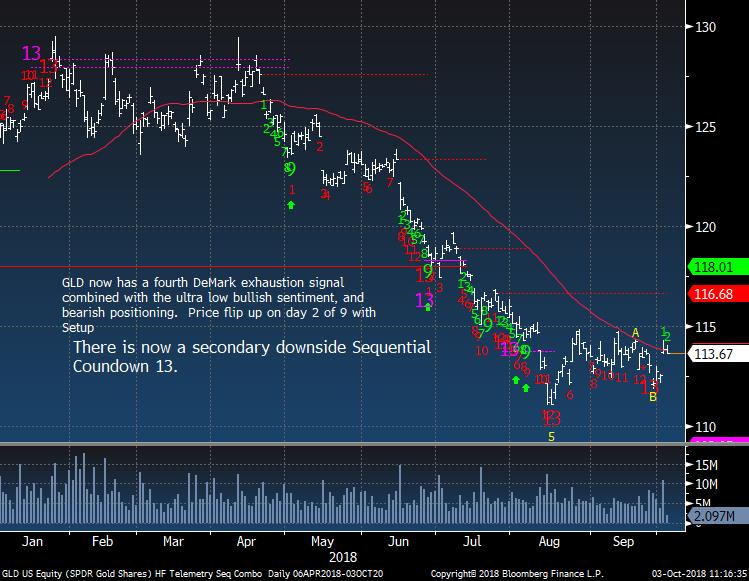
- Gold Update - Sideways
- Bond Update - IMPORTANT US 10 YEAR YIELD UPSIDE EXHAUSTION TODAY
- DeMark Screens - Daily, Weekly, Monthly upside/downside exhaustion signals within the S&P 500 and Euro Stoxx 600 September Monthly data updated
|
|
|
|
|
Here's a link to the Hedge Fund Telemetry market sentiment page with 40 charts of sentiment including equities, bonds, currencies, and commodities updated each day. When the new website launches we will be adding new charts and historical sentiment data for Euro Stoxx 50, UK FTSE 100, German DAX, French Cac 40. We will be adding Japanese Bonds, German Bunds, and a few more.
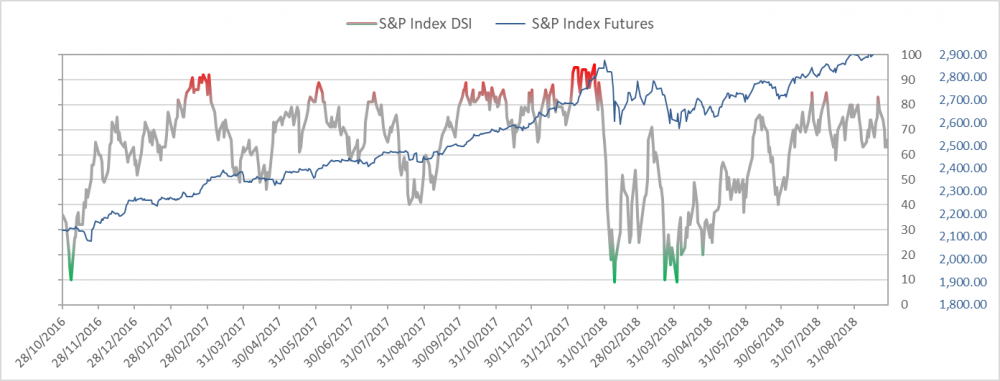
SPX bullish sentiment is at 63%
|
|
|
|
|
Here's a little preview of the new Hedge Fund Telemetry Sentiment Charts. Having the ability to look at various time frames on the website is going to be really useful. Stay tuned for new site launch. I really am excited about having 45 different sentiment charts looking like this
|
|
|
|
|
|
|
|
|
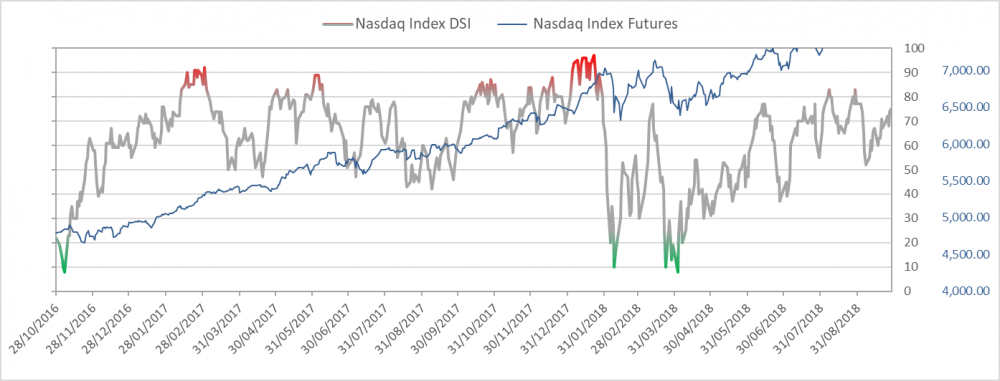
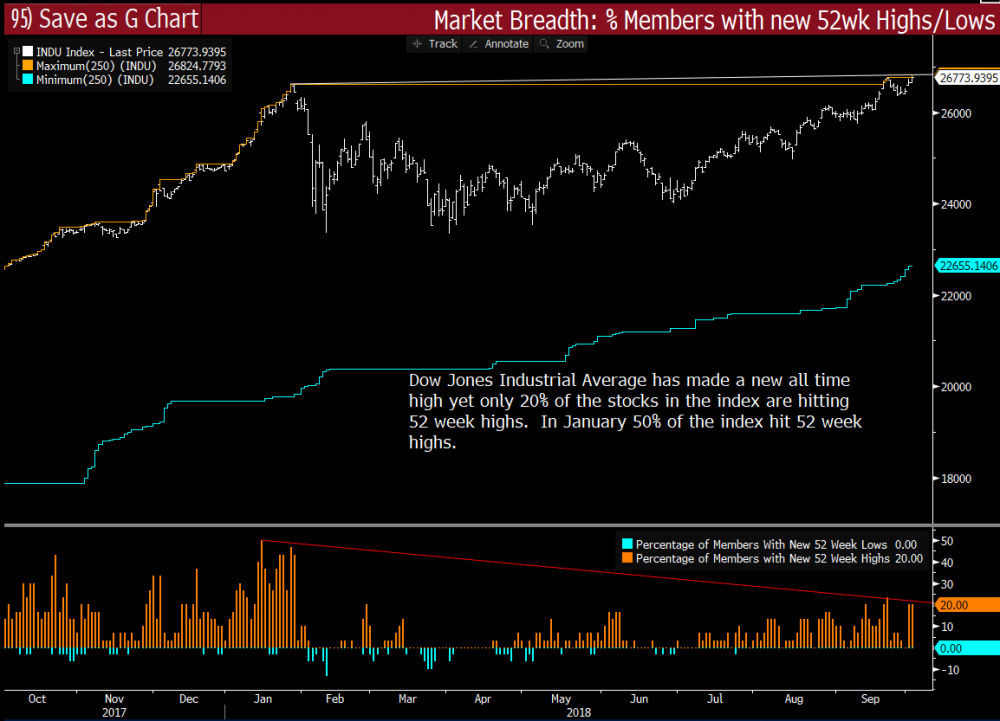
% of stocks making 52 week highs still very low vs January
|
|
|
|
|
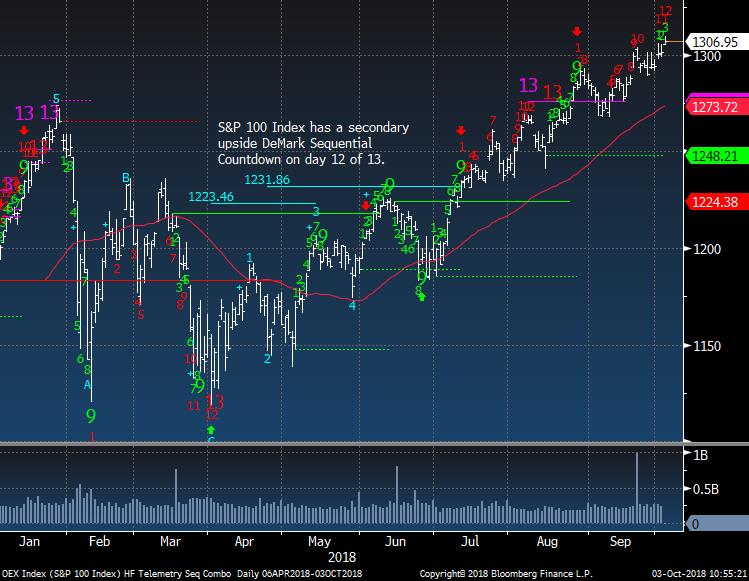
OEX S&P 100 is a day away
|
|
|
|
|
Nasdaq bullish sentiment is at 71%
|
|
|
|
|
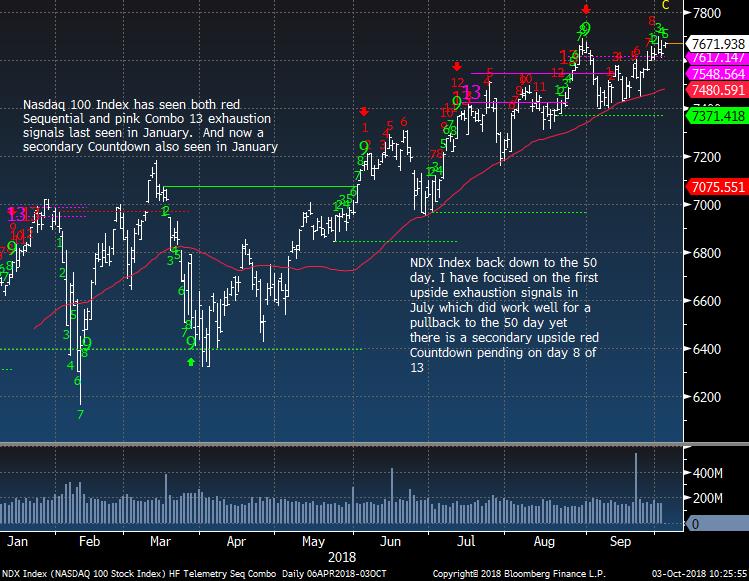
NDX Index still has a little more upside potential
|
|
|
|
|
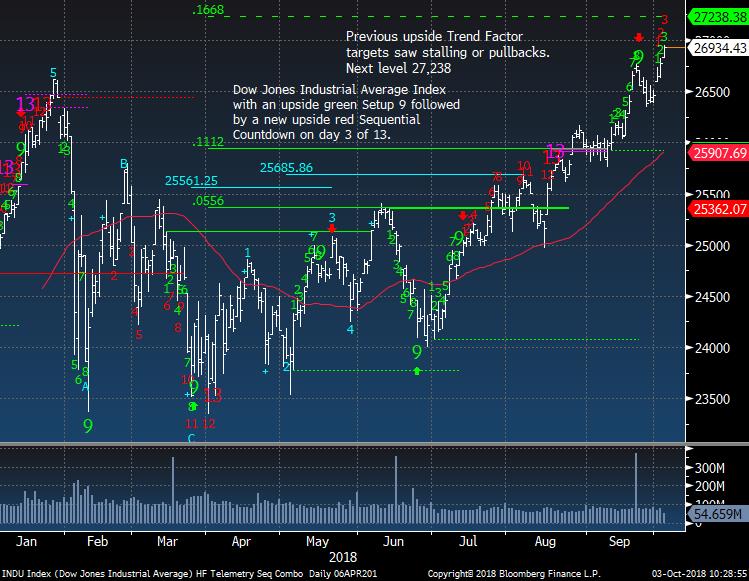
Dow Jones Industrial Average is the better looking index thanks to so few stocks leading
|
|
|
|
|
% of 52 week highs on the Dow is divergence vs January
|
|
|
|
|
|
|
|
|
|
|
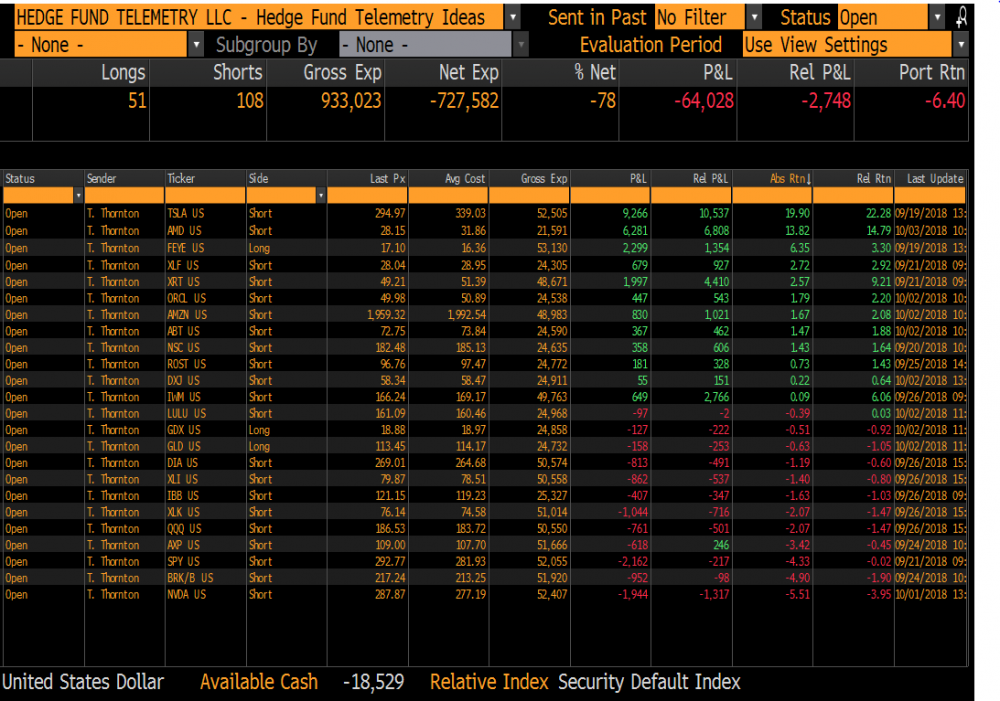
Hedge Fund Telemetry Trade Ideas
|
|
|
Trade Ideas Sheet - Long and short US equity ideas including ETF's. We will be overhauling the Trade Ideas Sheets for long only, short only, ETF's when the new website rolls out soon. There will also be a clearer email distribution with changes.
Trade Ideas Changes: Reduced AMD short to 5% - Correction yesterday I typed short DXY when I meant DXJ. I type very fast. Sorry
Stops on everything. TSLA 320, GDX 17.35 , FEYE 16.00, FXI 41.95 (stopped), NVDA 295, QQQ 190 (raised stop), XLK 79 (raised stop), SPY 295, XLY 118, AXP 114, XRT 53, IWM 172, XLV 95, BRK/B 225, DIA 275, XLI 81.50, IBB 123, AMD 35, ROST 100.50, ABT 76, ORCL 53, LULU 165, AMZN 2050, DXJ 61, GLD 111
|
|
|
|
|
|
|
|
|
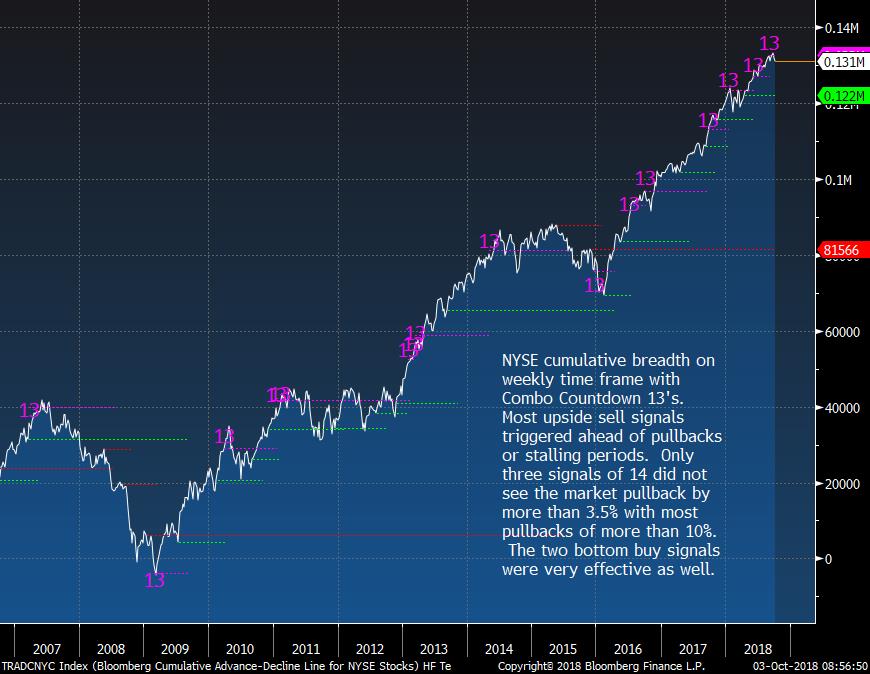
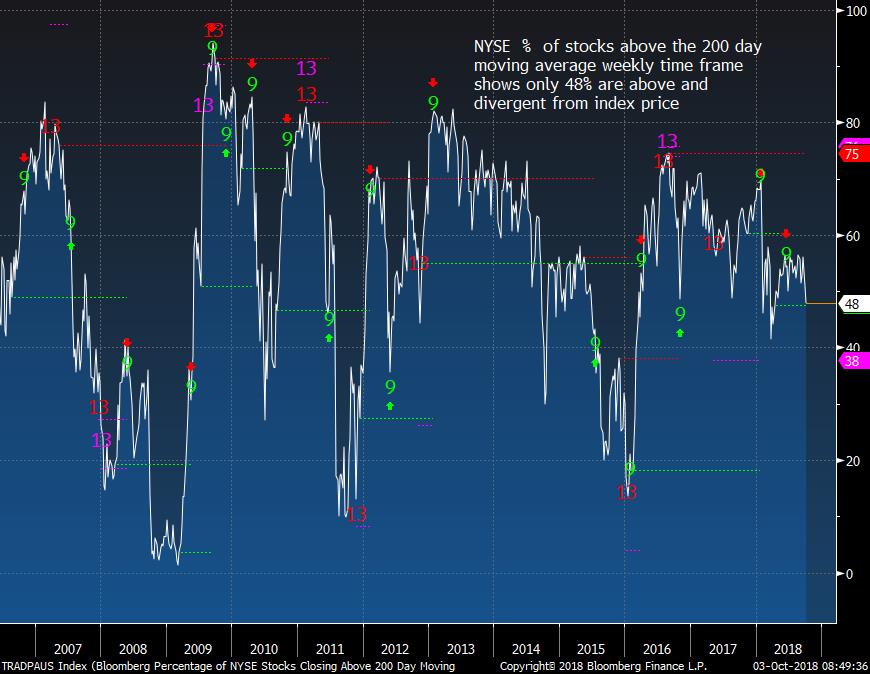
NYSE Cumulative breadth weekly with Combo
|
|
|
|
|
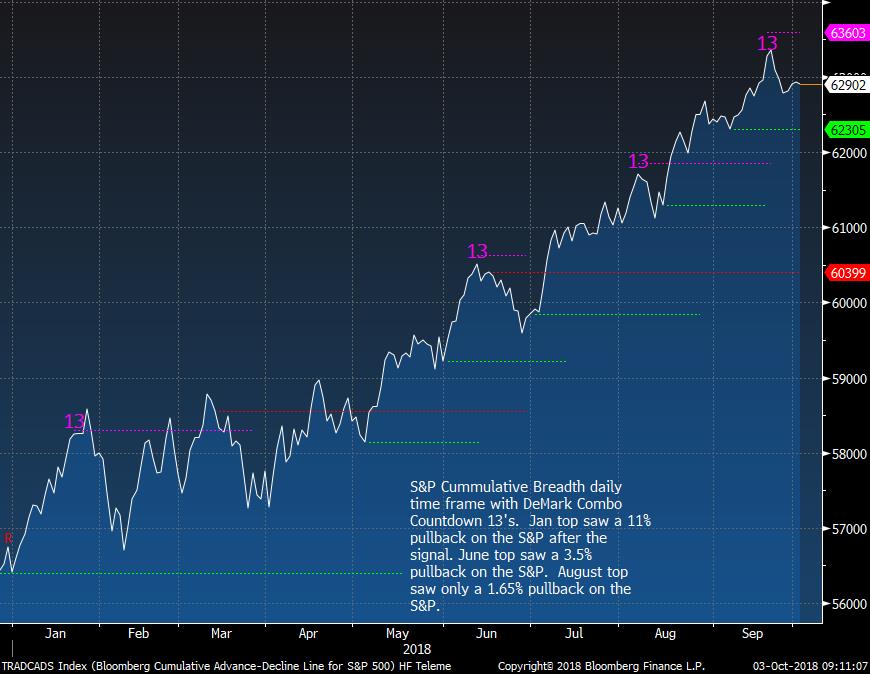
S&P 500 cumulative breadth daily with Combo
|
|
|
|
|
NYSE % of stocks above the 50 day moving average weekly long term. Now under 50% and this is really strange when markets are hitting new highs... All time highs I might add. Weird
|
|
|
|
|
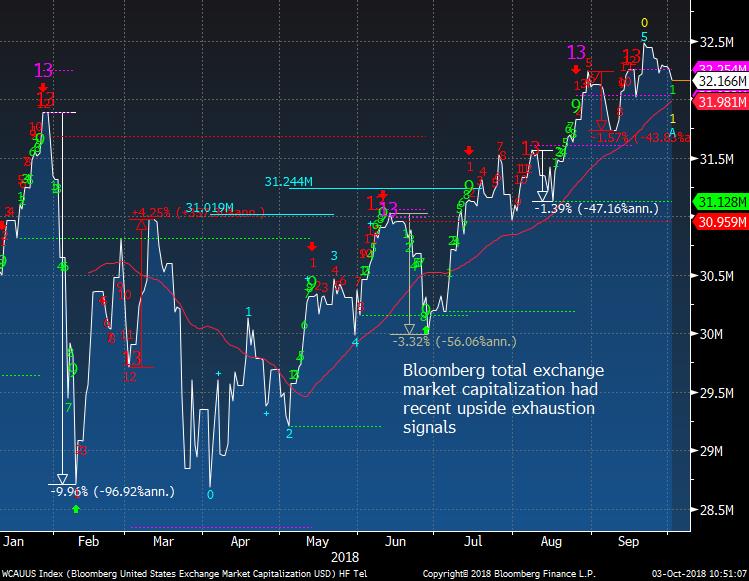
US total market cap also rolling over
|
|
|
|
|
|
|
SPY vs RSP (equal weight) and Top 5 S&P and Dow Stocks Custom Indexes
|
|
|
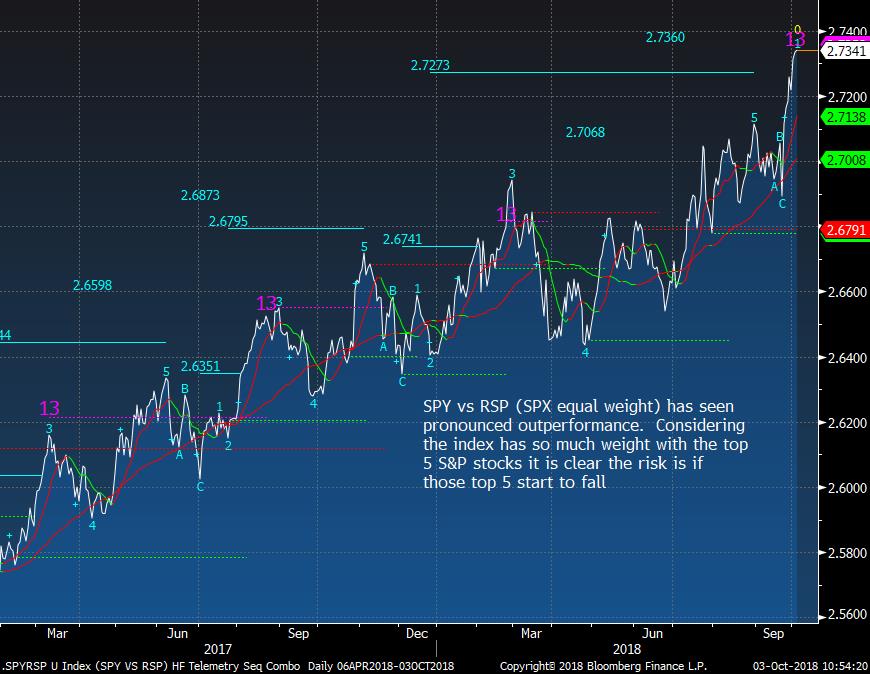
SPY vs RSP with notable recent out performance
|
|
|
|
|
Top 5 S&P weights - head and shoulders top perhaps?
|
|
|
|
|
Top 5 Dow stocks near upside exhaustion
|
|
|
|
|
|
|
Stocks I'm watching today
|
|
|
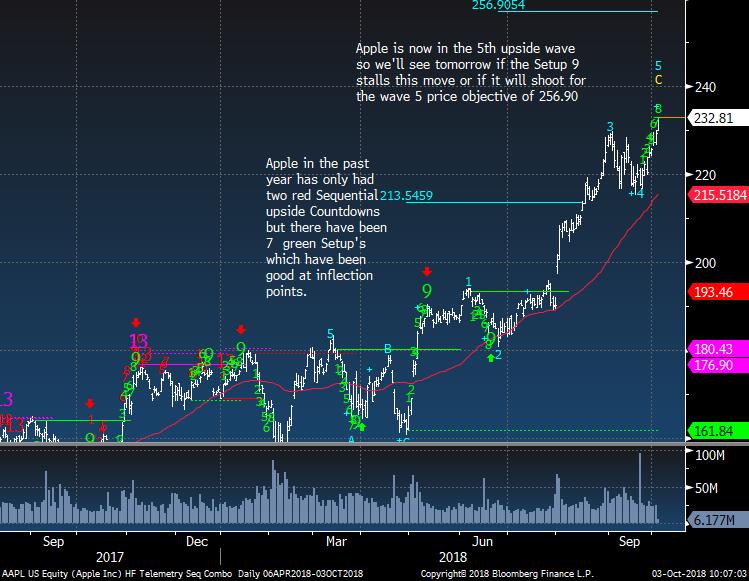
Apple could possibly top tomorrow with a green Setup 9. Or maybe just a short term pullback. We'll see
|
|
|
|
|
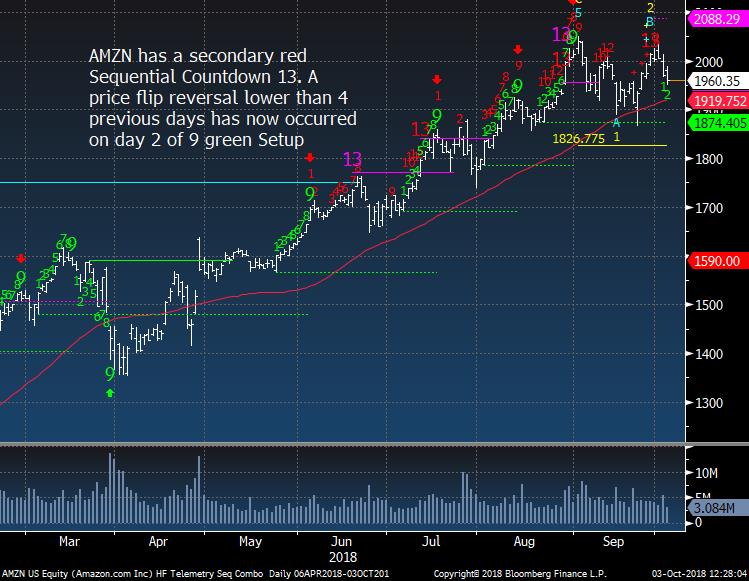
AMZN rolling over but needs to break the 50 day
|
|
|
|
|
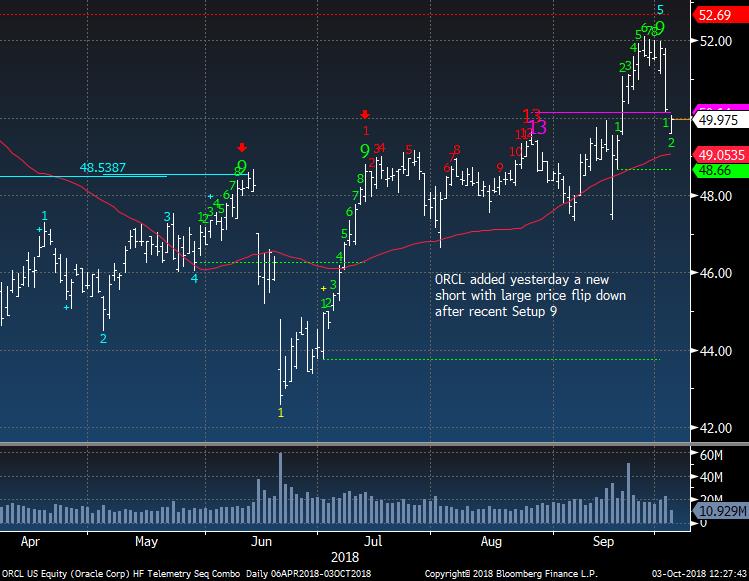
ORCL recent add to Trade Ideas Short
|
|
|
|
|
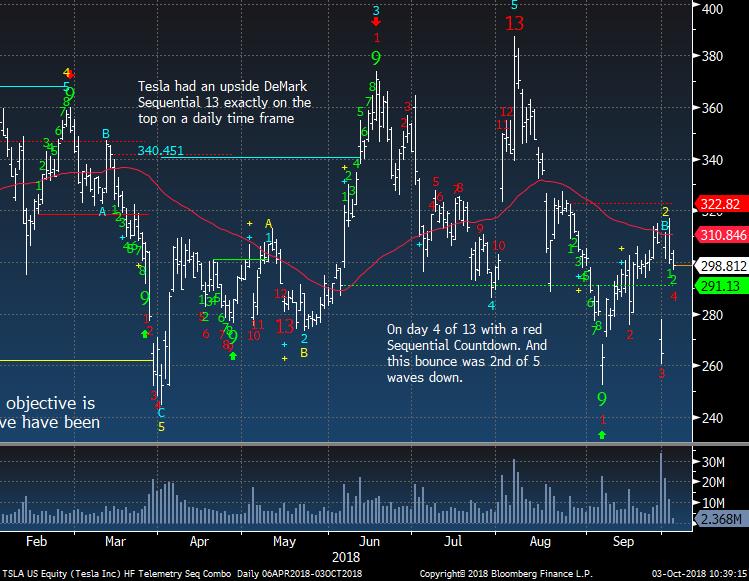
TSLA still should work lower
|
|
|
|
|
|
|
|
|
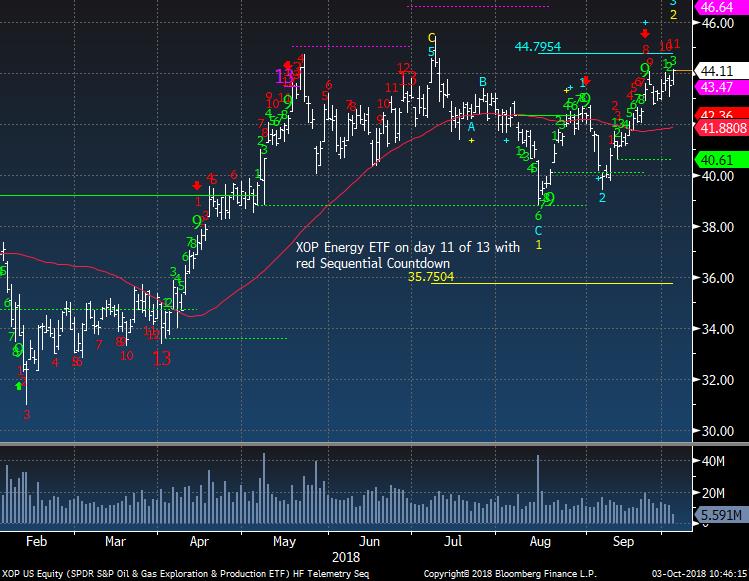
XOP nearly has an upside exhaustion
|
|
|
|
|
|
|
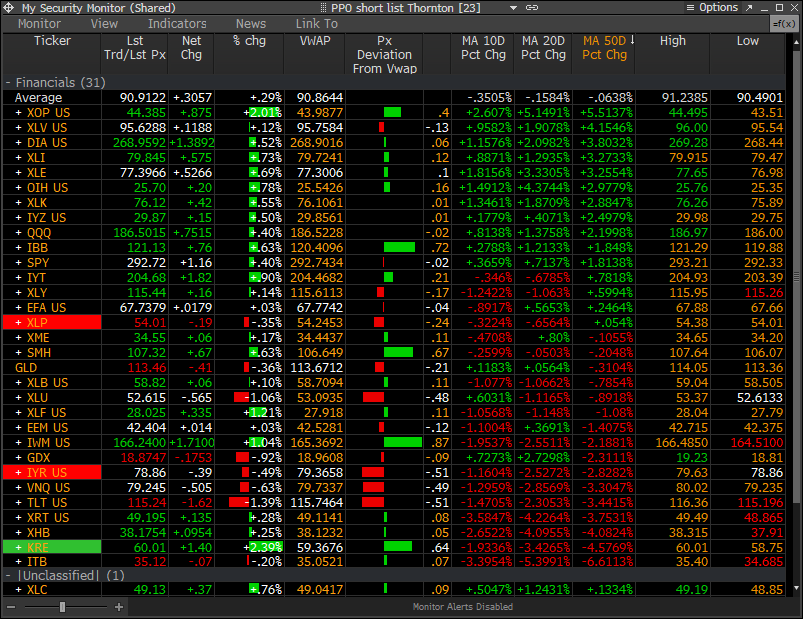
PPO Monitor - Percentage Price Oscillator
|
|
|
The PPO Monitor is a proprietary monitor developed to force rank Indexes, Sectors, and Stocks. It ranks top down by strongest to weakest by percentage above/below the 50 day moving average. Shorter term signals can be seen when the 10 and 20 day moving averages turn up (green) or down (red) which often are followed by the 50 day moving average. This is useful to watch for historically overbought/oversold percentage above/below the 50 day moving average. It is non correlated with the DeMark Indicators however we have found upside/downside exhaustion signals often occur when something rises to the top or drifts to the bottom of the monitor - increasing the timing aspect. We share this monitor with clients with Bloomberg Terminals. An added feature is that each market/ETF can be expanded with each component force ranked in the same way. A couple other features include price deviation from intraday VWAP (useful for intraday reversals) and new 20 day highs/lows on right side. Please inquire if you would like to be permissioned to use the PPO Monitor.
Today's highlights: Still seeing top sectors being bought and bottom sectors being sold. GDX did have a new 20 day high but pulled back. Keep an eye on this one
|
|
|
|
|
|
|
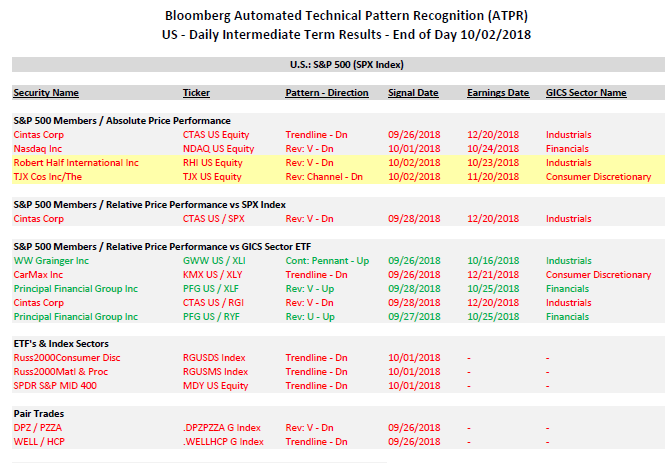
Bloomberg Automated Technical Pattern Recognition Screens
|
|
|
S&P 500 Members/Absolute Price Performance and Relative Price Performance vs S&P 500 and Sector ETF's. ETF's vs Index Sectors. Pair Trades. Long side is first symbol, short side is second symbol.
|
|
|
|
|
|
|
|
|
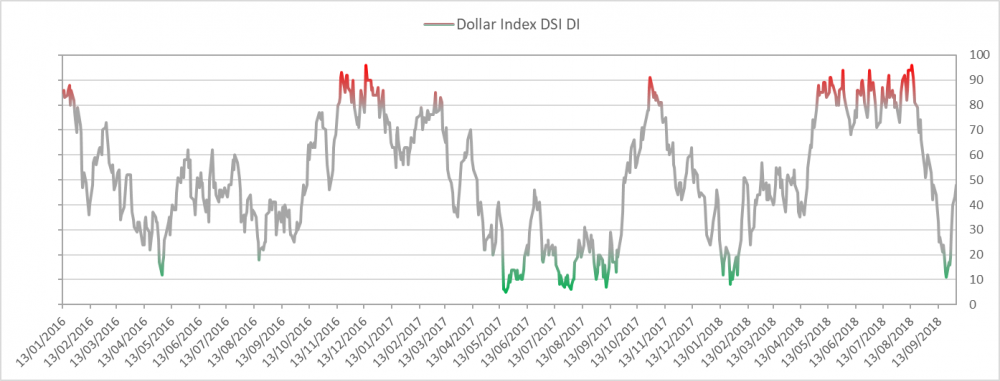
US Dollar bullish sentiment is at 48%
|
|
|
|
|
|
|
|
|
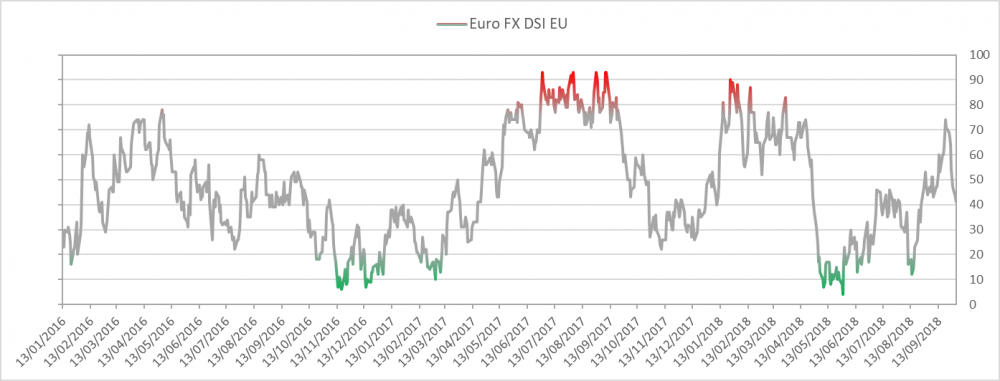
Euro bullish sentiment is at 41%
|
|
|
|
|
|
|
|
|
USDJPY Yen with a Combo upside exhaustion.
|
|
|
|
|
|
|
|
|
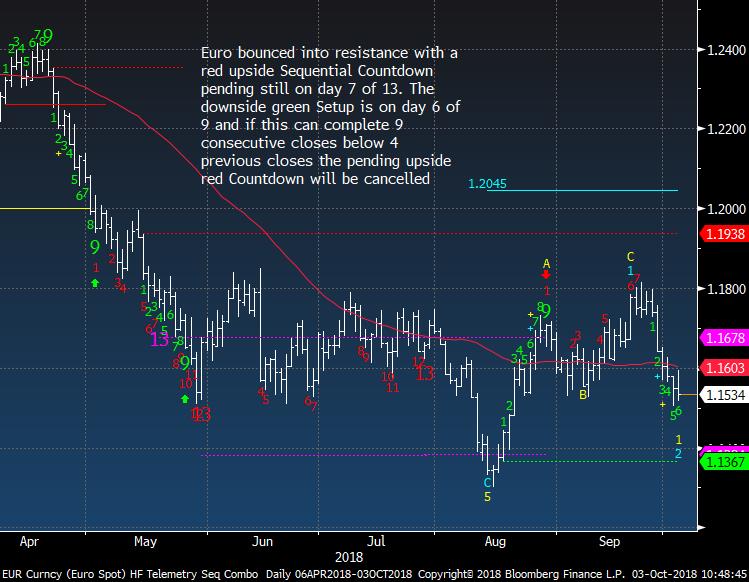
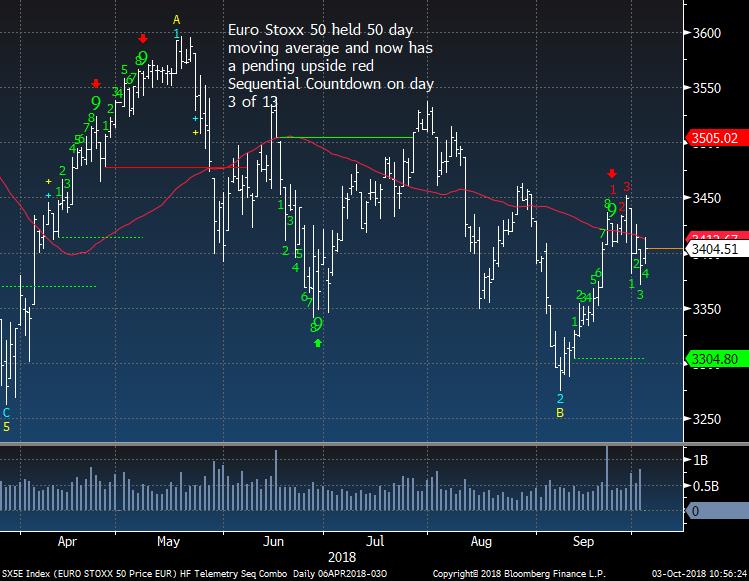
Euro Stoxx 50 still sluggish
|
|
|
|
|
|
|
|
|
|
|
|
|
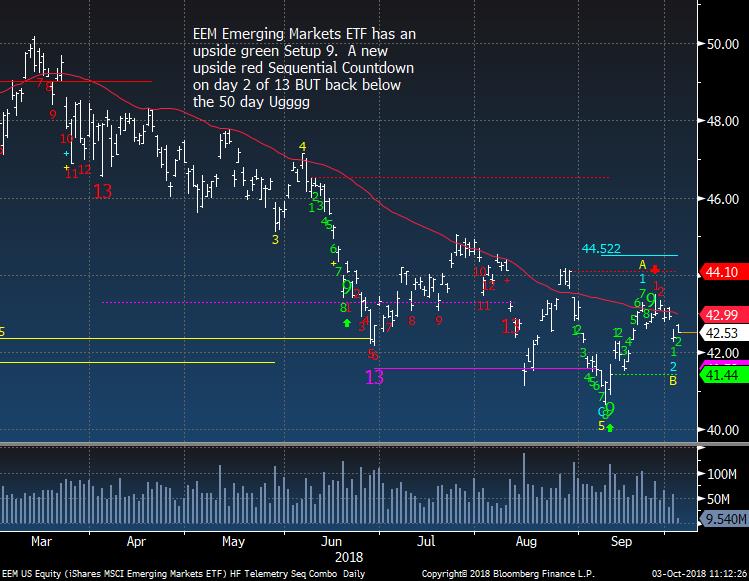
EEM Emerging Markets ETF lagging under the 50 day
|
|
|
|
|
|
|
|
|
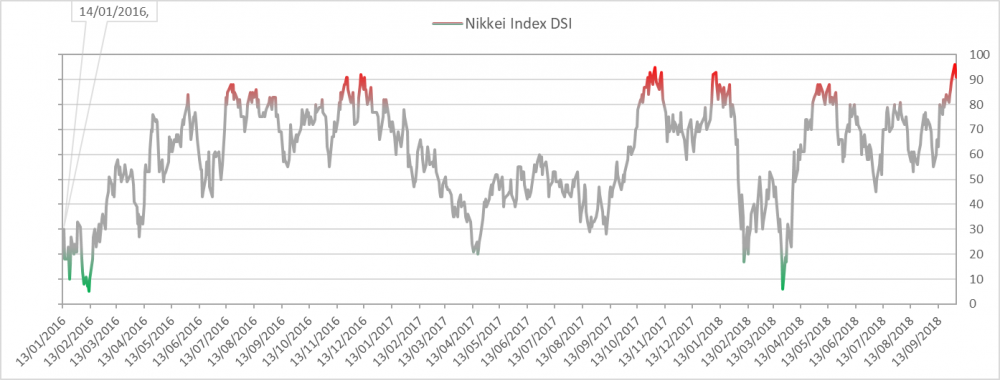
Nikkei bullish sentiment is at 91% down from crazy extreme 96%
|
|
|
|
|
Nikkei reversed last night
|
|
|
|
|
India Nifty 50 still looks lower
|
|
|
|
|
|
|
|
|
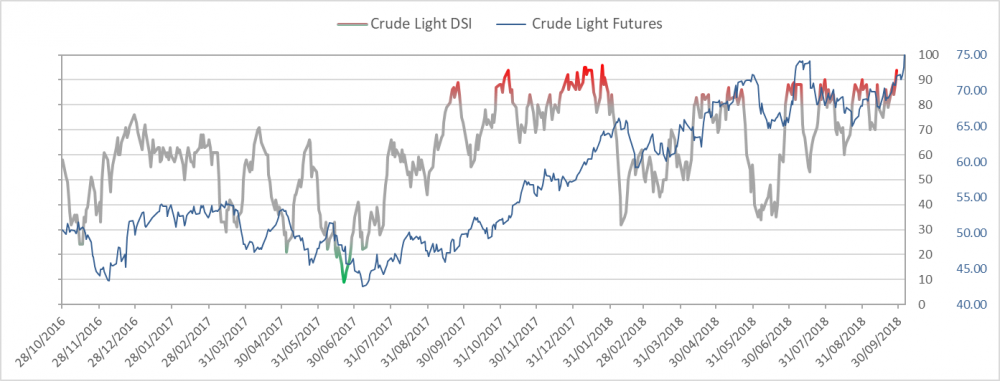
Crude bullish sentiment is at 91% and down from crazy extreme 96%
|
|
|
|
|
|
|
|
|
Brent Crude on day 12 of 13.
|
|
|
|
|
|
|
|
|
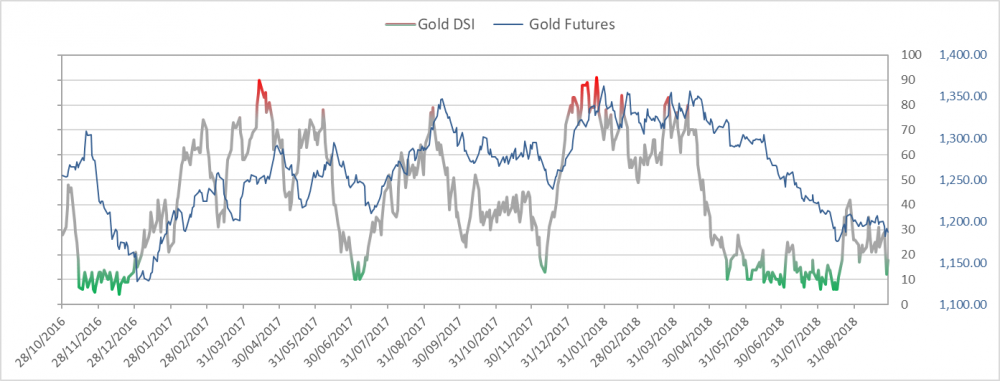
Gold bullish sentiment is at 17%
|
|
|
|
|
|
|
|
|
|
|
|
|
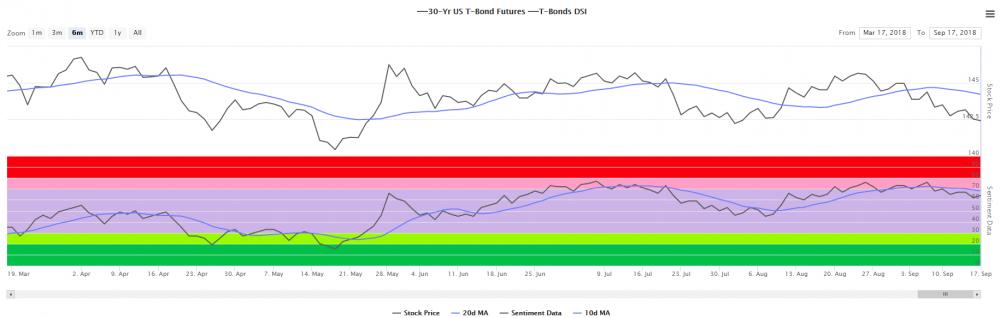
Bond bullish sentiment is at 56% and remains bid despite the bond weakness
|
|
|
|
|
US 10 Year Yield with upside Sequential Countdown 13
|
|
|
|
|
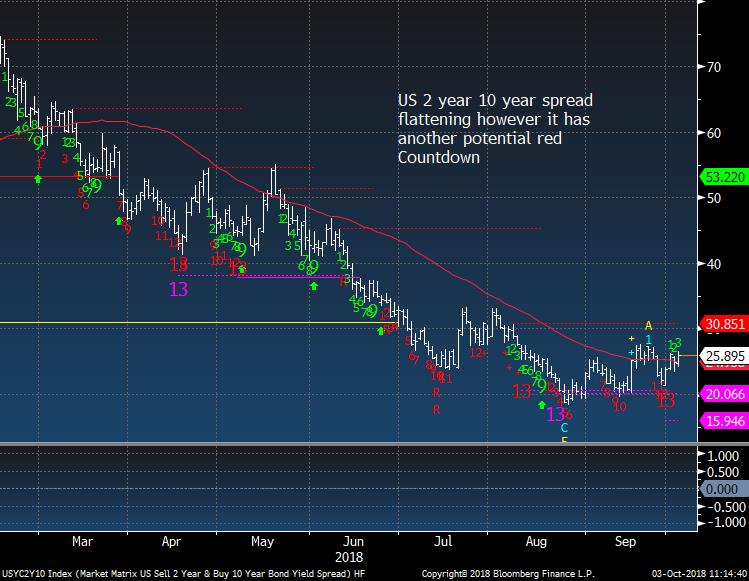
US 2/10 Year Yield Curve sideways
|
|
|
|
|
|
|
|
|
|
|
|
|
|
|
DEMARK SCREENS - Daily, Weekly, Monthly Upside/Downside Exhaustion Signals
|
|
|
Daily/Weekly DeMark upside/downside exhaustion signals (Sequential) updated daily, Weekly signals on Monday's and monthly on the first day of the new month. Price flips occur when a stock closes higher/lower than four previous closes and increases conviction of a price turn.
The upside 13's are sell signals and downside 13's are buy signals. Price flip's are confirmation signals that increases potential for a price trend change. For example, if you are long a stock and there is an upside 13, you will want to take cautious action by selling down or out of a position. If initiating a short sale with the upside 13's, we tend to start with a 1/2 size and add with the downside price flip. The opposite is true for when there are downside 13's. Take a 1/2 size position and add with the upside price flip. The DeMark Indicators are designed to assist the user with buying into weakness and selling into strength to anticipate trend exhaustion. Selling into a rally and buying into a decline often afford the opportunity to exit a trade without too serious a loss if wrong.
S&P 500 Universe:
DAILY UPSIDE 13: BDX, PG, UNH, V, XOM
DAILY DOWNSIDE 13: CMA
DAILY UPSIDE WITH PRICE FLIP REVERSAL DOWN: AMZN, EW, MCD, NCLH, ROST, TJX, TTWO
DAILY DOWNSIDE WITH PRICE FLIP REVERSAL UP: AMAT, DVN, KLAC, NUE
Updated: 10/1/18
WEEKLY UPSIDE 13: BSX, HOLX, NKE, TDG
WEEKLY DOWNSIDE 13: NONE
Updated: 10/1/18
MONTHLY UPSIDE 13: ADSK, ALL, CCI, CME, DE, DLR, DTE, ETN, GLW, HPQ, INTU, PH, TPR, TXT, UPS, XLNX
MONTHLY DOWNSIDE 13: NONE
Euro Stoxx 600 Universe:
DAILY UPSIDE 13: MRK GR
DAILY DOWNSIDE 13: ABI BB, DC/ LN, DLN LN, EZJ LN, FRA GR, ISP IM, TEF SM
DAILY UPSIDE WITH PRICE FLIP REVERSAL DOWN: AMS SM, DEC FP
DAILY DOWNSIDE WITH PRICE FLIP REVERSAL UP: ZAL GR
Updated: 10/1/18
WEEKLY UPSIDE 13: HELN SW, SKY LN
WEEKLY DOWNSIDE 13: FNTN GR
Updated: 10/1/18
MONTHLY UPSIDE 13: BNZL LN, EXPN LN, FPE3 GR, SBMO NA, SECUB SS, SWEDA SS
MONTHLY DOWNSIDE 13: BAYN GR, HMB SS, TEF SM
|
|
|
Unsubscribe me from Hedge Fund Telemetry
Hedge Fund Telemetry LLC, P.O. Box 4675, Greenwich, CT 06861, United States
CONFIDENTIALITY NOTE and DISCLAIMER: This message is for the named person's use only. It may contain confidential, proprietary or legally privileged material. No confidentiality or privilege is waived by any accidental or unintentional transmission. If you receive this message in error, please immediately delete it and all copies of it from your system, destroy any hard copies and notify the sender. You must not, directly or indirectly, use, disclose, distribute, print or copy any part of this message if you are not the intended recipient. Hedge Fund Telemetry LLC. cannot guarantee the confidentiality of the material transmitted; therefore, information of a sensitive or confidential nature should not be transmitted. There is risk in trading markets. Hedge Fund Telemetry LLC reports are based on information gathered from various sources and believed to be reliable, but are not guaranteed as to accuracy and completeness. The information is subject to change without notice and Hedge Fund Telemetry LLC has no obligation to provide any updates or changes. Hedge Fund Telemetry LLC is providing this data for informational and educational purposes and does not believe that it is sufficient to base an investment decision on. This information should not be regarded as a solicitation or recommendation of any particular security or to engage in any trading strategy. One should always check with your licensed financial advisor to determine suitability of any investments.
|
|
|
|
|