|
|
|
|
|
|
Another positive catalyst is behind
|
|
|
The Nafta renegotiation with Mexico and Canada is now a positive catalyst that is complete. As much as I agree with modifications with a trade agreement from 1994 was necessary for refinements, the changes are not that significant. As I've mentioned in the past, the markets have not discounted any negatives with tariff's but has celebrated any positive announcements even if the positives are not significant to earnings. We have our bounce today and now it's been started to fade seen
with internals like breadth opening strong but has now turned negative to flat. The indexes remain strong as the most recent sectors that have been strong continue to be bought while the weaker sectors are sold. Notably the Russell 2000 is nearly at a 6 week low. Large financials and regional banks continue to weaken. Even retail is flat and has been showing signs of weakness. The market continues to chase green with speculative stocks and mega caps.
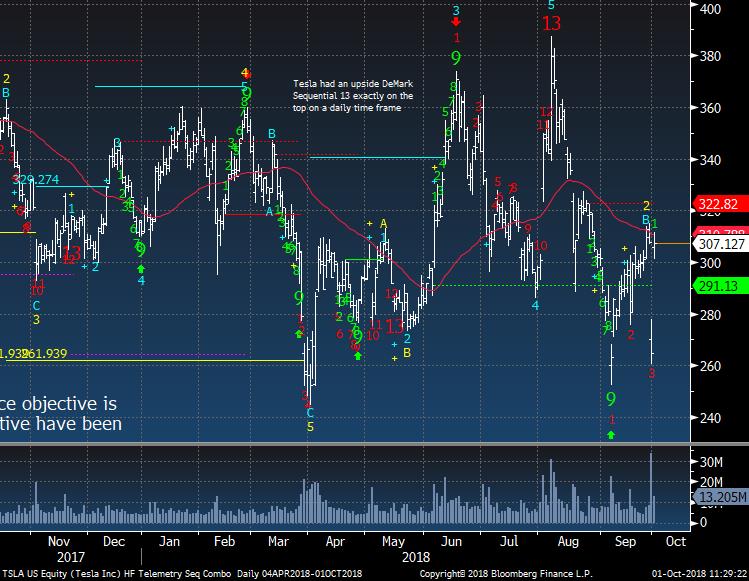
Tesla and Elon Musk settled with the SEC on his "funding secured" tweet. Some people think the SEC went too light on him but the settlement he was offered but turned down was more lenient than what was settled upon. Today's bounce has faded all day from the gap up and that is tell that large holders are selling vs shorts adding. The SEC investigation was never a part of the short thesis (pre Tweet) and all of the negatives remain.
As far as the markets, I have said for weeks that nominal
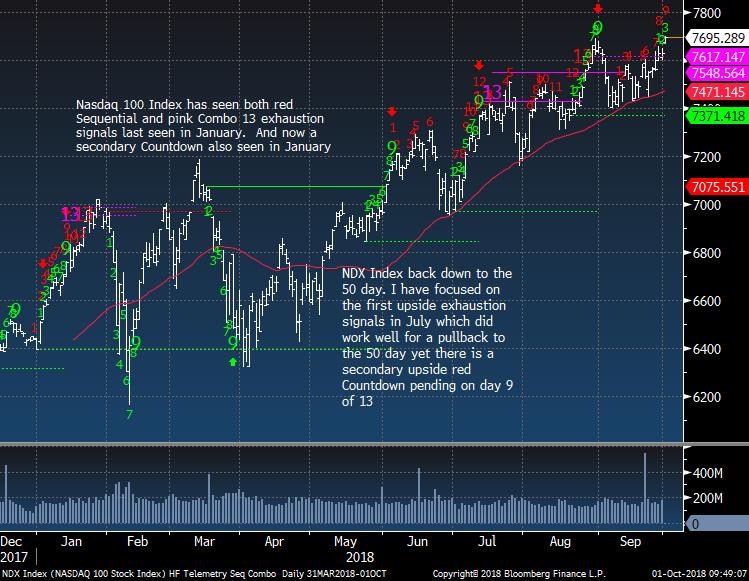
new highs are possible with the recent upside daily DeMark Countdowns. Upside Countdowns are near with energy, consumer discretionary and technology. This has a been a very powerful late stage move but cracks are showing with breadth indicators, new highs/lows, percentage of stocks above various moving averages that are not confirming and continue lower. I continue to manage risk tight and when wrong stop out and redeploy. This is a concerning market that could face risks with low liquidity, low cash levels, low short interest. Buy back activity has been strong although now on hold ahead of earnings while insiders have been selling stock at the highest levels of 2018. My big theme for October is the risk of earnings being guided down for the future and there have been several recent examples have seen substantial lower moves. Stay nimble, use tight stops, and have a decent percentage of cash to deploy lower. I may seem stubborn but I saw a similar
setup last January too ahead of a quick 10% move lower.
- US Markets - Sentiment divergent, Nasdaq Summation Index, still a little more upside possible
- Hedge Fund Telemetry Trade Ideas - VOD, BA, GDX
- Retail is "All in" while insiders are selling to them
- Tesla Update - What a saga
- Sectors I'm watching today
- Microsoft Monthly
- PPO Monitor - Percentage Price Oscillator Force
Ranked Sector Rotation
- Bloomberg Technical Pattern Recognition Screen
- Currency Update -
- European Market Update -
- Global
Market Update -
- Asian Market Update -
- Crude Update -
- Gold Update -
- Bond Update -
- DeMark Screens - Daily, Weekly, Monthly upside/downside
exhaustion signals within the S&P 500 and Euro Stoxx 600 September Monthly data updated
|
|
|
|
|
Here's a link to the Hedge Fund Telemetry market sentiment page with 40 charts of sentiment including equities, bonds, currencies, and commodities updated each day. When the new website launches we will be adding new charts and historical sentiment data for Euro Stoxx 50, UK FTSE 100, German DAX, French Cac 40. We will be adding Japanese Bonds, German Bunds, and a few more.
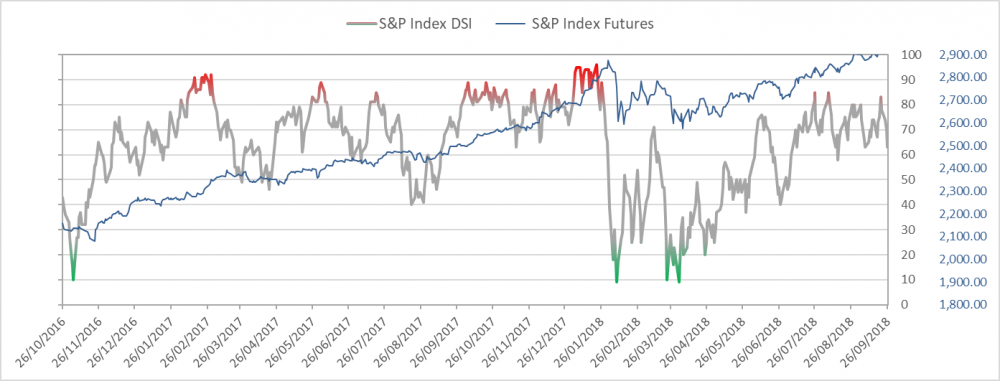
SPX bullish sentiment is at 63% divergent from index price
|
|
|
|
|
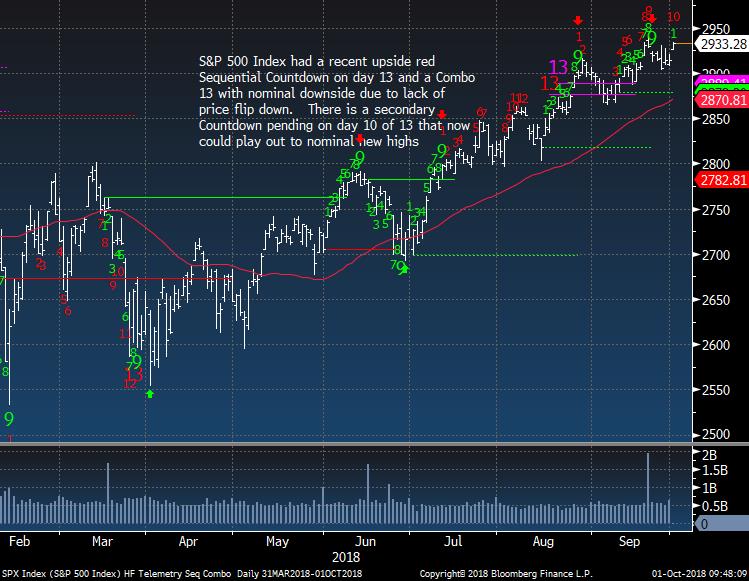
SPX daily getting late on the recent call that nominal new highs were possible
|
|
|
|
|
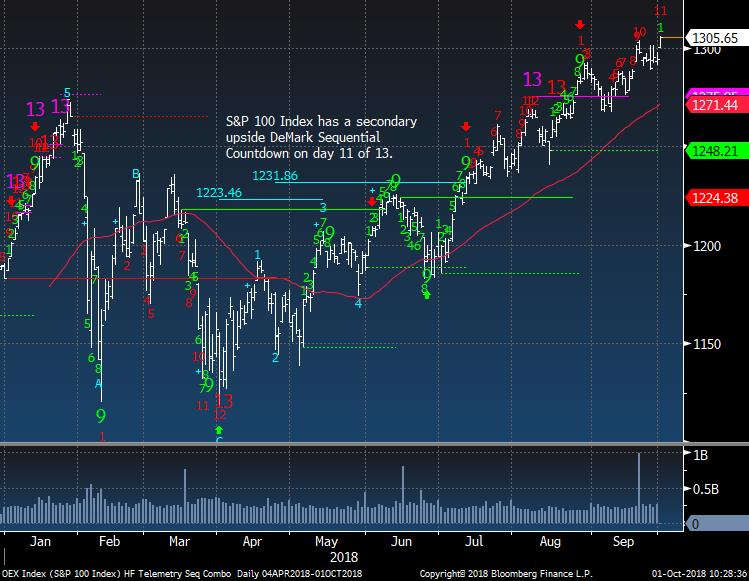
S&P 100 on day 11 of 13 and getting late too
|
|
|
|
|
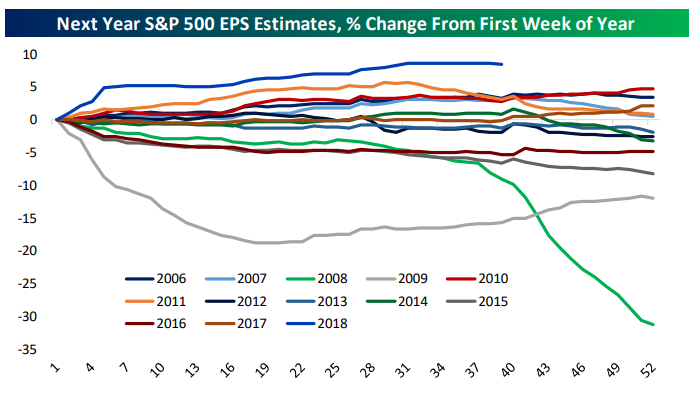
Expectations for earnings continue to be very high. The theme of lowered guidance and missing expectations could see a real move lower
|
|
|
|
|
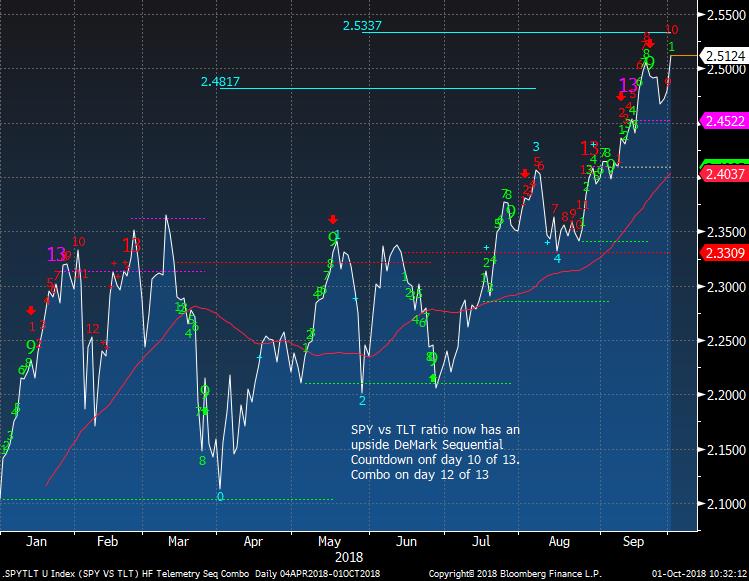
SPY vs TLT ratio on day 10 of 13 with an upside Countdown. The recent signals only say slight slowdown. Now it's nearing the wave 5 price objective
|
|
|
|
|
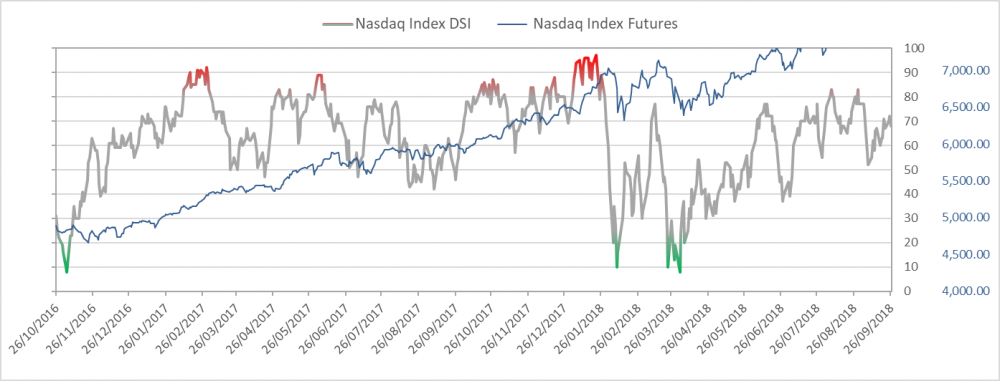
Nasdaq bullish sentiment is at 75% and divergent from index price action
|
|
|
|
|
|
|
|
|
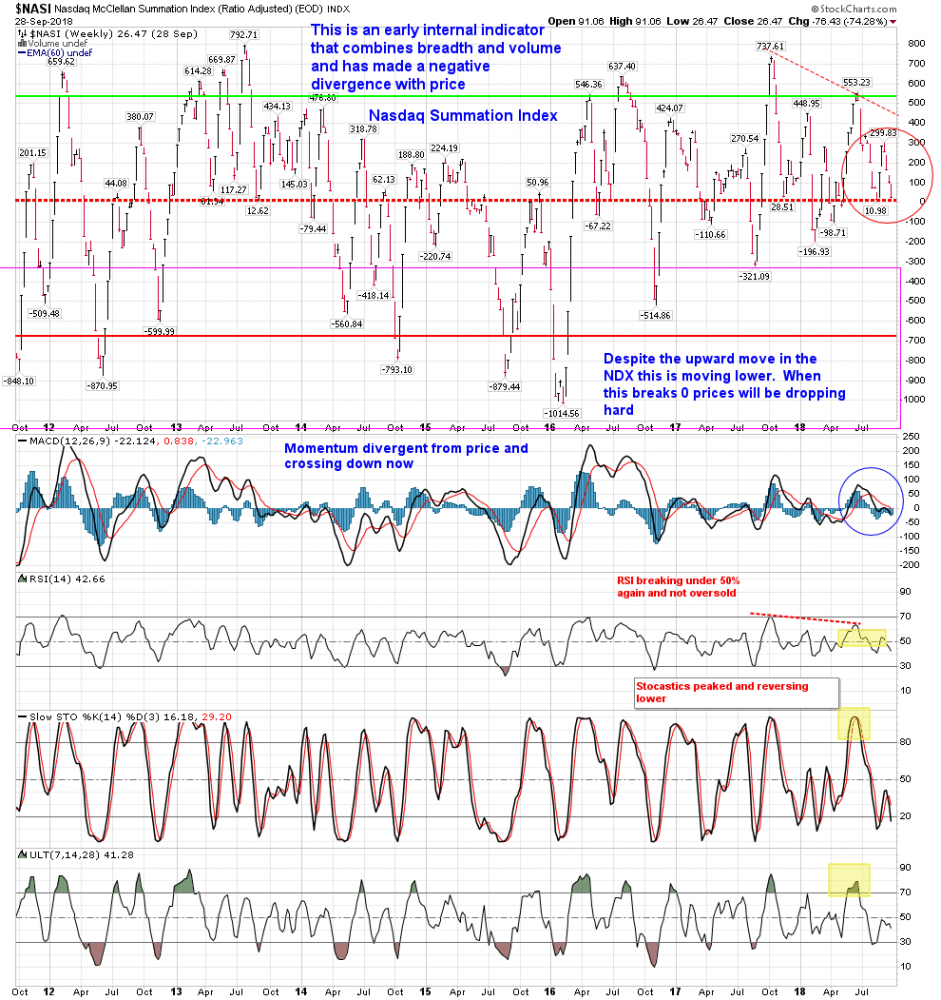
Nasdaq Summation Index last week dropped and nearly is under zero. This is a big divergence.
|
|
|
|
|
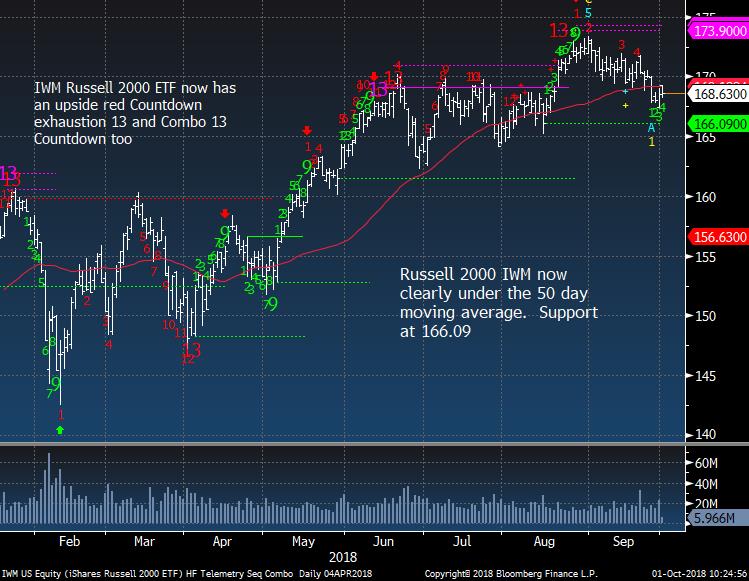
IWM Russell 2000 at a 6 week low
|
|
|
|
|
|
|
Hedge Fund Telemetry Trade Ideas
|
|
|
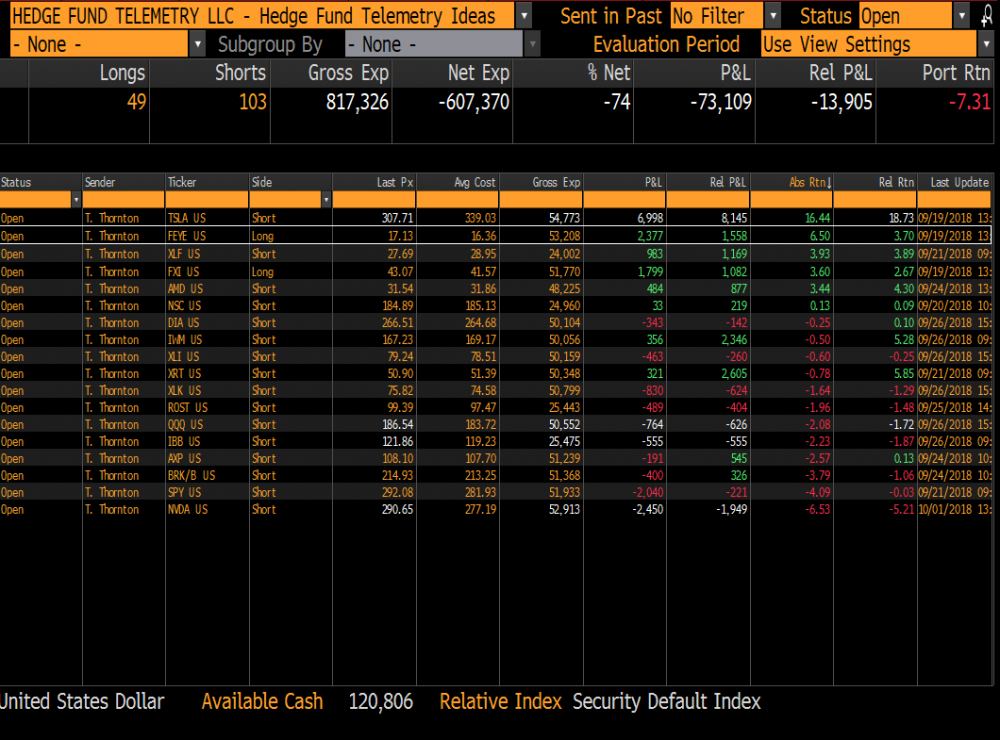
Trade Ideas Sheet - Long and short US equity ideas including ETF's. We will be overhauling the Trade Ideas Sheets for long only, short only, ETF's when the new website rolls out soon. There will also be a clearer email distribution with changes.
Trade Ideas Changes: Stopped friday on GDX and VOD long (small gains). Stopped today on BA
Stops on everything. TSLA 320, , FEYE 16.00, FXI 41.95, NVDA 295 (raised stop), QQQ 187.50 (raised stop), XLK 77, SPY 295, XLY 118, AXP 114, WHR 120, XRT 53, IWM 172, XLV 95, BRK/B 225, DIA 275, XLI 81.50, IBB 123, AMD 35, ROST 100.50
|
|
|
|
|
|
|
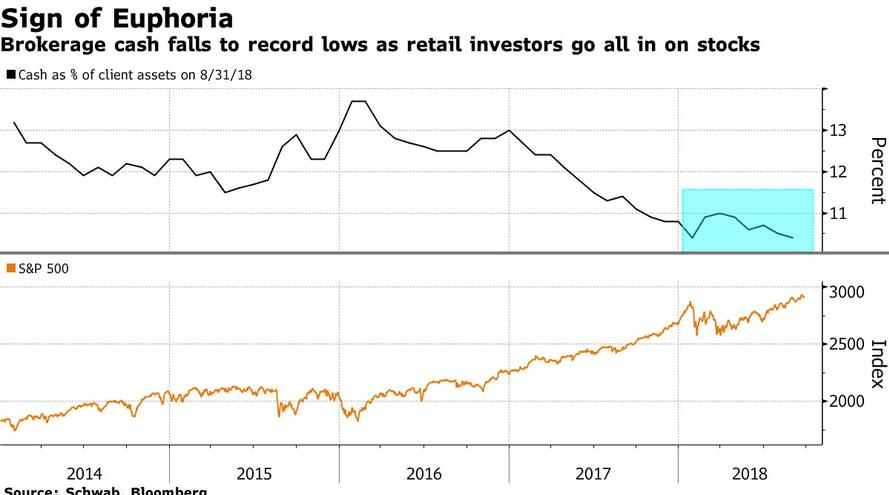
Retail is "all in" while insiders are selling to them
|
|
|
Schwab cash balances are record lows
|
|
|
|
|
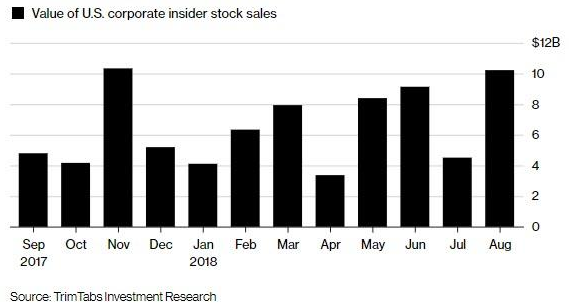
Insiders are selling aggressively
|
|
|
|
|
|
|
|
|
This stock has never been for the faint of heart. I still see lower levels but remain with a stop of 320 to lock in a gain if it gets there
|
|
|
|
|
|
|
Sectors I'm watching today
|
|
|
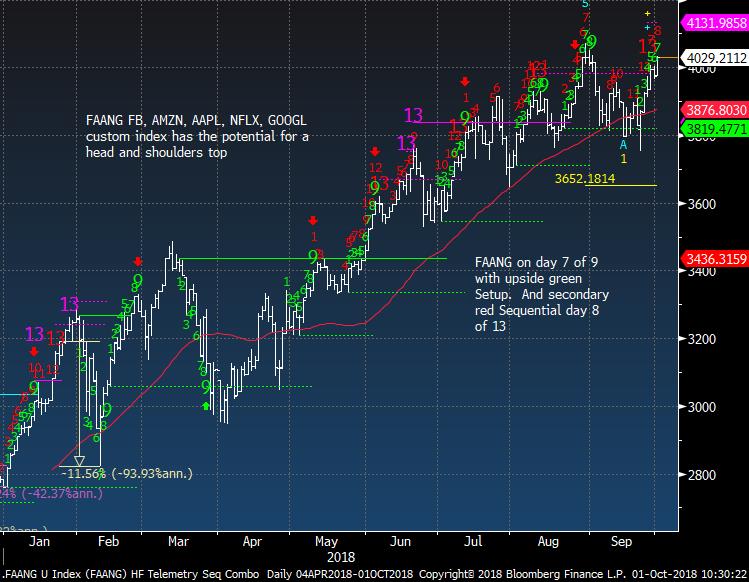
FAANG Custom Index still below August high (closing) and could have a green Setup 9 which has been pretty good at inflection points
|
|
|
|
|
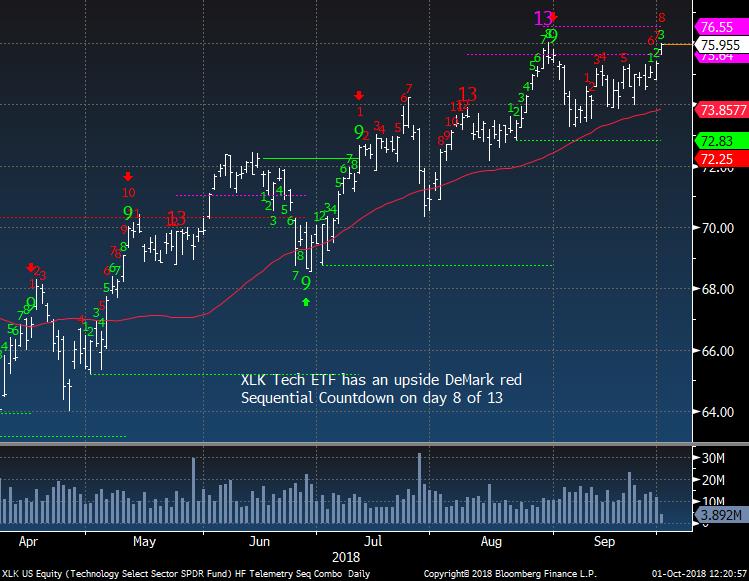
XLK late in the move but could move a little more.
|
|
|
|
|
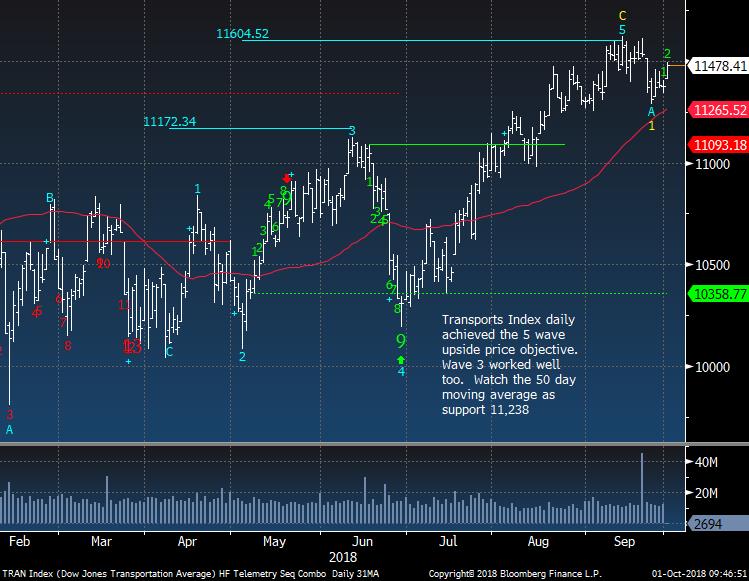
Transports still below recent highs
|
|
|
|
|
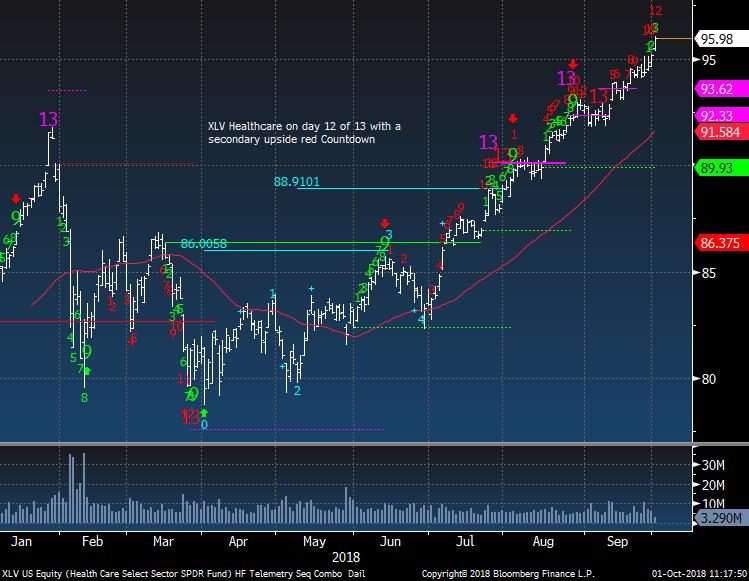
XLV nearly with another upside Countdown 13. Seasonality gets tougher so we'll see if this can pullback in the coming days
|
|
|
|
|
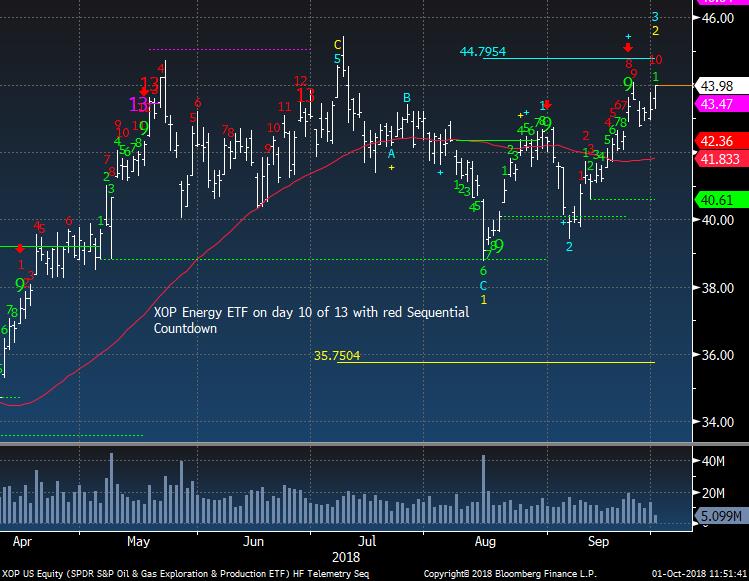
XOP Energy late in the move
|
|
|
|
|
|
|
|
|
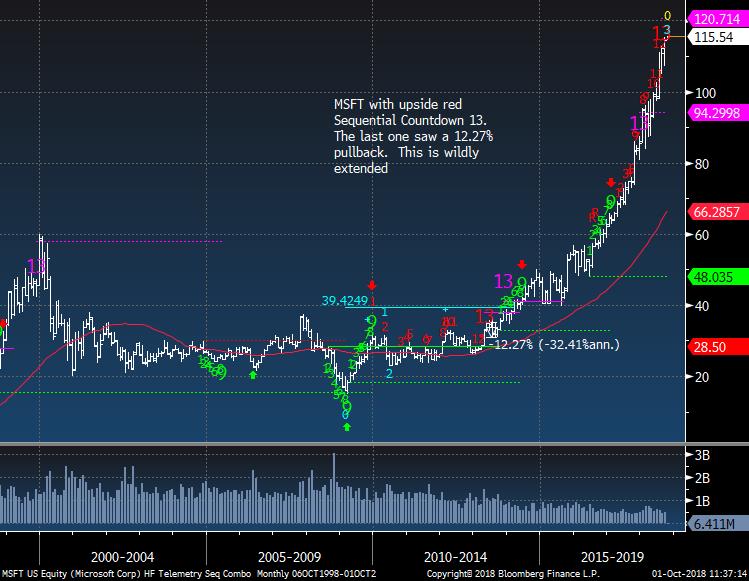
MSFT monthly shows the parabolic move and I simply can't and won't chase this. If you're long congrats and don't get greedy
|
|
|
|
|
|
|
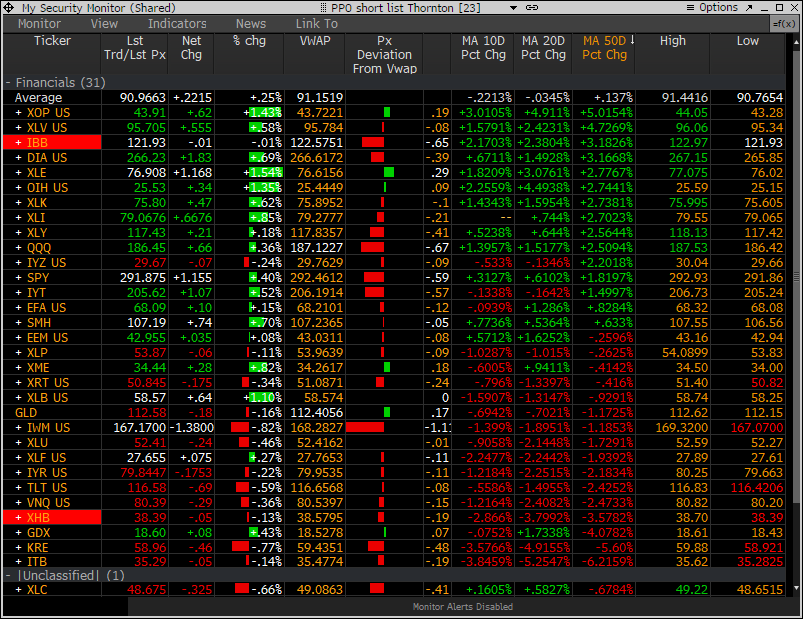
PPO Monitor - Percentage Price Oscillator
|
|
|
The PPO Monitor is a proprietary monitor developed to force rank Indexes, Sectors, and Stocks. It ranks top down by strongest to weakest by percentage above/below the 50 day moving average. Shorter term signals can be seen when the 10 and 20 day moving averages turn up (green) or down (red) which often are followed by the 50 day moving average. This is useful to watch for historically overbought/oversold percentage above/below the 50 day moving average. It is
non correlated with the DeMark Indicators however we have found upside/downside exhaustion signals often occur when something rises to the top or drifts to the bottom of the monitor - increasing the timing aspect. We share this monitor with clients with Bloomberg Terminals. An added feature is that each market/ETF can be expanded with each component force ranked in the same way. A couple other features include price deviation from intraday VWAP (useful for intraday reversals) and new 20 day highs/lows on right side. Please inquire if you would like to be permissioned to use the PPO Monitor.
Today's highlights: The recent stronger sectors continue to be bought and bottom weaker getting sold. A lot are below the VWAP intraday too
|
|
|
|
|
|
|
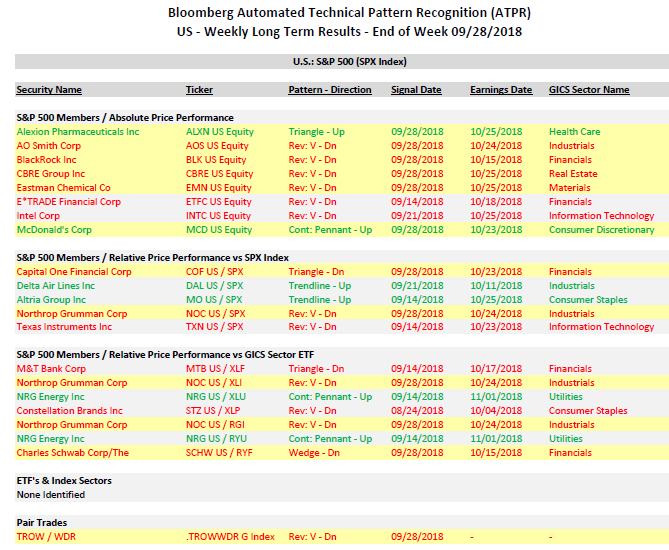
Bloomberg Automated Technical Pattern Recognition Screens
|
|
|
S&P 500 Members/Absolute Price Performance and Relative Price Performance vs S&P 500 and Sector ETF's. ETF's vs Index Sectors. Pair Trades. Long side is first symbol, short side is second symbol.
|
|
|
|
|
|
|
|
|
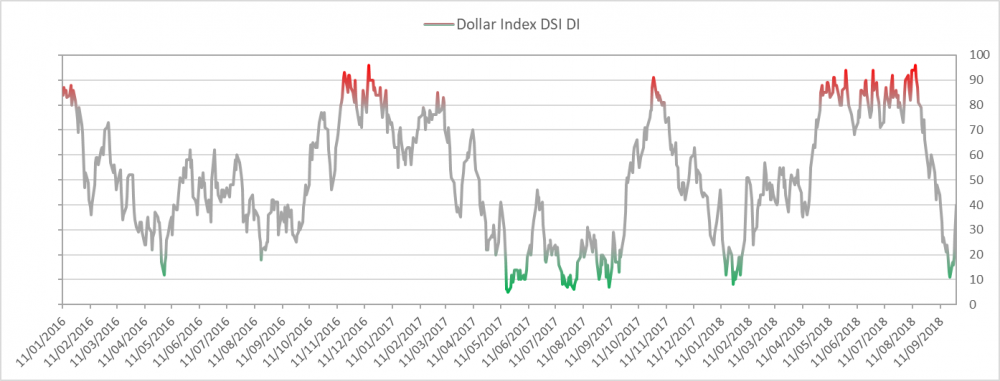
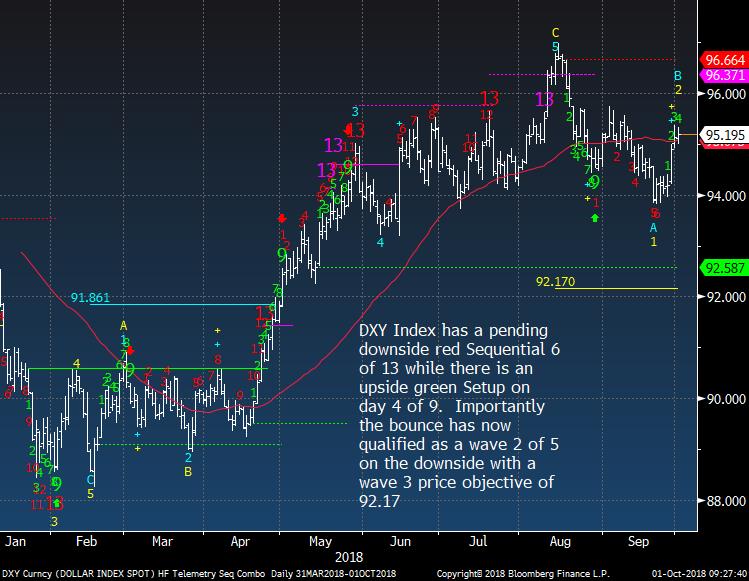
US Dollar bullish sentiment is at 40% and bouncing off recent low of 11%
|
|
|
|
|
|
|
|
|
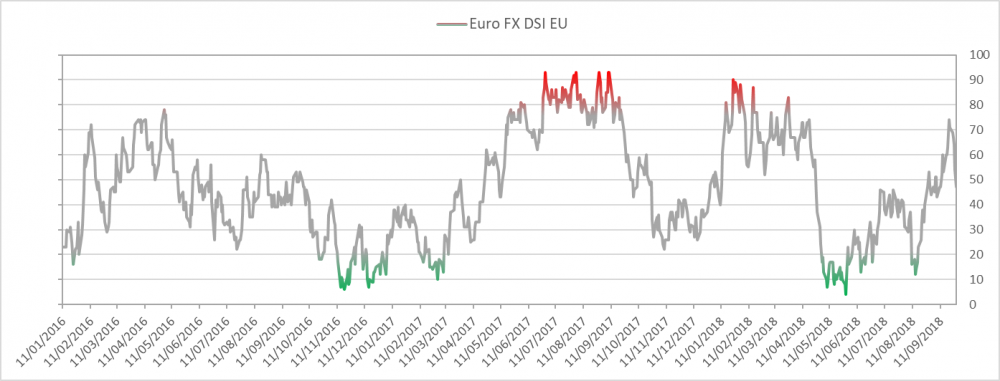
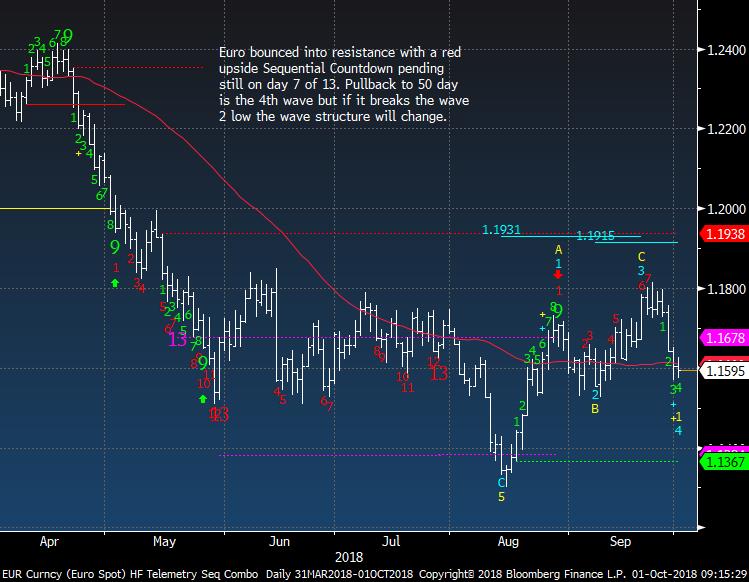
Euro bullish sentiment is at 47%
|
|
|
|
|
|
|
|
|
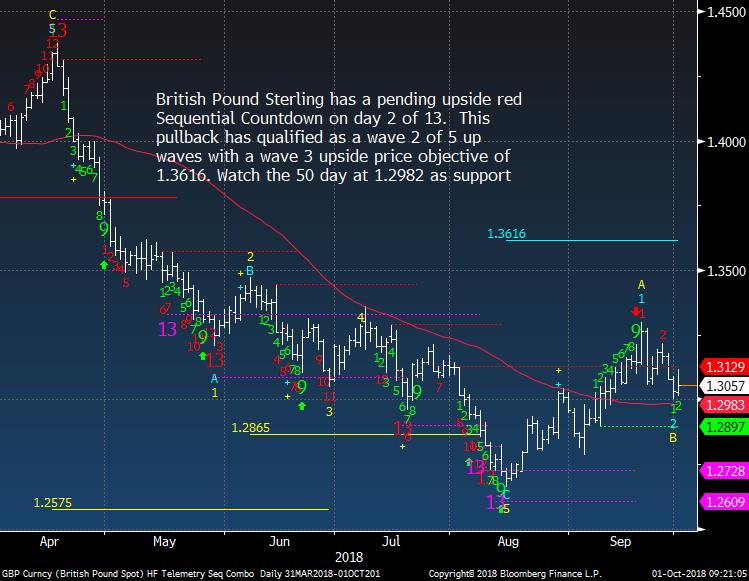
British Pound needs to bounce here
|
|
|
|
|
|
|
|
|
|
|
|
|
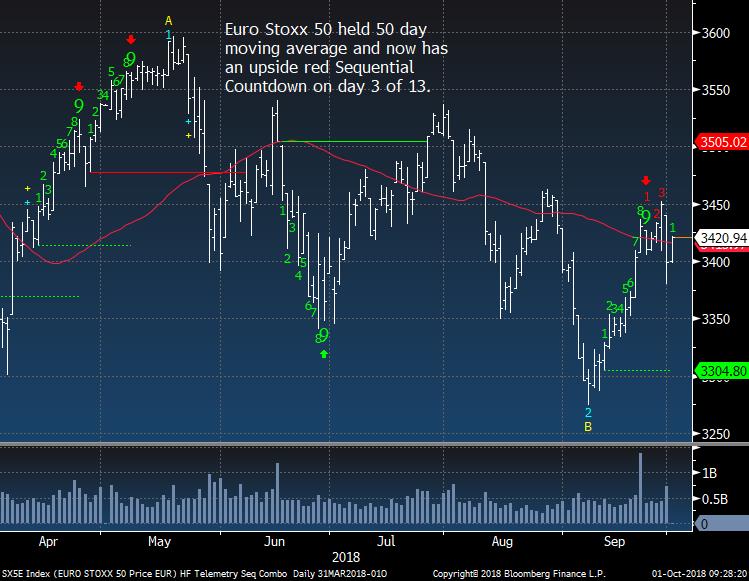
Euro Stoxx 50 above 3450 gets interesting
|
|
|
|
|
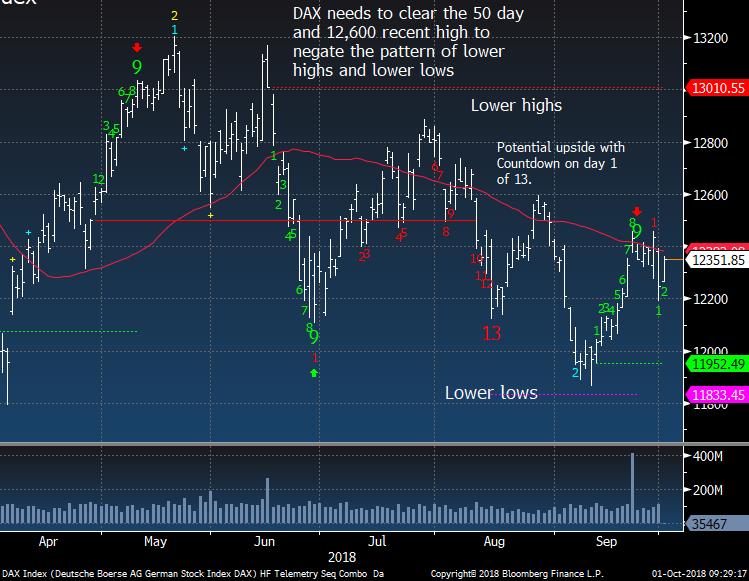
German DAX similar to Euro Stoxx 50
|
|
|
|
|
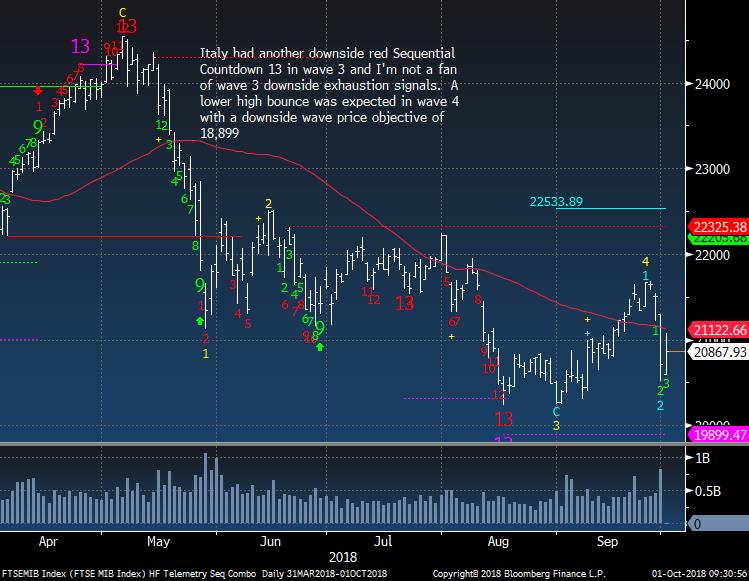
Italy still looks very weak
|
|
|
|
|
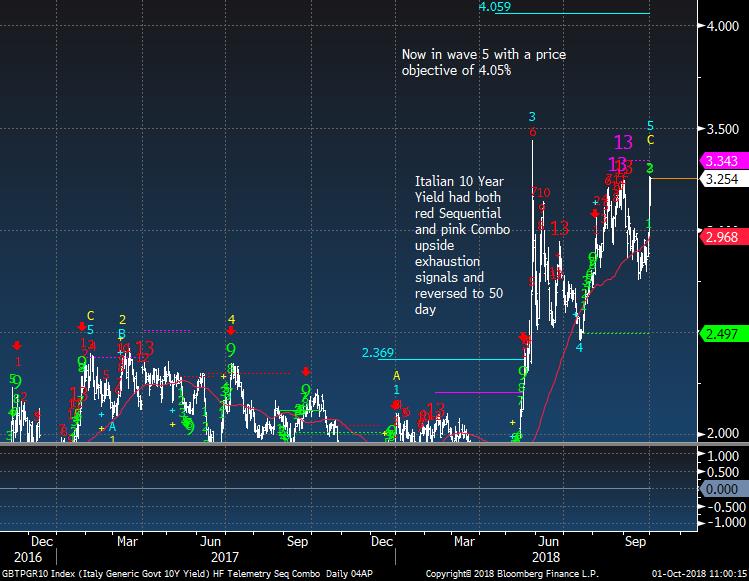
Italian 10 year has upside potential to 4.05%
|
|
|
|
|
|
|
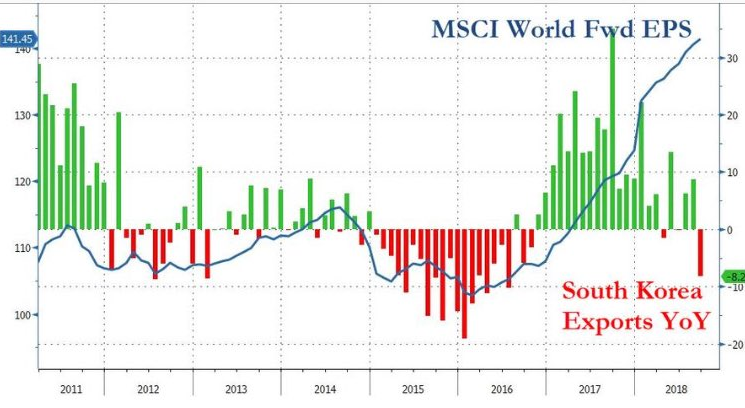
South Korean Exports - A canary in the coal mine indicator
|
|
|
Big drop in Korean exports and this has been an early warning when it drops under 0
|
|
|
|
|
|
|
|
|
|
|
|
|
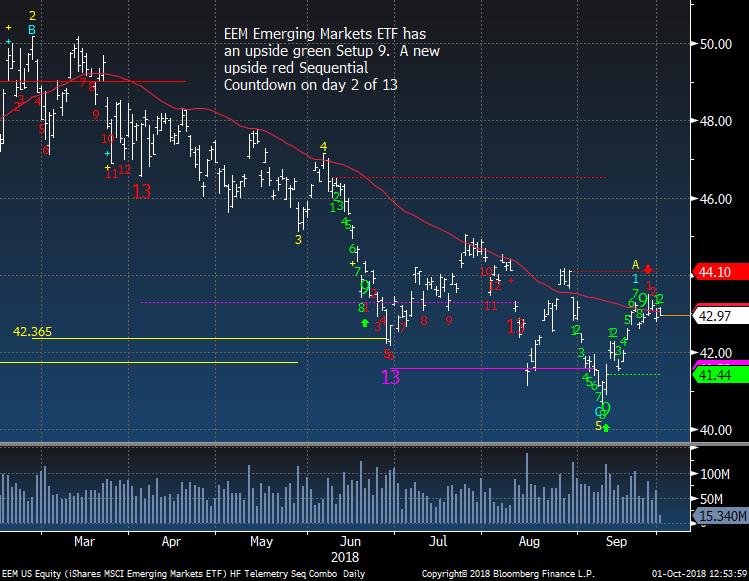
EEM Emerging Markets ETF stuck here and with China closed all week don't expect much
|
|
|
|
|
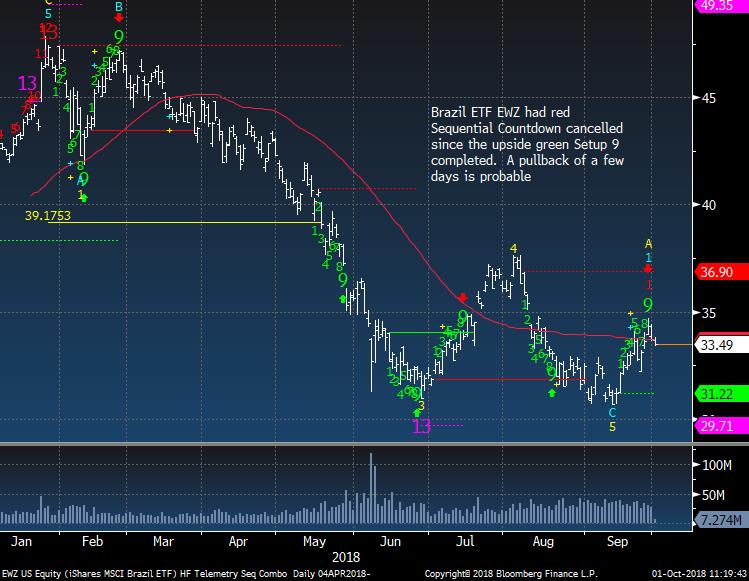
Brazil is trying to bottom but I do not have conviction to buy yet
|
|
|
|
|
|
|
|
|
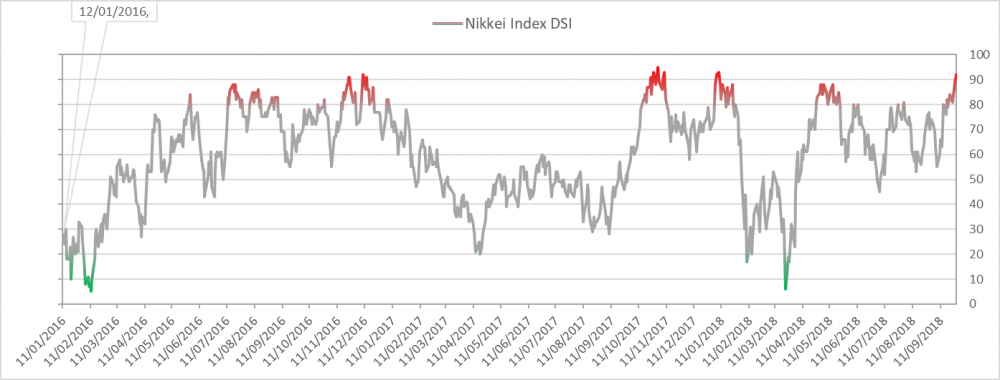
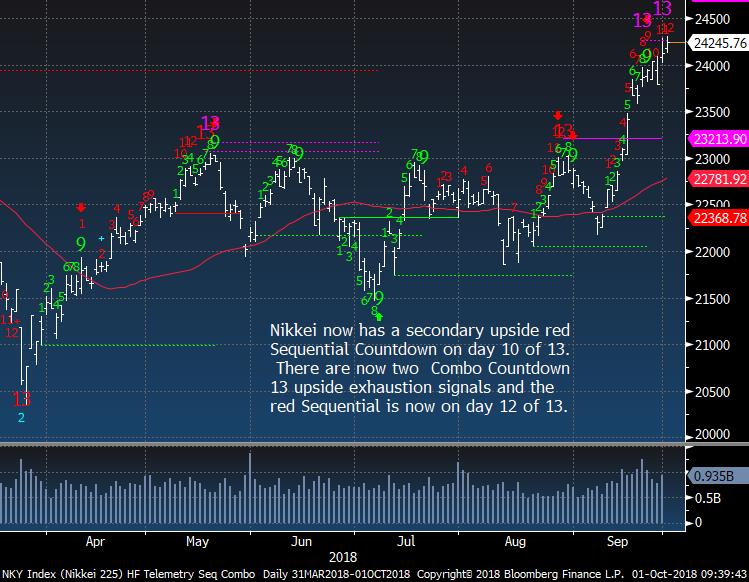
Nikkei bullish sentiment is at 92% and is very extreme.
|
|
|
|
|
Nikkei with some upside exhaustion signals
|
|
|
|
|
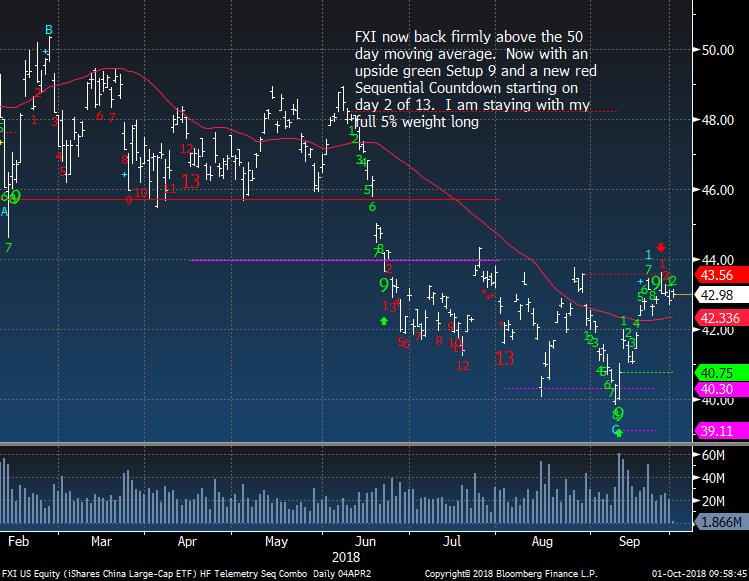
China / Hong Kong FXI ETF should not move much with China closed for the week
|
|
|
|
|
|
|
|
|
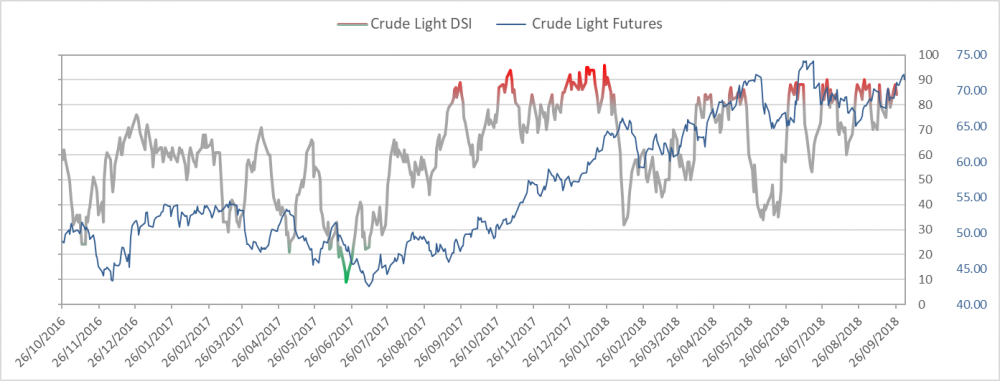
Crude bullish sentiment is at 94% and is very extreme
|
|
|
|
|
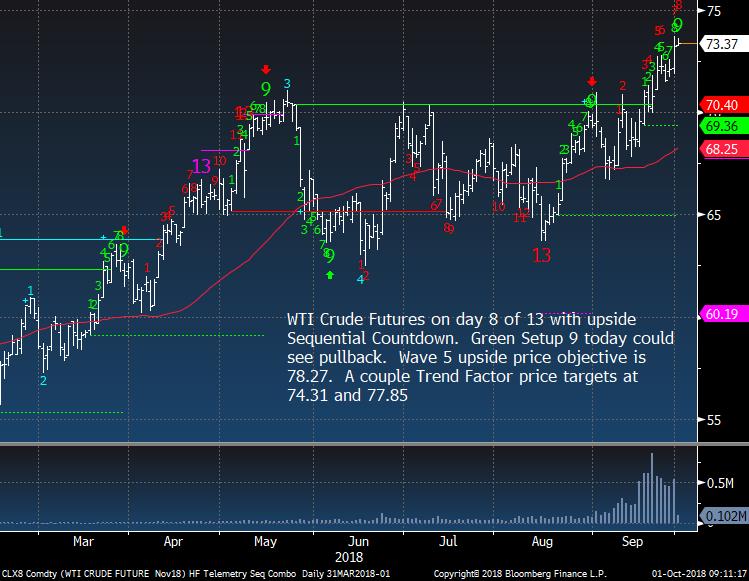
WTI Crude Futures getting late in the move but I still have a bullish bias. Entry here not advised
|
|
|
|
|
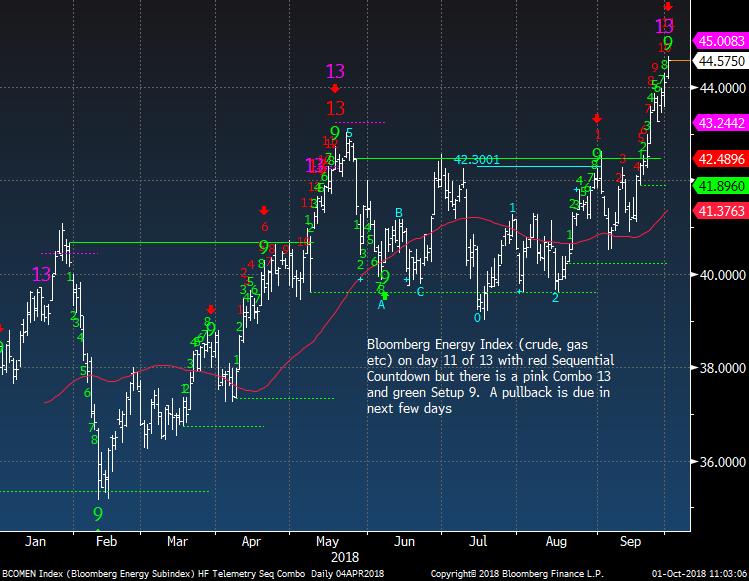
Bloomberg Energy Index has some upside exhaustion signals
|
|
|
|
|
|
|
|
|
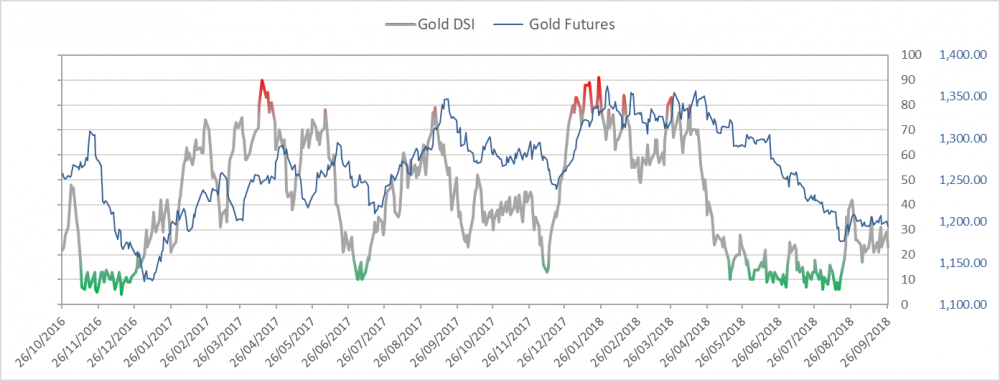
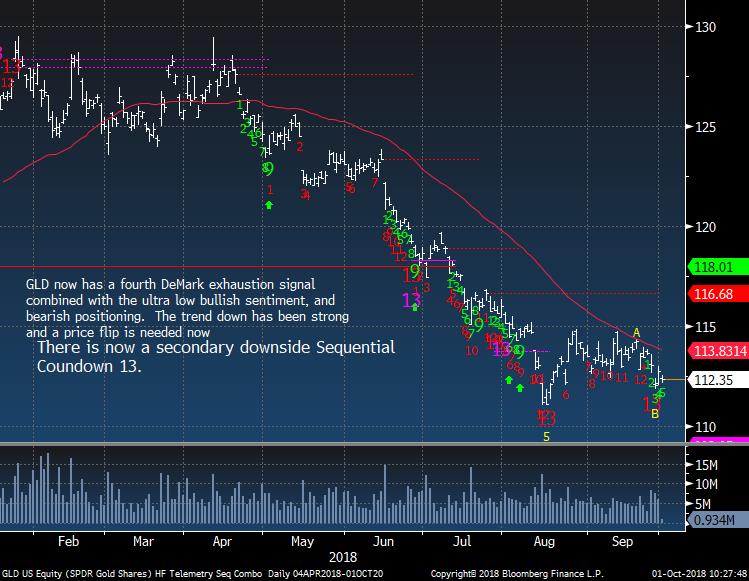
Gold bullish sentiment is at 18%
|
|
|
|
|
|
|
|
|
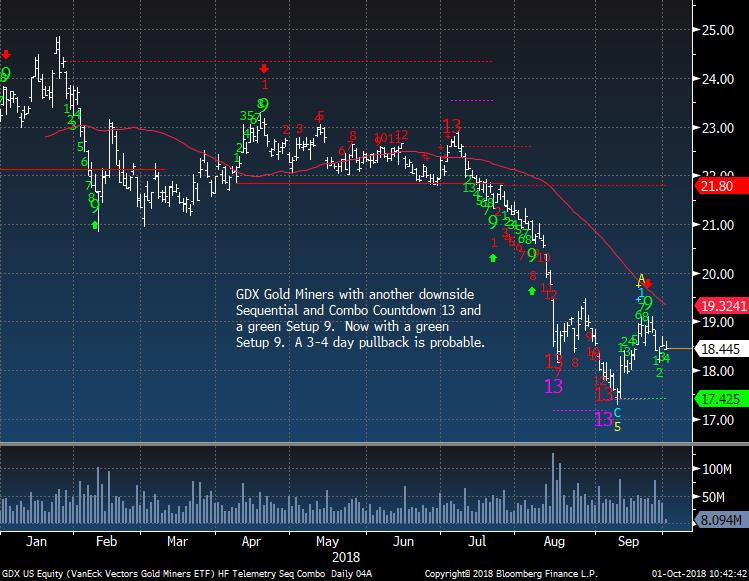
GDX was stopped out with a very tight stop. I'm still biased long here but want to see more work done on the upside
|
|
|
|
|
|
|
|
|
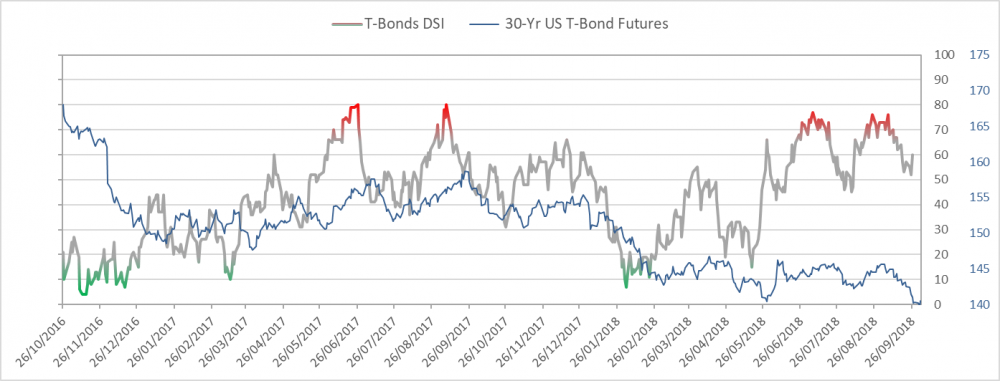
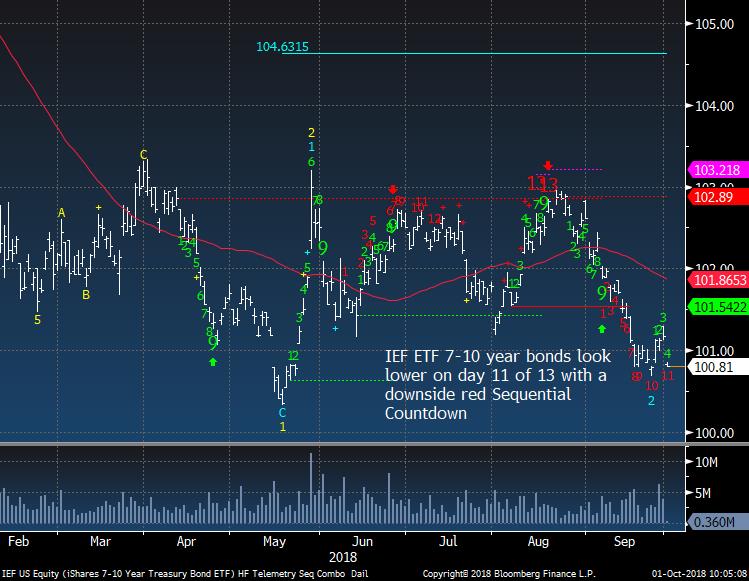
Bond bullish sentiment is at 58%
|
|
|
|
|
|
|
|
|
|
|
|
|
|
|
|
|
|
|
|
|
|
|
DEMARK SCREENS - Daily, Weekly, Monthly Upside/Downside Exhaustion Signals
|
|
|
Daily/Weekly DeMark upside/downside exhaustion signals (Sequential) updated daily, Weekly signals on Monday's and monthly on the first day of the new month. Price flips occur when a stock closes higher/lower than four previous closes and increases conviction of a price turn.
The upside 13's are sell signals and downside 13's are buy signals. Price flip's are confirmation signals that increases potential for a price trend change. For example, if you are long a stock and there is an upside 13, you will want to take cautious action by selling down or out of a position. If initiating a short sale with the upside 13's, we tend to start with a 1/2 size and add with the downside price flip. The opposite is true for when there are downside 13's. Take a 1/2 size position
and add with the upside price flip. The DeMark Indicators are designed to assist the user with buying into weakness and selling into strength to anticipate trend exhaustion. Selling into a rally and buying into a decline often afford the opportunity to exit a trade without too serious a loss if wrong.
S&P 500 Universe:
DAILY UPSIDE 13: NONE
DAILY DOWNSIDE 13: CBRE, DVN
DAILY UPSIDE WITH PRICE FLIP REVERSAL DOWN: GLW, PFE, UDR
DAILY DOWNSIDE WITH PRICE FLIP REVERSAL UP: JBHT
Updated: 10/1/18
WEEKLY UPSIDE 13: BSX, HOLX, NKE, TDG
WEEKLY DOWNSIDE 13: NONE
Updated: 10/1/18
MONTHLY UPSIDE 13: ADSK, ALL, CCI, CME, DE, DLR, DTE, ETN, GLW, HPQ, INTU, PH, TPR, TXT, UPS, XLNX
MONTHLY DOWNSIDE 13: NONE
Euro Stoxx 600 Universe:
DAILY UPSIDE 13: DEC FP, DOKA SW, TLW LN
DAILY DOWNSIDE 13: BPE IM, TEL2B SS
DAILY UPSIDE WITH PRICE FLIP REVERSAL DOWN: CS FP, LDO IM, NN NA, US IM
DAILY DOWNSIDE WITH PRICE FLIP REVERSAL UP: BA/ LN, BOSS GR, GFTU LN, O2D GR
Updated: 10/1/18
WEEKLY UPSIDE 13: HELN SW, SKY LN
WEEKLY DOWNSIDE 13: FNTN GR
Updated: 10/1/18
MONTHLY UPSIDE 13:
BNZL LN, EXPN LN, FPE3 GR, SBMO NA, SECUB SS, SWEDA SS
MONTHLY DOWNSIDE 13: BAYN GR, HMB SS, TEF SM
|
|
|
Unsubscribe me from Hedge Fund Telemetry
Hedge Fund Telemetry LLC, P.O. Box 4675, Greenwich, CT 06861, United States
CONFIDENTIALITY NOTE and DISCLAIMER: This message is for the named person's use only. It may contain confidential, proprietary or legally privileged material. No confidentiality or privilege is waived by any accidental or unintentional transmission. If you receive this message in error, please immediately delete it and all copies of it from your system, destroy any hard copies and notify the sender. You must not, directly or indirectly, use, disclose,
distribute, print or copy any part of this message if you are not the intended recipient. Hedge Fund Telemetry LLC. cannot guarantee the confidentiality of the material transmitted; therefore, information of a sensitive or confidential nature should not be transmitted. There is risk in trading markets. Hedge Fund Telemetry LLC reports are based on information gathered from various sources and believed to be reliable, but are not guaranteed as to accuracy and completeness. The information is subject to change without notice and Hedge Fund Telemetry LLC has no obligation to provide any updates or changes. Hedge Fund Telemetry LLC is providing this data for informational and educational purposes and does not believe that it is sufficient to base an investment decision on. This information should not be regarded as a solicitation or recommendation of any particular security or to engage in any trading strategy. One should always check with your licensed financial
advisor to determine suitability of any investments.
|
|
|
|
|