|
|
|
|
|
|
One of the big sector themes is at risk - The Cloud
|
|
|
Morgan Stanley's technology team put out a note today that is getting no attention. They are saying Cloud capex should slow into 2019. They cite tough comps and a digestion period after heavy recent investment in past few years will see slower growth. Their Asian team has seen China capex slowing too (Ali Baba etc). There has been a massive build out of mega data centers that has fueled the tech sector and from my tech analyst friends, it was front loaded for 2018 after a huge 2016-2017. The semiconductor sector is most at risk since everything that goes into the hardware that powers the data centers has seen a large build up in inventories and semiconductor capital equipment makers have been beat up with the evidence of the large inventory of chips. I've been saying watch the canary in the coal mine semi cap names for months and now MS is out strongly with this slow down call in not only capex spending but in US cloud demand. One thing to look out for is a price competition battle between the large cloud providers. Amazon and Microsoft have been the leaders while others like Oracle and IBM have a tough road ahead with inferior cloud offerings and at a higher price level too. This matters since tech has been one of the best sectors since the lows in February 2016 and has powered the Nasdaq 100. With earnings ahead for tech companies, the theme of lowered guidance will be what the stocks will move on after reporting.
The Fed will be raising rates today and it will be interesting to see if the market fades as it has in the previous three hikes late in the day. Bespoke has a great chart that I posted below.
Tesla has risen after the DOJ announced a criminal investigation of Elon Musk and Tesla. Mind boggling. There are clear signs of inventory, lack of demand, end of fictitious 420k backlog for Model 3 but it is the end of the quarter and they will pull out the stops to pump up production. They report on Halloween afternoon and it will certainly be a "Trick or Tweet" earnings report and conference call.
I'm headed to Dallas to visit my daughter who is attending SMU this Friday and will not be publishing a Daily Note. And if any clients want a copy of "DeMark Indicators" by Jason Perl, please let me know and I will send you the book. It's very informative and useful.
- US Markets - Sentiment still divergent from index prices.
- Hedge Fund Telemetry Trade Ideas - IBM, WHR
- Risk-On Risk-Off Index and Goldman Sachs Financial Conditions Index
- Morgan Stanley Cloud Capex Index - And a look at semiconductors and Tech
- After the Fed announcement sell offs
- US Sector Focus - Communications Services XLC
- PPO Monitor
- Bloomberg Technical Pattern Automated Screen
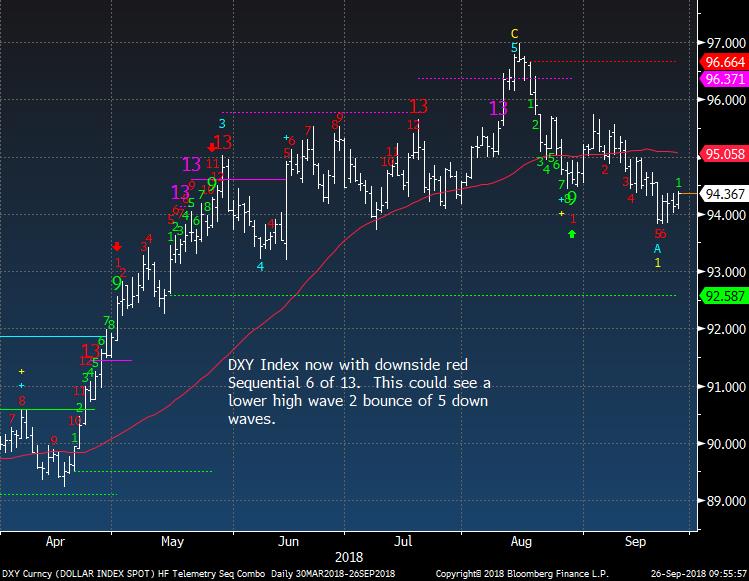
- Currency Update - With USD sentiment so low a lower high bounce can't be ruled out
- European Market Update - Still hanging out at 50 day with little momentum
- Global Market Update EEM holding firm... for now
- Asian Market Update - Nikkei is getting late in the upside move and FXI looks OK still
- Crude Update - Extreme bullish sentiment is a limiting factor
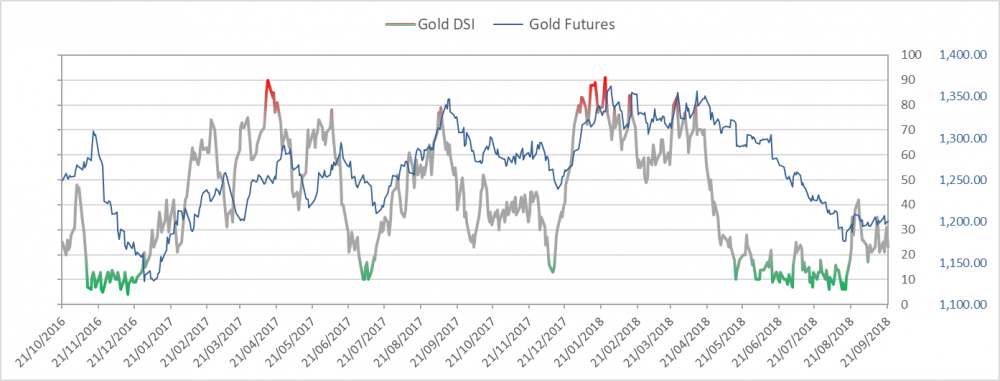
- Gold Update - Still sideways
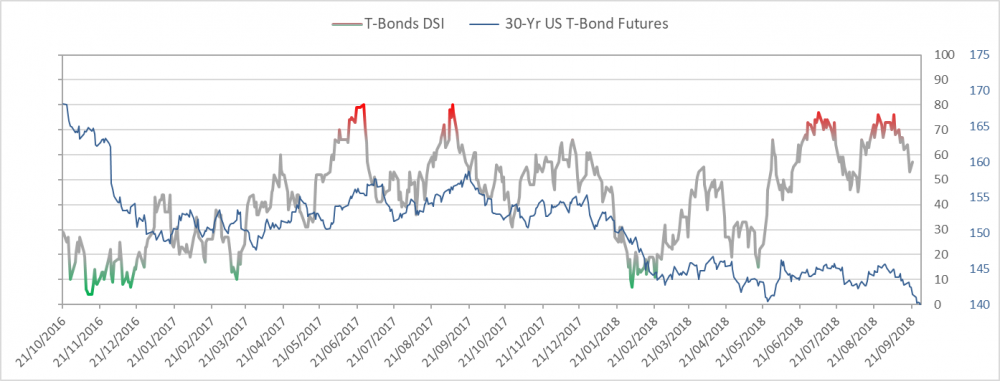
- Bond Update - Upside in yields is limited from here
- DeMark Screens - Daily, Weekly, Monthly upside/downside exhaustion signals within the S&P 500 and Euro Stoxx 600 WE ARE NOW HIGHLIGHTING STOCKS ARE MOST ACTIONABLE
|
|
|
|
|
Here's a link to the Hedge Fund Telemetry market sentiment page with 40 charts of sentiment including equities, bonds, currencies, and commodities updated each day. When the new website launches we will be adding new charts and historical sentiment data for Euro Stoxx 50, UK FTSE 100, German DAX, French Cac 40. We will be adding Japanese Bonds, German Bunds, and a few more.
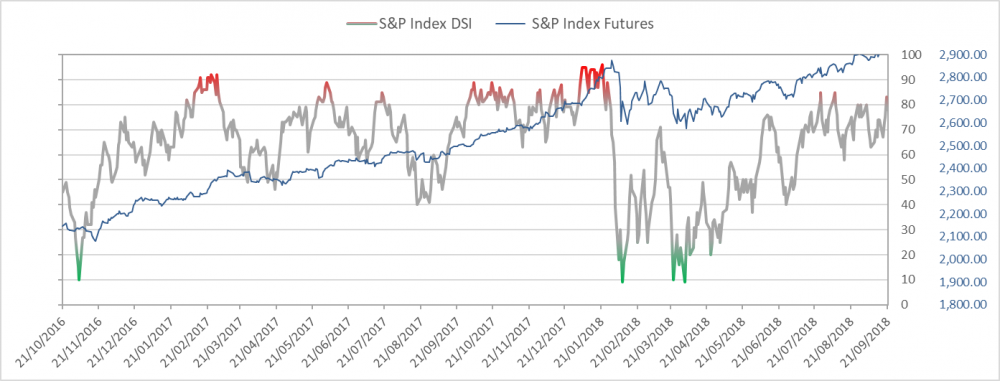
SPX bullish sentiment is at 70%
|
|
|
|
|
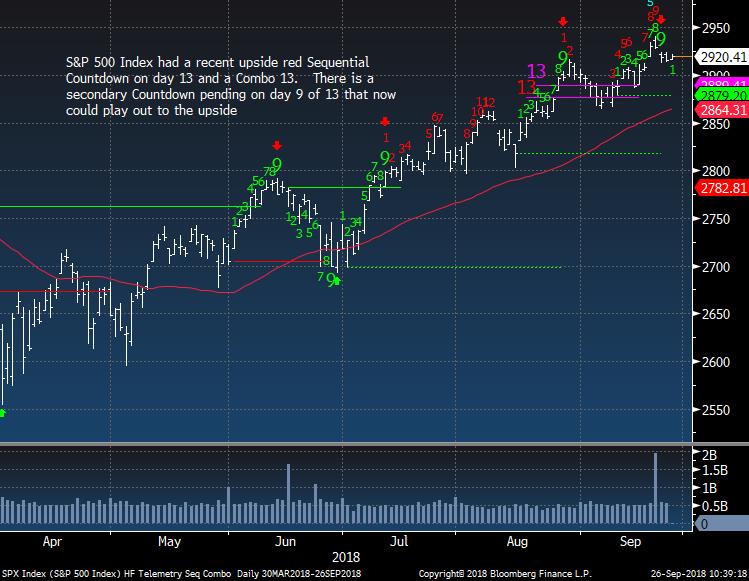
SPX daily still has potential for a nominal new high with recent upside secondary Countdown
|
|
|
|
|
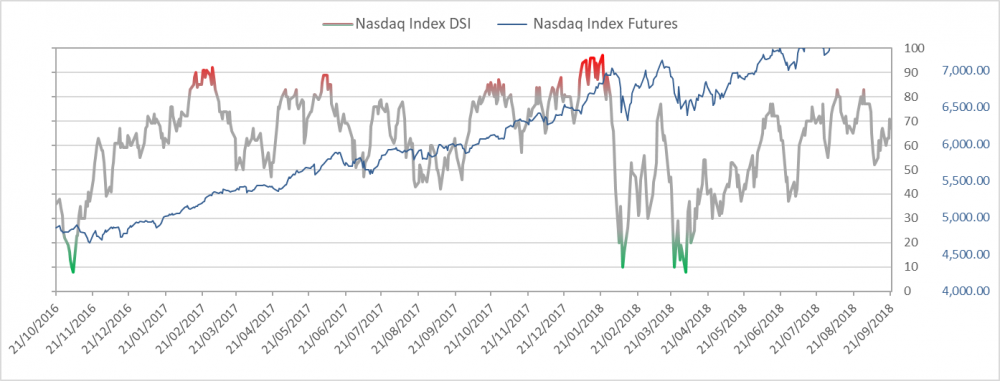
Nasdaq bullish sentiment is at 72%
|
|
|
|
|
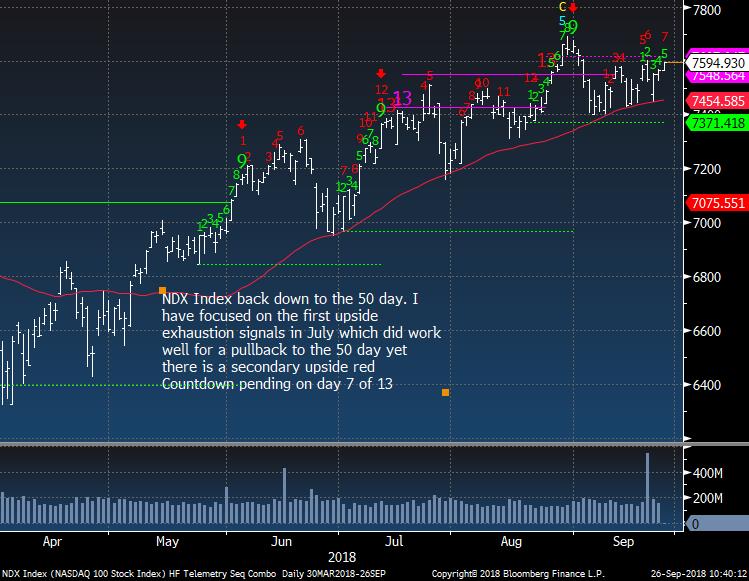
NDX Index bounced again off the 50 day and is on day 7 of 13
|
|
|
|
|
|
|
|
|
|
|
Hedge Fund Telemetry Trade Ideas
|
|
|
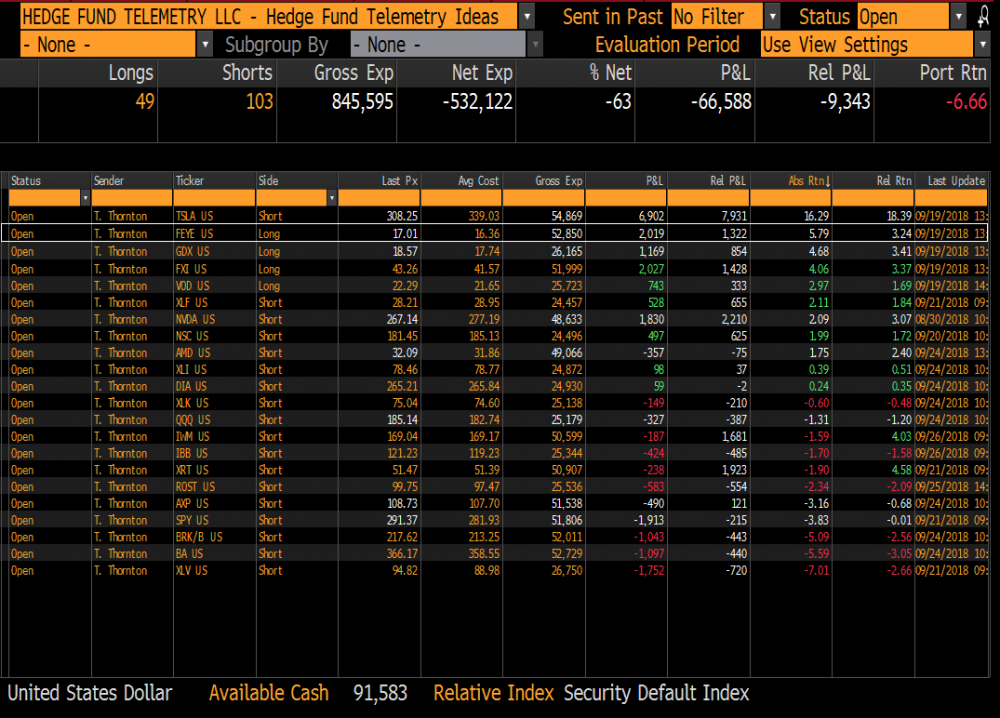
Trade Ideas Sheet - Long and short US equity ideas including ETF's. We will be overhauling the Trade Ideas Sheets for long only, short only, ETF's when the new website rolls out soon. There will also be a clearer email distribution with changes.
Trade Ideas Changes: Stopped on IBM short, and WHR long both 2.5% sized. No other changes
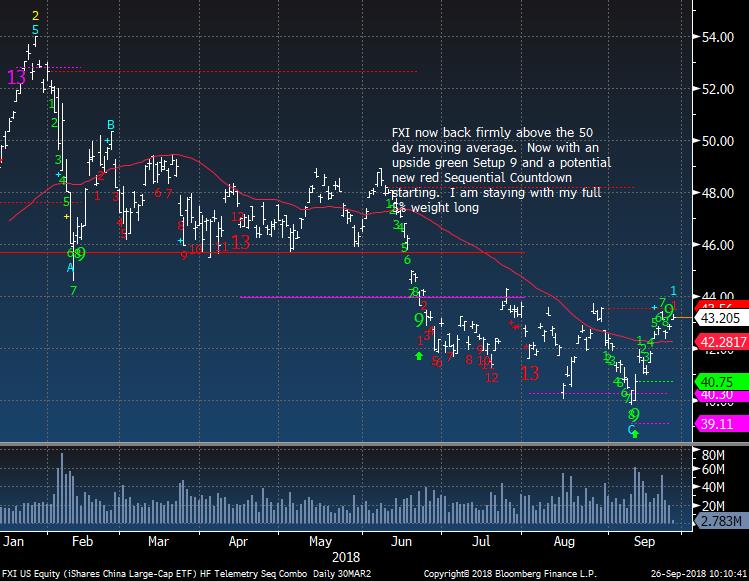
Stops on everything. TSLA 320, GDX 18.35 , VOD 21.95, FEYE 16.00, FXI 41.95, NVDA 275, QQQ 185.50, XLK 77, SPY 295, XLY 118, AXP 114, WHR 120, XRT 53, IWM 172, XLV 95, BRK/B 225, IBM 153, DIA 275, XLI 81.50, IBB 123, AMD 35, ROST 100.50
|
|
|
|
|
|
|
After Fed announcement sell offs
|
|
|
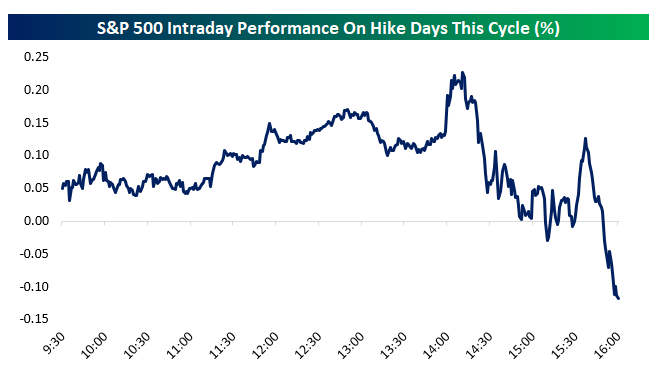
From Bespoke Research today
"There have been 3 occurrences Fed hikes and fading since last September, and the pattern that the S&P has taken on these days has been noteworthy.
As shown, the S&P has gotten off to a good start in the morning of these Fed Days, but afternoon trading has been a different story. After a drift lower from noon to 1:30 PM ET, we’ve seen the S&P catch a bid into the 2 PM rate announcement. From 2 PM to the close, however, we’ve seen the equity market sell-off pretty sharply to take the index into the red by 20+ basis points by the close of trading. It's a small sample size, but something to keep in mind especially with futures already off their highs."
|
|
|
|
|
|
|
Risk-On Risk-Off and Goldman Sachs Financial Conditions Index
|
|
|
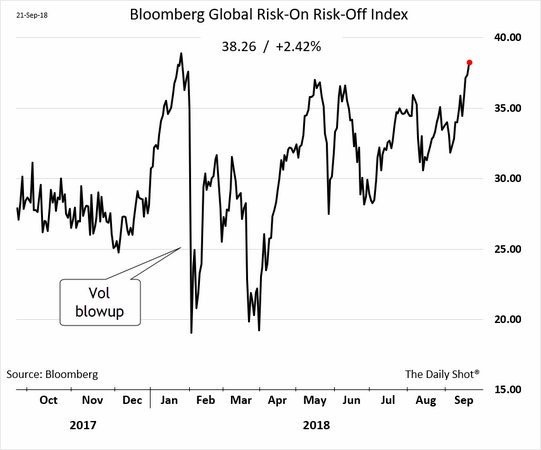
Back to old highs for Risk-on Risk-off Index.
|
|
|
|
|
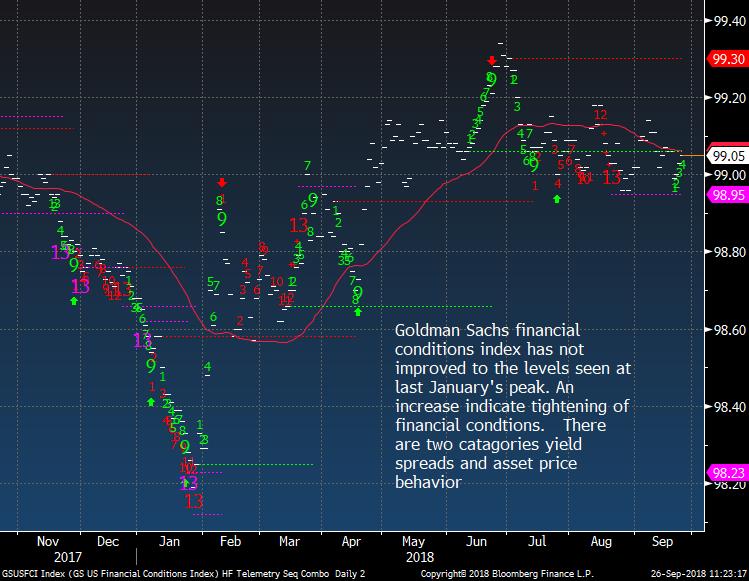
GS Financial Conditions Index has not returned to the low levels seen back in January.
|
|
|
|
|
|
|
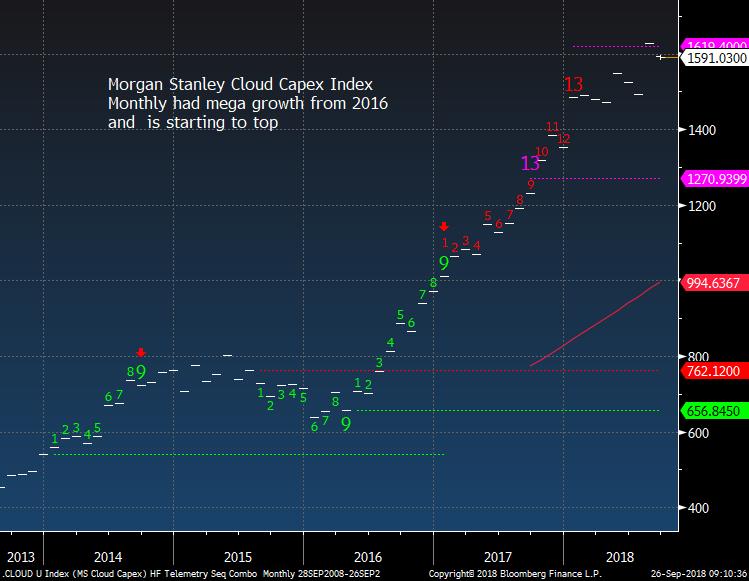
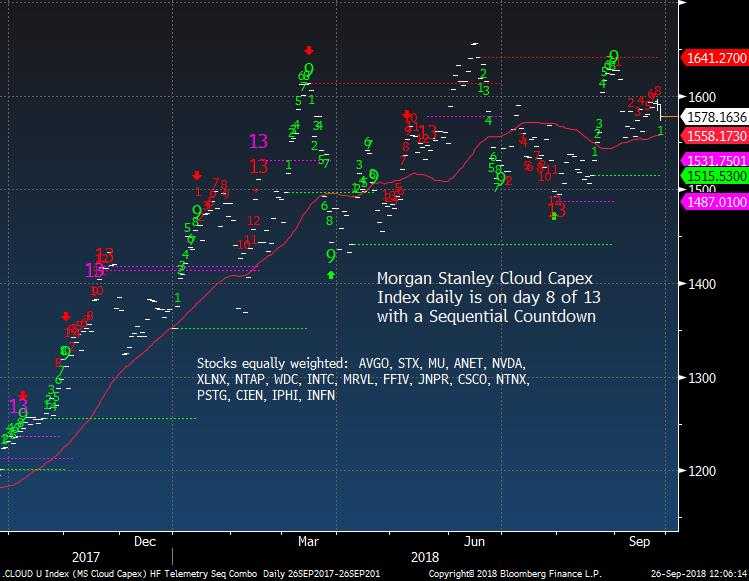
Morgan Stanley Cloud Capex Index
|
|
|
I created a custom index of the MS Cloud Capex names. It's really clear how much this group has gained since the build out boom from 2016
|
|
|
|
|
The daily has been stalling and chopping all year
|
|
|
|
|
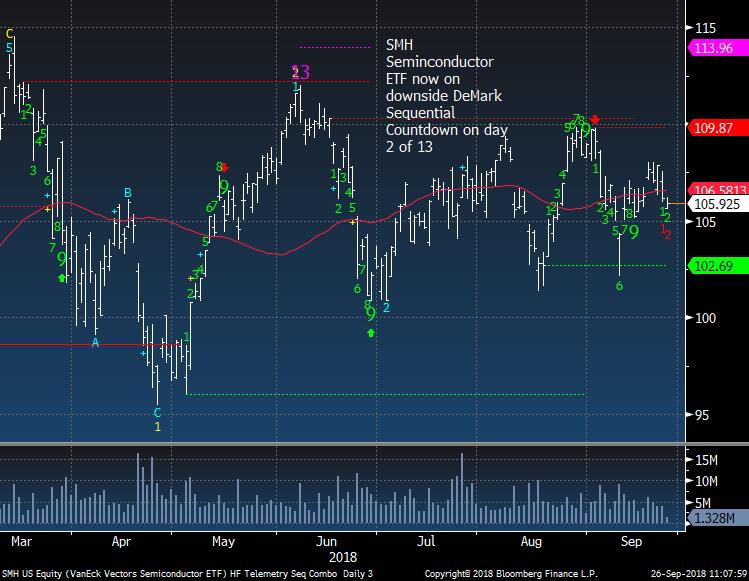
Semiconductors look vulnerable to the downside
|
|
|
|
|
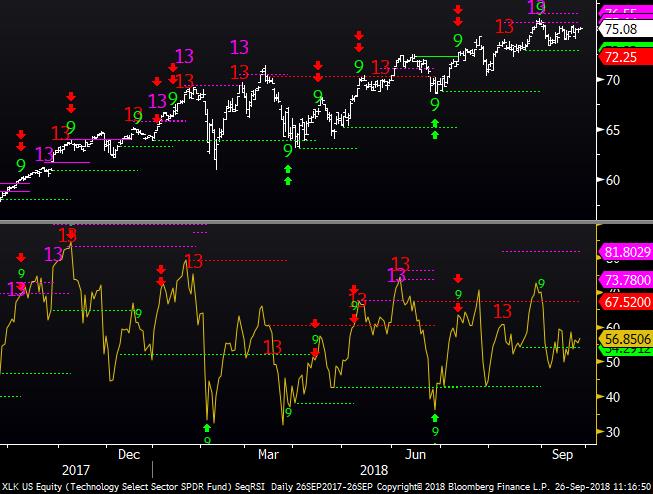
XLK RSI (bottom indicator) has been relatively weak and divergent
|
|
|
|
|
|
|
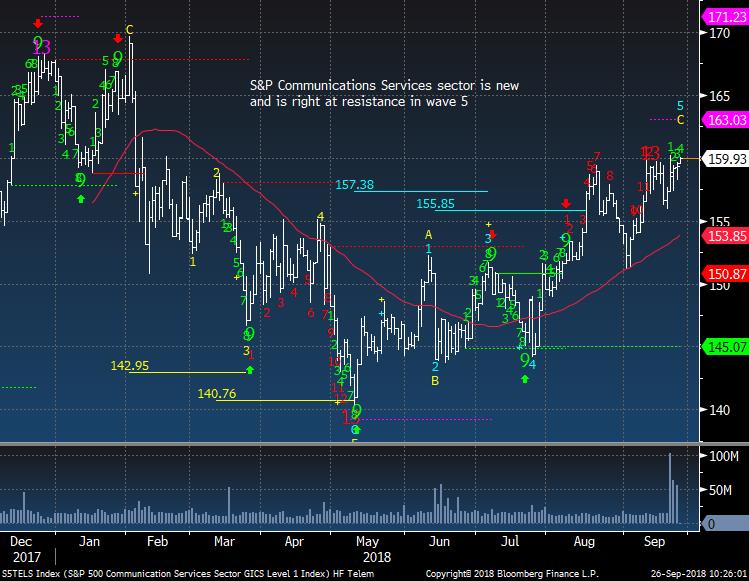
US Sector Focus - Communications Services XLC
|
|
|
Right at resistance and well off January highs
|
|
|
|
|
|
|
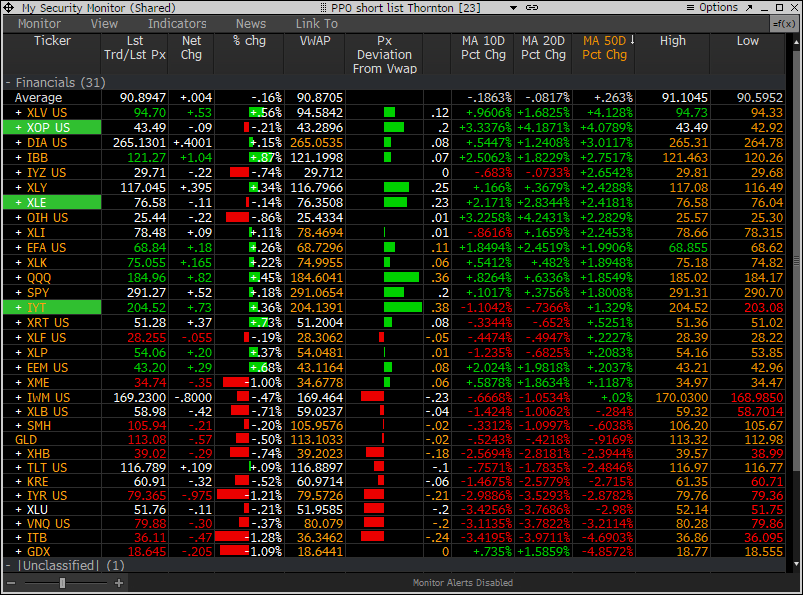
PPO Monitor - Percentage Price Oscillator
|
|
|
The PPO Monitor is a proprietary monitor developed to force rank Indexes, Sectors, and Stocks. It ranks top down by strongest to weakest by percentage above/below the 50 day moving average. Shorter term signals can be seen when the 10 and 20 day moving averages turn up (green) or down (red) which often are followed by the 50 day moving average. This is useful to watch for historically overbought/oversold percentage above/below the 50 day moving average. It is non correlated with the DeMark Indicators however we have found upside/downside exhaustion signals often occur when something rises to the top or drifts to the bottom of the monitor - increasing the timing aspect. We share this monitor with clients with Bloomberg Terminals. An added feature is that each market/ETF can be expanded with each component force ranked in the same way. A couple other features include price deviation from intraday VWAP (useful for intraday reversals) and new 20 day highs/lows on right side. Please inquire if you would like to be permissioned to use the PPO Monitor.
Today's highlights: They are buying what has been strongest and selling the weakest.
|
|
|
|
|
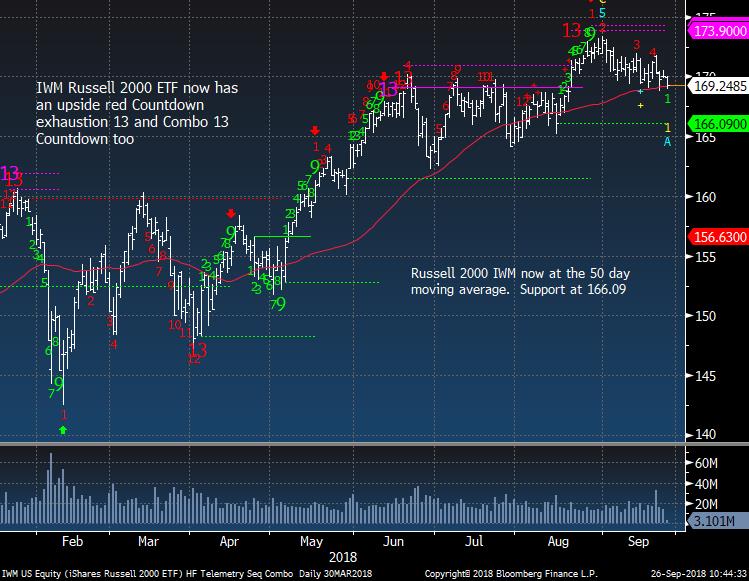
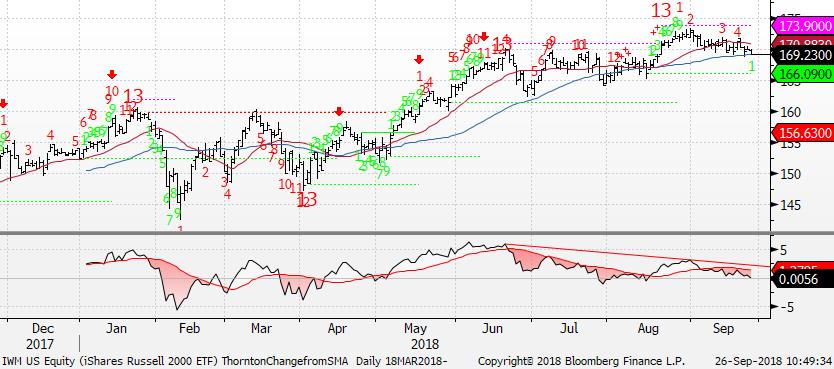
The following chart shows the Percentage Price Oscillator (50 day moving average) in action. IWM Russell 2000 has seen weaker and lower highs in % above the 50 day moving average
|
|
|
|
|
|
|
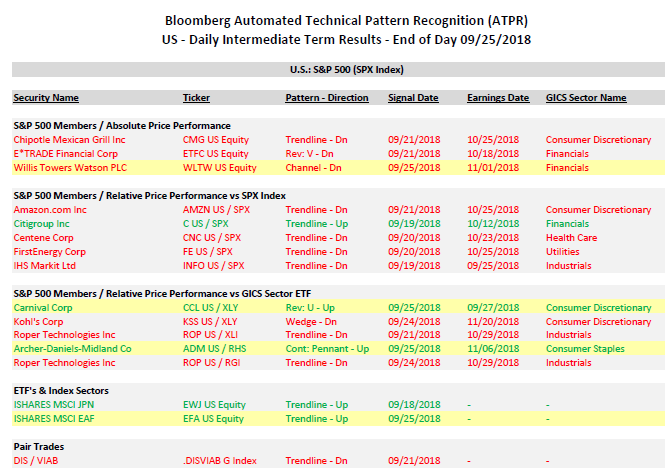
Bloomberg Automated Technical Pattern Recognition Screens
|
|
|
S&P 500 Members/Absolute Price Performance and Relative Price Performance vs S&P 500 and Sector ETF's. ETF's vs Index Sectors. Pair Trades. Long side is first symbol, short side is second symbol.
|
|
|
|
|
|
|
|
|
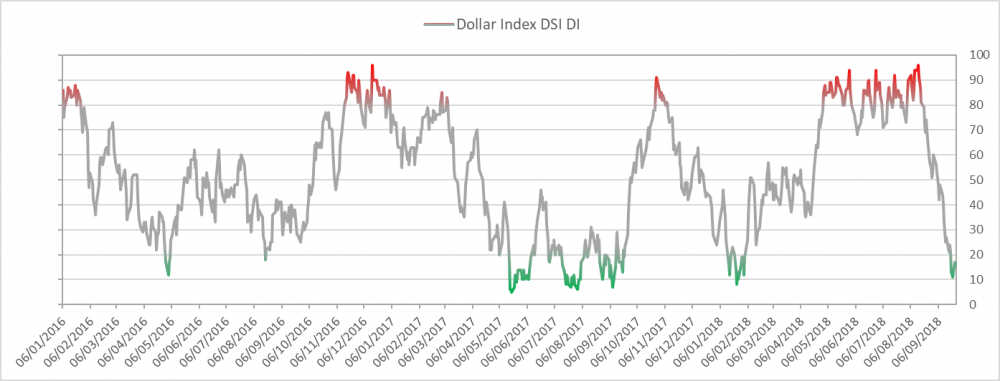
US Dollar bullish sentiment is at 16% down from recent high of 96%
|
|
|
|
|
|
|
|
|
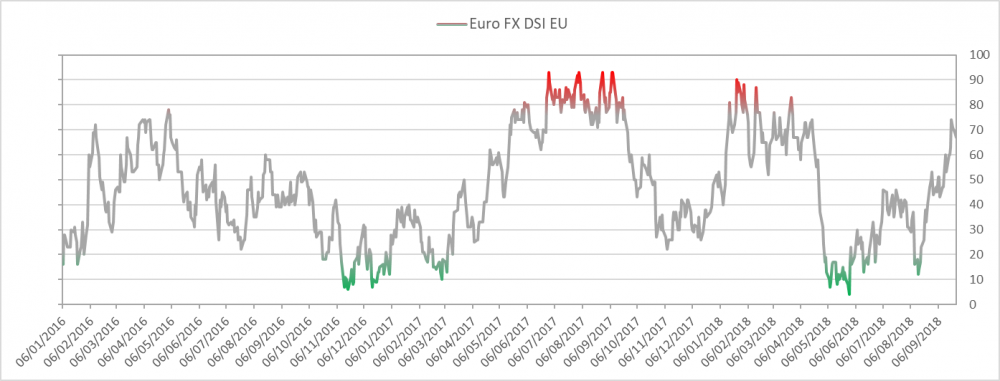
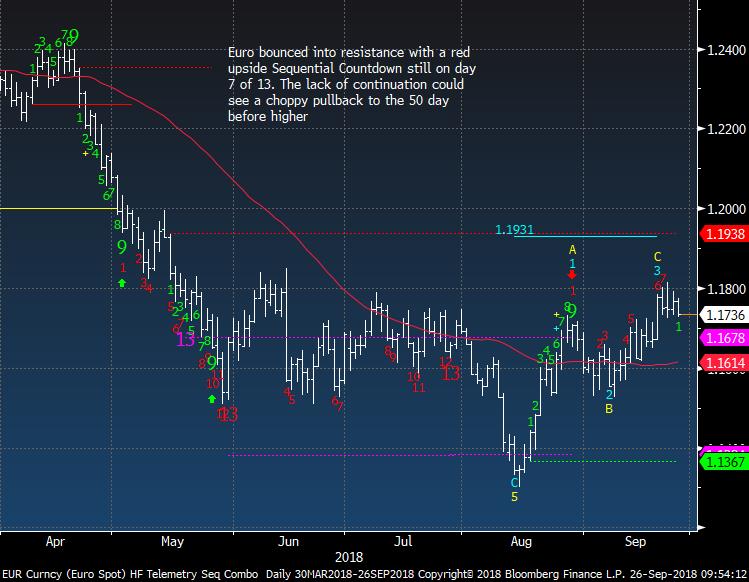
Euro bullish sentiment is at 67%
|
|
|
|
|
|
|
|
|
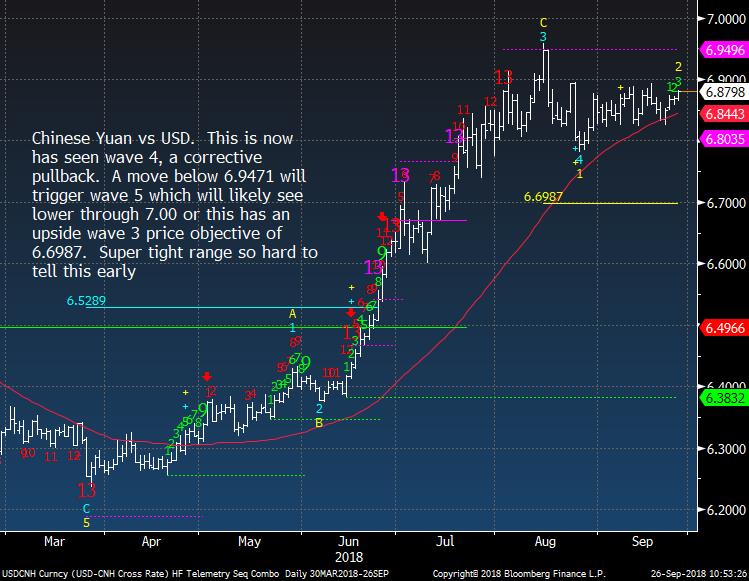
Yuan could break down under 6.90 soon and make headlines soon
|
|
|
|
|
|
|
|
|
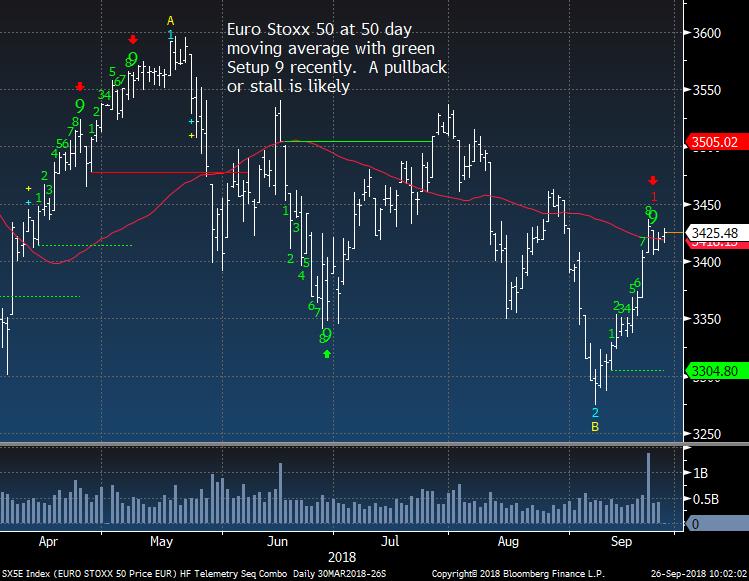
Euro Stoxx 50 holding the 50 day for now
|
|
|
|
|
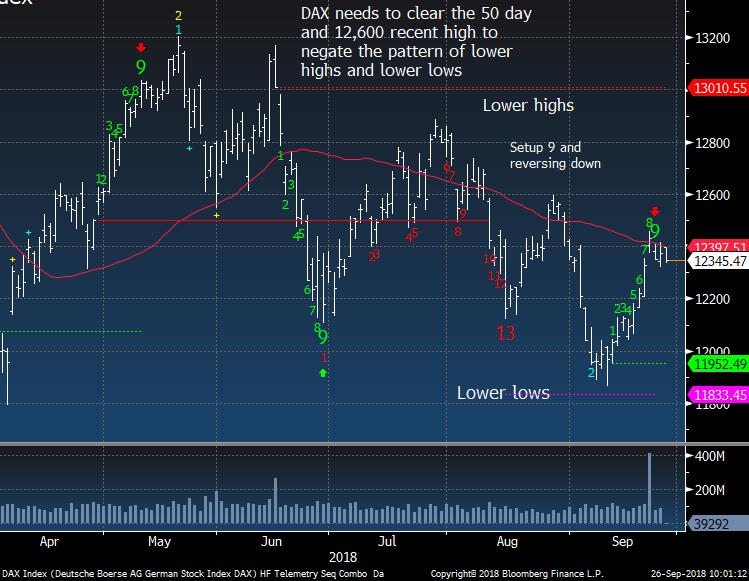
German DAX a little weaker than Euro Stoxx 50
|
|
|
|
|
|
|
|
|
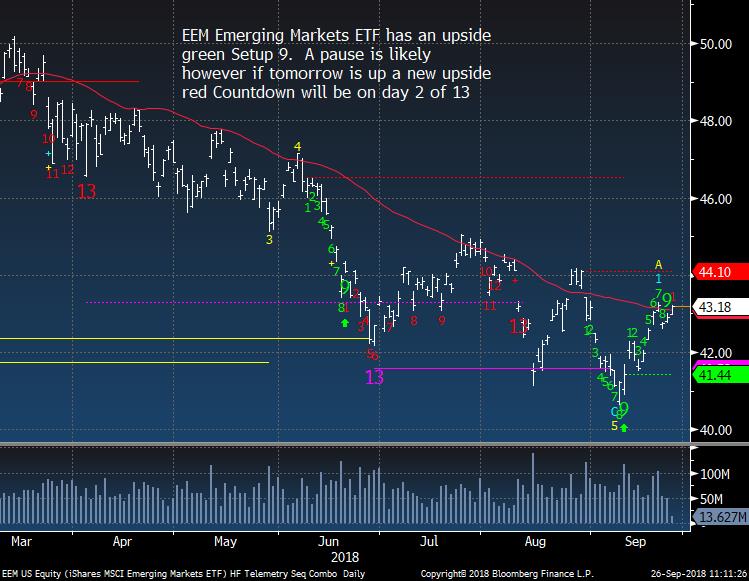
EEM Emerging Markets ETF holding 50 day.
|
|
|
|
|
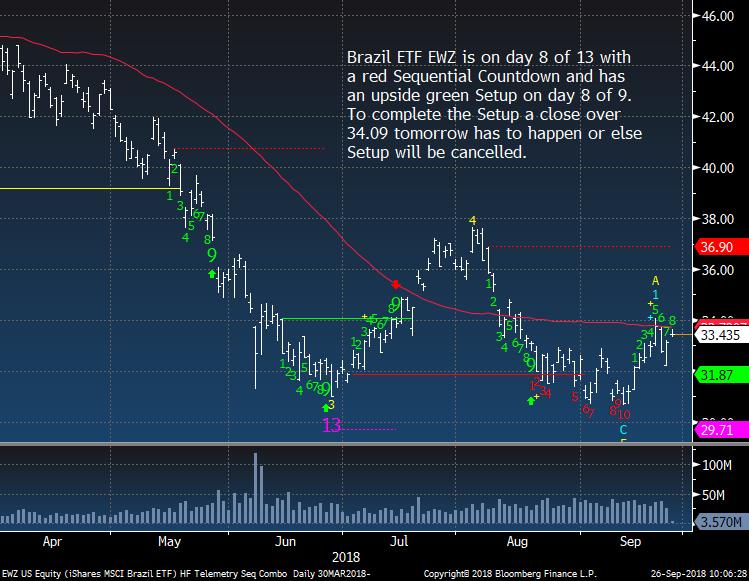
Brazil could continue higher but way too early to tell today
|
|
|
|
|
|
|
|
|
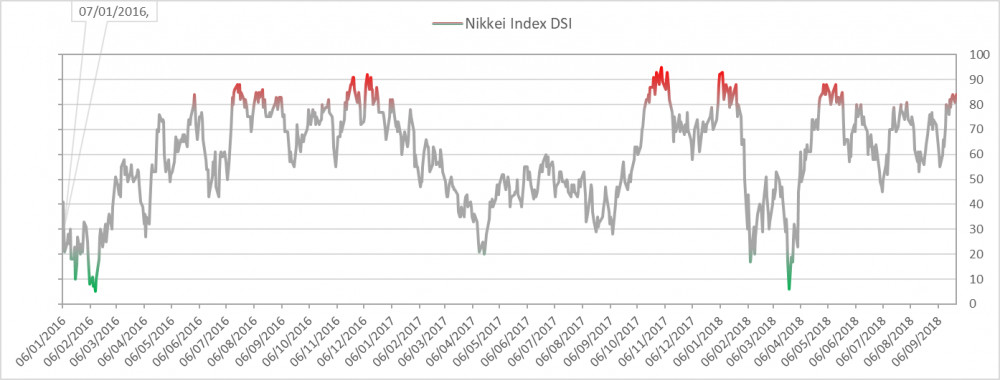
Nikkei bullish sentiment is at 84% and extreme
|
|
|
|
|
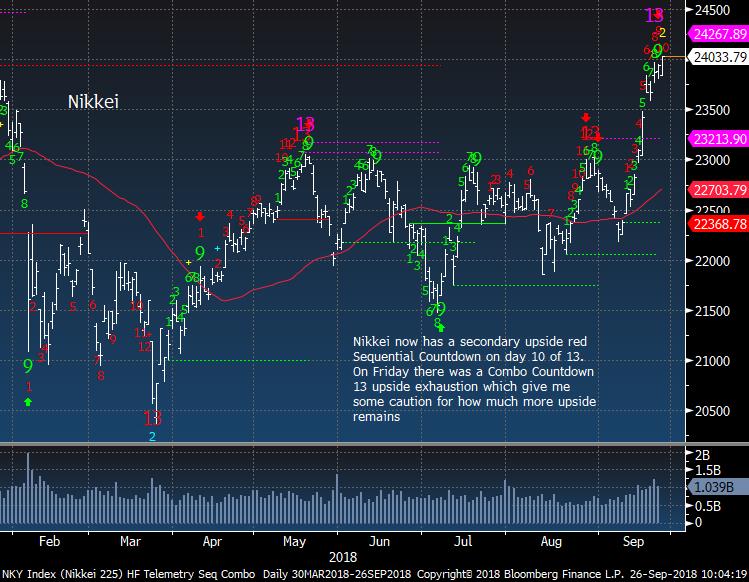
Nikkei is getting close to another top
|
|
|
|
|
China / Hong Kong FXI ETF could breakout above 44
|
|
|
|
|
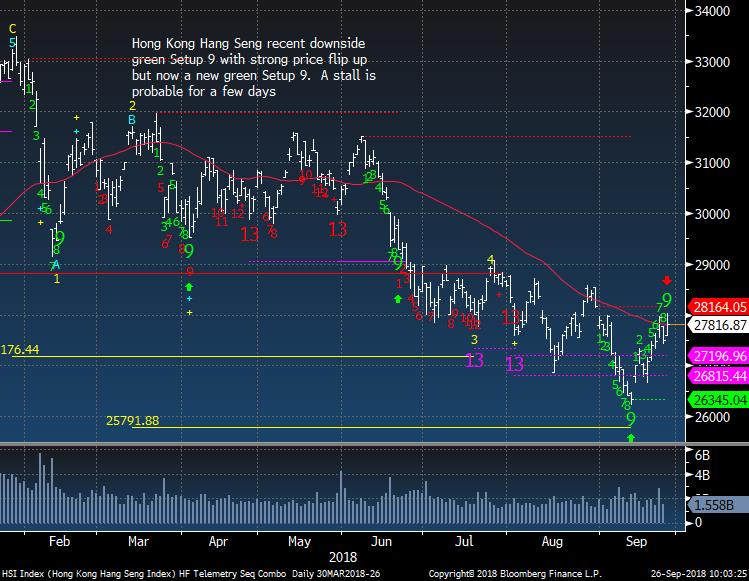
Hong Kong above the 50 day and really needs to prove itself above 29,000
|
|
|
|
|
|
|
|
|
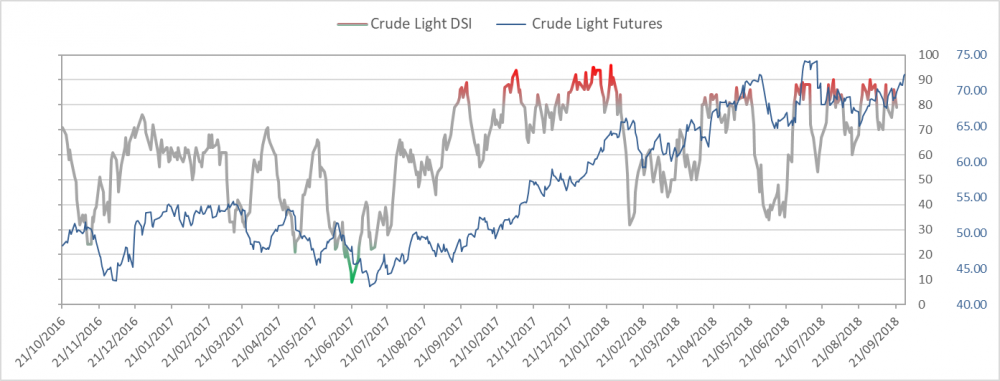
Crude bullish sentiment is at 88% and is extreme. This is a limiting factor to upside
|
|
|
|
|
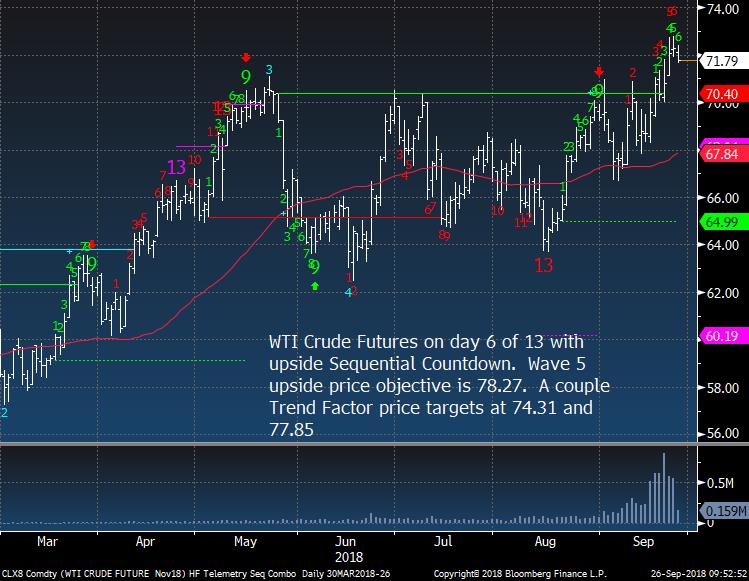
WTI Crude Futures still has an upside Countdown in progress
|
|
|
|
|
|
|
|
|
Gold bullish sentiment is at 29%
|
|
|
|
|
|
|
|
|
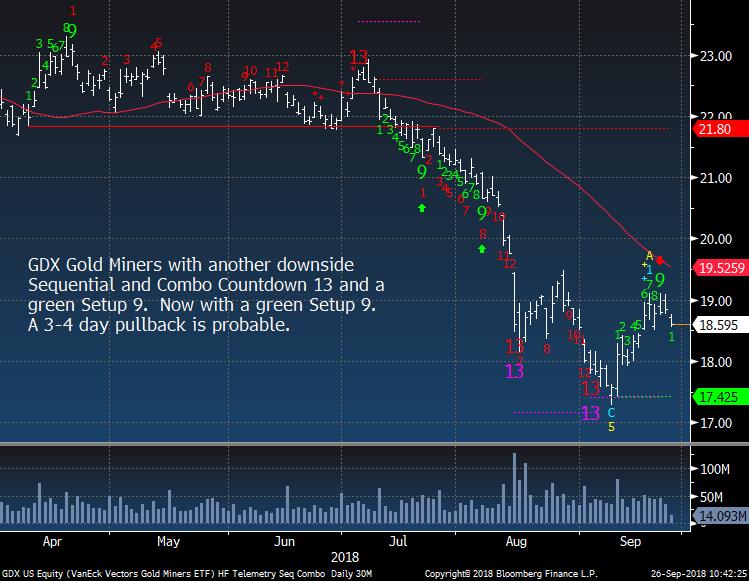
GDX Gold Miners pulling back after green Setup 9 as expected
|
|
|
|
|
|
|
|
|
Bond bullish sentiment is at 52% and the lowest level since early August
|
|
|
|
|
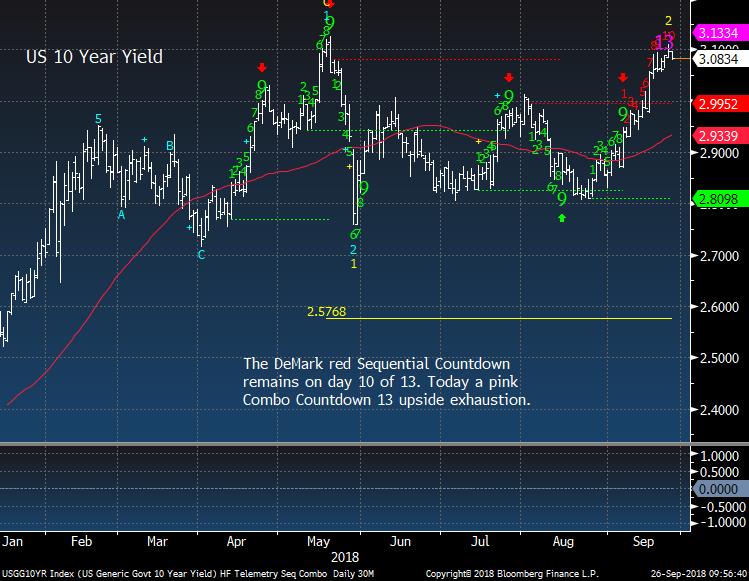
US 10 Year Yield is getting close to topping too
|
|
|
|
|
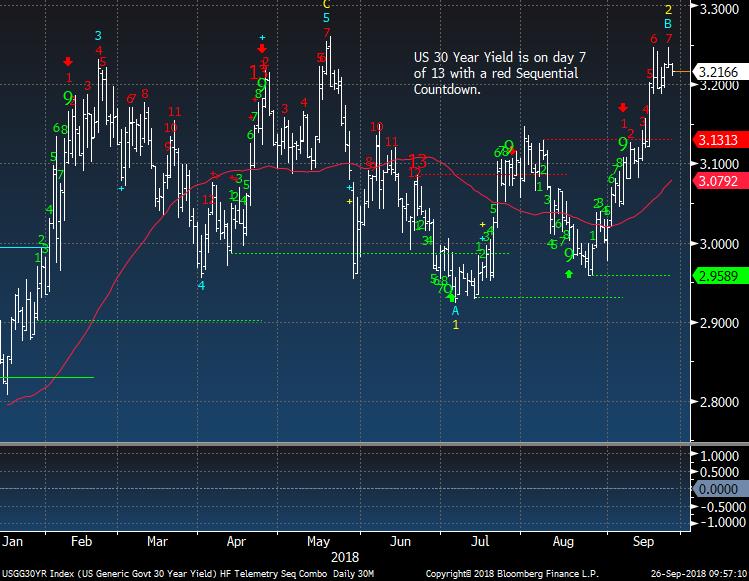
US 30 Year Yield has a little more upside potential
|
|
|
|
|
|
|
|
|
|
|
DEMARK SCREENS - Daily, Weekly, Monthly Upside/Downside Exhaustion Signals
|
|
|
Daily/Weekly DeMark upside/downside exhaustion signals (Sequential) updated daily, Weekly signals on Monday's and monthly on the first day of the new month. Price flips occur when a stock closes higher/lower than four previous closes and increases conviction of a price turn.
The upside 13's are sell signals and downside 13's are buy signals. Price flip's are confirmation signals that increases potential for a price trend change. For example, if you are long a stock and there is an upside 13, you will want to take cautious action by selling down or out of a position. If initiating a short sale with the upside 13's, we tend to start with a 1/2 size and add with the downside price flip. The opposite is true for when there are downside 13's. Take a 1/2 size position and add with the upside price flip. The DeMark Indicators are designed to assist the user with buying into weakness and selling into strength to anticipate trend exhaustion. Selling into a rally and buying into a decline often afford the opportunity to exit a trade without too serious a loss if wrong.
S&P 500 Universe:
DAILY UPSIDE 13: HCA
DAILY DOWNSIDE 13: TSN
DAILY UPSIDE WITH PRICE FLIP REVERSAL DOWN: ALB, ANTM, C, CAH, FLR, IBM, MYL, PH, PRU
DAILY DOWNSIDE WITH PRICE FLIP REVERSAL UP: EXR
Updated: 9/24/18
WEEKLY UPSIDE 13: BA, CHRW, DFS, EMR, GPN, NAVI, OKE
WEEKLY DOWNSIDE 13: NONE
Updated: 9/4/18
MONTHLY UPSIDE 13: AFG, AJG, AMD, CBT, CECO, EIG, IR, MAA, MRCY, MSA, MSFT, NSC, ORI, ROK, TDY, TTWO, UNT, UNP, WCG, WTR
MONTHLY DOWNSIDE 13: FTR, RRD, SMCI, SSI
Euro Stoxx 600 Universe:
DAILY UPSIDE 13: LDO IM, SWEDA SS
DAILY DOWNSIDE 13: INGA NA, JUP LN, RHM GR
DAILY UPSIDE WITH PRICE FLIP REVERSAL DOWN: DCC LN, FLS DC, G1A GR, SXS LN
DAILY DOWNSIDE WITH PRICE FLIP REVERSAL UP: DOM LN, GEN DC, GET FP, NXT LN, OCDO LN, SPR GR
Updated: 9/24/18
WEEKLY UPSIDE 13: BNR GR, VOLVB SS
WEEKLY DOWNSIDE 13: TCH FP
Updated: 9/4/18
MONTHLY UPSIDE 13: ACKB BB, GALP PL, IPN FP, KOMB CP, MTX GR, UCB BB
MONTHLY DOWNSIDE 13: ALPHA GA, BARC LN, TL5 SM
|
|
|
Unsubscribe me from Hedge Fund Telemetry
Hedge Fund Telemetry LLC, P.O. Box 4675, Greenwich, CT 06861, United States
CONFIDENTIALITY NOTE and DISCLAIMER: This message is for the named person's use only. It may contain confidential, proprietary or legally privileged material. No confidentiality or privilege is waived by any accidental or unintentional transmission. If you receive this message in error, please immediately delete it and all copies of it from your system, destroy any hard copies and notify the sender. You must not, directly or indirectly, use, disclose, distribute, print or copy any part of this message if you are not the intended recipient. Hedge Fund Telemetry LLC. cannot guarantee the confidentiality of the material transmitted; therefore, information of a sensitive or confidential nature should not be transmitted. There is risk in trading markets. Hedge Fund Telemetry LLC reports are based on information gathered from various sources and believed to be reliable, but are not guaranteed as to accuracy and completeness. The information is subject to change without notice and Hedge Fund Telemetry LLC has no obligation to provide any updates or changes. Hedge Fund Telemetry LLC is providing this data for informational and educational purposes and does not believe that it is sufficient to base an investment decision on. This information should not be regarded as a solicitation or recommendation of any particular security or to engage in any trading strategy. One should always check with your licensed financial advisor to determine suitability of any investments.
|
|
|
|
|