|
|
|
|
|
|
Countdown to end of quarter
|
|
|
The countdown to the end of the quarter Friday is underway. Since 1961, the week following the third Friday in September has produced the most bearish week out of any week of the year. So far, volatility remained exceptionally low. Here's what happening: Earnings blackouts are starting which means corporate buybacks are on hold until after earnings. $200 billion on Chinese goods went into effect yesterday. Tomorrow the Fed will raise rates .25bps and $15 billion of MBS will
roll off (QT). Thursday President Trump with meet Rosenstein to decide his fate. If he quits then Trump can assign anyone to the position without Congressional approval but if he's fired, Congress will have to vote and that will take months. Friday is very important as most derivative desks around the street estimate a net $30 billion of equities will be for sale from calendar based flow. And then it is the big mutual fund end of year (fiscal) portfolio rebalance.
Most of the time the markets respond positively on Fed decision days but with Powell the market has faded gains late in the day. Will it be five meetings in a row with a fade? The theme of higher crude, higher rates, and lower USD has been in play now for a few weeks but keep an eye on sentiment as some are getting stretched as well some are late in the DeMark Countdowns. Perhaps next week will see a peak in crude and rates. Stocks continue to drift sideways with some breadth
measures also showing signs of upside exhaustion. Like in January/February the depth of market in the US equity futures markets is not very liquid so be prepared.
- US Markets - Still mostly sideways in the past week a little potential left for nominal new highs
- Hedge Fund Telemetry Trade Ideas - A few changes - TXN, AMZN, ROST
- Erlanger
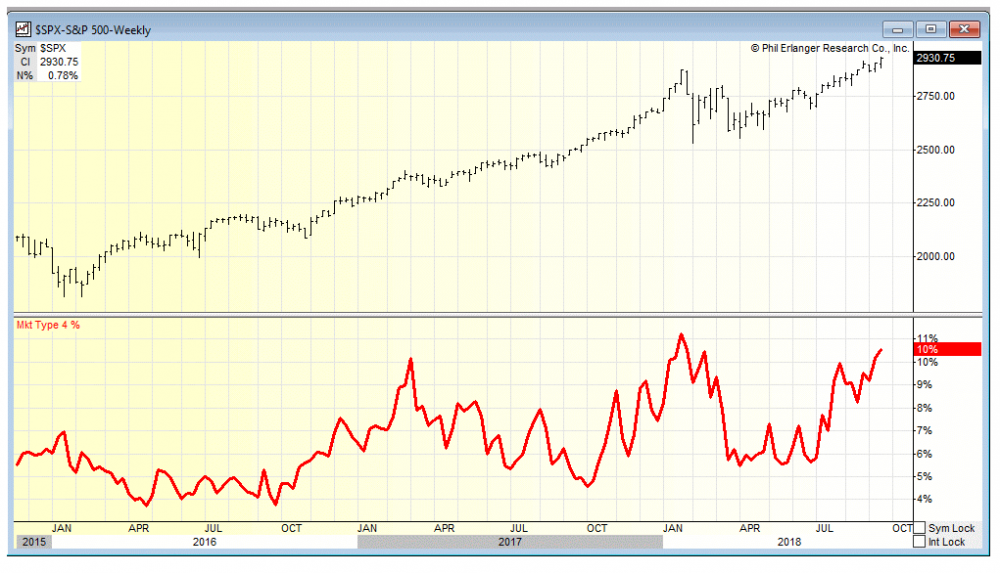
Type 4's leading the market is a concern
- Bloomberg Technical Pattern Automated Trade Ideas
- PPO Monitor - Energy continues to lift to top
- A few stocks I'm looking at today - A few off the DeMark Screens
- Currency Update - Stalling action
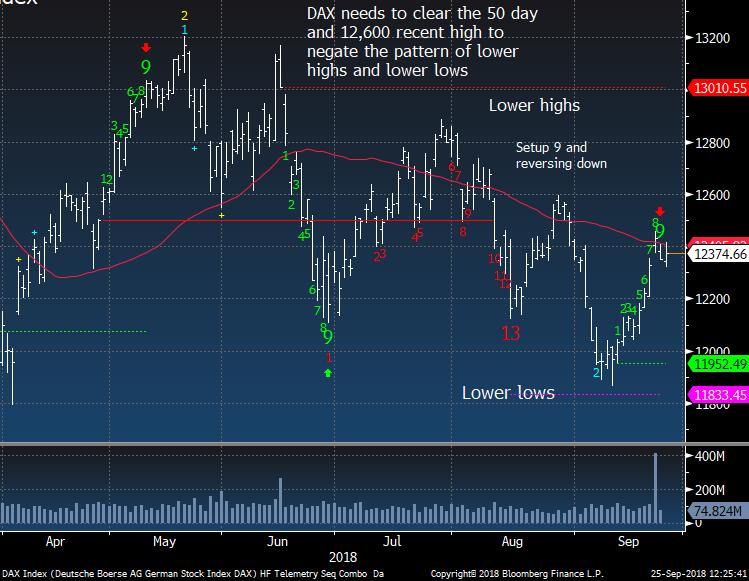
- European Market Update - Make or break time
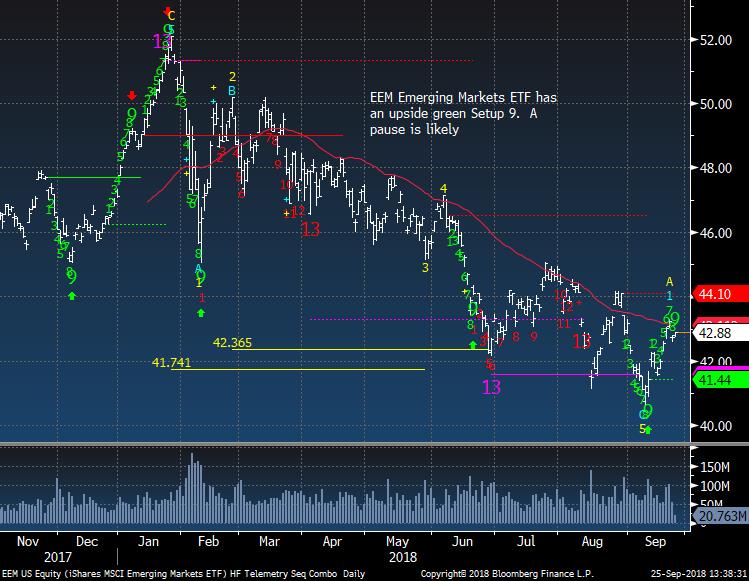
- Global Market Update - Could see a higher low pullback with EEM
- Asian Market Update - Nikkei getting late in move
- Crude Update - Still has upside potential but sentiment is extreme
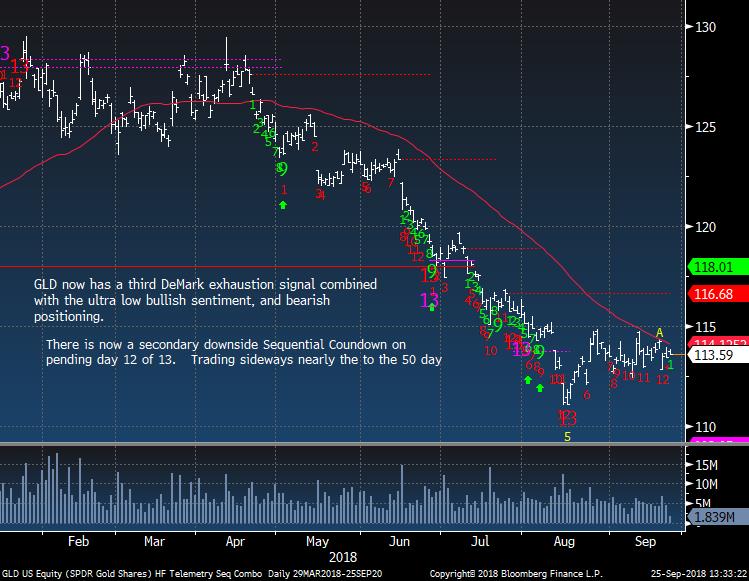
- Gold Update - Sideways
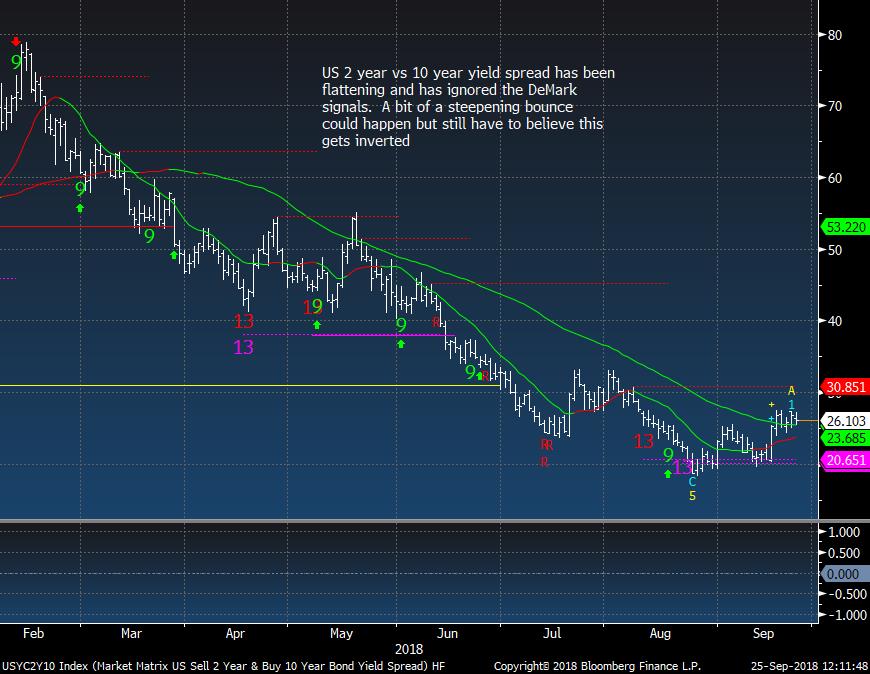
- Bond Update - A lot of things here today. 10 yr 30 yr, 2/10, TLT, IEF ETF's getting late in the move
- DeMark Screens - Daily,
Weekly, Monthly upside/downside exhaustion signals within the S&P 500 and Euro Stoxx 600 WE ARE NOW HIGHLIGHTING STOCKS ARE MOST ACTIONABLE
|
|
|
|
|
Here's a link to the Hedge Fund Telemetry market sentiment page with 40 charts of sentiment including equities, bonds, currencies, and commodities updated each day. When the new website launches we will be adding new charts and historical sentiment data for Euro Stoxx 50, UK FTSE 100, German DAX, French Cac 40. We will be adding Japanese Bonds, German Bunds, and a few more.
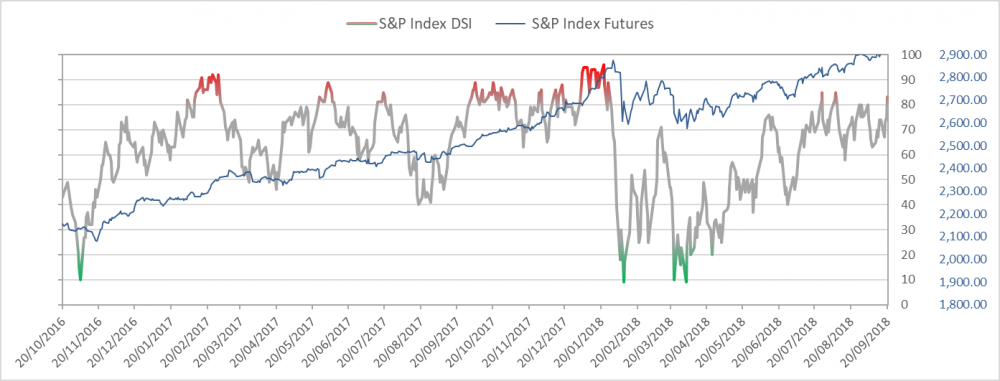
SPX bullish sentiment is at 74%
|
|
|
|
|
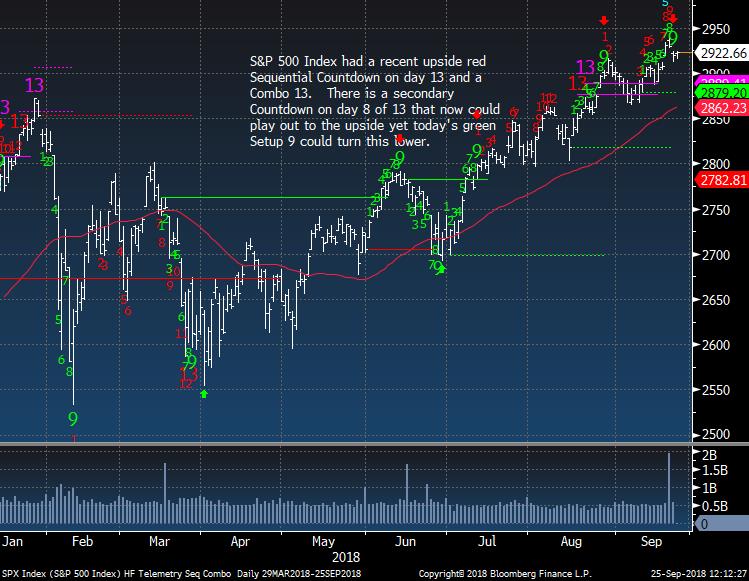
SPX daily still drifting sideways in past week
|
|
|
|
|
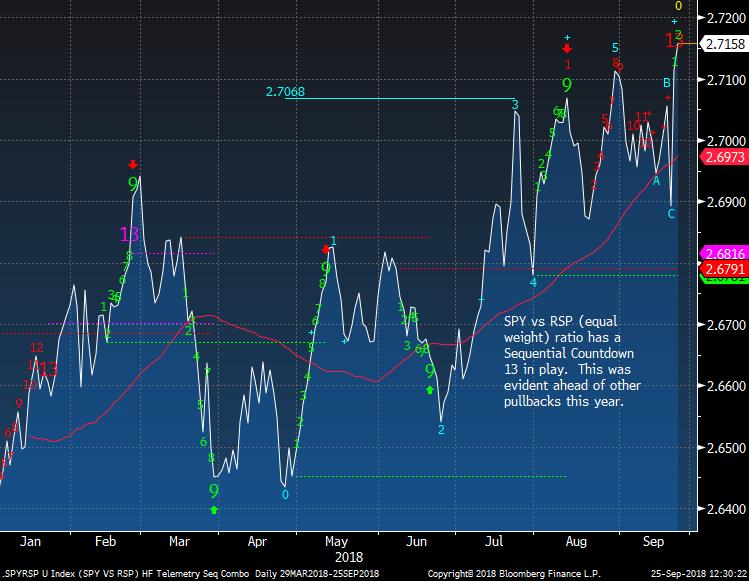
SPY vs RSP (equal weight S&P 500 ETF) ratio has an upside Sequential Countdown 13.
|
|
|
|
|
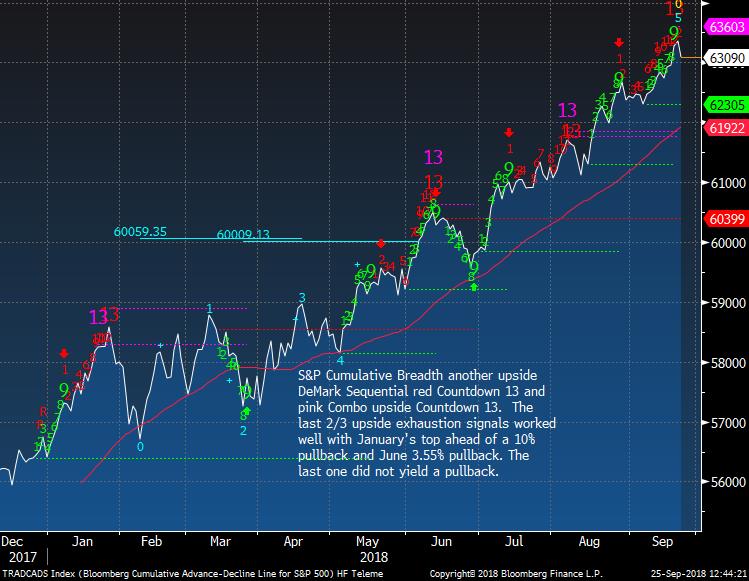
S&P cumulative breadth reversed yesterday after both Sequential and Combo 13's. Let's see if this one will work like January
|
|
|
|
|
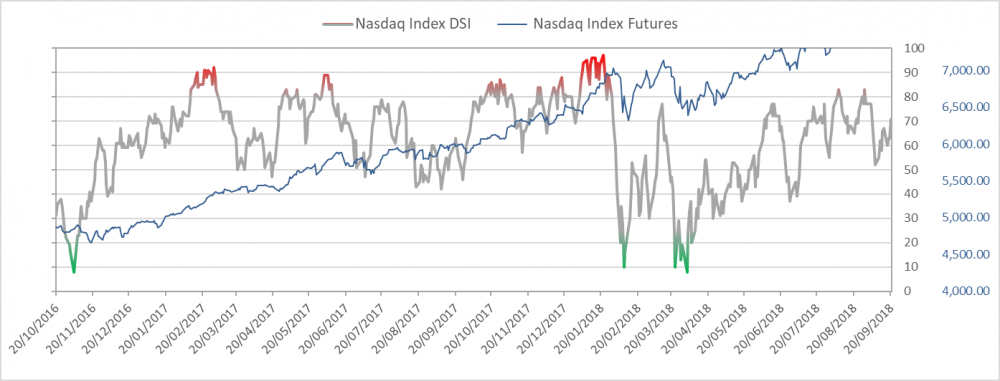
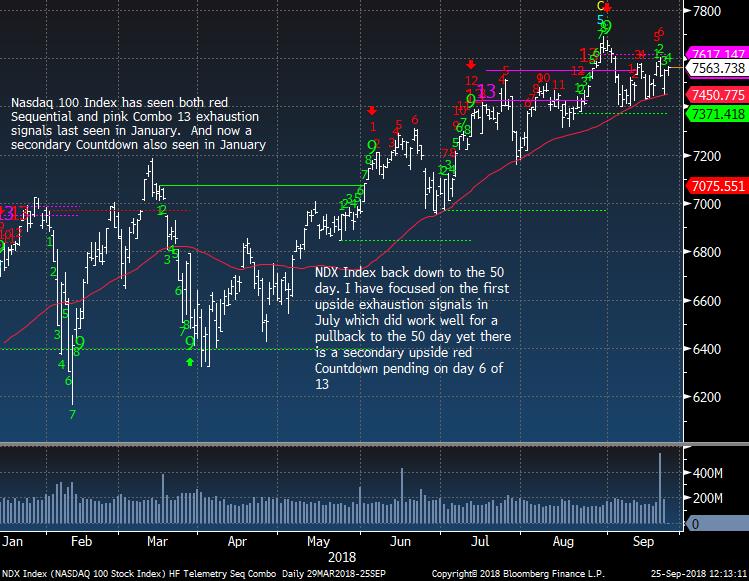
Nasdaq bullish sentiment is at 70%
|
|
|
|
|
NDX Index holding in in the past few days thanks to mega cap tech
|
|
|
|
|
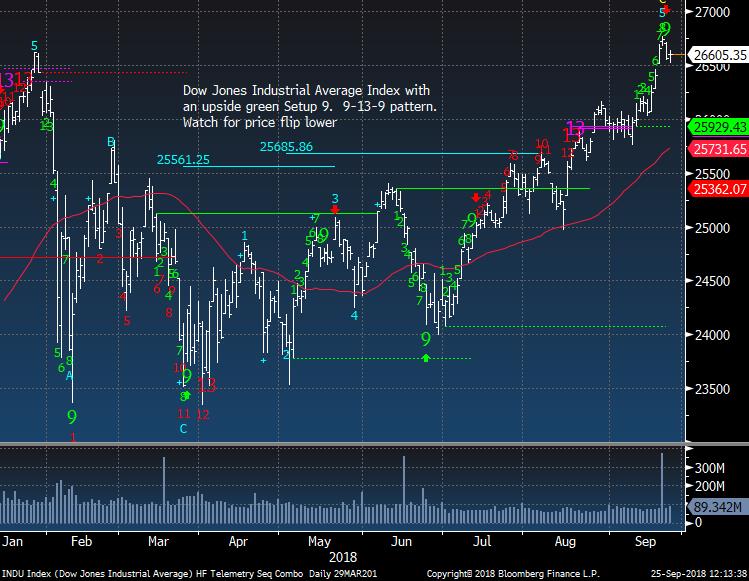
Dow Jones Industrial Average could be turning after the green Setup 9
|
|
|
|
|
|
|
Hedge Fund Telemetry Trade Ideas
|
|
|
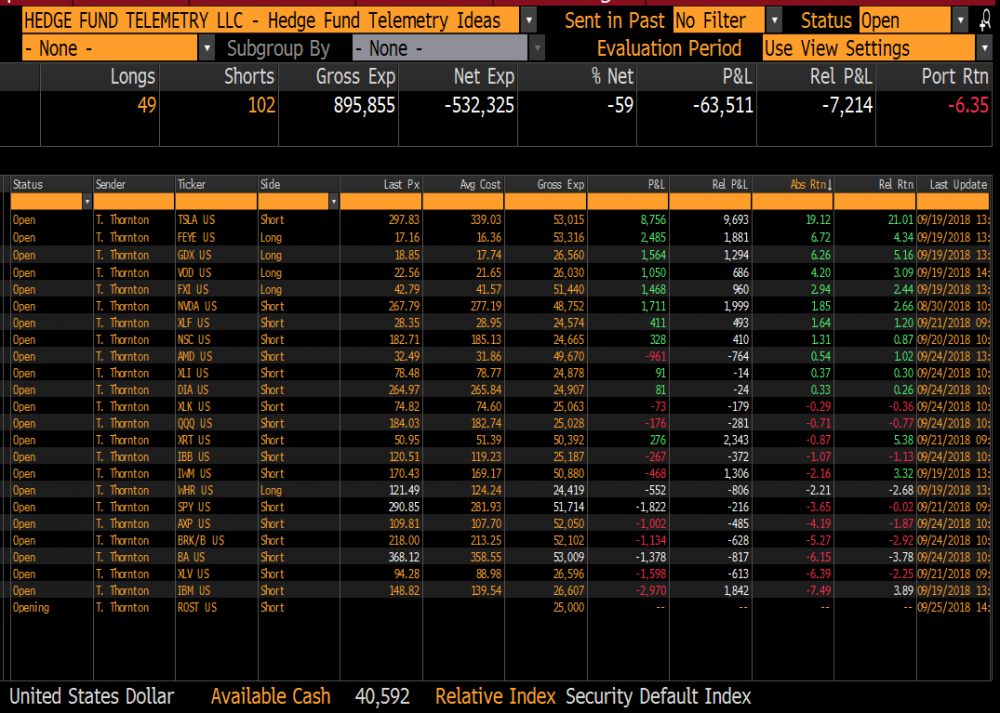
Trade Ideas Sheet - Long and short US equity ideas including ETF's. We will be overhauling the Trade Ideas Sheets for long only, short only, ETF's when the new website rolls out soon. There will also be a clearer email distribution with changes.
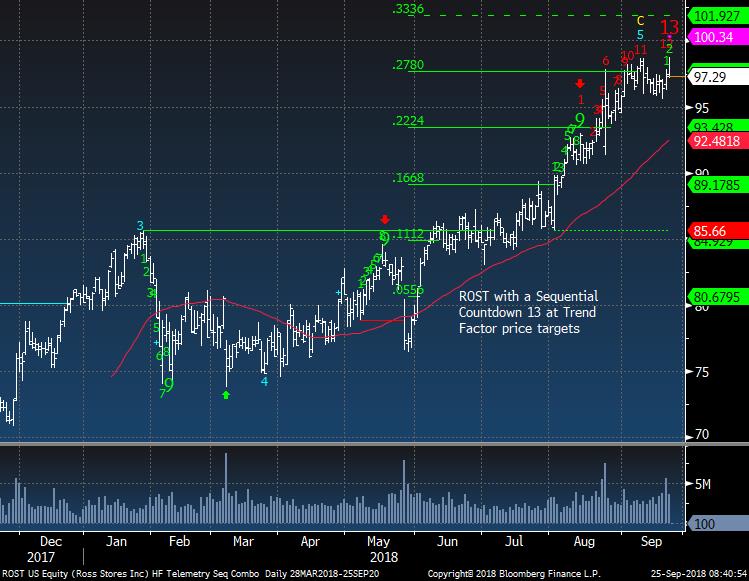
Trade Ideas Changes: Stopped out TXN long +3%, AMZN short -2%. Added new ROST short 2.5%
Stops on everything. TSLA 320, GDX 18.35r , VOD 21.95, FEYE 16.00, FXI 41.95, NVDA 275, QQQ 185.50, XLK 77, SPY 295, XLY 118, AXP 114, WHR 120, XRT 53, IWM 172, XLV 95, BRK/B 225, IBM 153, DIA 275, XLI 81.50, IBB
123, AMD 35, ROST 100.50
|
|
|
|
|
|
|
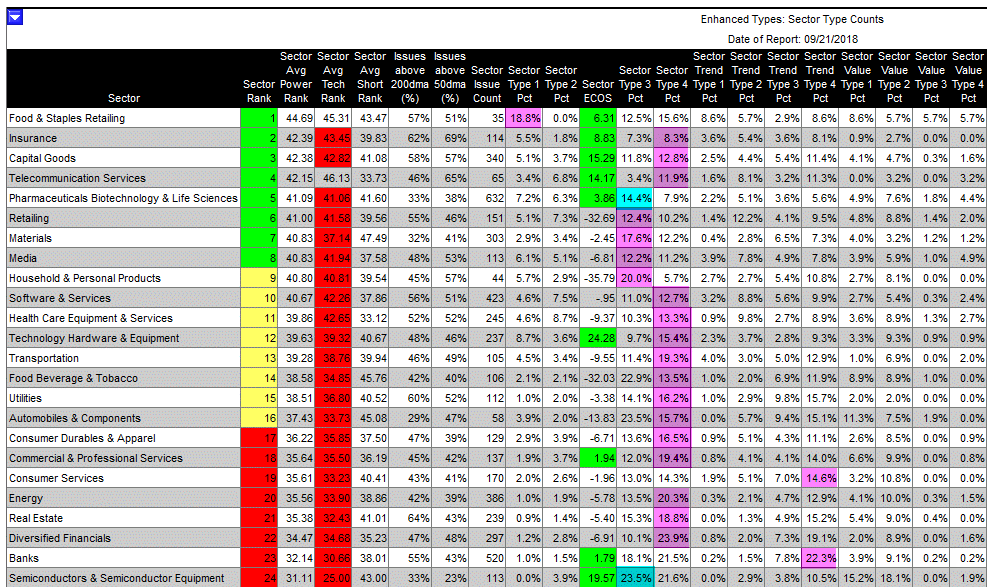
Erlanger Type 4's at levels that are concerning
|
|
|
Erlanger Research is the best for short interest analysis. They separate stocks into four types. The two most important are type 1's which are heavily shorted squeeze candidates and type 4's which are stocks that have very little short activity and thus have potential to fall when sell offs happen since there isn't the natural buyer (shorts) to support it.
Currently the number to type 4's are above 10% and whenever this has happened the risk increases
for a sharp out of the blue sell off.
|
|
|
|
|
Sectors in purple under type 4 dominate the leadership in the market which isn't' what you want to see. Also Erlanger's tech ranking does not have any sector over 50% - another concern. More on that indicator another time. The only sector with a high type 1 reading is Food, Staples, Retailing
|
|
|
|
|
|
|
A few stocks I'm looking at today
|
|
|
On the DeMark screen today is ROST Ross Stores. You can see the screens each day at the bottom of each Daily Note. FYI I added this short 2.5% size today
|
|
|
|
|
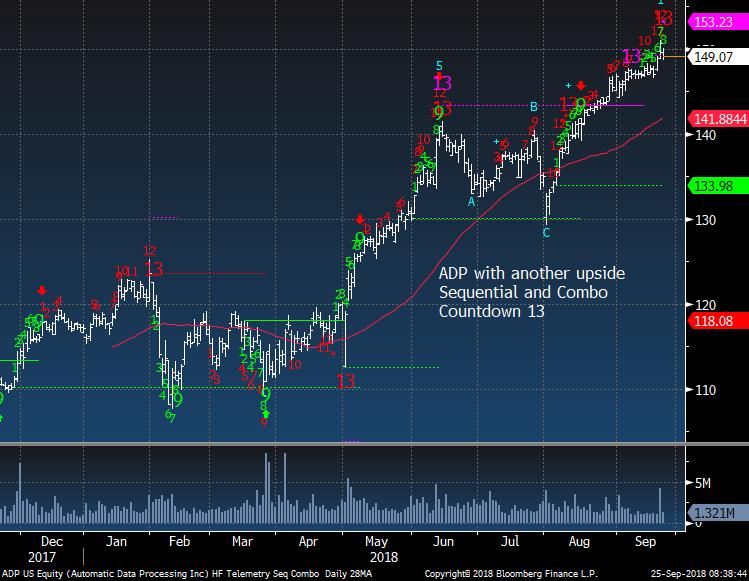
Another one on the screen is ADP
|
|
|
|
|
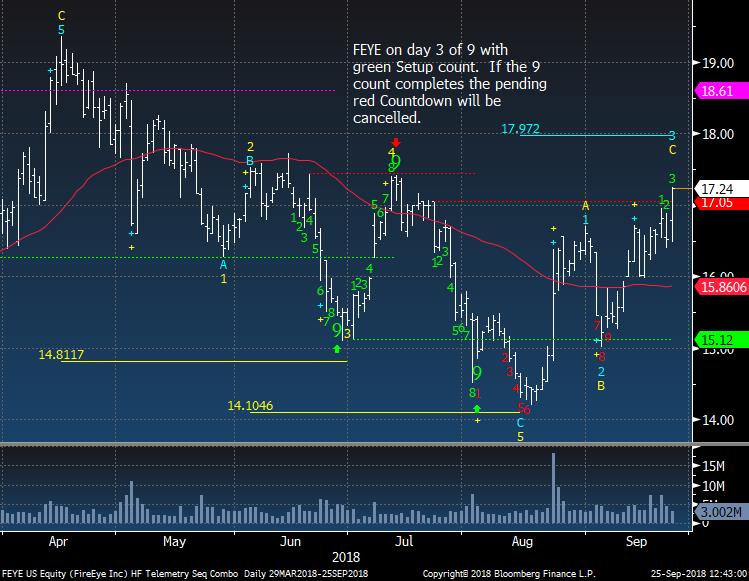
FEYE has been my favorite tech long lately and the stock is doing well and the CEO is on Mad Money with Jim Cramer tonight.
|
|
|
|
|
|
|
|
|
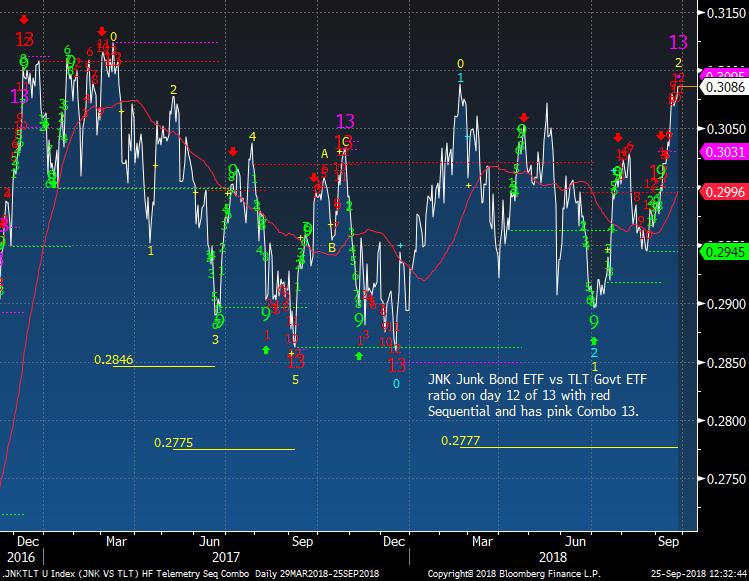
Another upside in the Junk vs Gov ETF's with the Combo and close with the Sequential
|
|
|
|
|
|
|
PPO Monitor - Percentage Price Oscillator
|
|
|
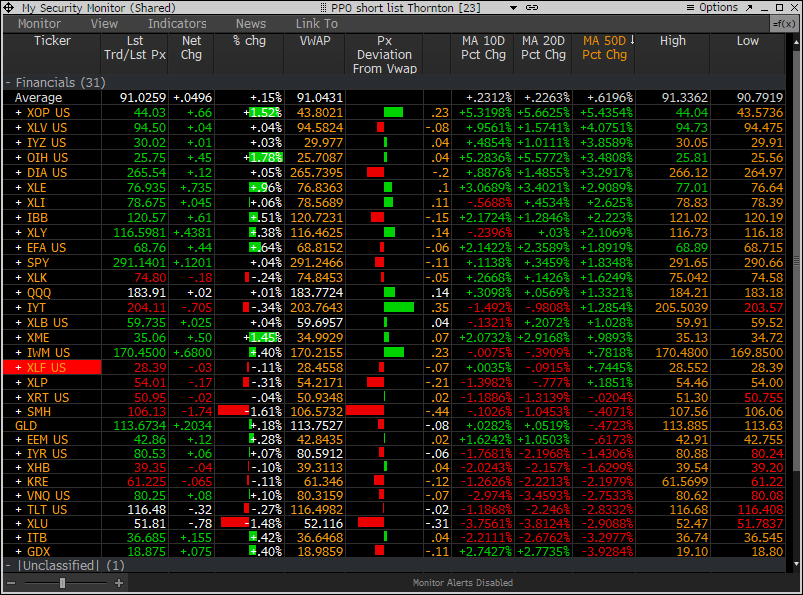
The PPO Monitor is a proprietary monitor developed to force rank Indexes, Sectors, and Stocks. It ranks top down by strongest to weakest by percentage above/below the 50 day moving average. Shorter term signals can be seen when the 10 and 20 day moving averages turn up (green) or down (red) which often are followed by the 50 day moving average. This is useful to watch for historically overbought/oversold percentage above/below the 50 day moving average. It is
non correlated with the DeMark Indicators however we have found upside/downside exhaustion signals often occur when something rises to the top or drifts to the bottom of the monitor - increasing the timing aspect. We share this monitor with clients with Bloomberg Terminals. An added feature is that each market/ETF can be expanded with each component force ranked in the same way. A couple other features include price deviation from intraday VWAP (useful for intraday reversals) and new 20 day highs/lows on right side. Please inquire if you would like to be permissioned to use the PPO Monitor.
Today's highlights: Energy ETF's continues to climb to the top.
|
|
|
|
|
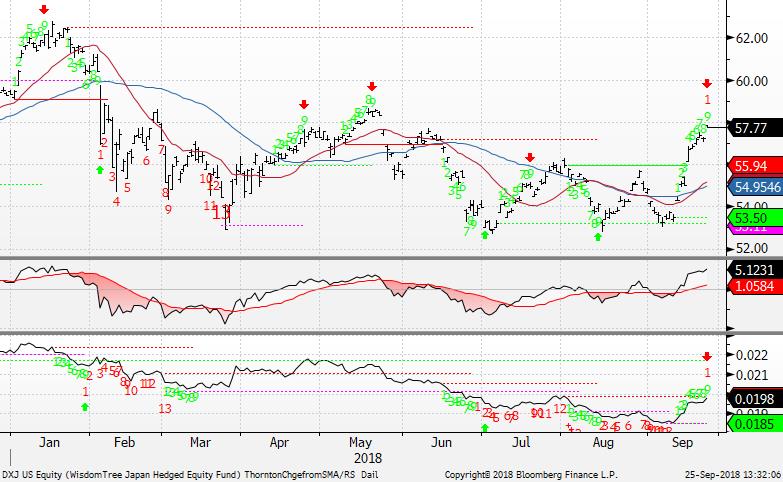
The following chart shows the Percentage Price Oscillator (50 day moving average) in action. This is the DXJ Japan ETF and it currently is 5% above the 50 day and about where it has topped in the past year. (middle indicator)
|
|
|
|
|
|
|
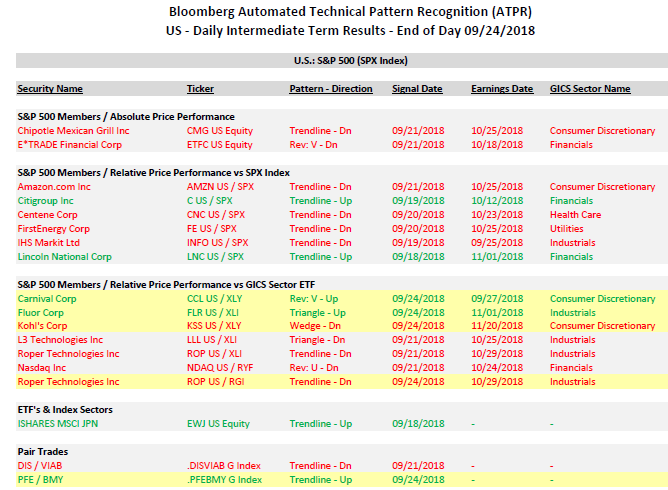
Bloomberg Automated Technical Pattern Recognition Screens
|
|
|
S&P 500 Members/Absolute Price Performance and Relative Price Performance vs S&P 500 and Sector ETF's. ETF's vs Index Sectors. Pair Trades. Long side is first symbol, short side is second symbol.
|
|
|
|
|
|
|
|
|
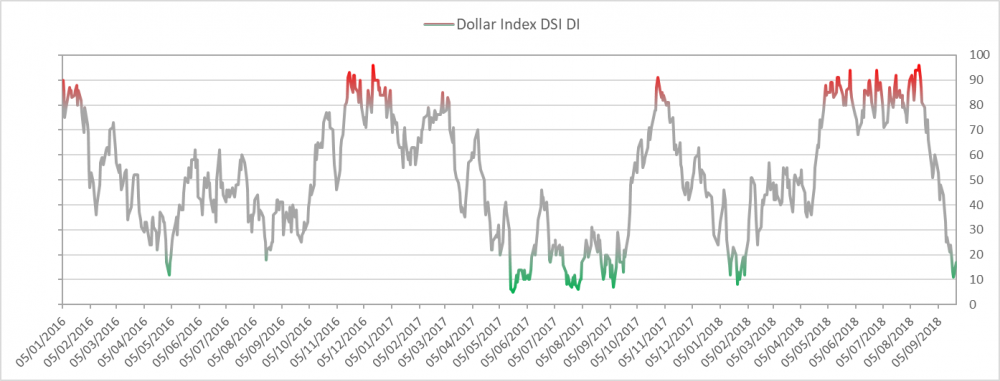
US Dollar bullish sentiment is at 17% and up from 11%. This might need to spend a little time chopping away on the lower levels vs a V bottom
|
|
|
|
|
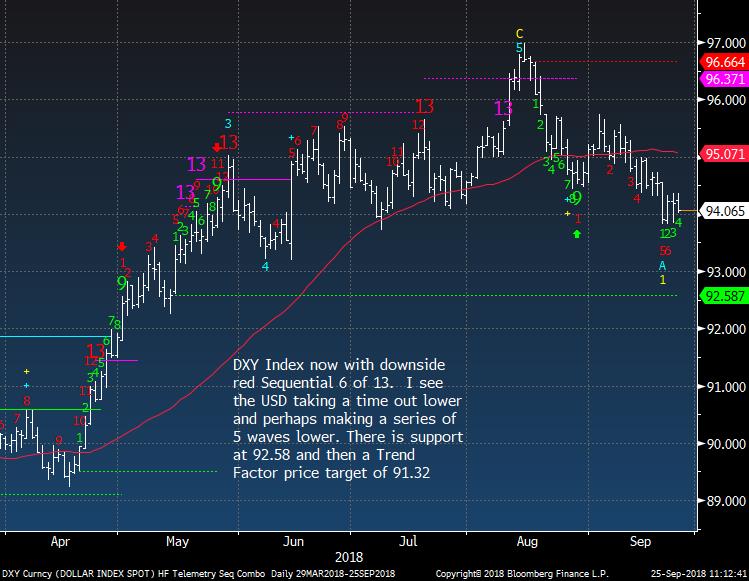
US Dollar Index no changes to bias
|
|
|
|
|
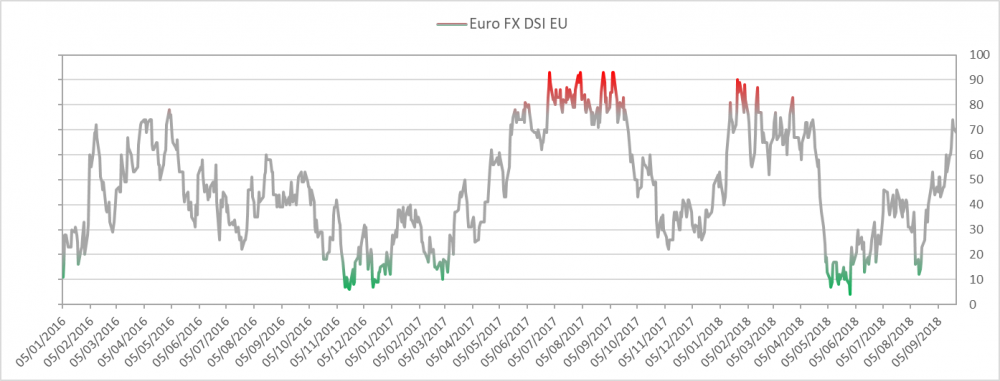
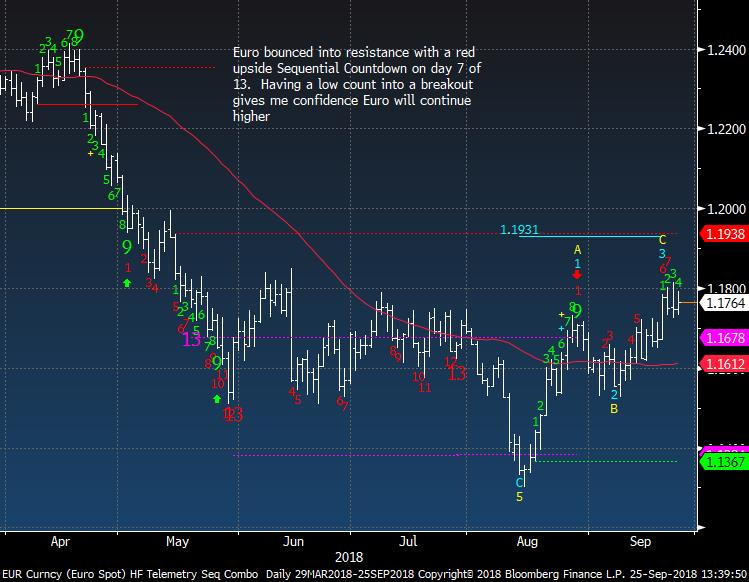
Euro bullish sentiment is at 69%
|
|
|
|
|
Euro Spot a little sluggish after the big day last week
|
|
|
|
|
|
|
|
|
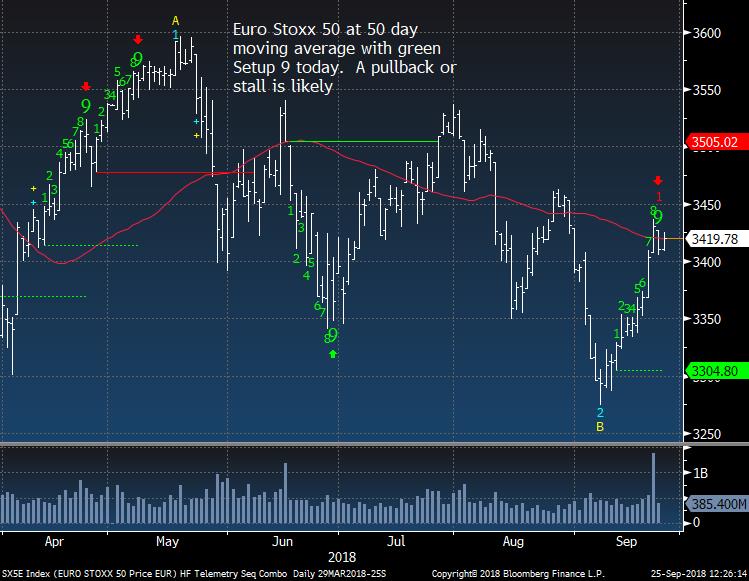
Euro Stoxx 50 has a make or break with the Setup 9
|
|
|
|
|
|
|
|
|
|
|
|
|
EEM Emerging Markets ETF wouldn't surprise me to see a shallow higher low pullback then higher
|
|
|
|
|
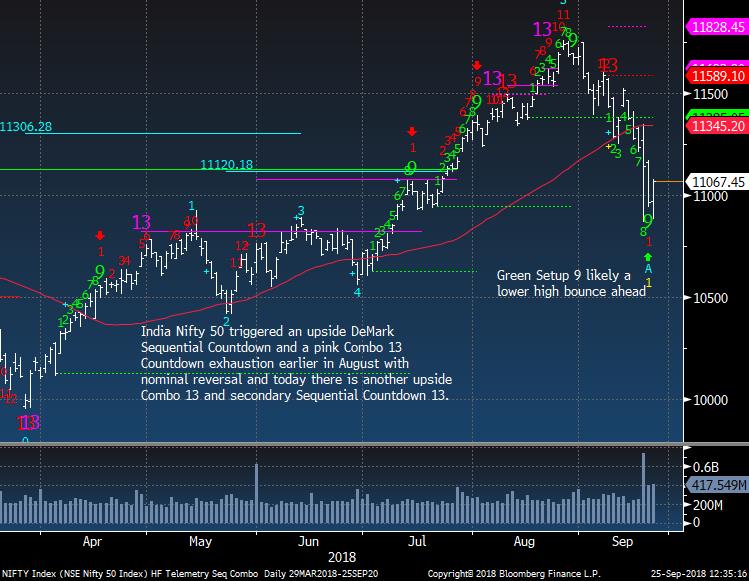
India Nifty 50 Index bouncing after green Setup 9
|
|
|
|
|
|
|
|
|
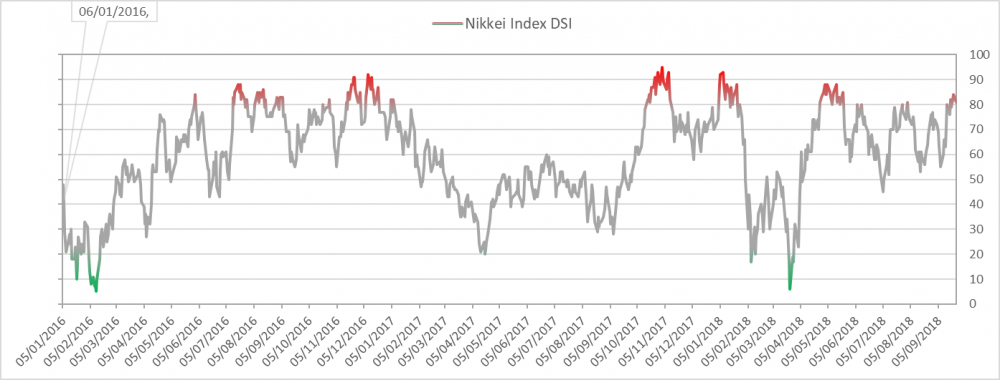
Nikkei bullish sentiment is at 81%
|
|
|
|
|
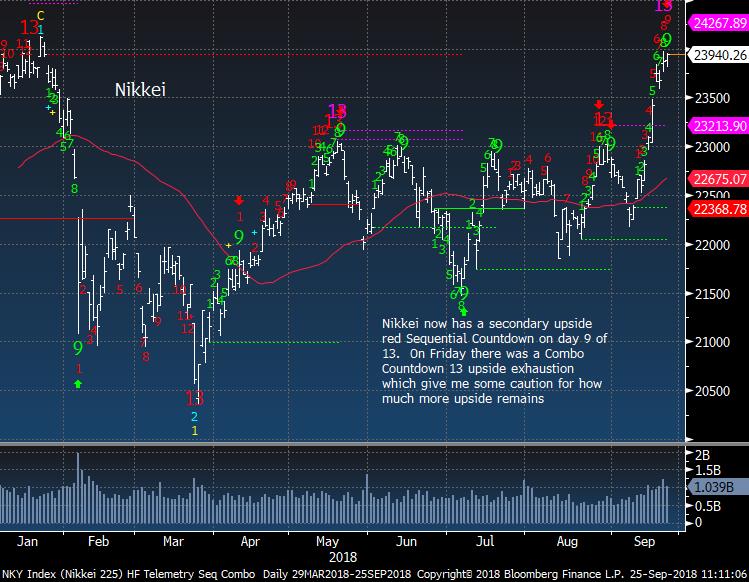
Nikkei ha a Combo 13, green Setup 9 (which has been very good at inflection) but only on day 9 of 13 with Sequential
|
|
|
|
|
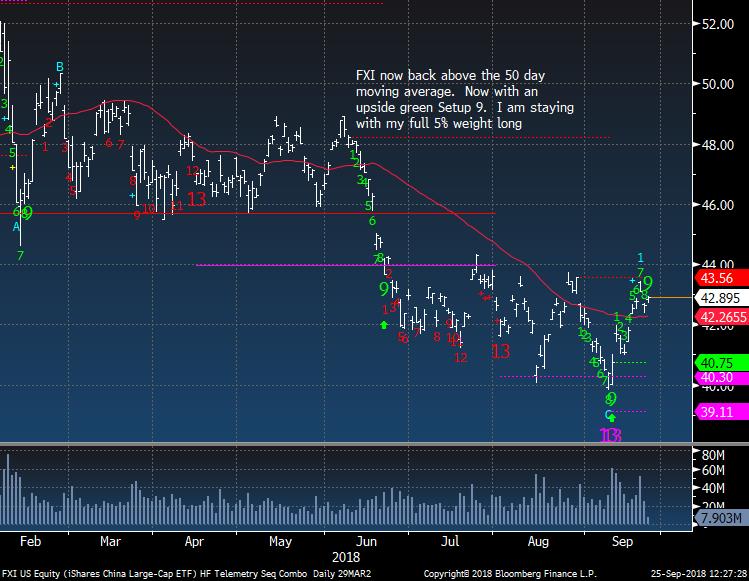
China / Hong Kong FXI ETF same analysis as EEM
|
|
|
|
|
|
|
Crude and Natural Gas Update
|
|
|
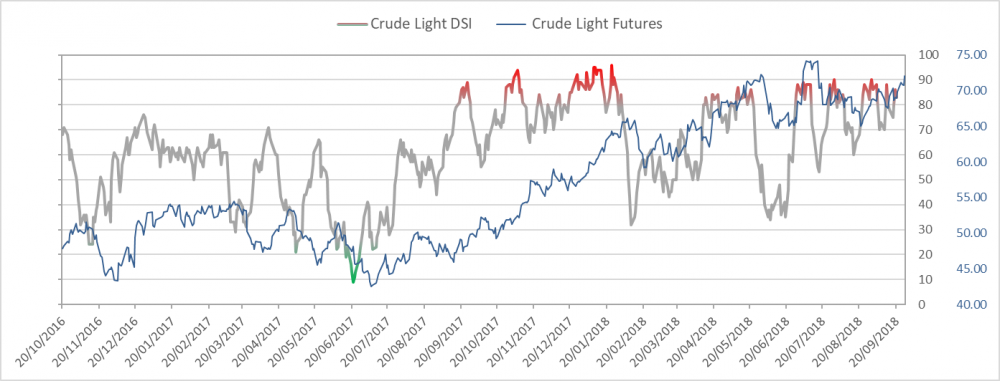
Crude bullish sentiment is at 86% and extreme but it might stay here for a little longer
|
|
|
|
|
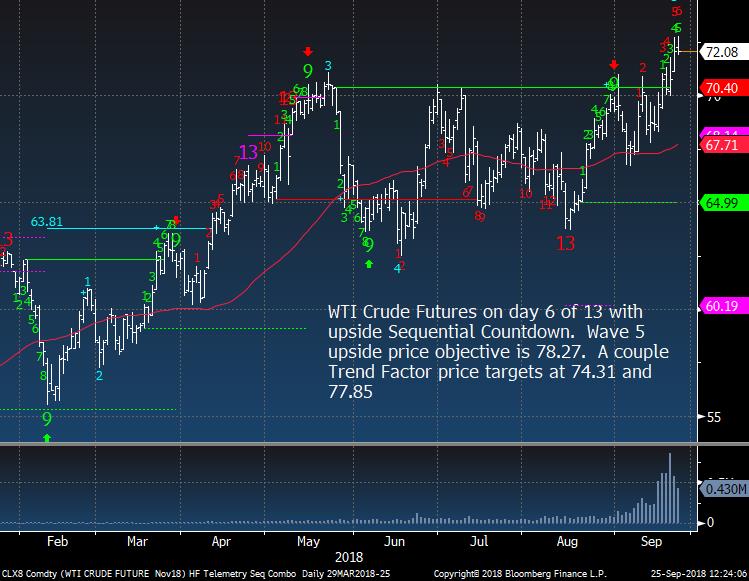
WTI Crude Futures still has the upside Countdown but it could be choppy ahead
|
|
|
|
|
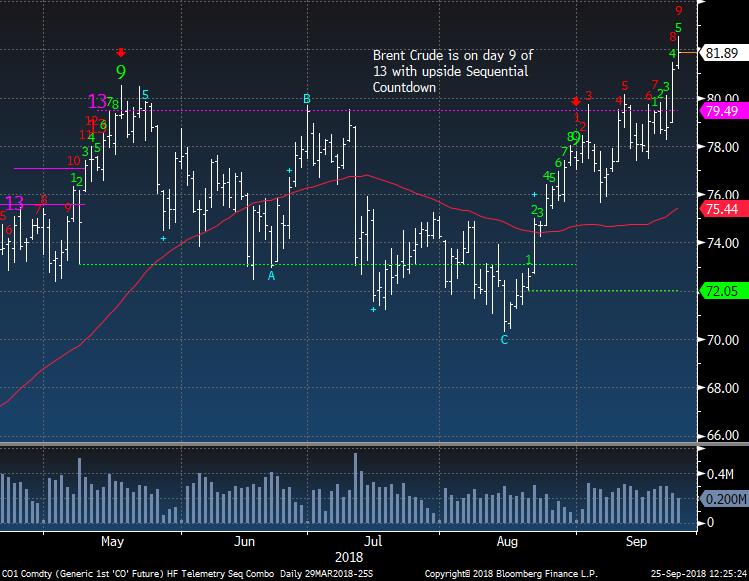
Brent Crude is later in the Countdown vs WTI on day 9 of 13
|
|
|
|
|
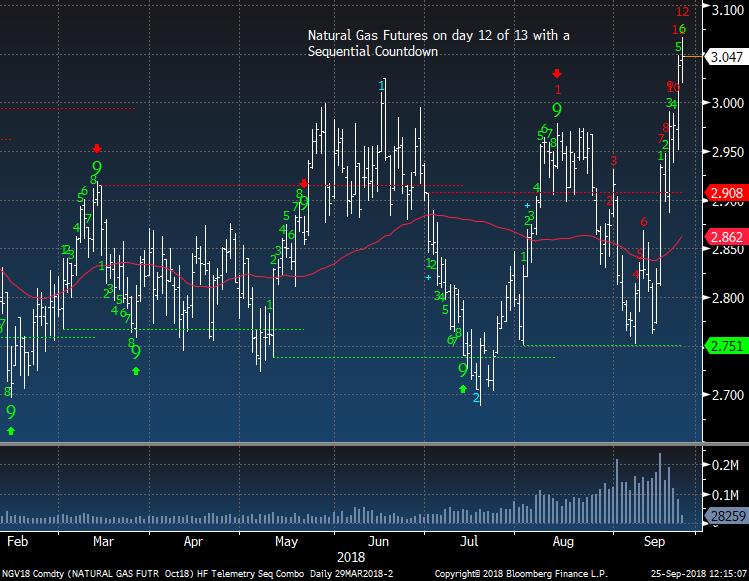
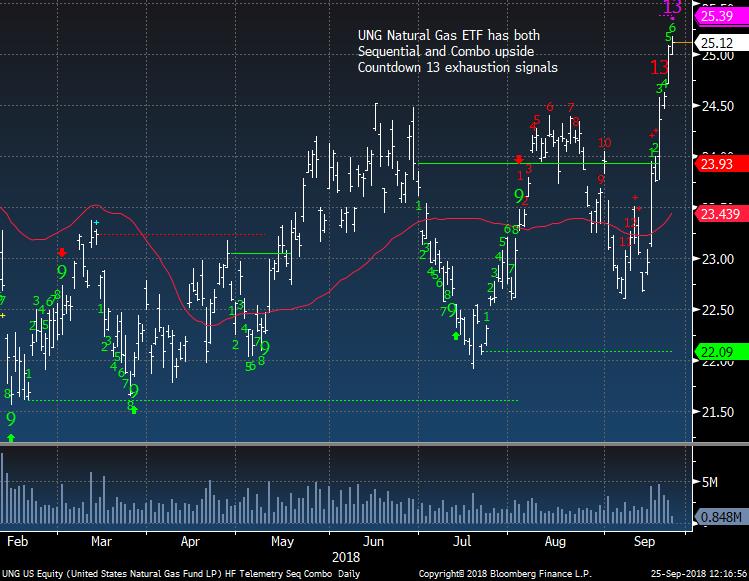
Natural Gas Futures near upside exhaustion
|
|
|
|
|
UNG ETF both Sequential and Combo 13's in play now
|
|
|
|
|
|
|
|
|
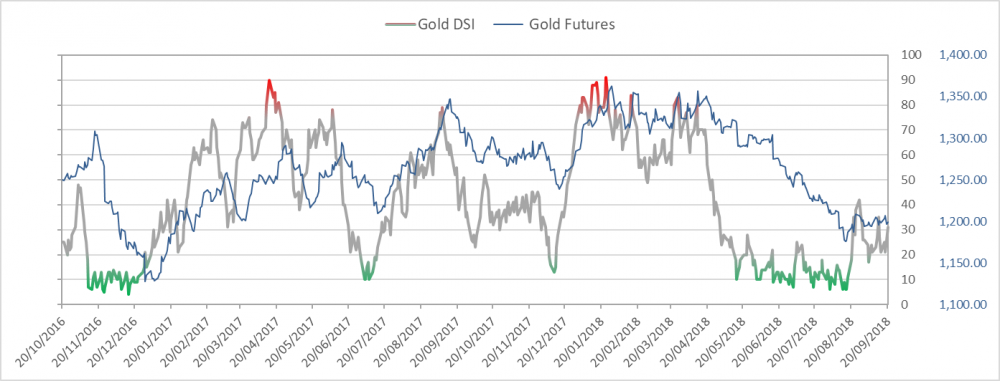
Gold bullish sentiment is at 28%
|
|
|
|
|
|
|
|
|
|
|
|
|
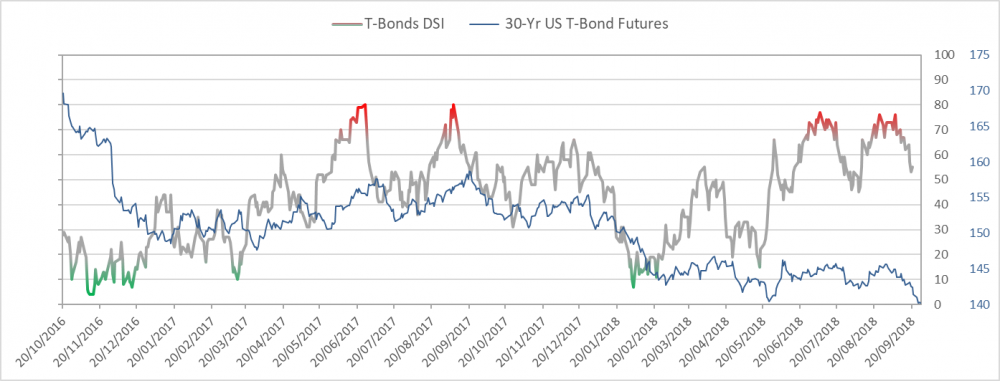
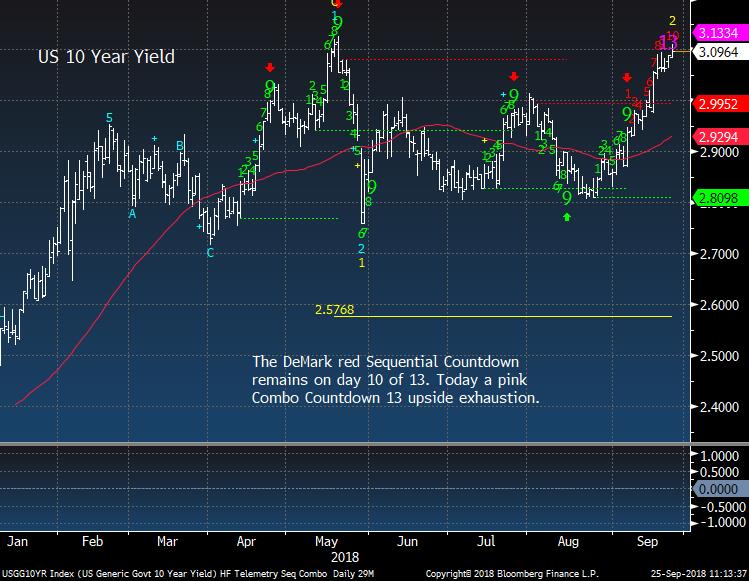
Bond bullish sentiment is at 55% and seems remarkable considering the back up in yields
|
|
|
|
|
US 10 Year Yield getting late in the move on day 10 of 13
|
|
|
|
|
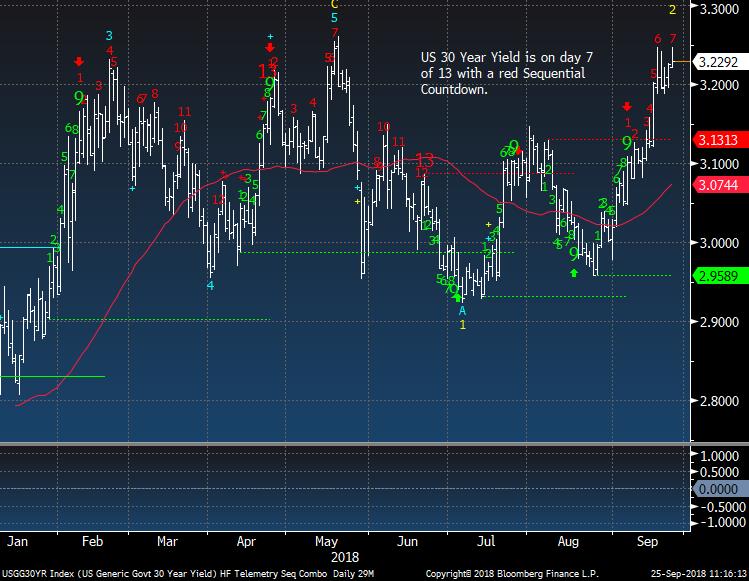
US 30 Year Yield still has a bit more to go
|
|
|
|
|
|
|
|
|
|
|
|
|
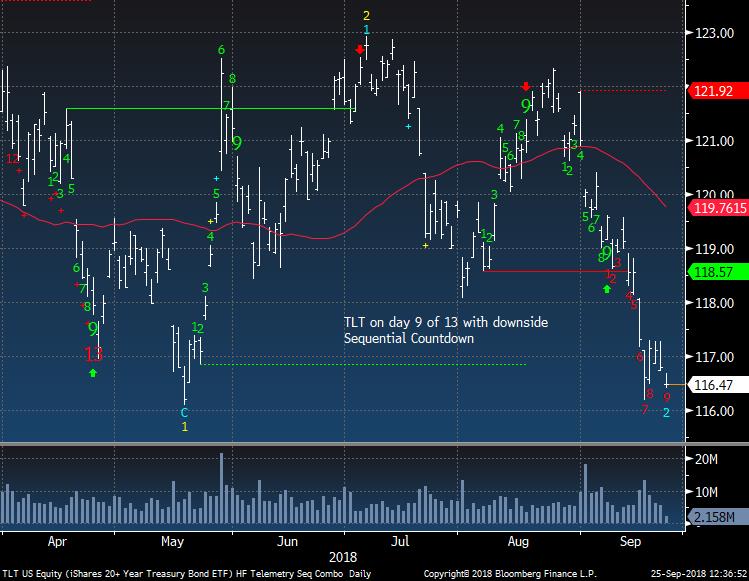
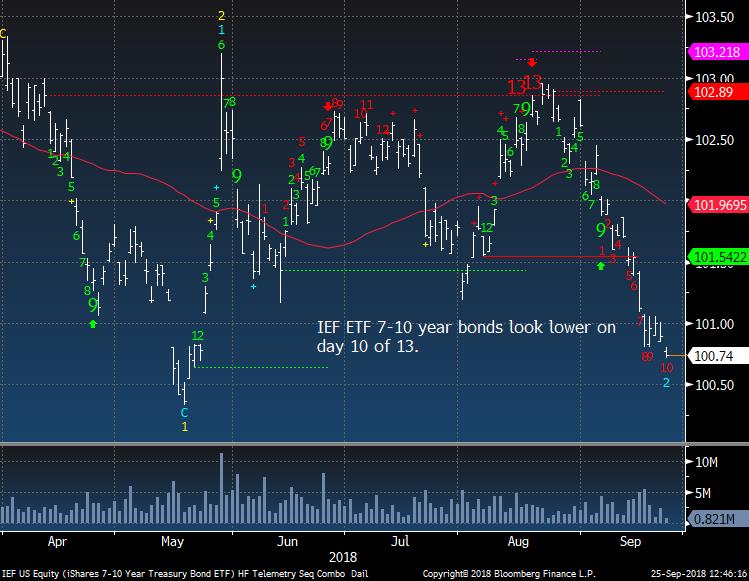
IEF 7-10 year ETF on day 10 of 13
|
|
|
|
|
|
|
DEMARK SCREENS - Daily, Weekly, Monthly Upside/Downside Exhaustion Signals
|
|
|
Daily/Weekly DeMark upside/downside exhaustion signals (Sequential) updated daily, Weekly signals on Monday's and monthly on the first day of the new month. Price flips occur when a stock closes higher/lower than four previous closes and increases conviction of a price turn.
The upside 13's are sell signals and downside 13's are buy signals. Price flip's are confirmation signals that increases potential for a price trend change. For example, if you are long a stock and there is an upside 13, you will want to take cautious action by selling down or out of a position. If initiating a short sale with the upside 13's, we tend to start with a 1/2 size and add with the downside price flip. The opposite is true for when there are downside 13's. Take a 1/2 size position
and add with the upside price flip. The DeMark Indicators are designed to assist the user with buying into weakness and selling into strength to anticipate trend exhaustion. Selling into a rally and buying into a decline often afford the opportunity to exit a trade without too serious a loss if wrong.
S&P 500 Universe:
DAILY UPSIDE 13: ADP, ESS, ROST, UDR
DAILY DOWNSIDE 13: NONE
DAILY UPSIDE WITH PRICE FLIP REVERSAL DOWN: ADS, AIV, BLL, BRK/B, CB, CINF, COL, ESS, GD, GT, HAS, HSIC, KSU, LLY, NSC, RCL, SNA, UDR, UNP, WMT
DAILY DOWNSIDE WITH PRICE FLIP REVERSAL UP: NONE
Updated: 9/24/18
WEEKLY UPSIDE 13: BA, CHRW, DFS, EMR, GPN, NAVI,
OKE
WEEKLY DOWNSIDE 13: NONE
Updated: 9/4/18
MONTHLY UPSIDE 13: AFG, AJG, AMD, CBT, CECO, EIG, IR, MAA, MRCY, MSA, MSFT, NSC, ORI, ROK, TDY, TTWO, UNT, UNP, WCG, WTR
MONTHLY DOWNSIDE 13: FTR, RRD, SMCI, SSI
Euro Stoxx 600 Universe:
DAILY UPSIDE 13: NONE
DAILY DOWNSIDE 13: BOSS GR, ZAL GR
DAILY UPSIDE WITH PRICE FLIP REVERSAL DOWN: ANDR AV, CA FP, PRY IM
DAILY DOWNSIDE WITH PRICE FLIP REVERSAL UP: EDP PL
Updated: 9/24/18
WEEKLY UPSIDE 13: BNR GR, VOLVB SS
WEEKLY DOWNSIDE 13: TCH FP
Updated: 9/4/18
MONTHLY UPSIDE 13: ACKB BB, GALP PL, IPN FP, KOMB CP, MTX GR, UCB BB
MONTHLY DOWNSIDE 13: ALPHA GA, BARC LN, TL5 SM
|
|
|
Unsubscribe me from Hedge Fund Telemetry
Hedge Fund Telemetry LLC, P.O. Box 4675, Greenwich, CT 06861, United States
CONFIDENTIALITY NOTE and DISCLAIMER: This message is for the named person's use only. It may contain confidential, proprietary or legally privileged material. No confidentiality or privilege is waived by any accidental or unintentional transmission. If you receive this message in error, please immediately delete it and all copies of it from your system, destroy any hard copies and notify the sender. You must not, directly or indirectly, use, disclose,
distribute, print or copy any part of this message if you are not the intended recipient. Hedge Fund Telemetry LLC. cannot guarantee the confidentiality of the material transmitted; therefore, information of a sensitive or confidential nature should not be transmitted. There is risk in trading markets. Hedge Fund Telemetry LLC reports are based on information gathered from various sources and believed to be reliable, but are not guaranteed as to accuracy and completeness. The information is subject to change without notice and Hedge Fund Telemetry LLC has no obligation to provide any updates or changes. Hedge Fund Telemetry LLC is providing this data for informational and educational purposes and does not believe that it is sufficient to base an investment decision on. This information should not be regarded as a solicitation or recommendation of any particular security or to engage in any trading strategy. One should always check with your licensed financial
advisor to determine suitability of any investments.
|
|
|
|
|