|
|
|
|
|
|
Bull Market With Negative Guidance
|
|
|
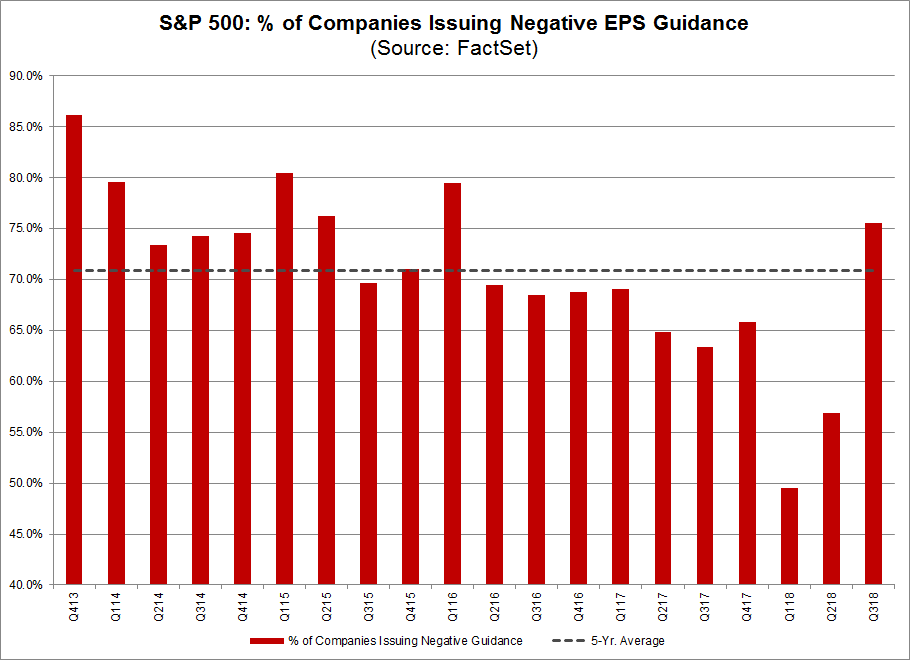
One of the themes I've been talking about lately is potential for companies to issue weaker guidance in the coming earning season. I've always look at stocks as a barometer and not a thermometer. Stocks go up on the potential for the future gains in earnings. Factset put out a note this past weekend on exactly my theme. "Heading into the end of the third quarter, 98 S&P 500 companies have issued EPS guidance for the quarter. Of these 98 companies, 74 have issued negative EPS guidance and 24 companies have issued positive EPS guidance. The percentage of companies issuing negative EPS guidance is 76% (74 out of 98), which is above the five-year average of 71%. If 76% is the final percentage for the quarter, it will mark the highest percentage of S&P 500 companies issuing negative EPS guidance for a quarter since Q1 2016 (79%)". I posted a chart below and although it's a little early ahead of the major earnings volume, it does give some some credence to what to watch out for in the coming month.
We're starting to see cracks in some of the leading indexes and sectors as well some divergent action with some internals that I have some thoughts below with charts. Sentiment is also divergent with index prices and I've seen sentiment fade before the indexes "catch down". Tariff news over the weekend wasn't at all positive and Mueller/Trump news is heating up. Markets, most of all, dislike uncertainty, and this could see some more softening with the indexes - or a lot more! Stay nimble, tighten stops, and have a decent percentage of cash headed into October.
Happy to be back after a quick trip to California.
- US Markets - Sentiment divergent, Several green Setup 9's on upside, Fewer 52 week highs
- Hedge Fund Telemetry Trade Ideas - Made a bunch of changes today
- Bull Market With Negative Guidance
- Retail XRT ETF - Update
- Boeing Update
- Some Sectors on my radar
- PPO Monitor - Percentage Price Oscillator
- Bloomberg Technical Pattern Idea Screen
- Currency Update - No changes to bias
- European Market Update - Looks like another lower high
- Global Market Update - Bounce could stall here
- Asian Market Update - Nikkei getting late in upside move
- Crude Update - DeMark upside Countdown potential but sentiment remains extreme
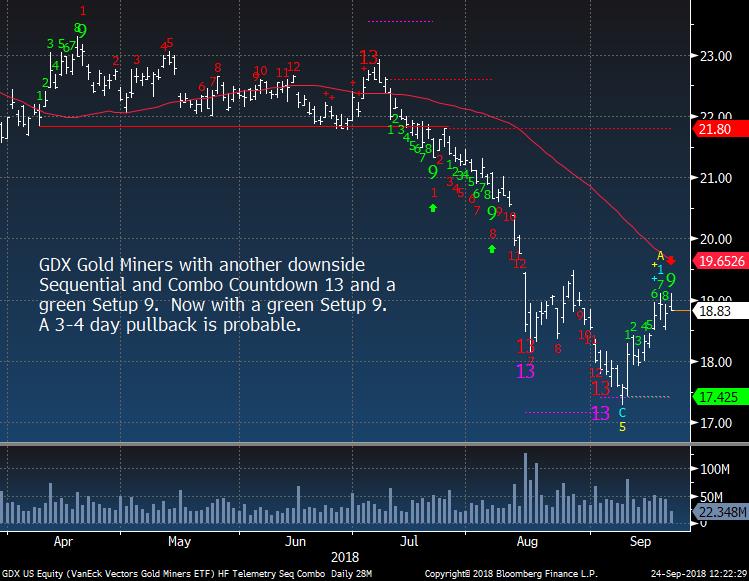
- Gold Update - Sideways
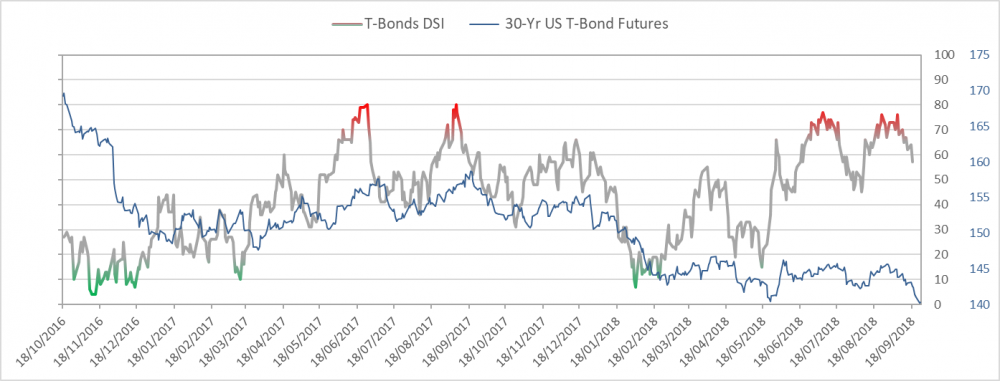
- Bond Update - Make or break levels with sentiment
- DeMark Screens - Daily, Weekly, Monthly upside/downside exhaustion signals within the S&P 500 and Euro Stoxx 600 WE ARE NOW HIGHLIGHTING STOCKS ARE MOST ACTIONABLE
|
|
|
|
|
Here's a link to the Hedge Fund Telemetry market sentiment page with 40 charts of sentiment including equities, bonds, currencies, and commodities updated each day. When the new website launches we will be adding new charts and historical sentiment data for Euro Stoxx 50, UK FTSE 100, German DAX, French Cac 40. We will be adding Japanese Bonds, German Bunds, and a few more.
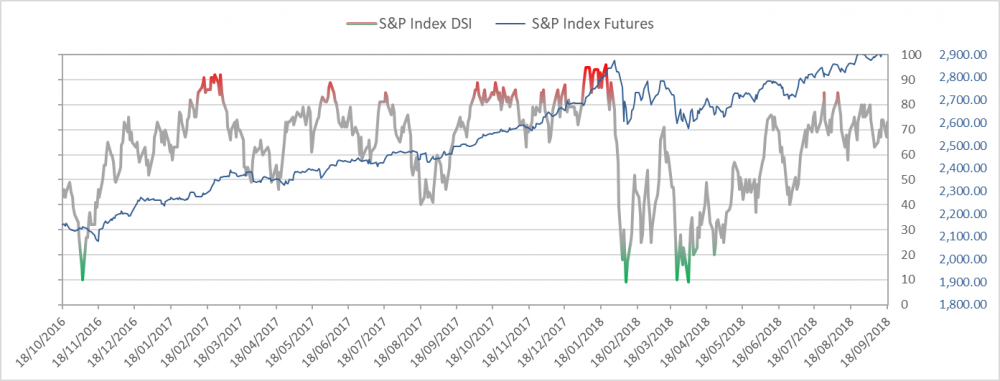
SPX bullish sentiment is at 75% and remains elevated
|
|
|
|
|
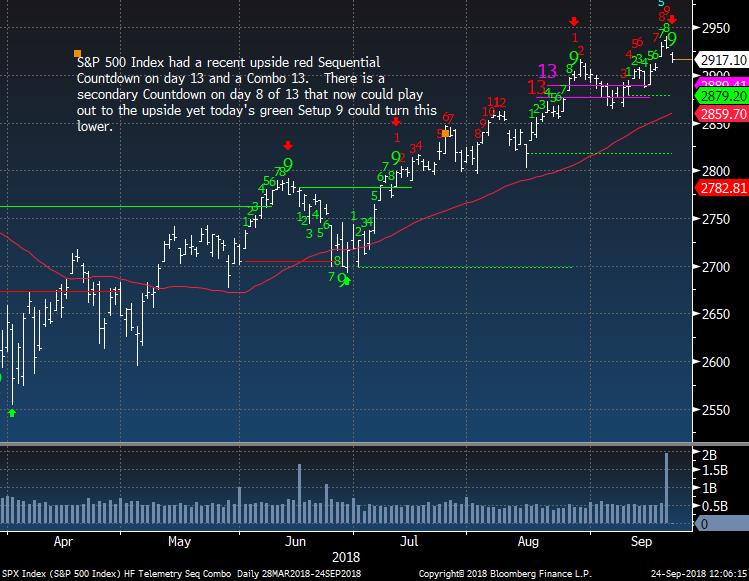
SPX daily another green Setup 9 and a pullback with 9's have been seen in the past 5 months
|
|
|
|
|
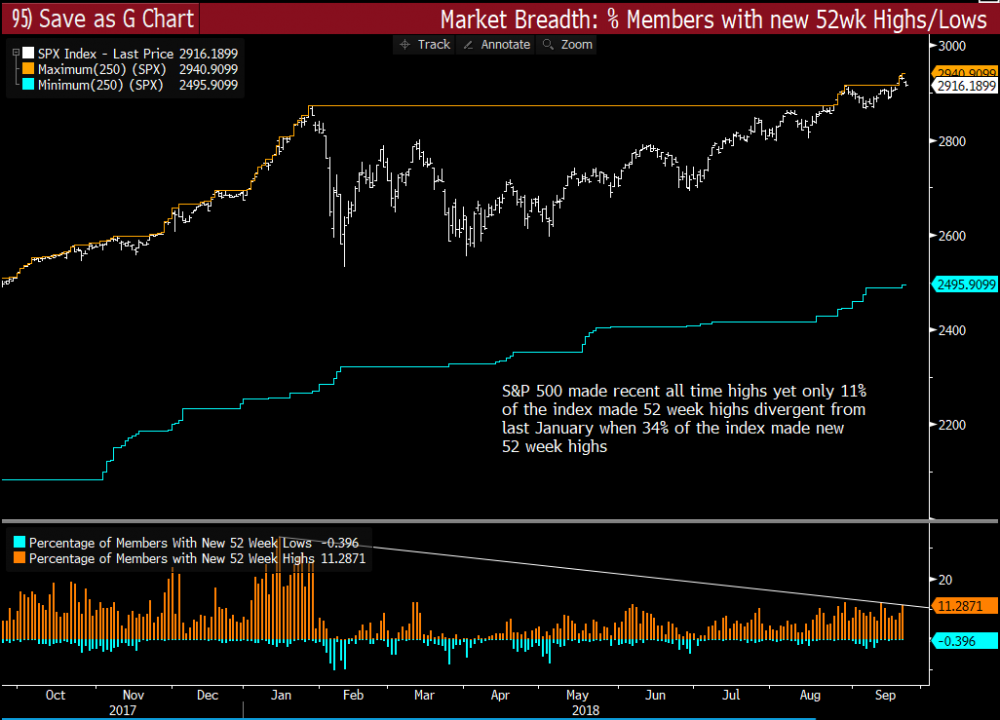
S&P 500 new 52 week high divergence
|
|
|
|
|
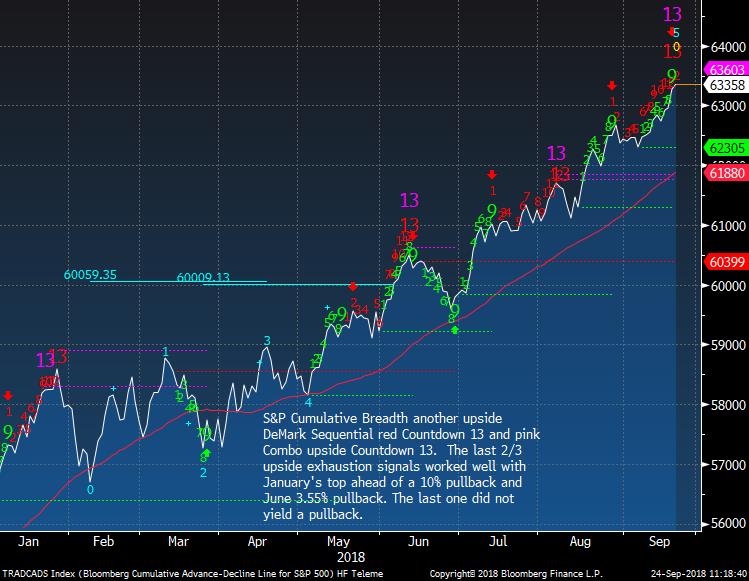
S&P cummulative breadth with another Sequential and Combo 13 with a green Setup 9. The last signal did not work for more than a few days but the previous two did work well.
|
|
|
|
|
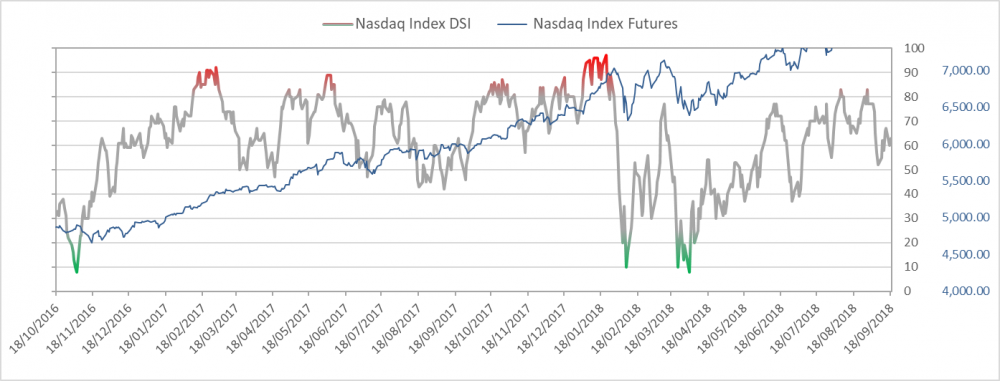
Nasdaq bullish sentiment is at 63%
|
|
|
|
|
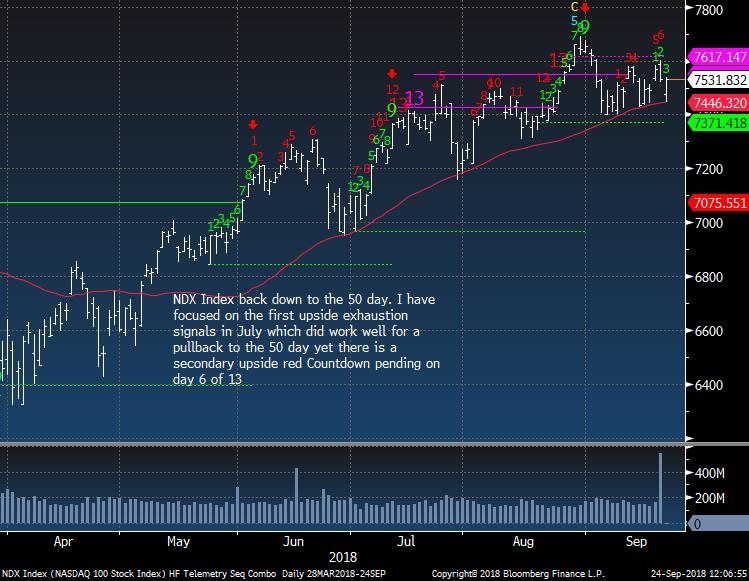
NDX Index still holding the 50 day. FANG's helping today
|
|
|
|
|
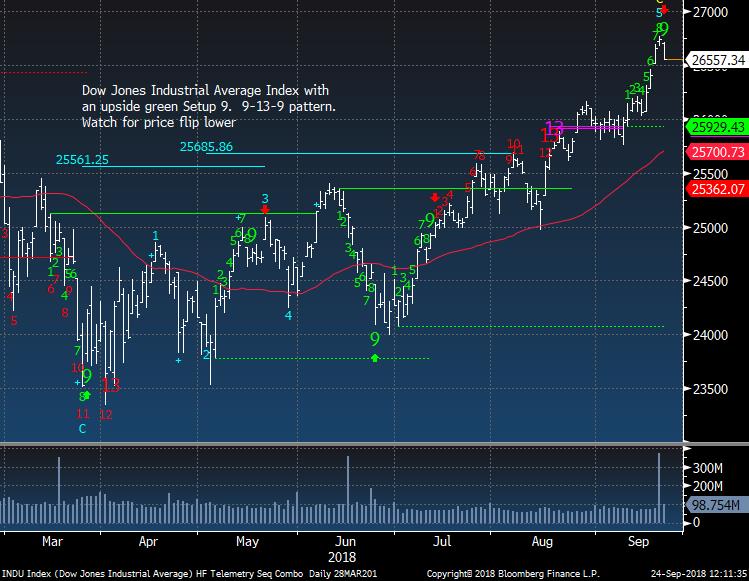
Dow Jones Industrial Average with 9-13-9 pattern.
|
|
|
|
|
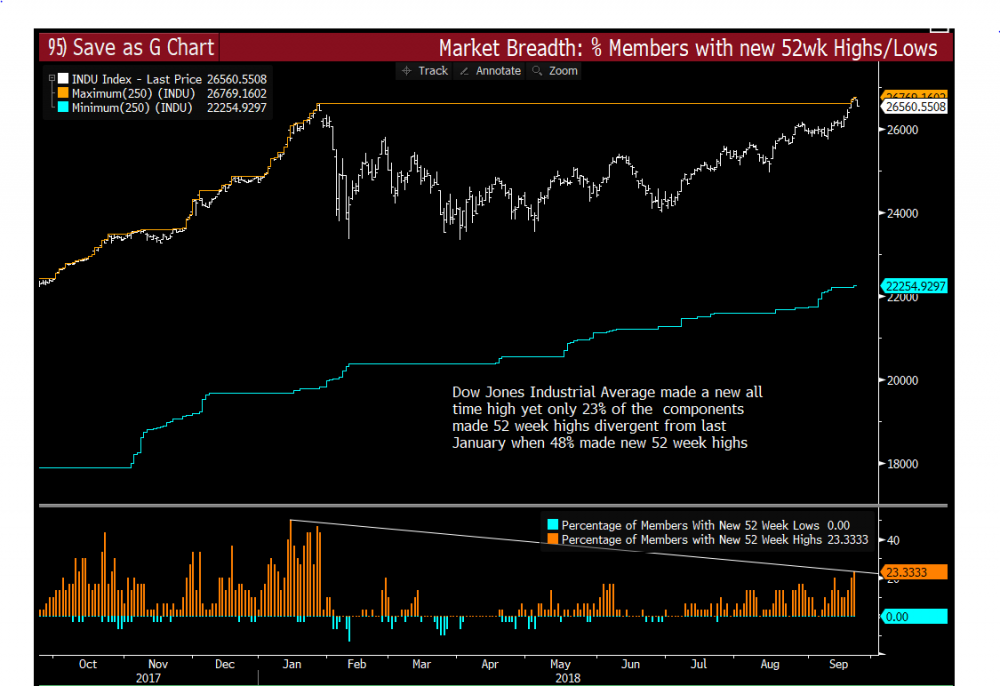
Dow Industrials also not seeing as many stocks hitting 52 week highs vs January
|
|
|
|
|
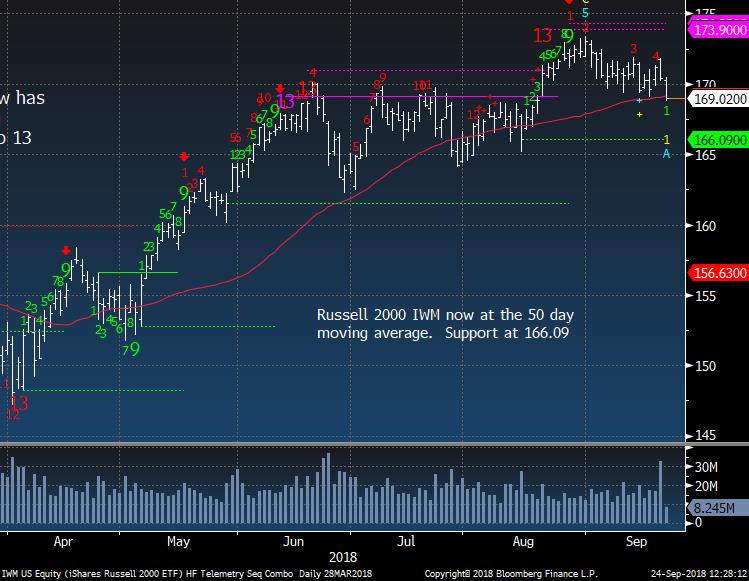
IWM Russell 2000 starting to break the 50
|
|
|
|
|
|
|
Hedge Fund Telemetry Trade Ideas
|
|
|
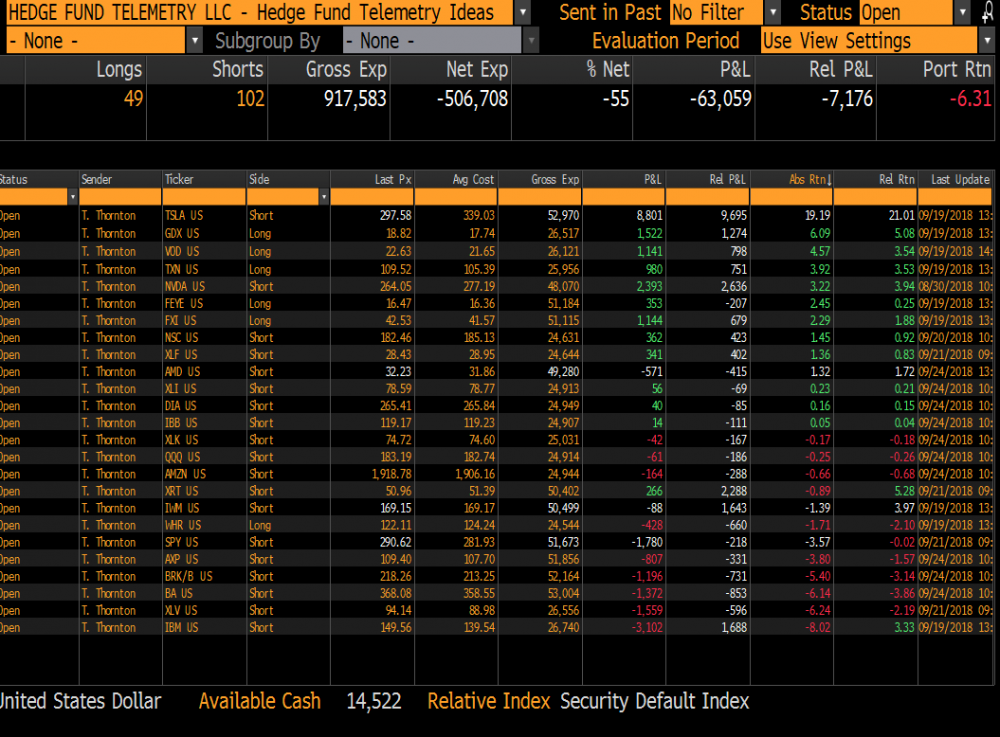
Trade Ideas Sheet - Long and short US equity ideas including ETF's. We will be overhauling the Trade Ideas Sheets for long only, short only, ETF's when the new website rolls out soon. There will also be a clearer email distribution with changes.
Trade Ideas Changes: TIF, UPS (friday - too tight of stops), XLP, short stopped with gains, XLY, XLE stopped with loss. Added short 2.5% sized DIA, QQQ, XLK, XLI, AMZN, IBB. Doubled to 5% BRK/B, BA, AXP short.
Stops on everything. TSLA 320, GDX 18.35, AMZN 1850, , VOD 21.95, FEYE 16.00, FXI 41.95, NVDA 275, TXN 108.75 (raised), QQQ 185.50, XLK 77, SPY 295, XLY 118, AXP 114, WHR 120, XRT 53, IWM 172, XLV 95, BRK/B 225, IBM 153, DIA 275, XLI 81.50, IBB 123, AMD 35
|
|
|
|
|
|
|
Bull Market with negative guidance
|
|
|
This is interesting since earnings expectations are very high vs 2016 after the market had been down for nearly 6 months. Could the tax benefits sugar high start to wear off?
|
|
|
|
|
|
|
|
|
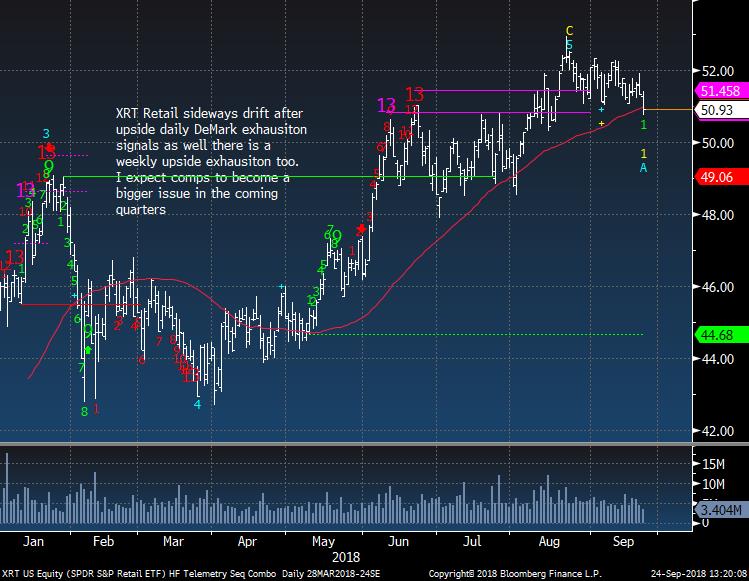
Retail under 50 day and I remain short as I expect a lot of lowered guidance calls.
|
|
|
|
|
|
|
|
|
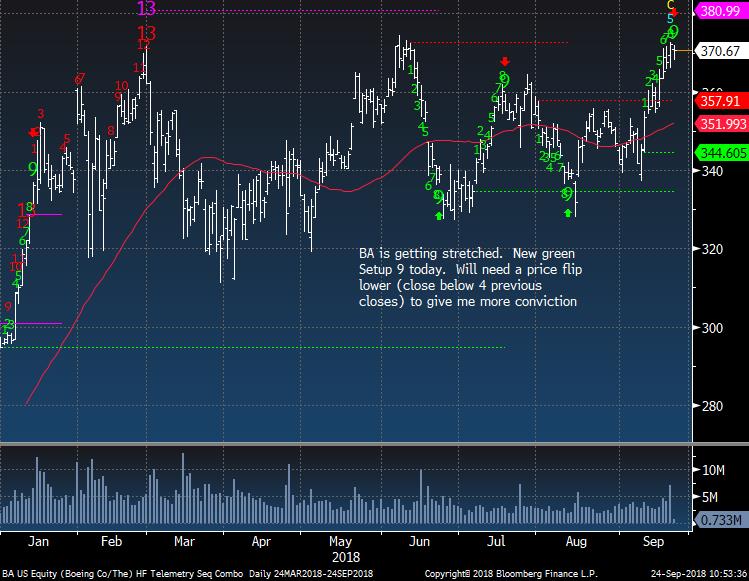
BA daily with green Setup 9. This is the largest weight in the Dow so it correlates with the Dow's 9 too
|
|
|
|
|
|
|
|
|
|
|
|
|
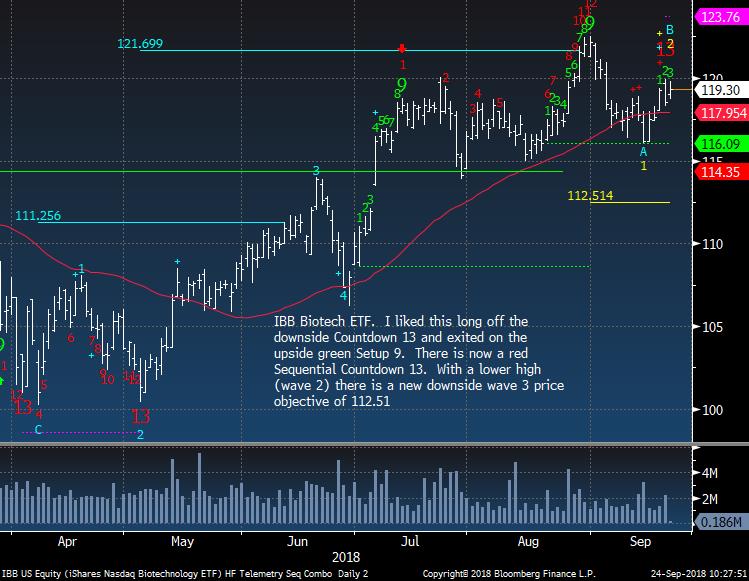
Biotech IBB finally got the upside Countdown 13.
|
|
|
|
|
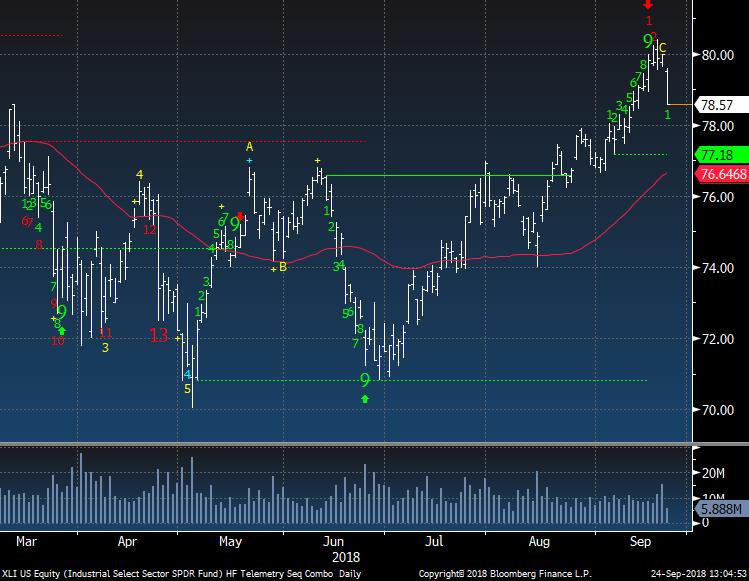
Industrials XLI a large price flip today
|
|
|
|
|
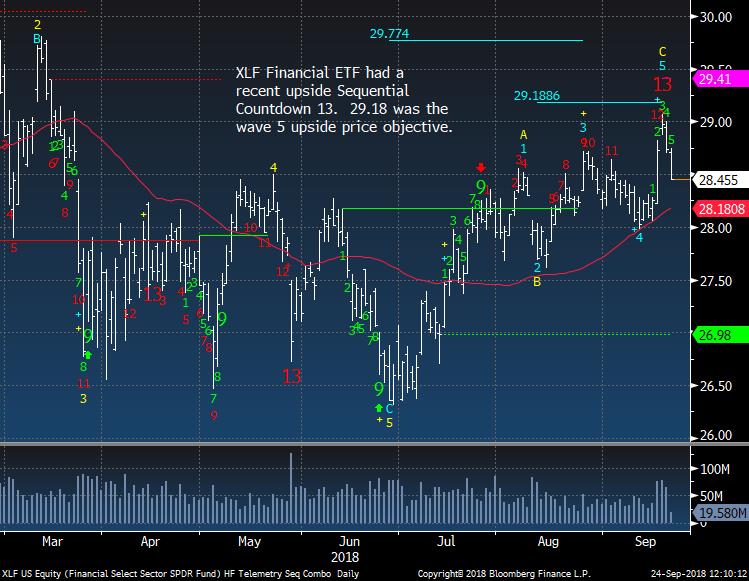
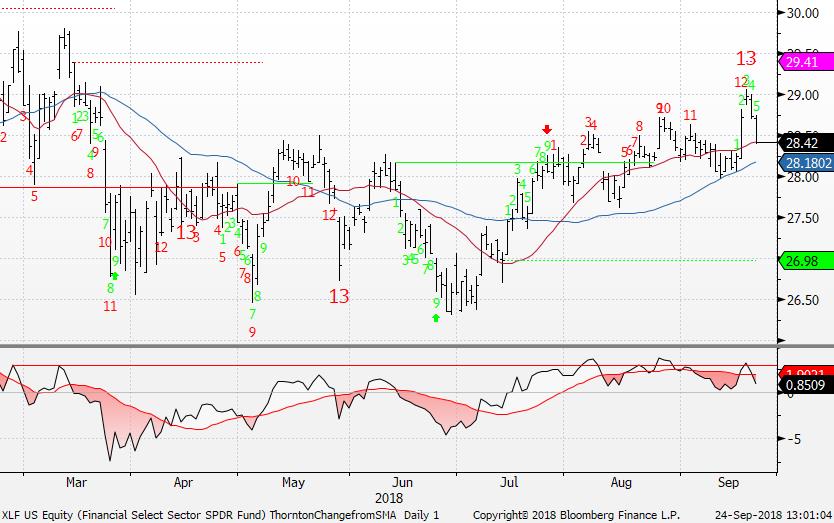
XLF is down 2% from recent upside exhaustion signal from last week
|
|
|
|
|
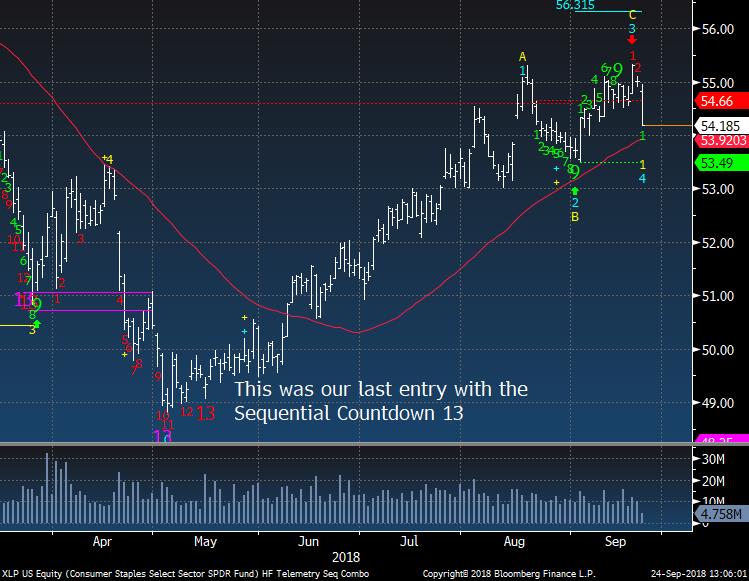
Staples XLP big reversal and I will watch if it can hold the 50 day. I stopped out of long with a 3% gain
|
|
|
|
|
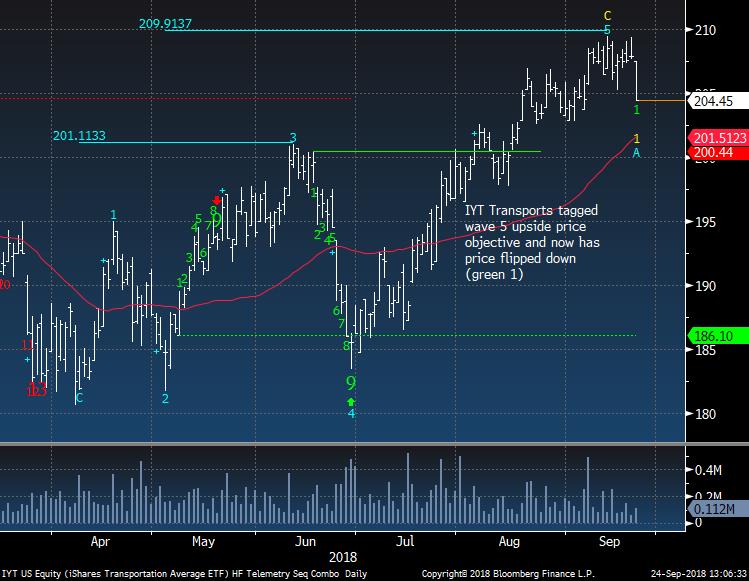
Transports IYT ETF big reversal today. I've been showing transports subsectors for the past couple weeks as a risky place to be - especially rails
|
|
|
|
|
|
|
PPO Monitor - Percentage Price Oscillator
|
|
|
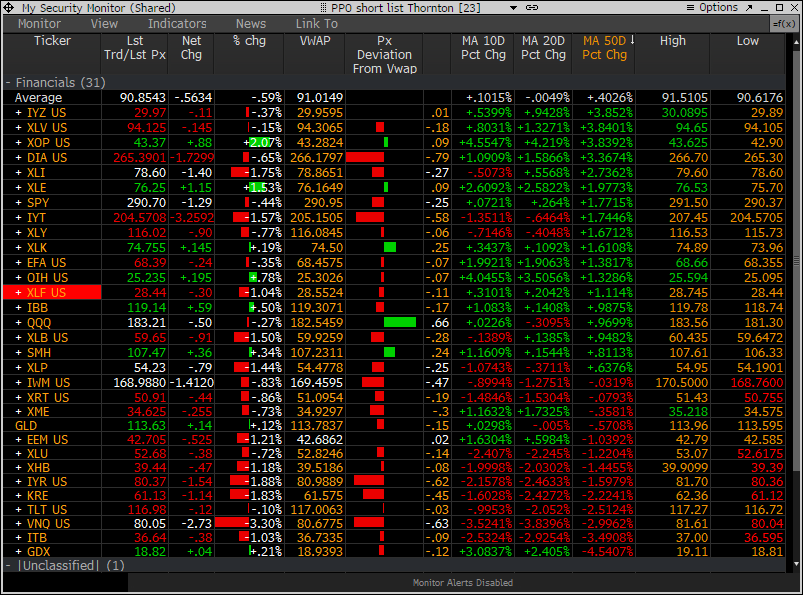
The PPO Monitor is a proprietary monitor developed to force rank Indexes, Sectors, and Stocks. It ranks top down by strongest to weakest by percentage above/below the 50 day moving average. Shorter term signals can be seen when the 10 and 20 day moving averages turn up (green) or down (red) which often are followed by the 50 day moving average. This is useful to watch for historically overbought/oversold percentage above/below the 50 day moving average. It is non correlated with the DeMark Indicators however we have found upside/downside exhaustion signals often occur when something rises to the top or drifts to the bottom of the monitor - increasing the timing aspect. We share this monitor with clients with Bloomberg Terminals. An added feature is that each market/ETF can be expanded with each component force ranked in the same way. A couple other features include price deviation from intraday VWAP (useful for intraday reversals) and new 20 day highs/lows on right side. Please inquire if you would like to be permissioned to use the PPO Monitor.
Today's highlights: look as some of the better sectors breaking under the 10 and 20 day moving average. Early signs of weakness. GDX on the bottom is showing signs of bottoming
|
|
|
|
|
The following chart shows the Percentage Price Oscillator (50 day moving average) in action. XLF has moved about 2.5% above the 50 day in the past 6 months and faded from there
|
|
|
|
|
|
|
Bloomberg Automated Technical Pattern Recognition Screens
|
|
|
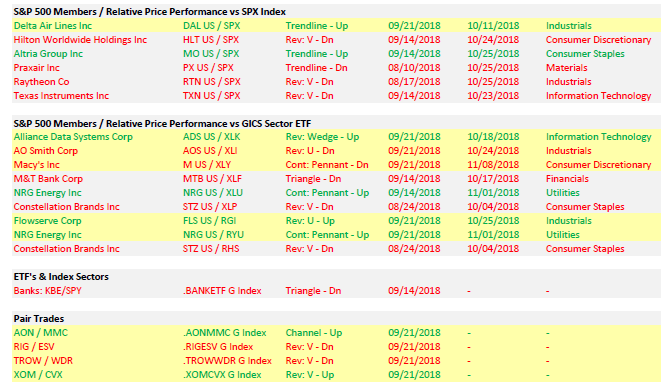
S&P 500 Members/Absolute Price Performance and Relative Price Performance vs S&P 500 and Sector ETF's. ETF's vs Index Sectors. Pair Trades. Long side is first symbol, short side is second symbol.
|
|
|
|
|
|
|
|
|
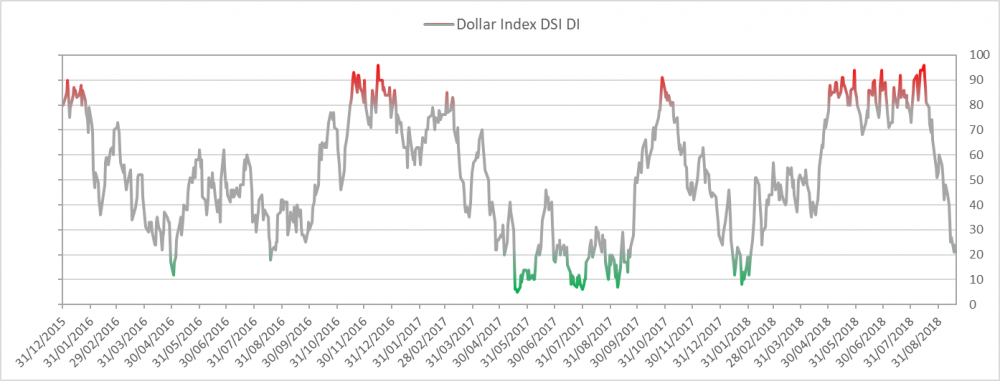
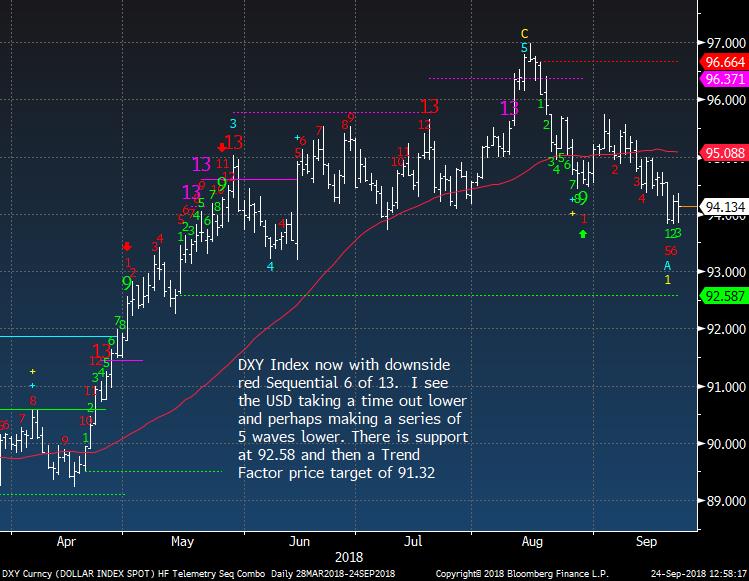
US Dollar bullish sentiment is at 21% and down from 96% 5 weeks ago
|
|
|
|
|
|
|
|
|
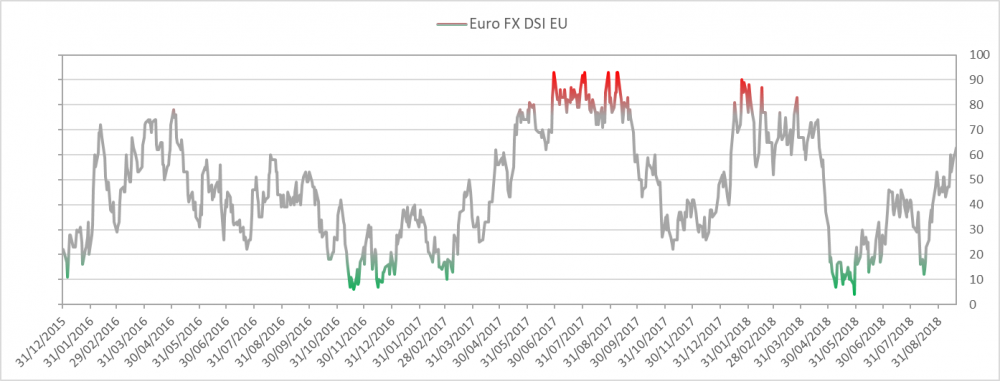
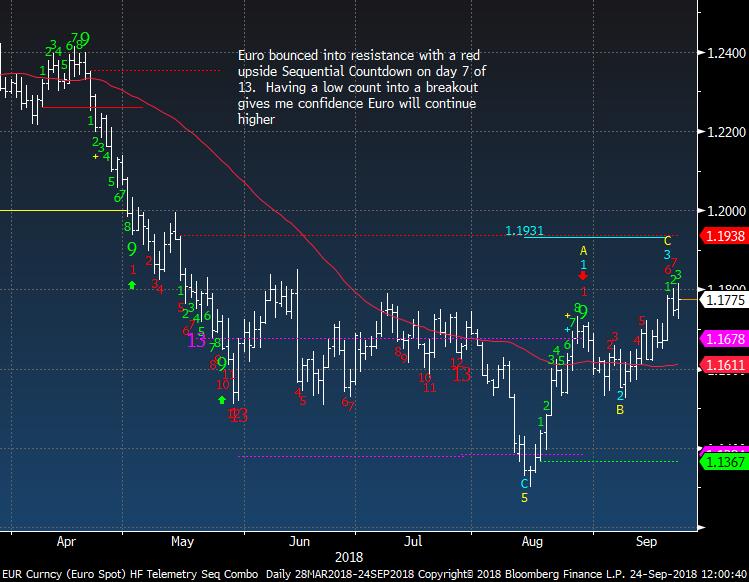
Euro bullish sentiment is at 63%
|
|
|
|
|
|
|
|
|
|
|
|
|
|
|
|
|
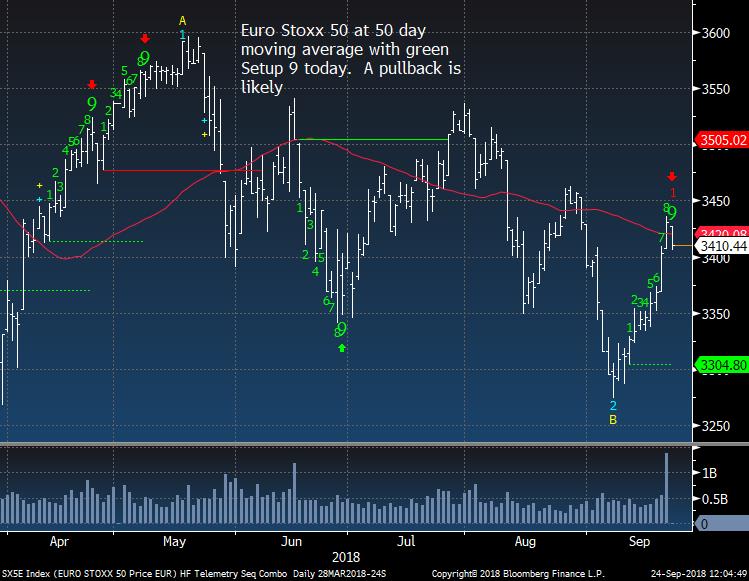
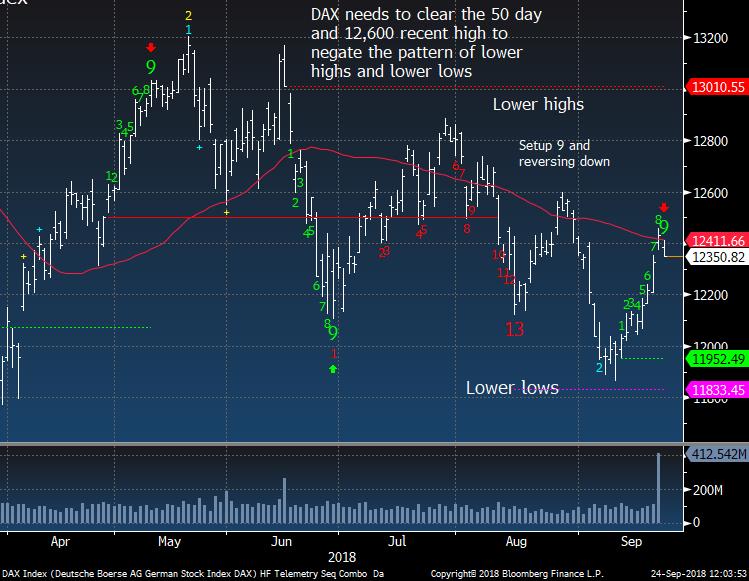
Euro Stoxx 50 could be making another lower high
|
|
|
|
|
|
|
|
|
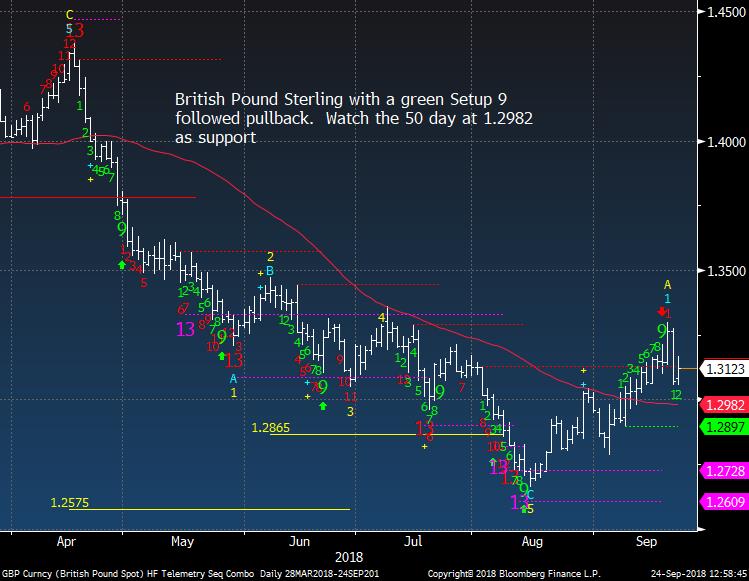
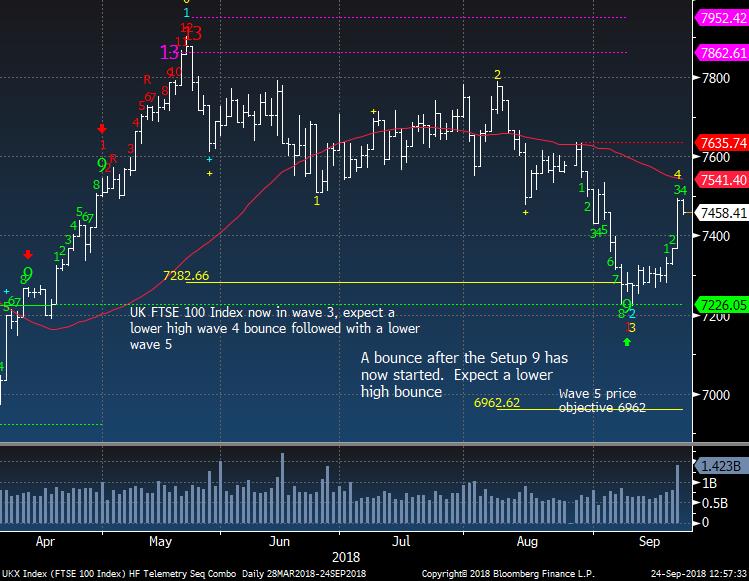
UK FTSE now has a downside wave 5 price objective
|
|
|
|
|
|
|
|
|
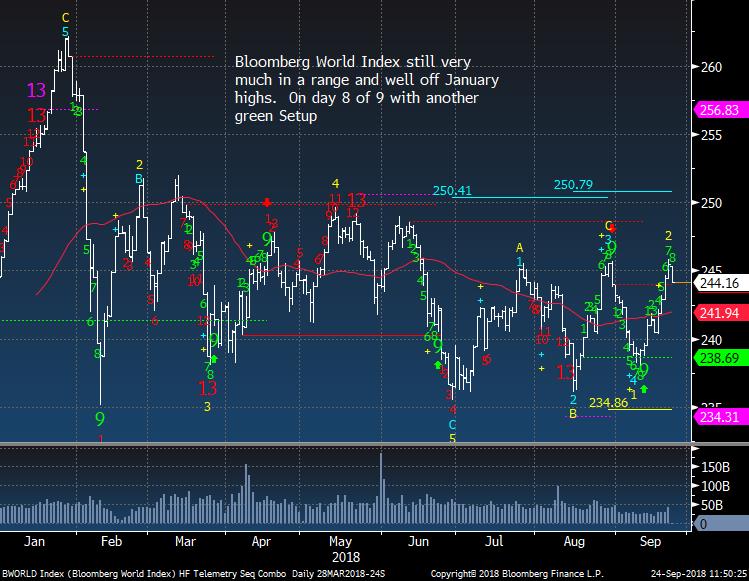
Bloomberg World Index remains in a range from February
|
|
|
|
|
|
|
|
|
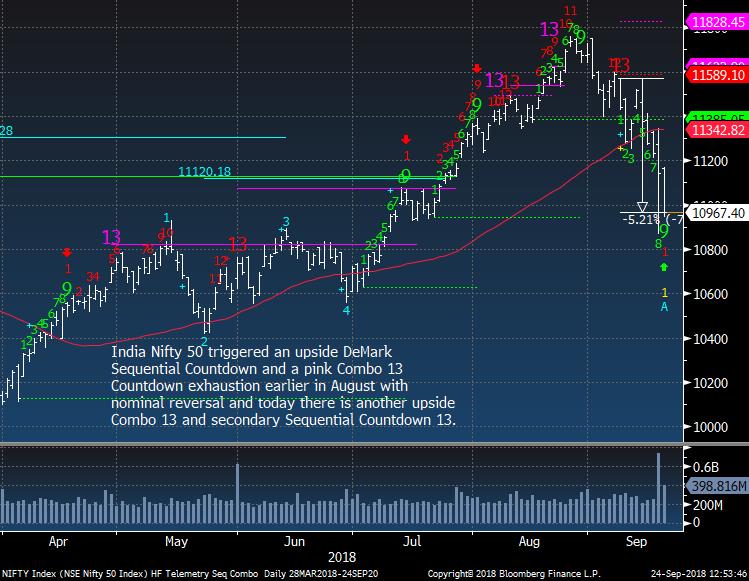
India Nifty 50 down 5% after recent Countdown 13
|
|
|
|
|
|
|
|
|
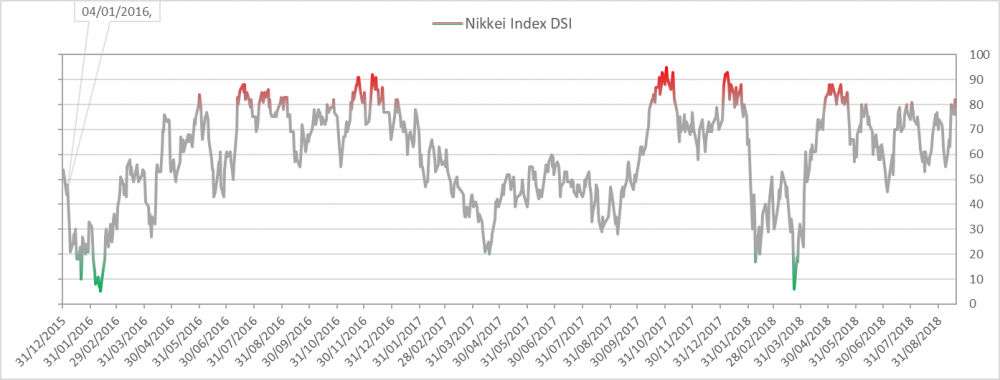
Nikkei bullish sentiment is at 79%
|
|
|
|
|
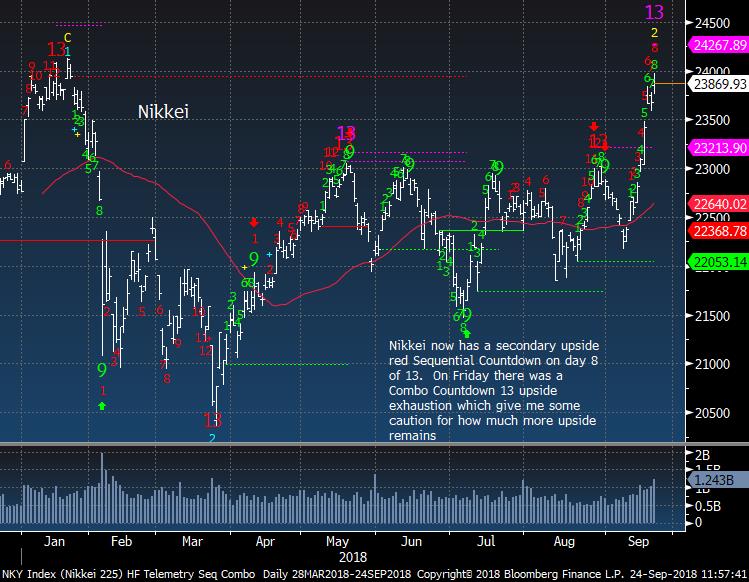
Nikkei with a Combo and could see some pullback.
|
|
|
|
|
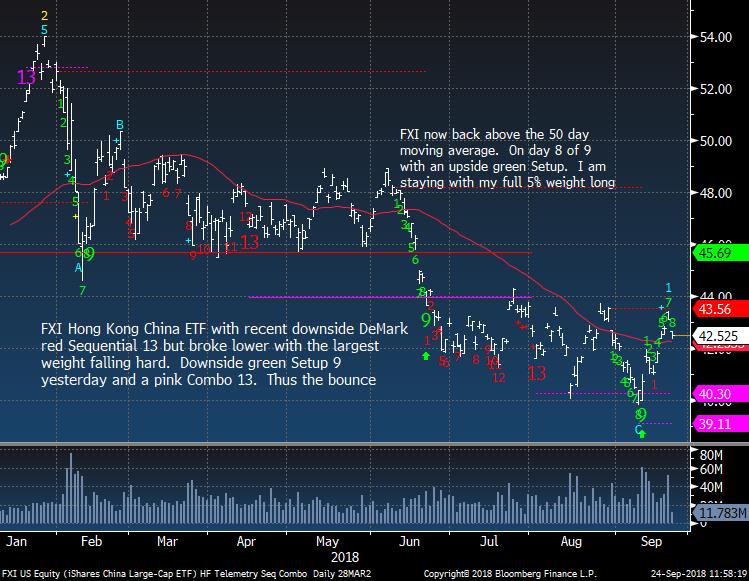
China / Hong Kong FXI ETF needs to clear 44
|
|
|
|
|
|
|
|
|
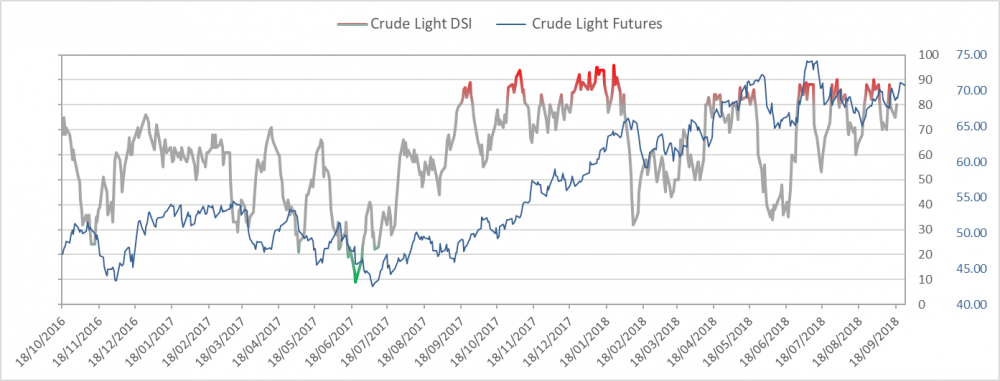
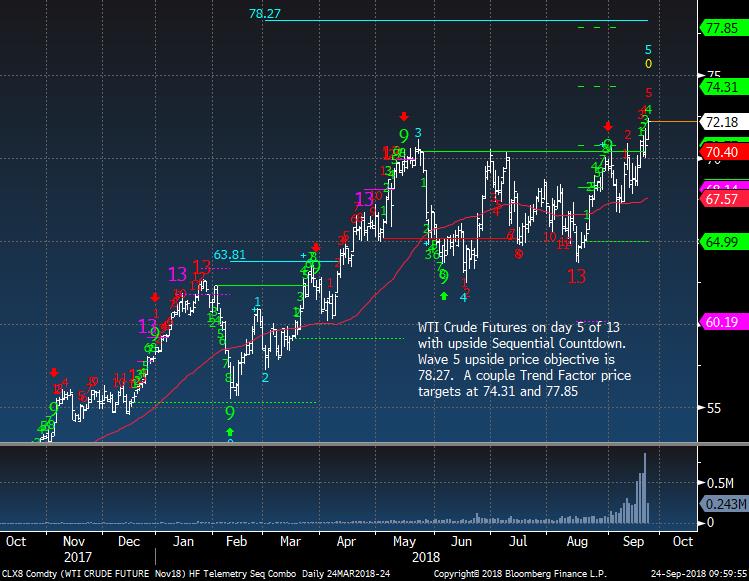
Crude bullish sentiment is at 86% and remains in extreme zone
|
|
|
|
|
WTI Crude Futures should work higher with this DeMark Countdown only on day 5 of 13 however sentiment could be a limiting factor
|
|
|
|
|
|
|
|
|
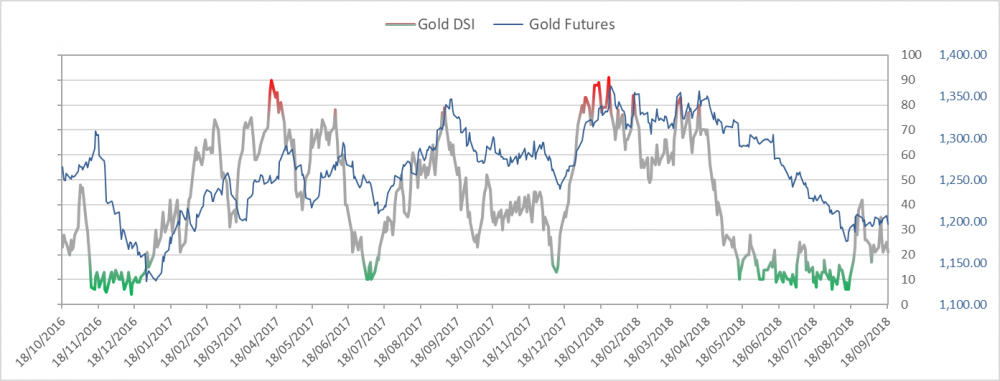
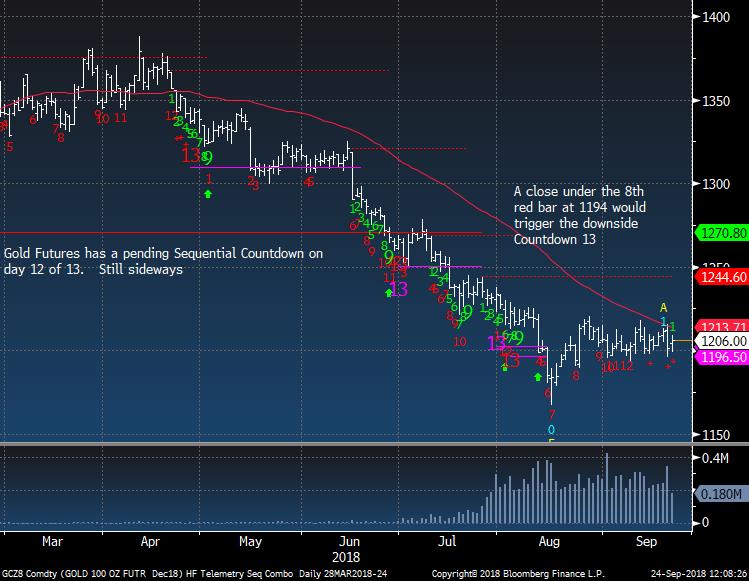
Gold bullish sentiment is at 26%
|
|
|
|
|
|
|
|
|
|
|
|
|
|
|
|
|
Bond bullish sentiment is at 53% and near the 50% majority line.
|
|
|
|
|
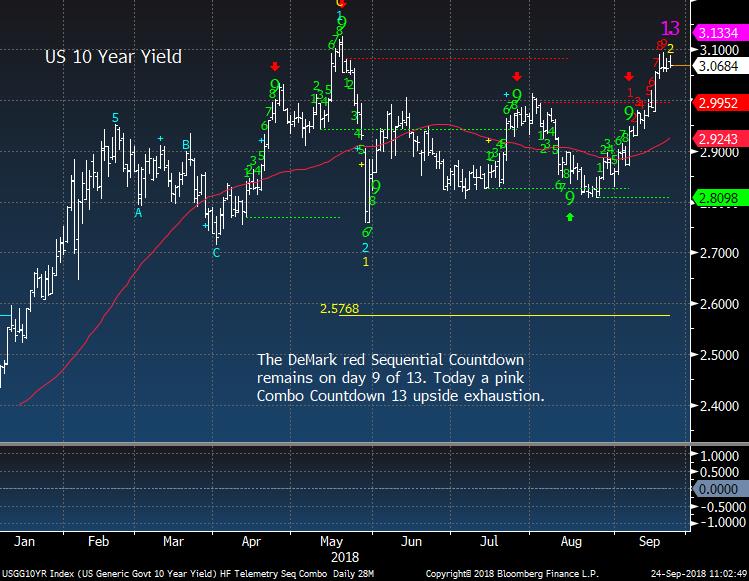
US 10 Year Yield with a Combo 13.
|
|
|
|
|
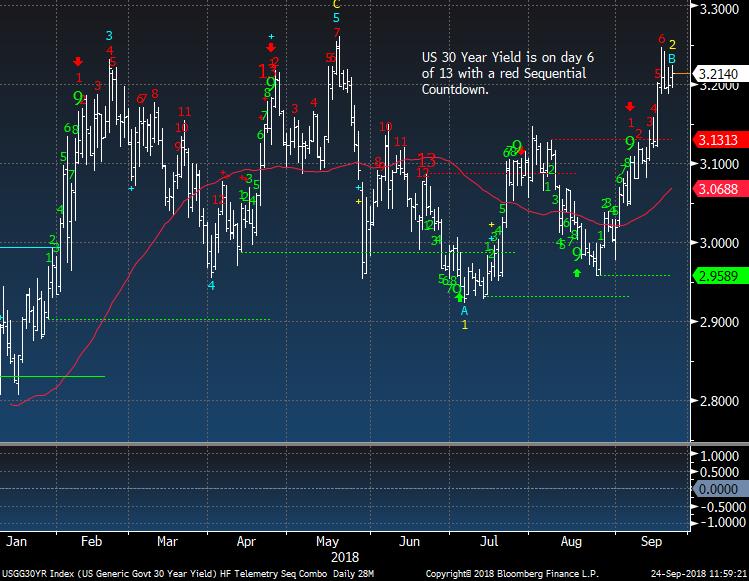
US 30 Year Yield at resistance
|
|
|
|
|
|
|
|
|
|
|
DEMARK SCREENS - Daily, Weekly, Monthly Upside/Downside Exhaustion Signals
|
|
|
Daily/Weekly DeMark upside/downside exhaustion signals (Sequential) updated daily, Weekly signals on Monday's and monthly on the first day of the new month. Price flips occur when a stock closes higher/lower than four previous closes and increases conviction of a price turn.
The upside 13's are sell signals and downside 13's are buy signals. Price flip's are confirmation signals that increases potential for a price trend change. For example, if you are long a stock and there is an upside 13, you will want to take cautious action by selling down or out of a position. If initiating a short sale with the upside 13's, we tend to start with a 1/2 size and add with the downside price flip. The opposite is true for when there are downside 13's. Take a 1/2 size position and add with the upside price flip. The DeMark Indicators are designed to assist the user with buying into weakness and selling into strength to anticipate trend exhaustion. Selling into a rally and buying into a decline often afford the opportunity to exit a trade without too serious a loss if wrong.
S&P 500 Universe:
DAILY UPSIDE 13: CSCO, GILD, MYL
DAILY DOWNSIDE 13: NONE
DAILY UPSIDE WITH PRICE FLIP REVERSAL DOWN: AET, EVHC, XYL
DAILY DOWNSIDE WITH PRICE FLIP REVERSAL UP: WHR
Updated: 9/24/18
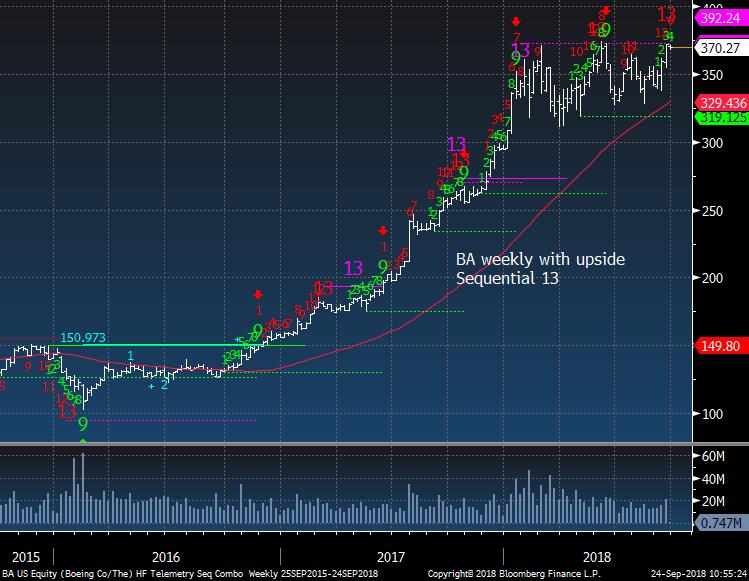
WEEKLY UPSIDE 13: BA, CHRW, DFS, EMR, GPN, NAVI, OKE
WEEKLY DOWNSIDE 13: NONE
Updated: 9/4/18
MONTHLY UPSIDE 13: AFG, AJG, AMD, CBT, CECO, EIG, IR, MAA, MRCY, MSA, MSFT, NSC, ORI, ROK, TDY, TTWO, UNT, UNP, WCG, WTR
MONTHLY DOWNSIDE 13: FTR, RRD, SMCI, SSI
Euro Stoxx 600 Universe:
DAILY UPSIDE 13: CNHI IM, SXS LN, TOP DC
DAILY DOWNSIDE 13: EDP FP
DAILY UPSIDE WITH PRICE FLIP REVERSAL DOWN: CABK SM, EBS AV, HO FP, SMWH LN
DAILY DOWNSIDE WITH PRICE FLIP REVERSAL UP: ENG SM, INF LN, ITRK LN
Updated: 9/24/18
WEEKLY UPSIDE 13: BNR GR, VOLVB SS
WEEKLY DOWNSIDE 13: TCH FP
Updated: 9/4/18
MONTHLY UPSIDE 13: ACKB BB, GALP PL, IPN FP, KOMB CP, MTX GR, UCB BB
MONTHLY DOWNSIDE 13: ALPHA GA, BARC LN, TL5 SM
|
|
|
Unsubscribe me from Hedge Fund Telemetry
Hedge Fund Telemetry LLC, P.O. Box 4675, Greenwich, CT 06861, United States
CONFIDENTIALITY NOTE and DISCLAIMER: This message is for the named person's use only. It may contain confidential, proprietary or legally privileged material. No confidentiality or privilege is waived by any accidental or unintentional transmission. If you receive this message in error, please immediately delete it and all copies of it from your system, destroy any hard copies and notify the sender. You must not, directly or indirectly, use, disclose, distribute, print or copy any part of this message if you are not the intended recipient. Hedge Fund Telemetry LLC. cannot guarantee the confidentiality of the material transmitted; therefore, information of a sensitive or confidential nature should not be transmitted. There is risk in trading markets. Hedge Fund Telemetry LLC reports are based on information gathered from various sources and believed to be reliable, but are not guaranteed as to accuracy and completeness. The information is subject to change without notice and Hedge Fund Telemetry LLC has no obligation to provide any updates or changes. Hedge Fund Telemetry LLC is providing this data for informational and educational purposes and does not believe that it is sufficient to base an investment decision on. This information should not be regarded as a solicitation or recommendation of any particular security or to engage in any trading strategy. One should always check with your licensed financial advisor to determine suitability of any investments.
|
|
|
|
|