|
|
|
|
|
|
Who is the buyer at all time highs?
|
|
|
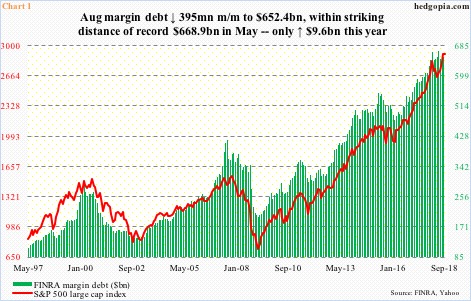
As the US equity markets hit new highs again today, I was reading a note from a financials focused trader (Phil Dauber) who picked up how the increase margin debt has stalled this year and how equity mutual fund and ETF inflows are also not increasing like last year. Phil wrote
- Year-to-August, margin debt only up $9.6b. In '17, surged $113.4b-This is not good for continuation of bull market. Margin debt has been a reliable source of buying power-since Feb '16, when US stocks put in major bottom, margin debt up by $178.2b.
- Winds starting to shift? ETF assets have had a parabolic rise at the expense of mutual funds.
inflows this year have been subdued. As of 1Q18, ETF assets were up $10.6 billion sequentially. (Data for 2Q will be out later today.) In 2017, assets grew $876.3 billion.
A few notes: The
First Call email was written but somehow I didn't hit the 3 buttons to send. (See my Twitter from last night - went out on the boat with a Silver Oak and a friend brought one too). There will be no Daily Note tomorrow as I am traveling. Website is delayed as I wanted to create much more dynamic sentiment charts. Trust me you'll love them and find them extremely useful.
Lastly, I've tightened up stops on the Trade Ideas and will post stop levels daily on this note.
- US Markets - Sentiment still divergent, potential for nominal new highs on indexes with Countdowns
- Hedge Fund Telemetry Trade Ideas - A few changes and tighter stops
- Margin Debt Peaking?
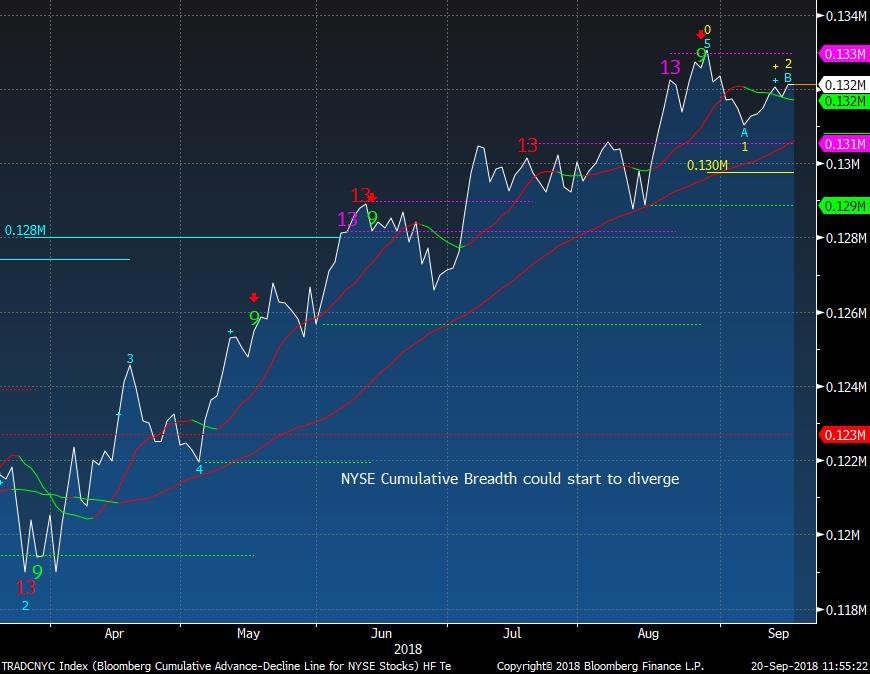
- NYSE Cumulative Breadth Diverging?
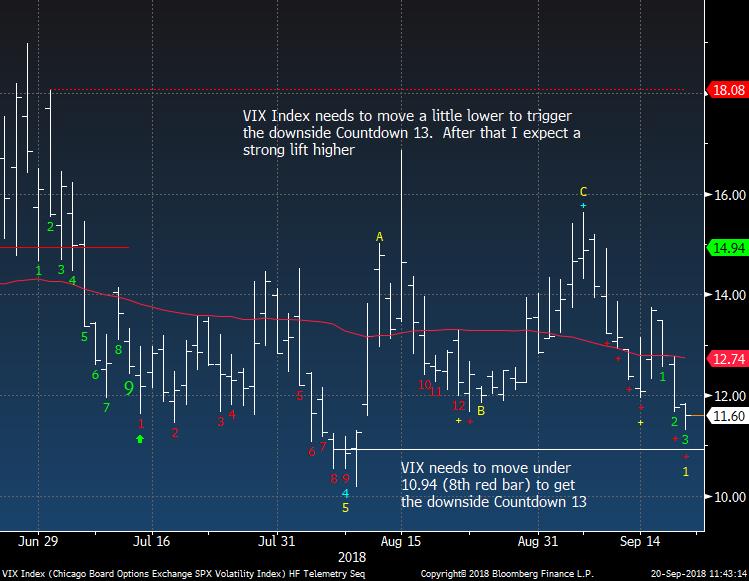
- VIX Index Update
- A few random ideas
- Currency Update - No change to bias with USD lower and crosses
higher
- European Market Update - Another higher low or breakout in Europe?
- Asian Market Update - Still like Nikkei higher
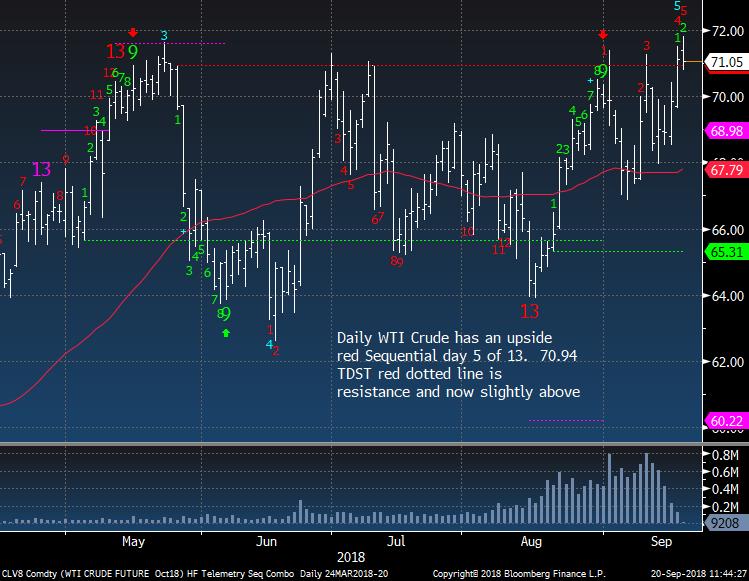
- Crude Update - Still like higher
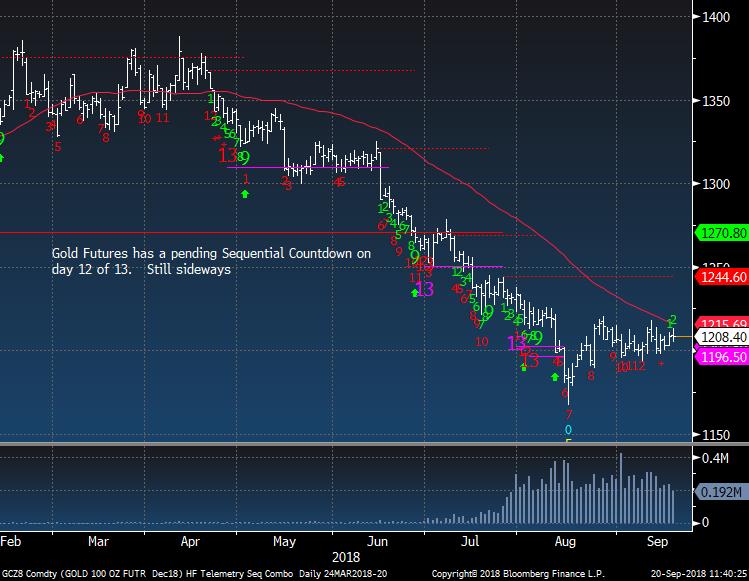
- Gold Update - Sideways still
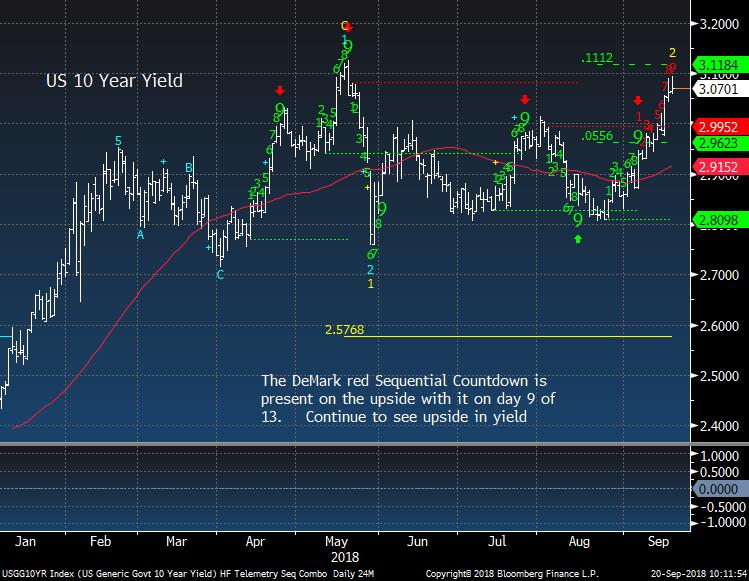
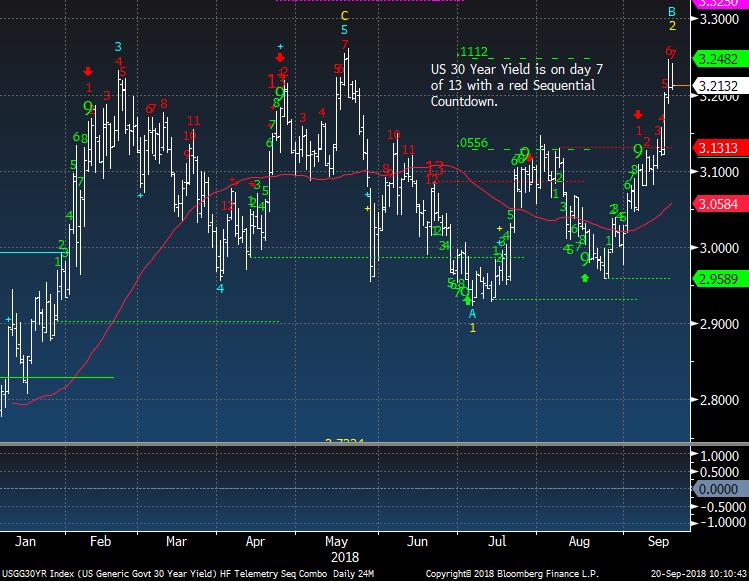
- Bond Update - Still see yields higher in US
- DeMark
Screens - Daily, Weekly, Monthly upside/downside exhaustion signals within the S&P 500 and Euro Stoxx 600 - NOTE I HAVE CHANGED BACK TO S&P 500 SO PEOPLE CAN FOCUS ON THE LARGEST STOCKS
|
|
|
|
|
Here's a link to the Hedge Fund Telemetry market sentiment page with 40 charts of sentiment including equities, bonds, currencies, and commodities updated each day.
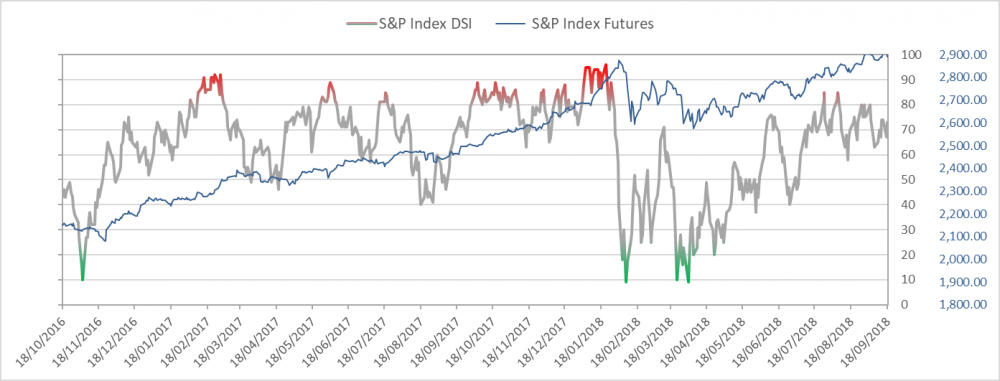
SPX bullish
sentiment is at 75%
|
|
|
|
|
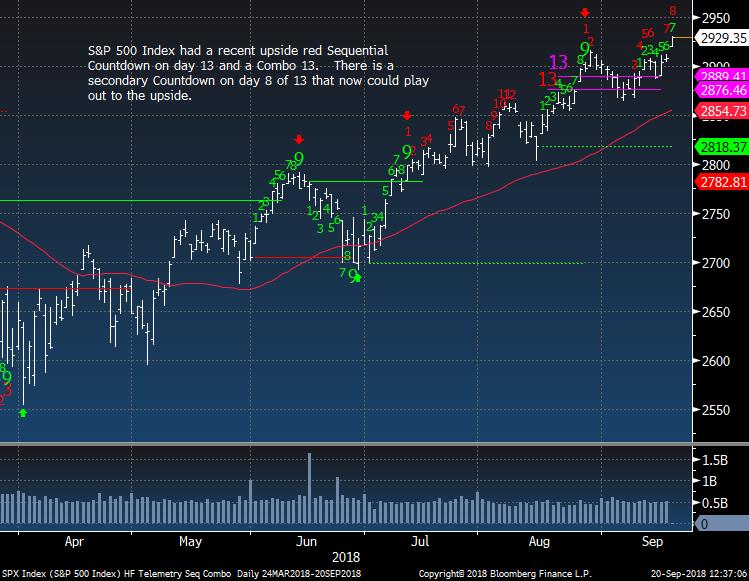
SPX daily as I have been saying for the past week there could be nominal new highs with this secondary Countdown.
|
|
|
|
|
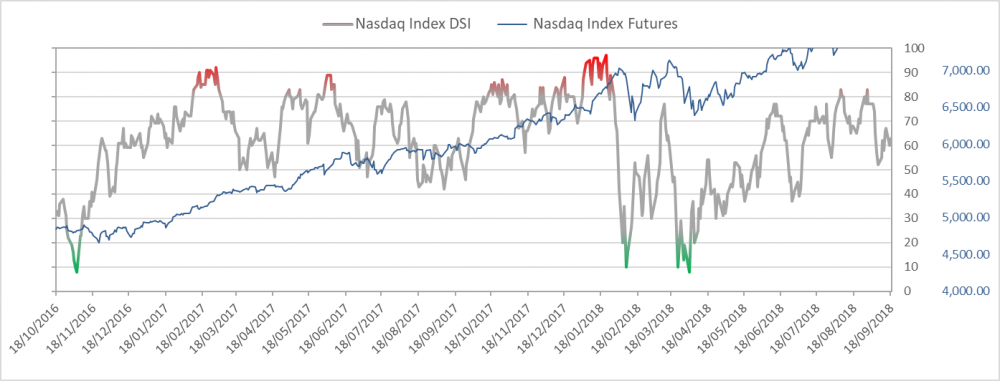
Nasdaq bullish sentiment is at 63%
|
|
|
|
|
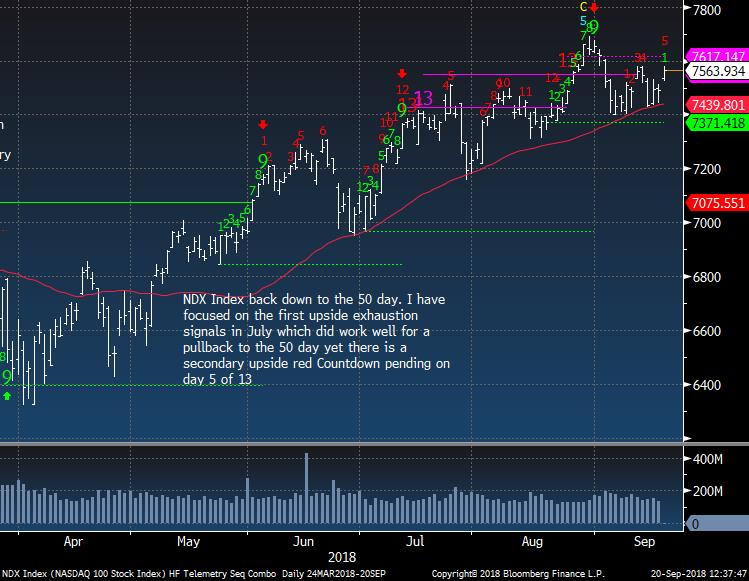
NDX Index same story as SPX
|
|
|
|
|
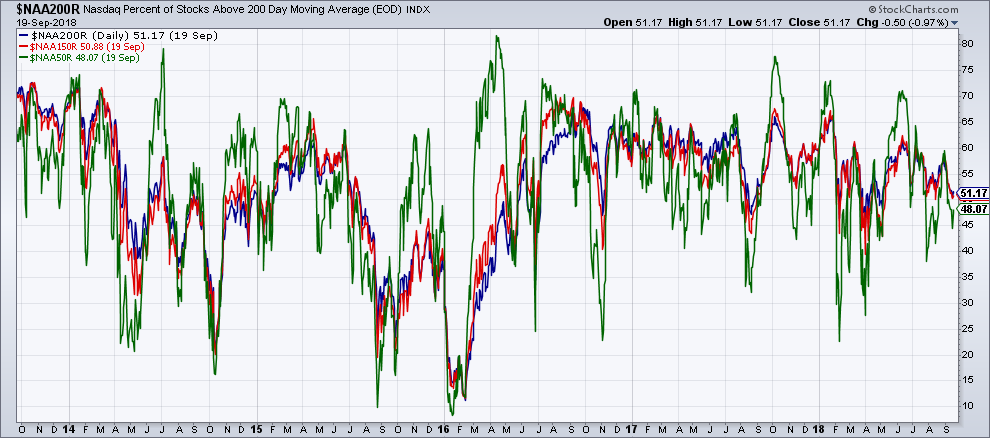
Nasdaq % of stocks above the 50, 150, and 200 day are around 50%. And the market is at all time highs? This is quite a divergence
|
|
|
|
|
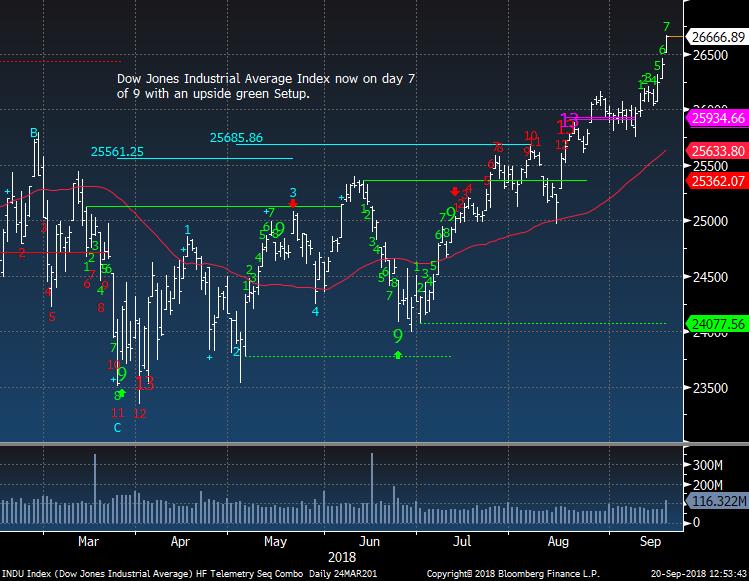
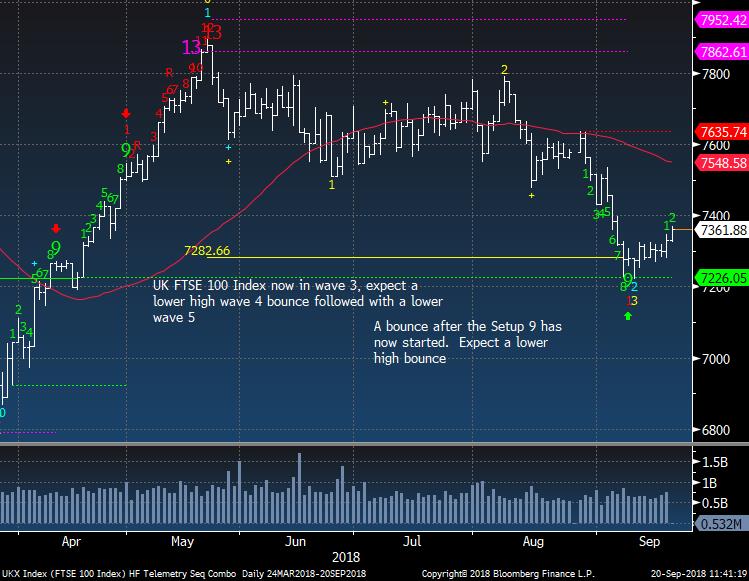
Dow Jones Industrial Average has played catch up and could see a top on day 9 Monday
|
|
|
|
|
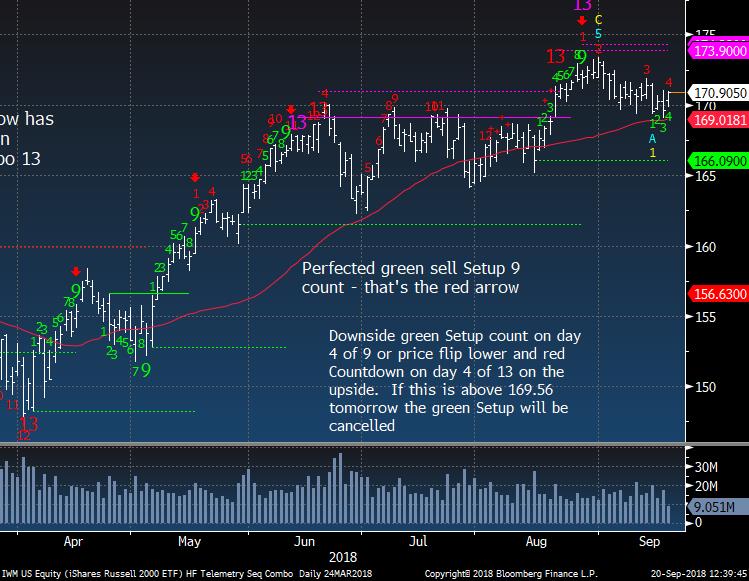
IWM Russell 2000 mixed picture here.
|
|
|
|
|
|
|
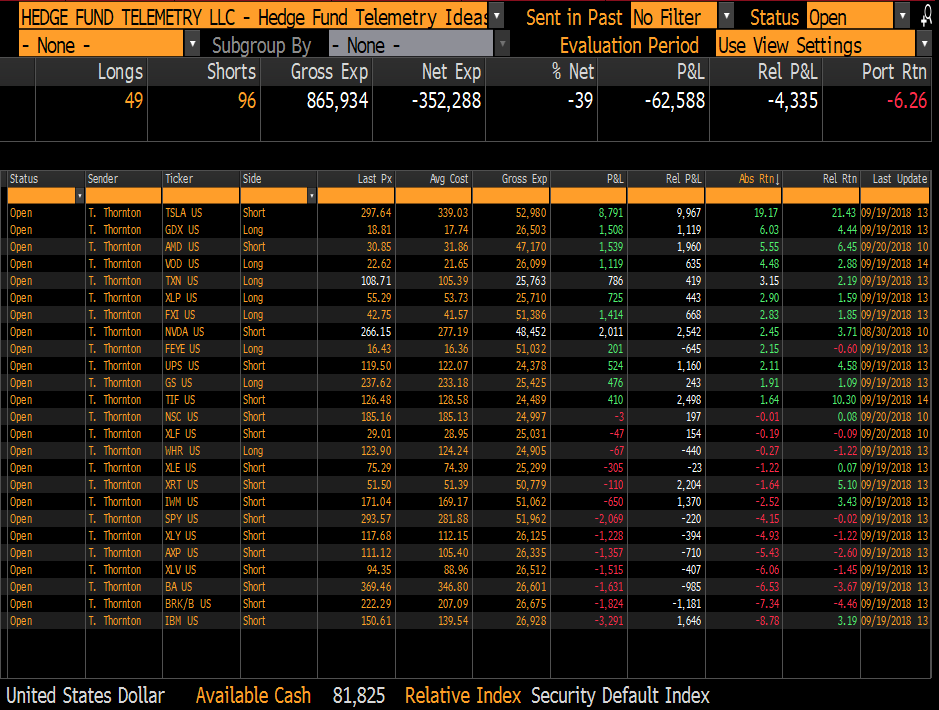
Hedge Fund Telemetry Trade Ideas
|
|
|
Trade Ideas - stopped out of GWPH +6.7%, FB 4.5%, QQQ -6%, XLK -5%, AMZN +3.5%. Doubled up AMD to 5%. Stops on everything. TSLA 320,, GDX 18.35, VOD 21.95, UPS 120, TIF 128, FEYE 16.00, FXI 41.95, XLP 54.25, NVDA 275, TXN 105.60, SPY 295, XLY 118, AXP 114, GS
230, WHR 120, XLE 76.50, XRT 53, IWM 172, XLV 95, BRK/B 225, IBM 153
|
|
|
|
|
|
|
|
|
Margin Debt only up $9.6 billion YTD. Could be starting to top.
|
|
|
|
|
|
|
|
|
NYSE Cumulative Breadth is slightly diverging
|
|
|
|
|
|
|
|
|
VIX Index still needs to go under 10.94 to get the downside Countdown 13
|
|
|
|
|
|
|
|
|
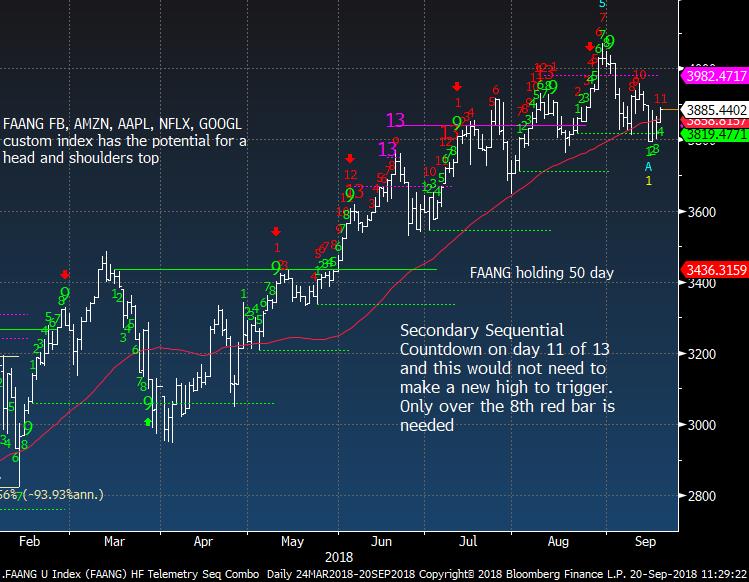
FAANG could make a little higher move under the high and get the upside 13
|
|
|
|
|
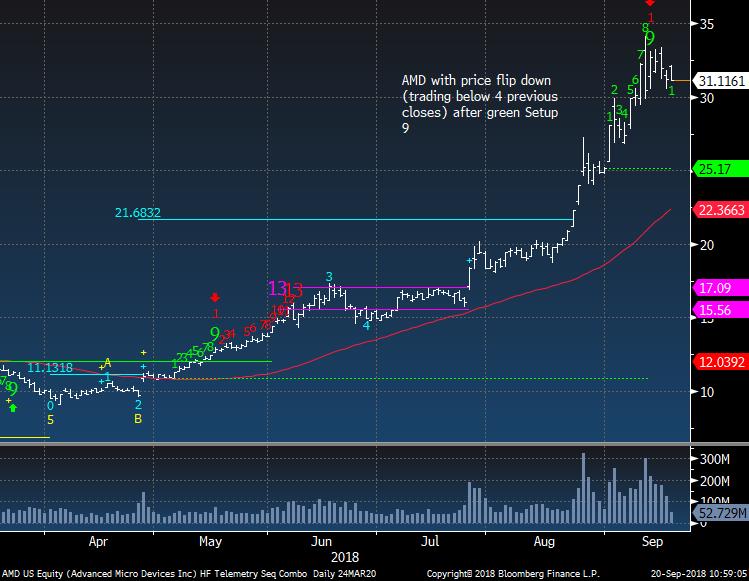
AMD looks like it could be topping here and I doubled up the short to 5%
|
|
|
|
|
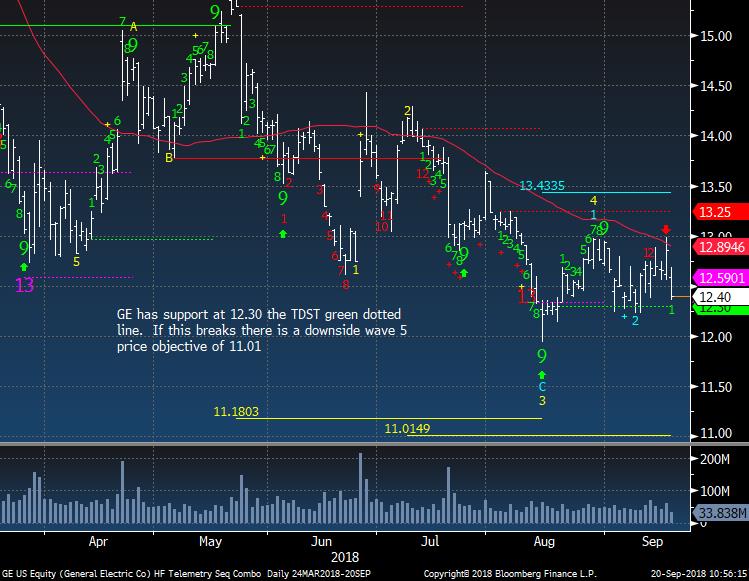
GE looks weak and JPM's analyst who is quite good put a 10 target on them. He was the first to sound the alarms last year at 30
|
|
|
|
|
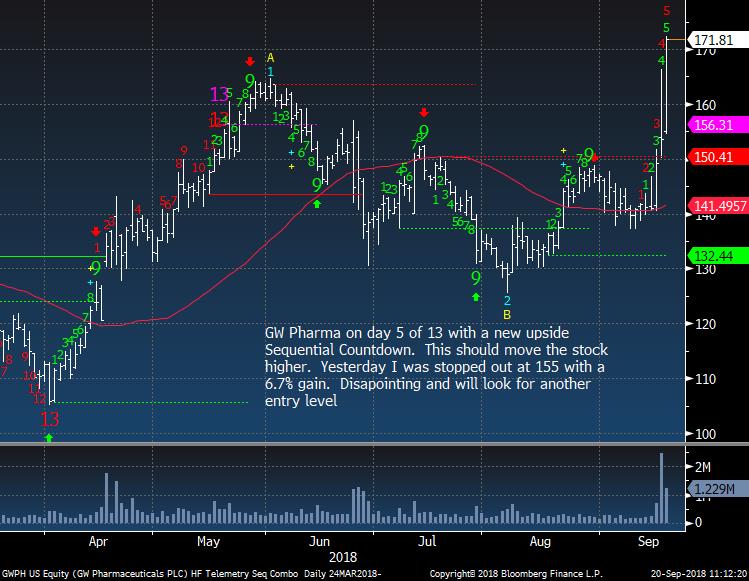
GW Pharma was stopped out yesterday late as Tilray was plummeting. The trade earned 6.7% and I will look for another entry
|
|
|
|
|
|
|
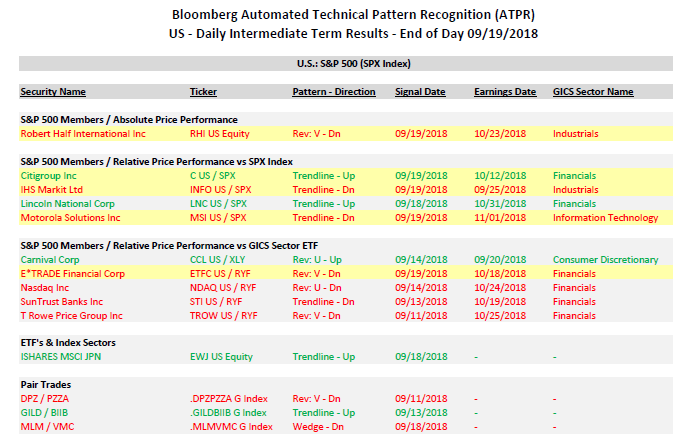
Bloomberg Automated Technical Pattern Recognition Screen
|
|
|
Interesting how there are some Financials on here underperforming the equal weight ETF and Citi which is outperforming the SPX
|
|
|
|
|
|
|
|
|
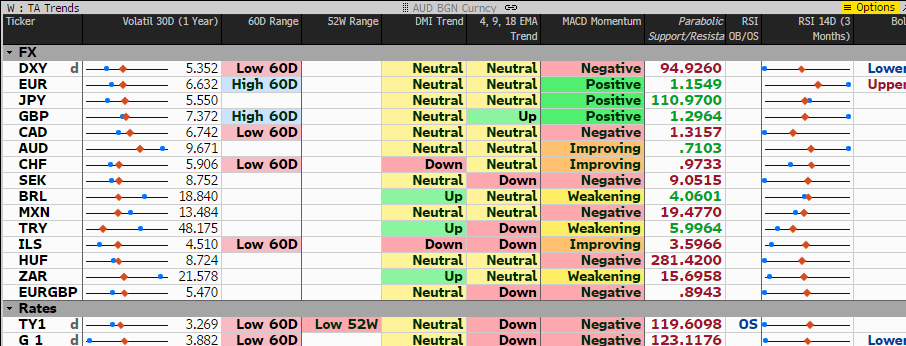
I've been using this new Bloomberg Currency Monitor. Today is interesting as it shows how a lot of crosses are making 60 day highs and lows
|
|
|
|
|
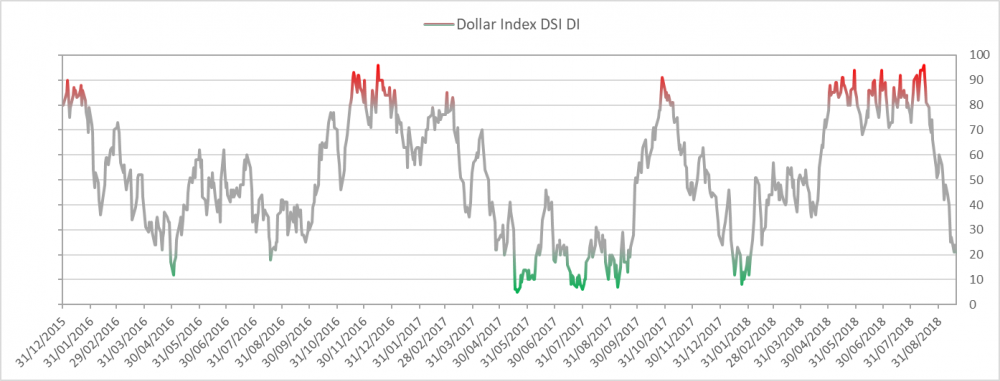
US Dollar bullish sentiment is at 21% and pretty incredible move from recent high of 96%
|
|
|
|
|
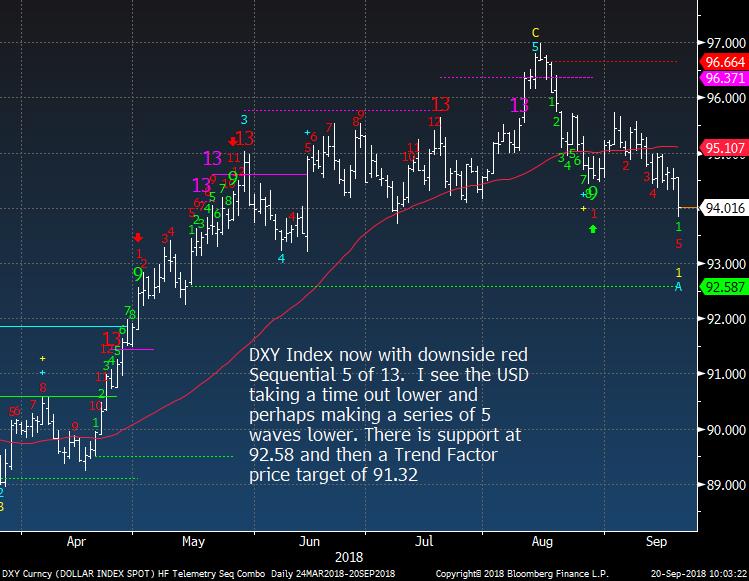
US Dollar Index no change to bias lower
|
|
|
|
|
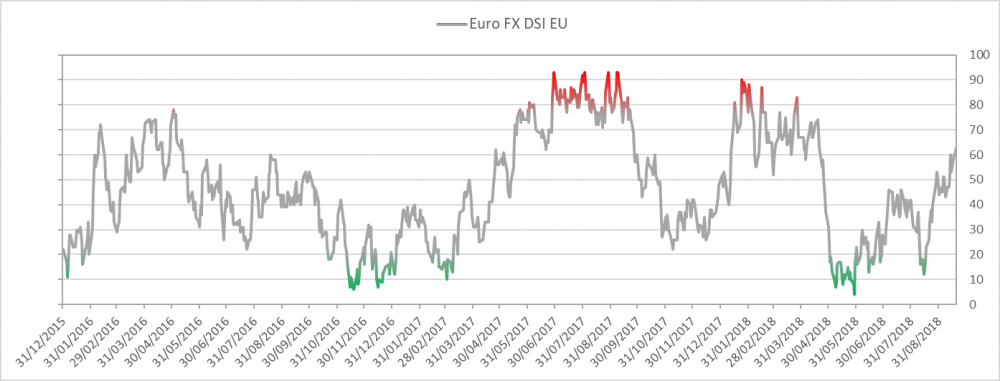
Euro bullish sentiment is at 63% and new high for this cycle
|
|
|
|
|
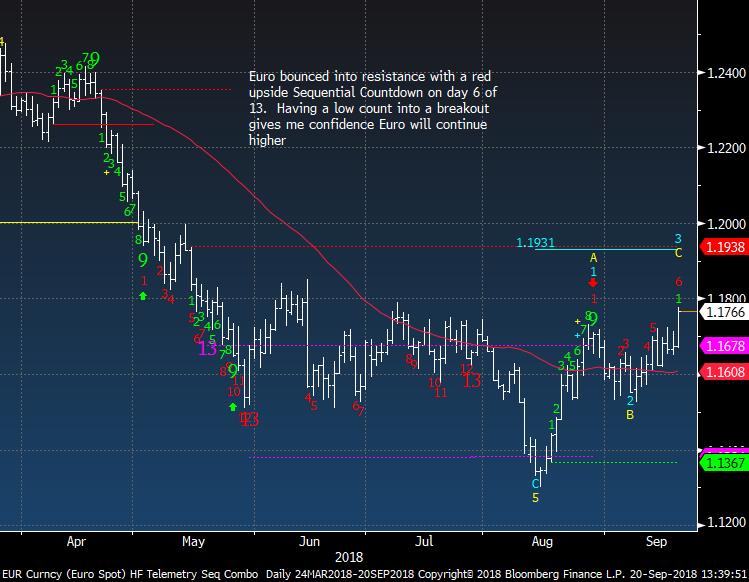
Euro Spot now starting to move
|
|
|
|
|
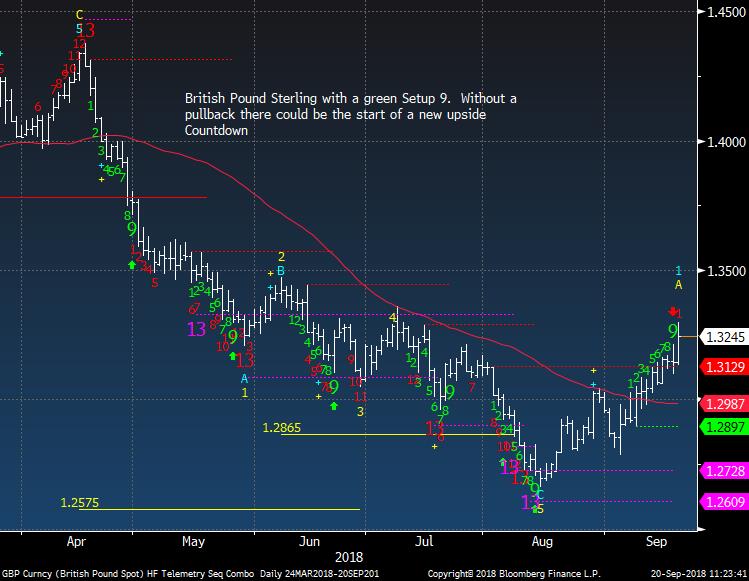
British Pound should pullback into wave 2 of 5 up but wave 1 up could continue. Watch tomorrow and Monday
|
|
|
|
|
|
|
|
|
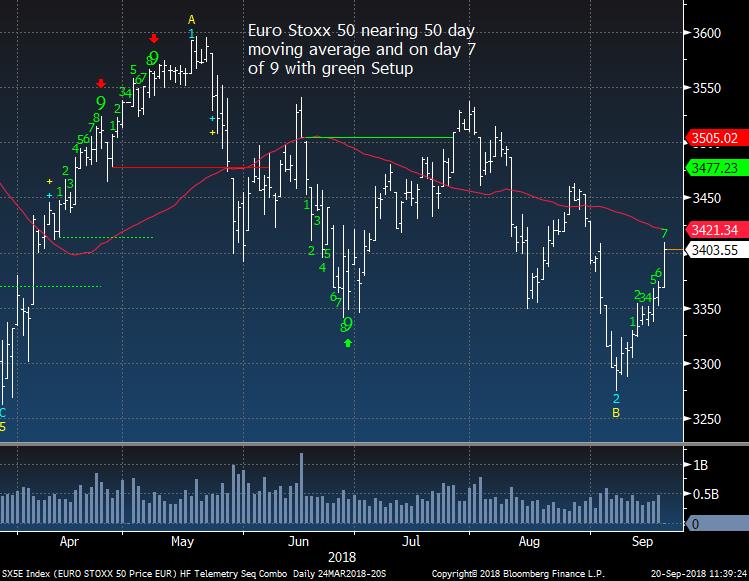
Euro Stoxx 50 will it make another lower high?
|
|
|
|
|
|
|
|
|
|
|
|
|
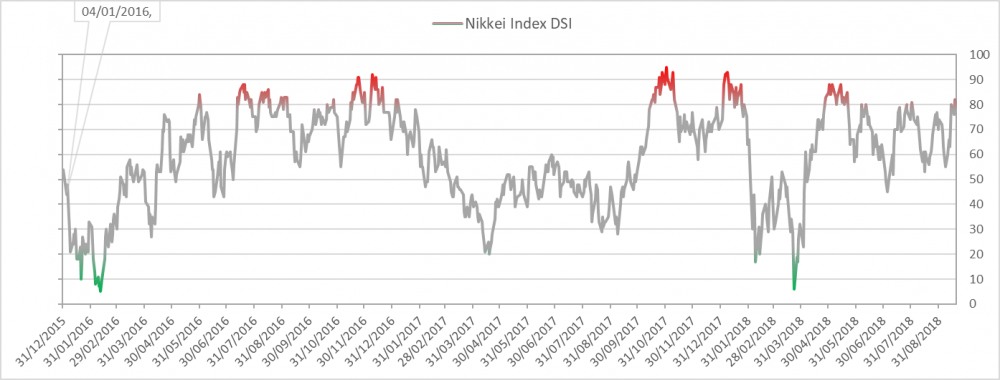
Nikkei bullish sentiment is at 79%
|
|
|
|
|
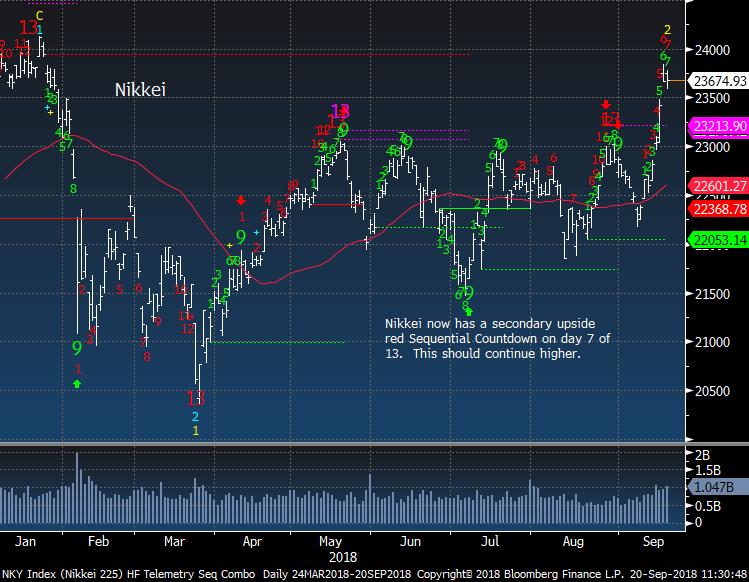
Nikkei still has potential but might pullback for a day or two before going higher
|
|
|
|
|
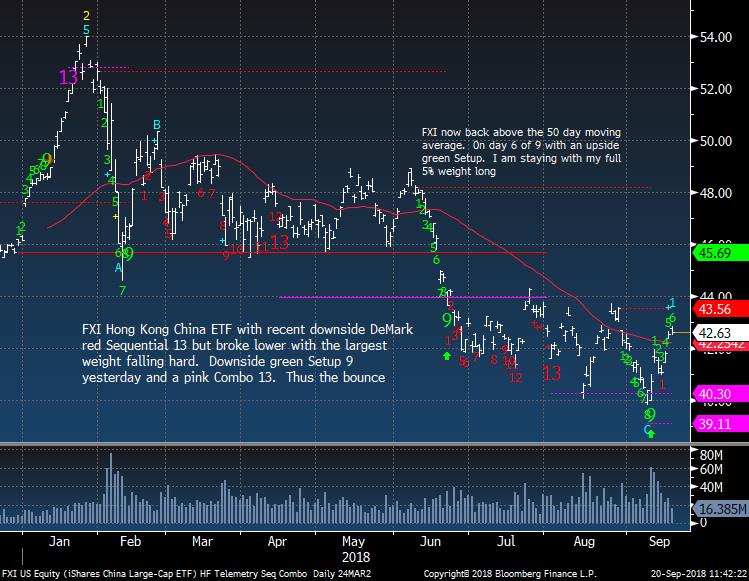
FXI still looks like it's bottoming
|
|
|
|
|
|
|
|
|
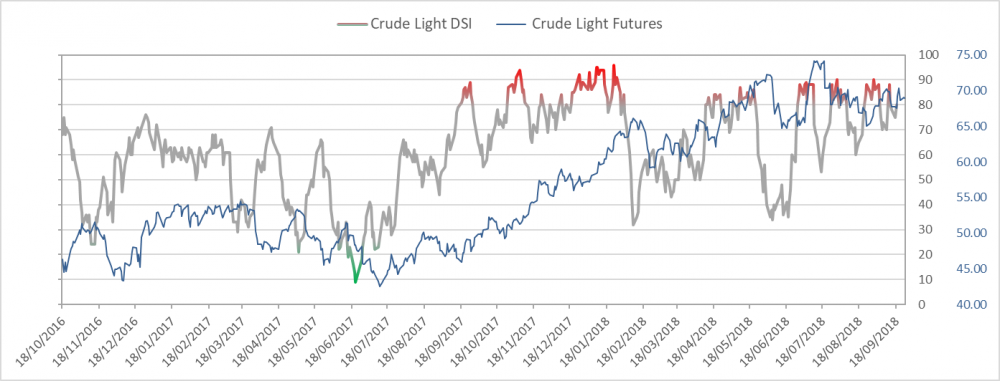
Crude bullish sentiment is at 86% and is extreme and could be a limiting factor for the crude long
|
|
|
|
|
Crude still looks OK on the long side despite the stall
|
|
|
|
|
|
|
|
|
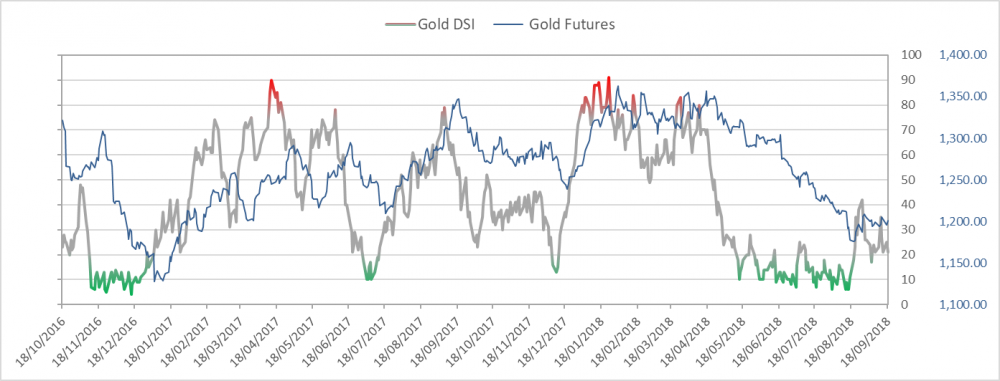
Gold bullish sentiment is at 26%
|
|
|
|
|
|
|
|
|
|
|
|
|
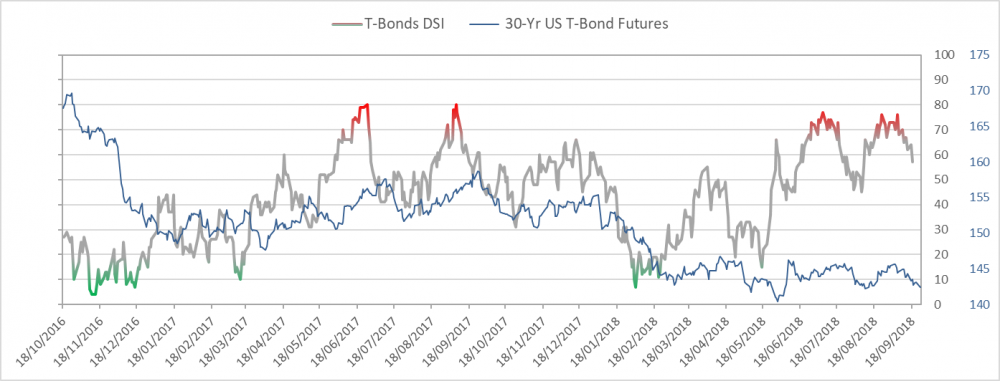
Bond bullish sentiment is at 53% and continues to drop while yields are increasing. I still see weaker bonds and higher yields
|
|
|
|
|
|
|
|
|
|
|
|
|
|
|
DEMARK SCREENS - Daily, Weekly, Monthly Upside/Downside Exhaustion Signals
|
|
|
Daily/Weekly DeMark upside/downside exhaustion signals (Sequential) weekly updated on Monday's and monthly on the first day of the new month. Price flips occur when a stock closes higher/lower than four previous closes and increases conviction of a price turn.
The upside 13's are sell signals and downside 13's are buy signals. Price flip's are confirmation signals that increases potential for a price trend change. For example, if you are long a stock and there is an upside 13, you will want to take cautious action by selling down or out of a position. If initiating a short sale with the upside 13's, we tend to start with a 1/2 size and add with the downside price flip. The opposite is true for when there are downside 13's. Take a 1/2 size position
and add with the upside price flip. The DeMark Indicators are designed to assist the user with buying into weakness and selling into strength to anticipate trend exhaustion. Selling into a rally and buying into a decline often afford the opportunity to exit a trade without too serious a loss if wrong.
S&P 500 Universe:
DAILY UPSIDE 13: AIV, CAH, EVHC, GT, KSU, LLY, RCL, SNA, UNP, WMT
DAILY DOWNSIDE 13: NONE
DAILY UPSIDE WITH PRICE FLIP REVERSAL DOWN: AIV, AVB, EFX, EQR, LLY, MDLZ, PEP, RSG, TMO, UAL
DAILY DOWNSIDE WITH PRICE FLIP REVERSAL UP: FITB, ZION
Updated: 9/17/18
WEEKLY UPSIDE 13: COST, EFX, HON, IR, JWN, LOW, RCL
WEEKLY DOWNSIDE 13: BHGE
Updated: 9/4/18
MONTHLY UPSIDE 13: AFG, AJG, AMD, CBT, CECO, EIG, IR, MAA, MRCY, MSA, MSFT, NSC, ORI, ROK, TDY, TTWO, UNT, UNP, WCG, WTR
MONTHLY DOWNSIDE 13: FTR, RRD, SMCI, SSI
Euro Stoxx 600 Universe:
DAILY UPSIDE 13: SPX LN, TRYG DC
DAILY DOWNSIDE 13: GET FP, NXT LN, VIE FP
DAILY UPSIDE WITH PRICE FLIP REVERSAL DOWN: CAST SS, COLR BB, DNB NO FABG SS
DAILY DOWNSIDE WITH PRICE FLIP REVERSAL UP: BAB LN, RUI FP
Updated: 9/17/18
WEEKLY UPSIDE 13: NONE
WEEKLY DOWNSIDE 13: DIA SM, EOAN GR, INGA NA
Updated: 9/4/18
MONTHLY UPSIDE 13: ACKB BB, GALP PL, IPN FP, KOMB CP, MTX GR, UCB BB
MONTHLY DOWNSIDE 13: ALPHA GA, BARC LN, TL5 SM
|
|
|
Unsubscribe me from Hedge Fund Telemetry
Hedge Fund Telemetry LLC, P.O. Box 4675, Greenwich, CT 06861, United States
CONFIDENTIALITY NOTE and DISCLAIMER: This message is for the named person's use only. It may contain confidential, proprietary or legally privileged material. No confidentiality or privilege is waived by any accidental or unintentional transmission. If you receive this message in error, please immediately delete it and all copies of it from your system, destroy any hard copies and notify the sender. You must not, directly or indirectly, use, disclose,
distribute, print or copy any part of this message if you are not the intended recipient. Hedge Fund Telemetry LLC. cannot guarantee the confidentiality of the material transmitted; therefore, information of a sensitive or confidential nature should not be transmitted. There is risk in trading markets. Hedge Fund Telemetry LLC reports are based on information gathered from various sources and believed to be reliable, but are not guaranteed as to accuracy and completeness. The information is subject to change without notice and Hedge Fund Telemetry LLC has no obligation to provide any updates or changes. Hedge Fund Telemetry LLC is providing this data for informational and educational purposes and does not believe that it is sufficient to base an investment decision on. This information should not be regarded as a solicitation or recommendation of any particular security or to engage in any trading strategy. One should always check with your licensed financial
advisor to determine suitability of any investments.
|
|
|
|
|
|
|