If you are having difficulty seeing this email, you can view in your browser or click here to
print.
|
|
|
|
|
04/19/2024
Thomas Thornton
info@hedgefundtelemetry.com
|
|
|
Divergences and narrow attribution should concern the bulls
|
|
|
Back in January, I heard many people say divergences and breadth weakness was needed to be seen ahead of any pullback. Now that these are starting to become clear, the same people see no risk in the markets. The Nasdaq 100 has had narrow attribution problems in the past ahead of important pullbacks seen notably in 2000, 2007, and now 2018. The YTD attribution has become very narrow with 7 stocks attributing 70% of the gain and from the lows 4 stocks
attributed 50% of the gain. The FANG stocks only pulled back to the 50 day vs other indexes which pulled back further to the 200 day. I highlighted this at the time and it was a sure sign of strong relative strength. The equal weight FANG stocks are up 19% YTD vs 3% for the S&P. The FANG+ Index has a daily upside exhaustion signal today as well has a monthly upside signal in February. When I see multiple time frames it gives me an increase in my conviction.
Some of the divergences that are showing I'm watching, besides every index and sector still a fair amount off the highs, are new 20 day highs or 52 week highs showing any signs of life, and the advance decline data not confirming new highs in the future. The percentage of NYSE stocks above the 200 day is currently at 56% up from 43% on 2/9 but still below the 70% level in January. European indexes also despite making a 3 week high today still look vulnerable to further
downside.
On late Friday, I tweeted out I added more index ETF puts (between the 3 just 2.5% combined notional exposure). April expiration SPY 269's, QQQ 163's, IMW 151's. It honestly doesn't feel wonderful seeing the QQQ continue to lift but the IWM is flat on the day and if I was bullish, I would like to see breadth within the Russell expand during a risk on market. I've given myself some time and my exposure is limited to just 2.5%. Tomorrow has new Fed Chair Powell speaking in front of Congress and it's going to be interesting to see the market reaction.
Notable:
- Nasdaq 100 Focus - Attribution, FANG + Index
- Europe - Still looks vulnerable
- Advance Decline - Current market and what it looked like in past market tops
- Lumber Update
- Bonds - Showing a little life with the 2 year and 10 year
- DeMark Screens
|
|
|
|
|
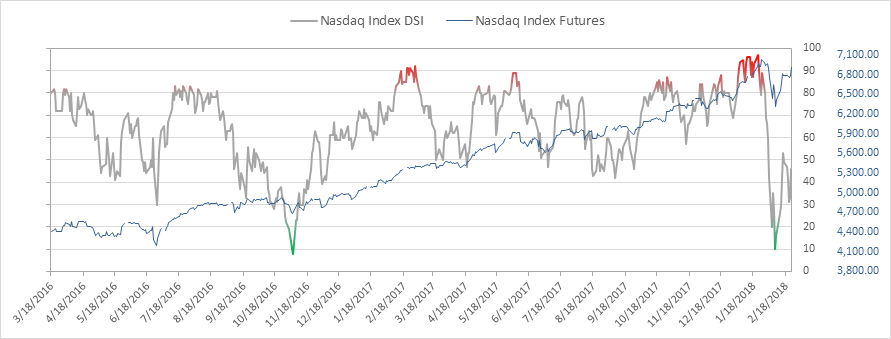
Nasdaq bullish sentiment is at 46% up from 33% from Thursday. I expect this to move above 50% later today
|
|
|
|
|
|
|
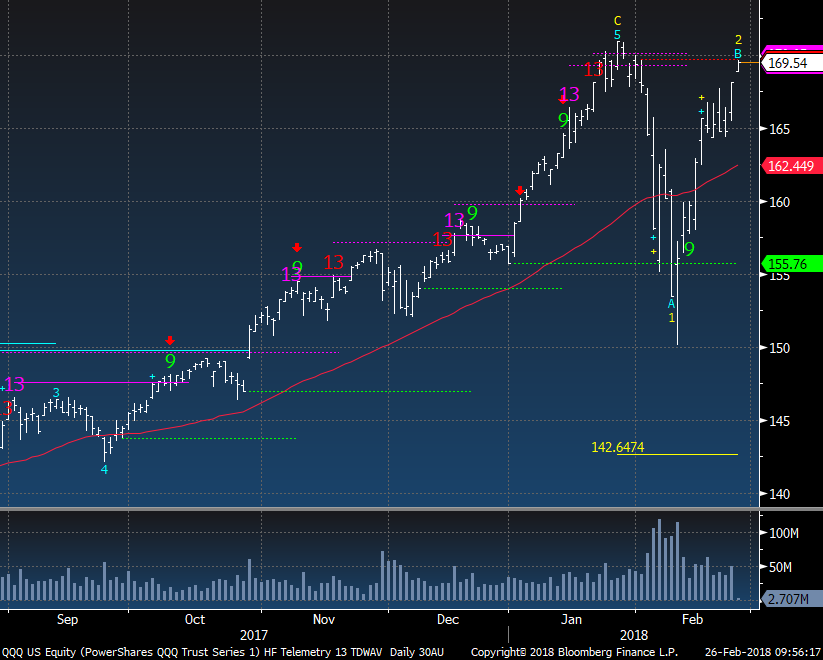
QQQ daily has a wave pattern still intact yet if this move to a new closing high the downside 1/A will revert back to the upside wave 5. This doesn't mean it can't go down again or it's suddenly bullish. If there was a larger washout like February 16 when sentiment hit 4% and there was a downside DeMark exhaustion on nearly every index and then breadth on the move up expanded, I'd be bullish but with narrow attribution of just the biggest weights doing most of the work, I'm skeptical.
|
|
|
|
|
|
|
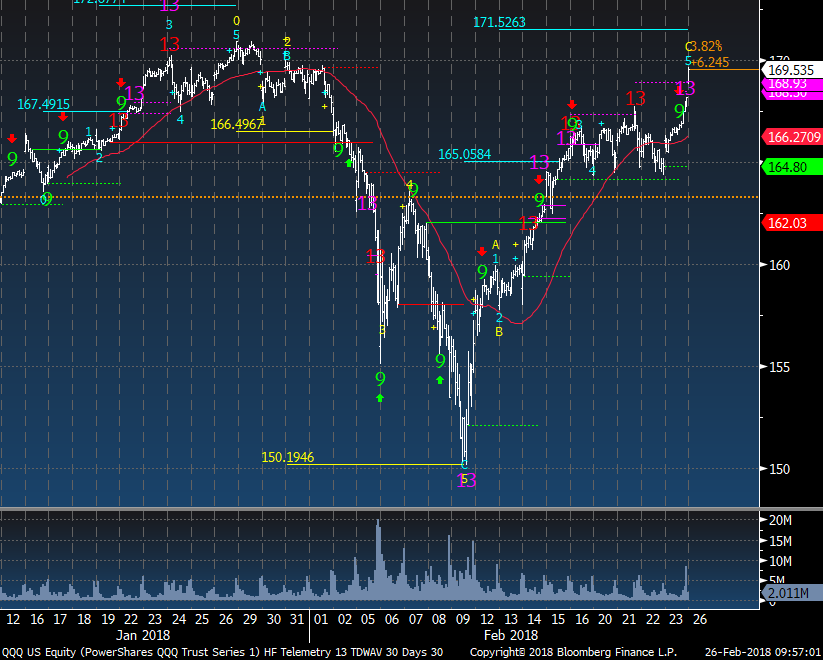
QQQ on a 30 minute time frame is helpful when looking back to January and the low in February knowing now this is in wave 5 on a shorter time period.
|
|
|
|
|
|
|
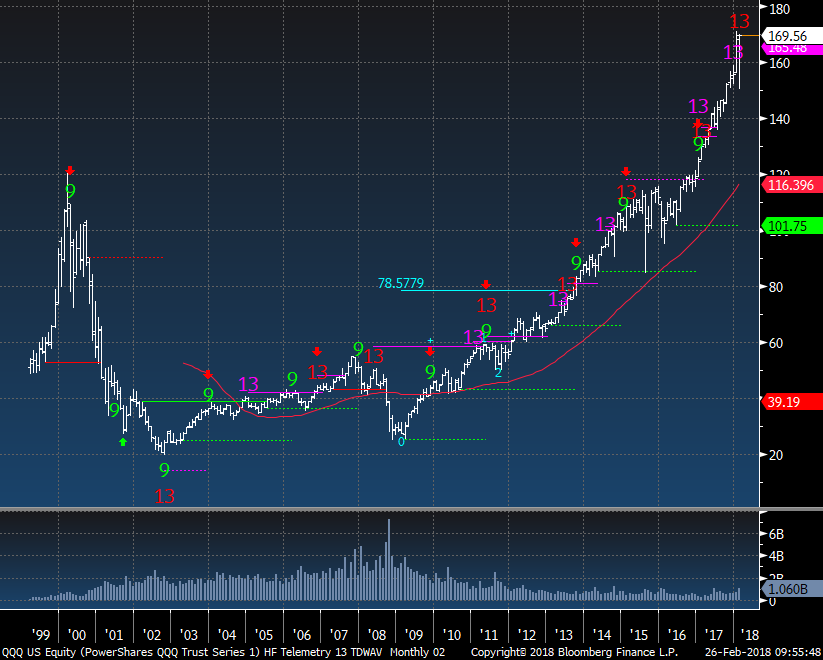
QQQ on a monthly chart as a reminder did have an upside exhaustion signal in February, following the S&P which did the same in December.
|
|
|
|
|
|
|
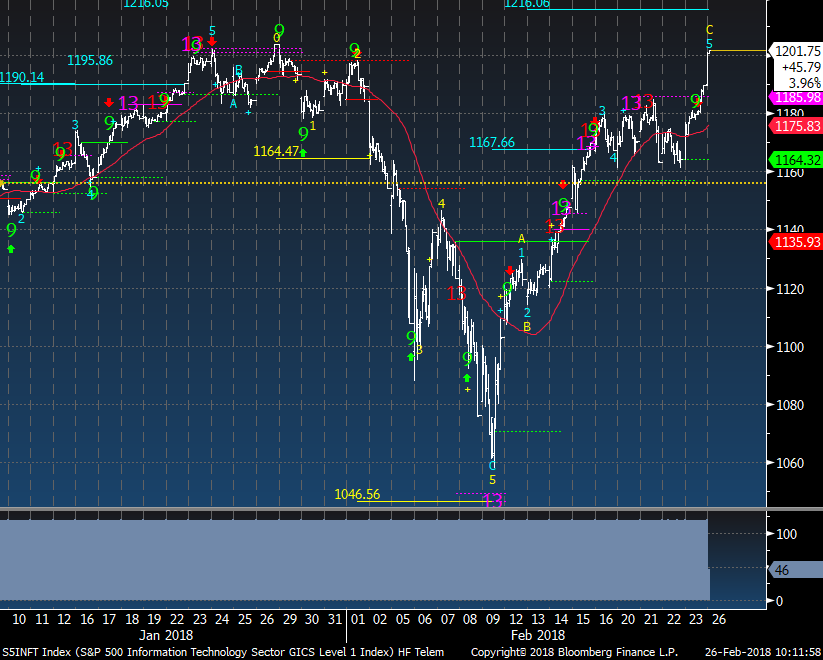
| Tech sector index same story and this is weighted heavily with the usual suspects AAPL, MSFT (it had an upside exhaustion on daily Friday), GOOGL, NVDA, INTC, CSCO etc
|
|
|
|
|
|
|
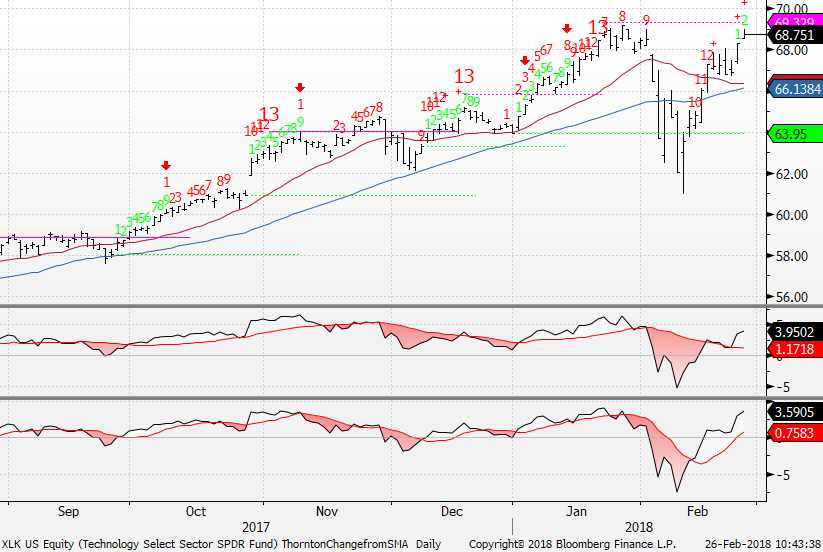
XLK tech ETF is nearing an upside exhaustion BUT it would have to make a new high above the 8th red bar. So when everyone is saying "breakout" you'll know it's exhausting on the upside
|
|
|
|
|
|
|
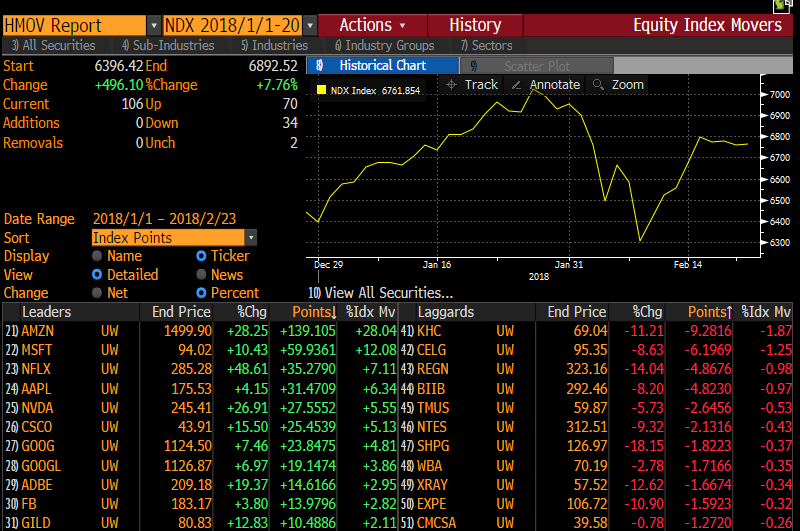
Here's the NDX attribution YTD and you can see the attribution by percentage showing AMZN, MSFT, NFLX, AAPL, NVDA, CSCO and GOOG adding up to 70% of the gain this year.
|
|
|
|
|
|
|
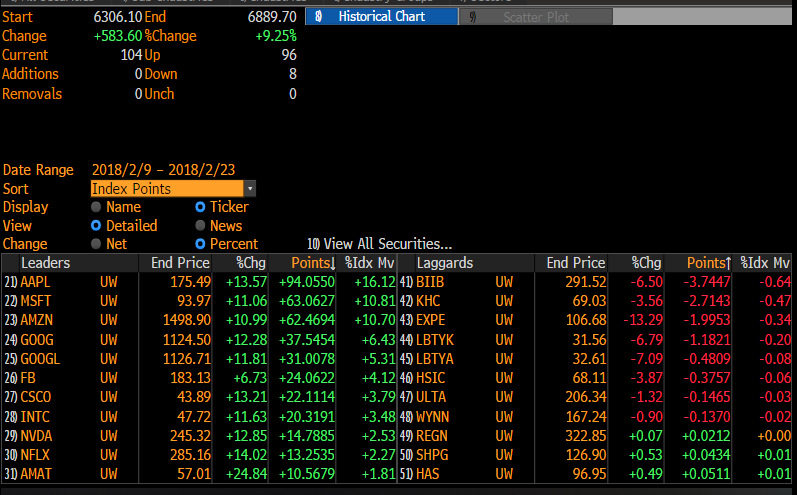
The gains since 2/9 low show 4 companies doing 50% of the attribution.
|
|
|
|
|
|
|
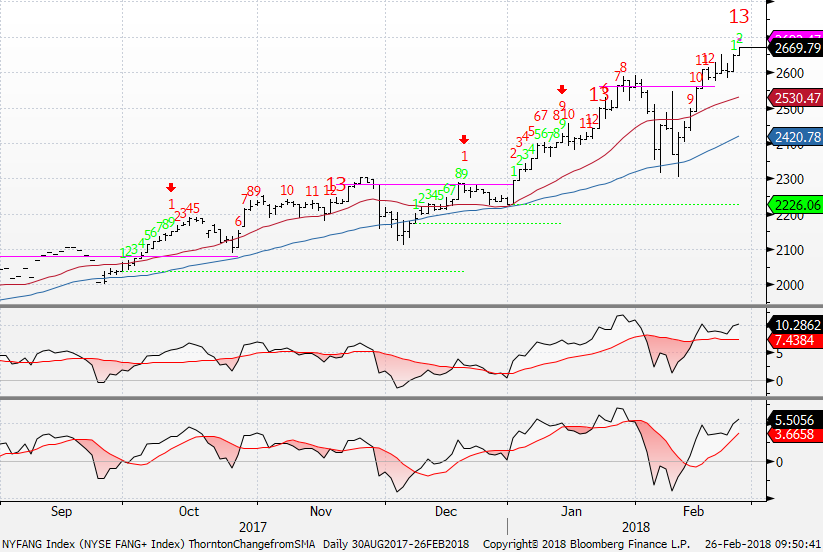
FANG + Index only pulled back to the 50 day (blue line) on the correction which was a sign of relative strength. People tend to hold winners in the early stages of bear markets and puke them at final low. There's a new daily upside exhaustion Countdown red 13 signal today.
|
|
|
|
|
|
|
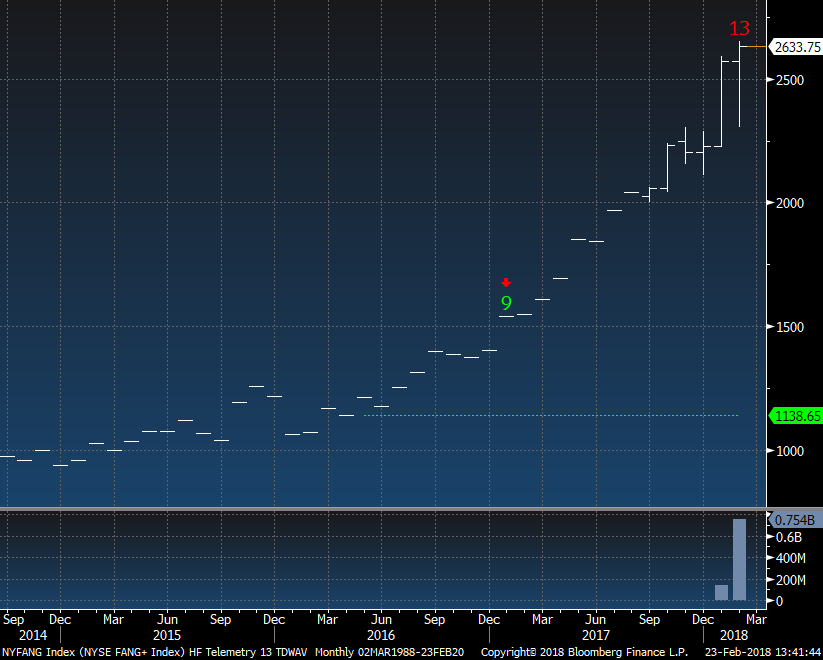
FANG + on a monthly time frame has an upside exhaustion red 13 Countdown this month.
|
|
|
|
|
|
|
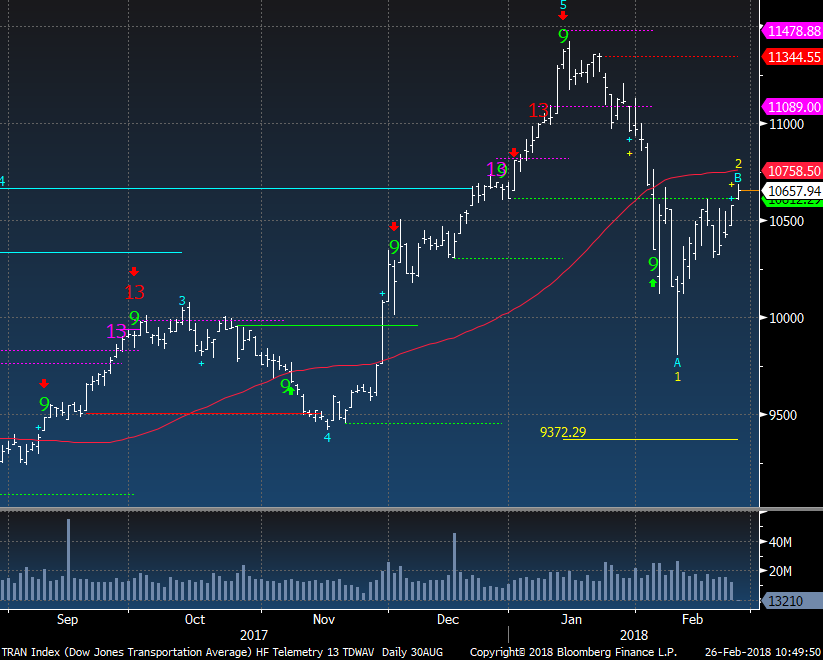
Former strong sectors not confirming the strength
|
|
|
Transports are well off old highs and the bounce remains under the 50 day moving average.
|
|
|
|
|
|
|
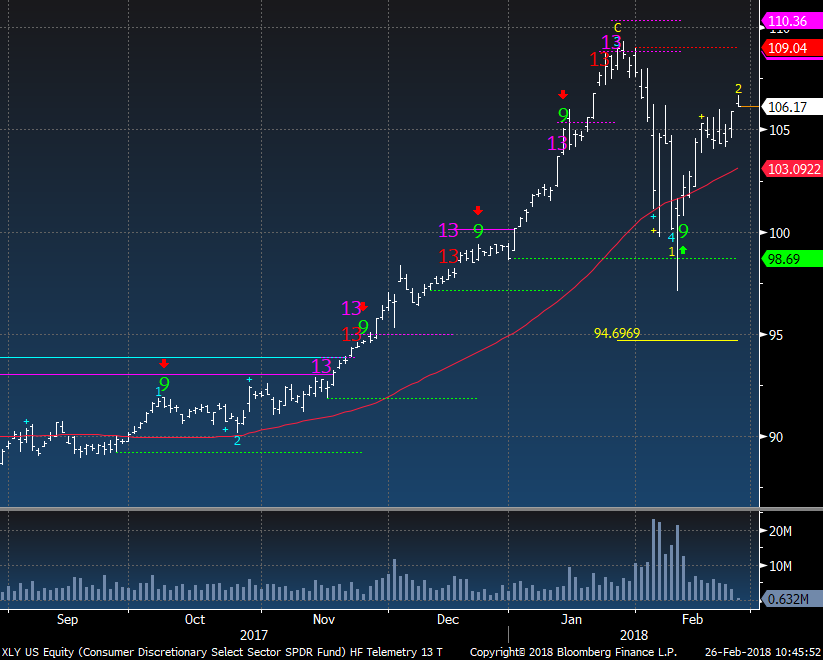
Consumer Discretionary XLY ETF is above the 50 day but still below the all time highs. NFLX is 27% above the 50 day and AMZN is 17% above the 50 day vs the XLY which is 3.5% above the 50 day. AMZN is 20% of the XLY weight while the next largest weight is HD at 7%.
|
|
|
|
|
|
|
|
|
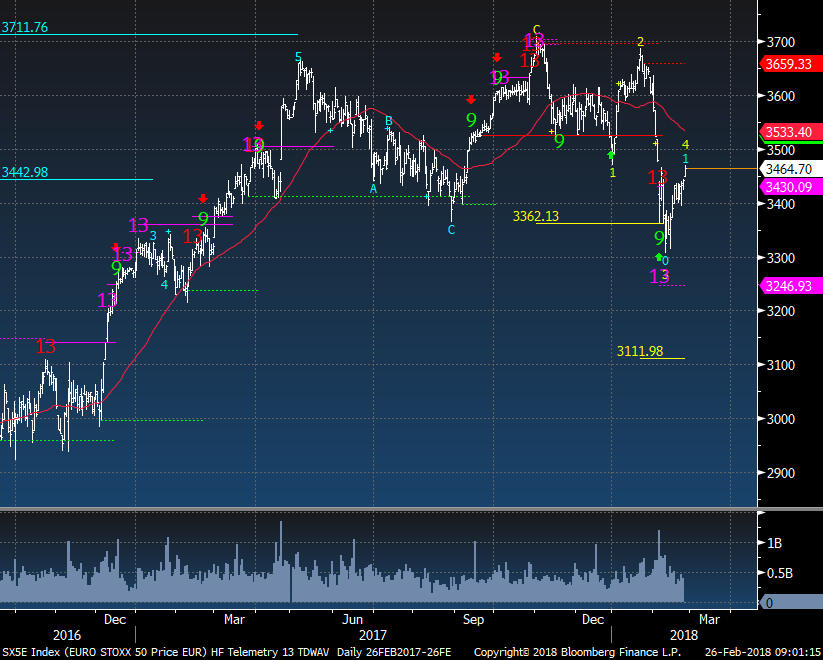
Euro Stoxx 50 has bounced off a recent low but still looks like a top is in progress
|
|
|
|
|
|
|
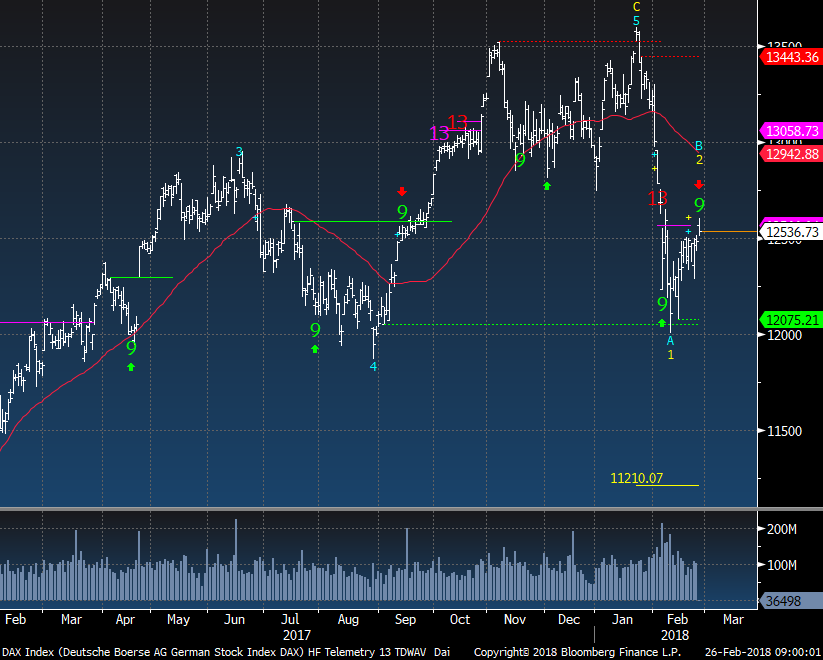
German DAX has a green Setup 9 today on the upside and is also well under the downward sloping 50 day moving average. A wave 3 downside price objective is at 11,210
|
|
|
|
|
|
|
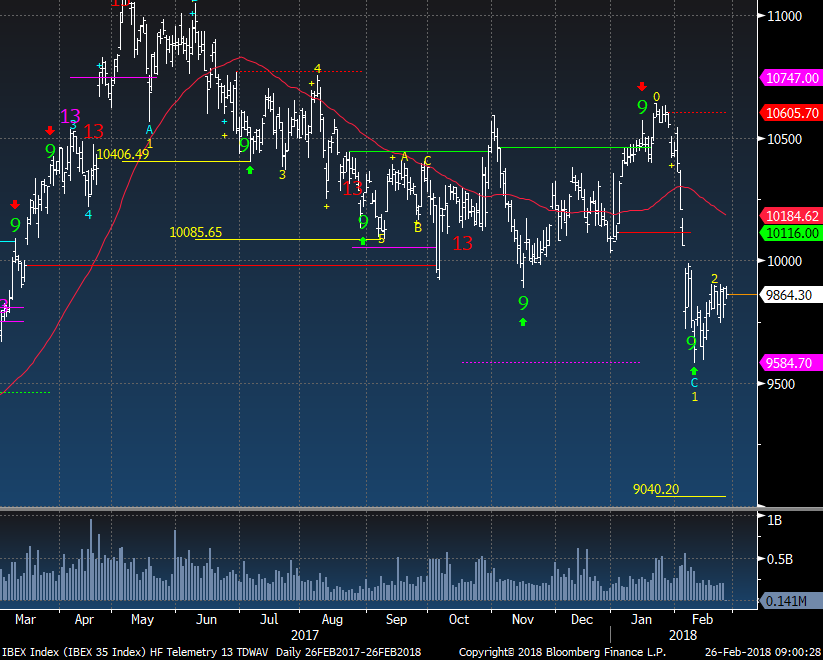
Spain IBEX also looks vulnerable to more downside.
|
|
|
|
|
|
|
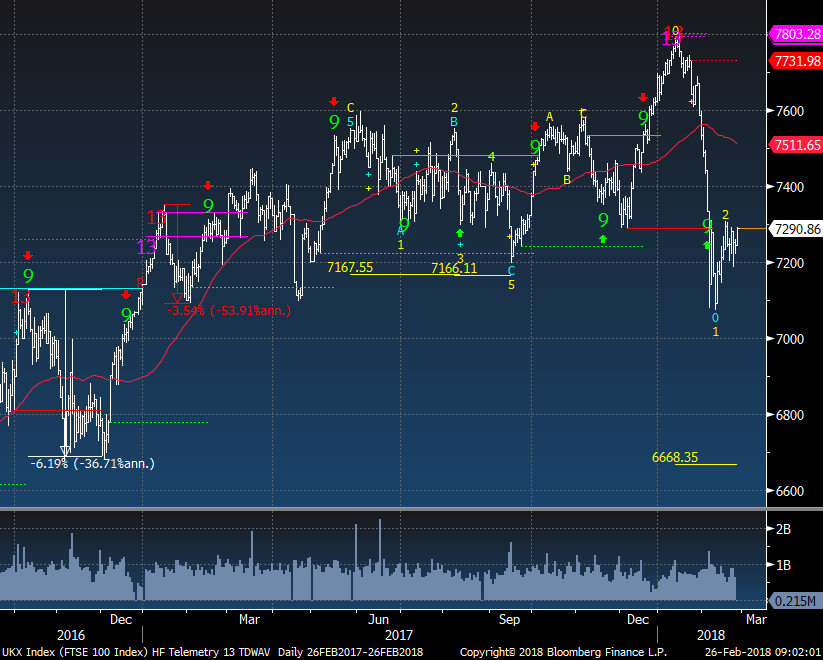
UK FTSE 100 has also bounced and is well under the 50 day
|
|
|
|
|
|
|
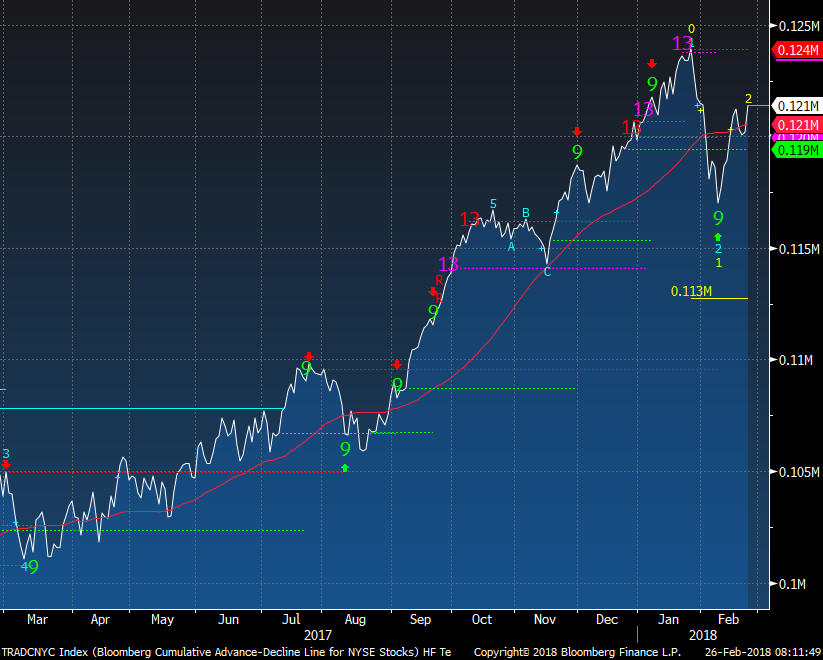
Advanced Decline - Current market and past markets
|
|
|
Here's the current market with the advance decline still below the recent January highs. This could make a lower high which is typically seen ahead of larger pullbacks. Remember the wave pattern which is on wave 2 up for the following charts
|
|
|
|
|
|
|
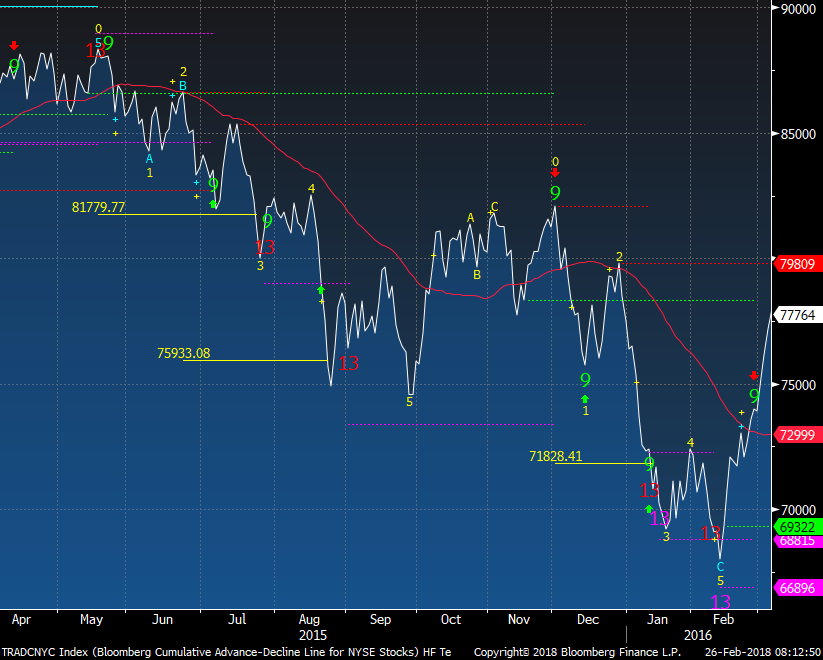
Things in 2015 started to fall apart after Q1 making a series of lower lows and lower highs.
|
|
|
|
|
|
|
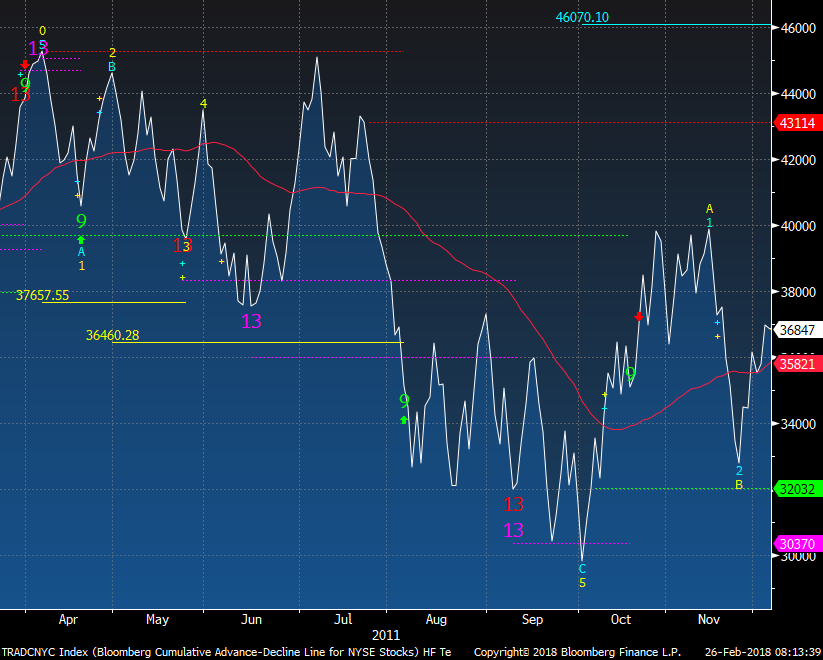
Back in 2011 it also peaked in April. The June bounce was VICIOUS (as I was squeezed hard) and much different from what we have seen from this bounce.
|
|
|
|
|
|
|
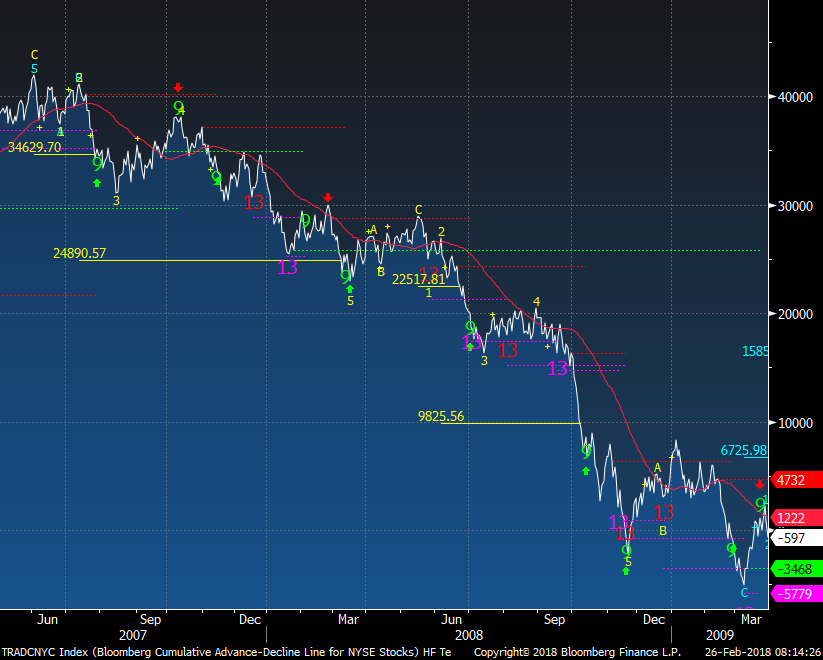
In 2007 things started to roll in June yet the "Four Horsemen of Tech" AAPL, GOOG, RIMM, and AMZN led the indexes higher into September 07 making a lower high.
|
|
|
|
|
|
|
|
|
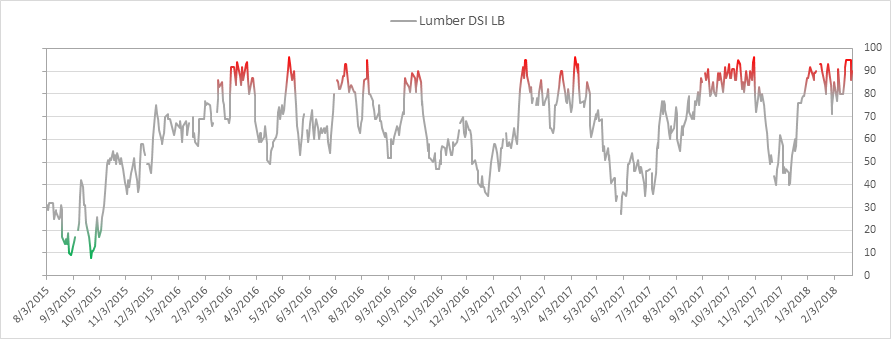
Lumber bullish sentiment is at 90% down from recent high of 95%
|
|
|
|
|
|
|
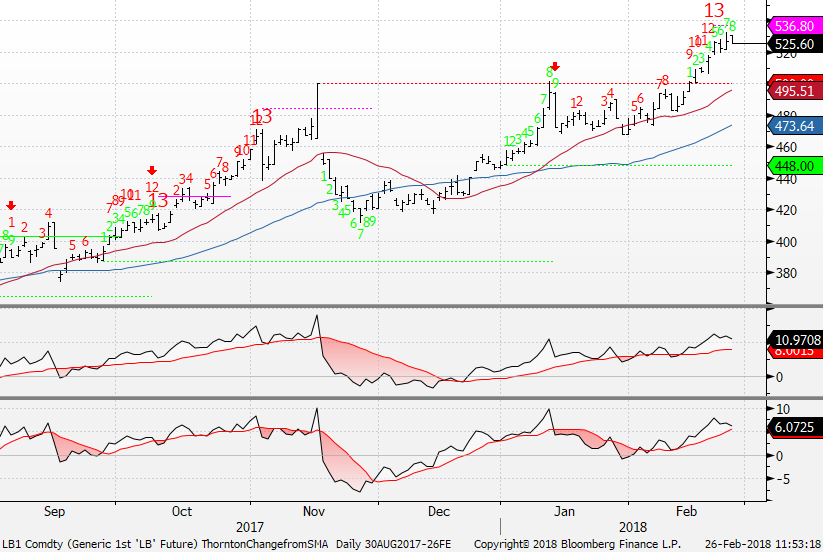
Lumber futures daily had an upside red Countdown exhaustion last week.
|
|
|
|
|
|
|
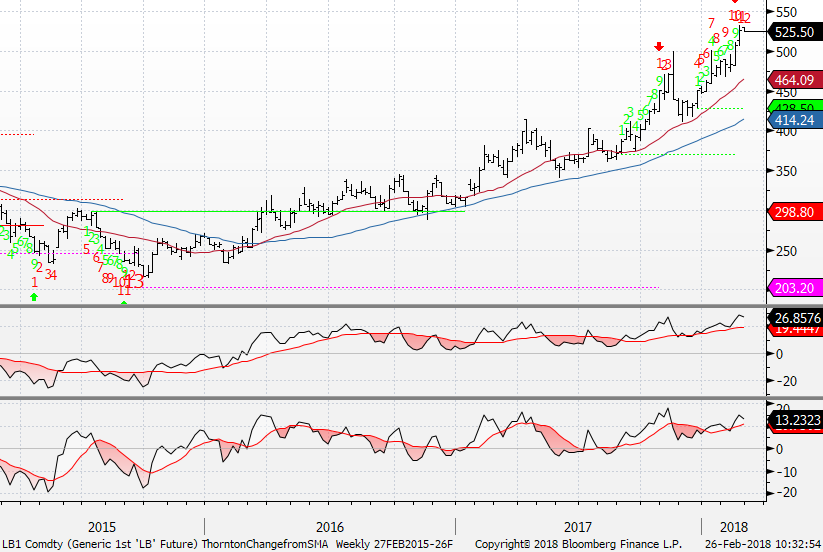
Lumber futures on a weekly time frame is on week 12/13 so perhaps next week will be a top.
|
|
|
|
|
|
|
|
|
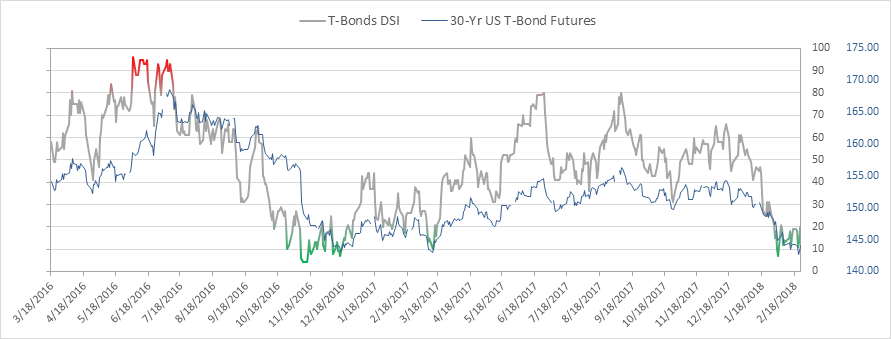
Bond bullish sentiment is at 20% increasing from a low last week of 11%.
|
|
|
|
|
|
|
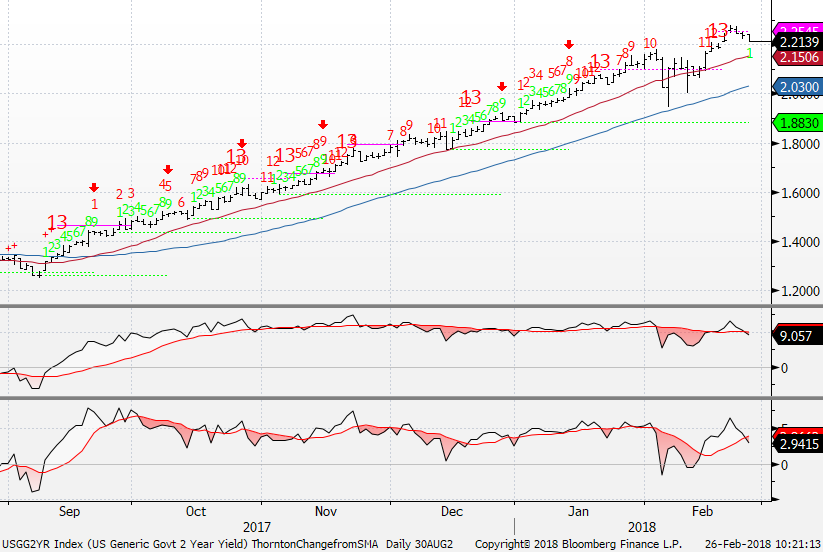
US 2 year yield has laughed at the DeMark sequential since last September but today there's a price flip down (green 1 trading lower than 4 previous closes
|
|
|
|
|
|
|
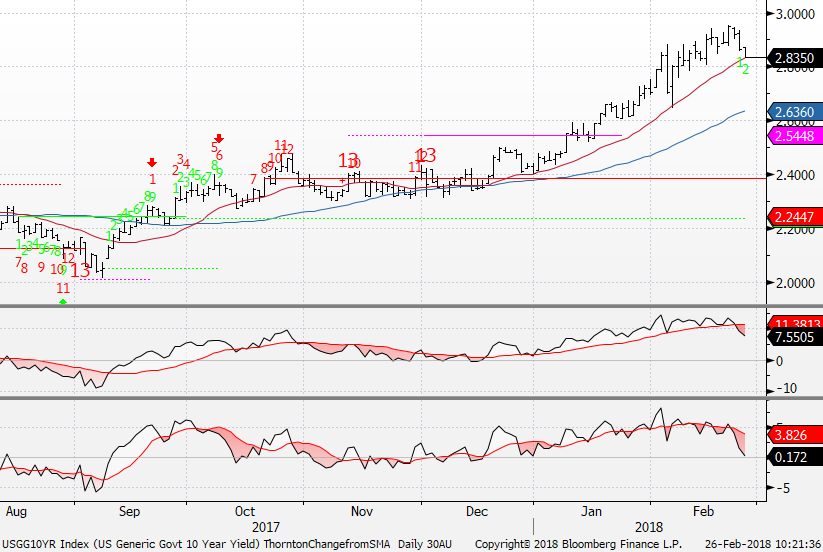
The US 10 year yield also has turned a little lower and is touching the 20 day moving average where it recently bounced off of. Let's see if this can move a little lower in the coming days, especially with Powell talking tomorrow
|
|
|
|
|
|
|
DEMARK SCREENS - Daily, Weekly, Monthly Upside/Downside Exhaustion Signals
|
|
|
Daily/Weekly DeMark upside/downside exhaustion signals (Sequential) Weekly updated on Monday's. Price flips occur when a stock closes higher/lower than four previous closes.
S&P 1500 Universe:
DAILY UPSIDE 13: FARO, FFIV, FICO, LTM, MSFT
DAILY DOWNSIDE 13: LNT, MO, WIN
DAILY UPSIDE WITH PRICE FLIP REVERSAL DOWN: CSGS, KELYA, X
DAILY DOWNSIDE WITH PRICE FLIP REVERSAL UP: EXC, MHK, SJI, WIN
Updated: 2/26/18
WEEKLY UPSIDE 13: ACN, ALLE, ATI, EBIX, EPAY, MSI, PTC, RS,
WEEKLY DOWNSIDE 13: DVN, SLCA, SPTN
Updated: 2/1/1
MONTHLY UPSIDE 13: CHD, CLGX, CLX, CNMD, DVA, FICO, IDCC, MSCI, ORLY, PAYX, TFX, VMC, XYL
MONTHLY DOWNSIDE 13: GPOR
Euro Stoxx 600 Universe:
DAILY UPSIDE 13: CBG LN, RMG LN, SOBI SS
DAILY DOWNSIDE 13: NONE
DAILY UPSIDE WITH PRICE FLIP REVERSAL DOWN: HO FP, RMG LN, UMI BB
DAILY DOWNSIDE WITH PRICE FLIP REVERSAL UP: BMPS IM
Updated: 2/26/18
WEEKLY UPSIDE 13: GLEN LN, IGG LN
WEEKLY DOWNSIDE 13: TATE LN
Updated: 2/1/18
MONTHLY UPSIDE 13: COFB BB, GAS SM, GKN LN, ING FP, KINVB SS, OML LN, VIS SM
MONTHLY DOWNSIDE 13: NONE
|
|
|
Unsubscribe me from Hedge Fund Telemetry
Hedge Fund Telemetry LLC, P.O. Box 4675, Greenwich, CT 06861, United States
CONFIDENTIALITY NOTE and DISCLAIMER: This message is for the named person's use only. It may contain confidential, proprietary or legally privileged material. No confidentiality or privilege is waived by any accidental or unintentional transmission. If you receive this message in error, please immediately delete it and all copies of it from your system, destroy any hard copies and notify the sender. You must not, directly or indirectly, use, disclose,
distribute, print or copy any part of this message if you are not the intended recipient. Hedge Fund Telemetry LLC. cannot guarantee the confidentiality of the material transmitted; therefore, information of a sensitive or confidential nature should not be transmitted. There is risk in trading markets. Hedge Fund Telemetry LLC reports are based on information gathered from various sources and believed to be reliable, but are not guaranteed as to accuracy and completeness. The information is subject to change without notice and Hedge Fund Telemetry LLC has no obligation to provide any updates or changes. Hedge Fund Telemetry LLC is providing this data for informational and educational purposes and does not believe that it is sufficient to base an investment decision on. This information should not be regarded as a solicitation or recommendation of any particular security or to engage in any trading strategy. One should always check with your licensed financial
advisor to determine suitability of any investments.
|
|
|
|
|