|
|
|
|
|
|
The Haves and the Have Nots
|
|
|
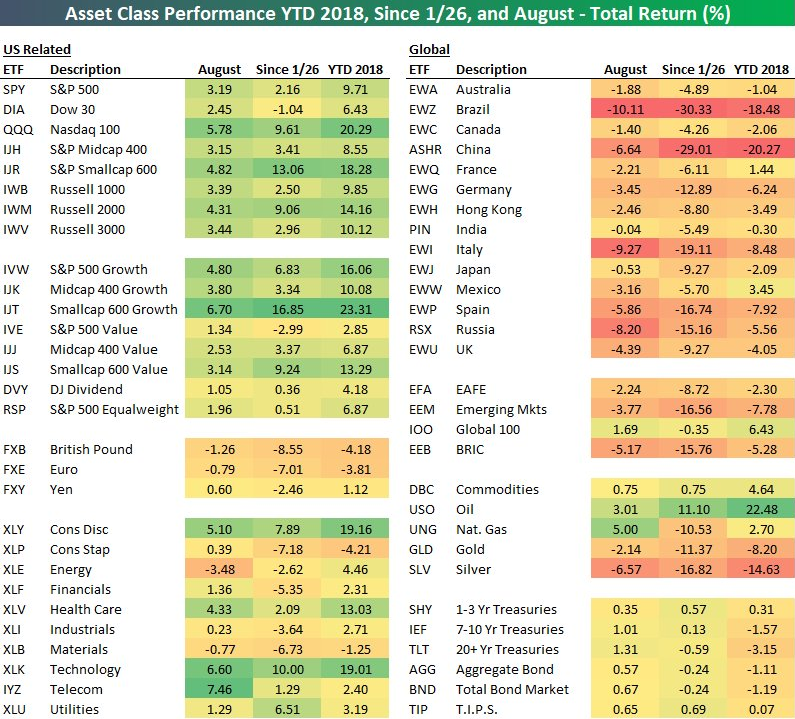
Below is an interesting chart of what markets around the world have done year to date and from the January 26th high. The chart is from Bespoke Research and it lays out the wide dispersion across markets and even within the US markets. I put it on Sunday's Week Ahead email but wanted more people to see it as the market going up hasn't been that broad with gains this year. I also added my PPO Monitor (Percentage Price Oscillator) with showing clear dispersion within the Tech and
Consumer Discretionary sectors.
I'm also going to stop here and let you get to the charts below as I'm headed into meetings and client calls for the rest of the day. New website is coming along and we are hoping to launch next week. We are really excited to be adding more sentiment charts and data with some European and Asian markets. If you have had this note forwarded to you, please be aware soon to access the note a subscriber log on will be needed. So how about signing up as a client today?
- US Markets - Sentiment remains elevated and expect a pullback starting now
- Currency Update
- Asset Class Performance
- PPO Monitors showing the Haves and the Have Nots
- S&P 500 making new highs but with less stocks making 52 week highs
- Energy Sector looks lower
- Healthcare and Biotech could be topping here
- Consumer staples buying this
pullback
- FAANG Custom Index
- Tesla, Starbucks, Amazon, Google Updates
- European Market Update - Lower highs don't bode well ahead
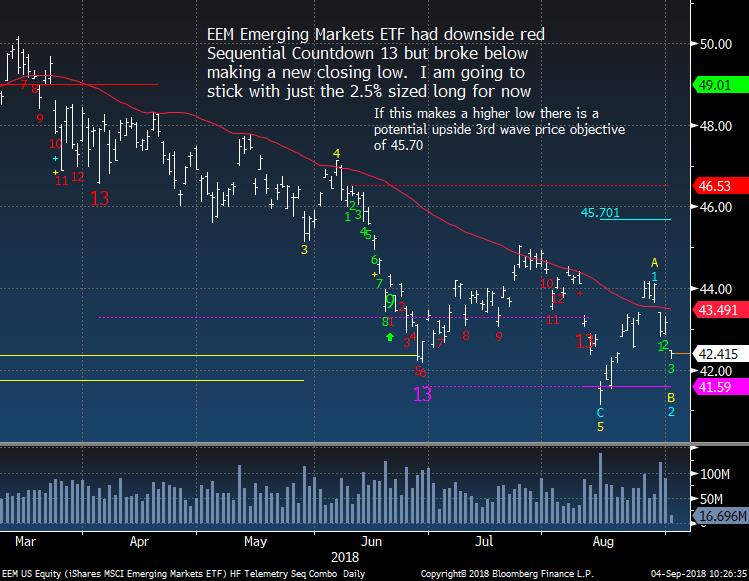
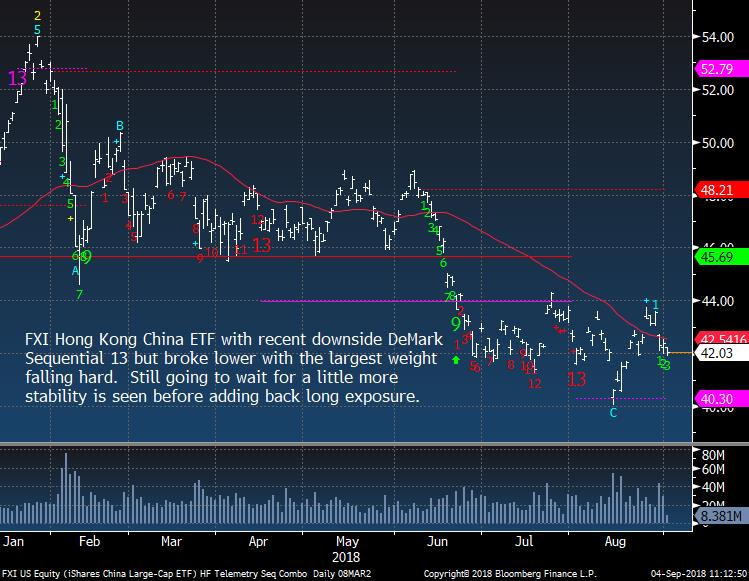
- Global Market Update - Holding EEM small long
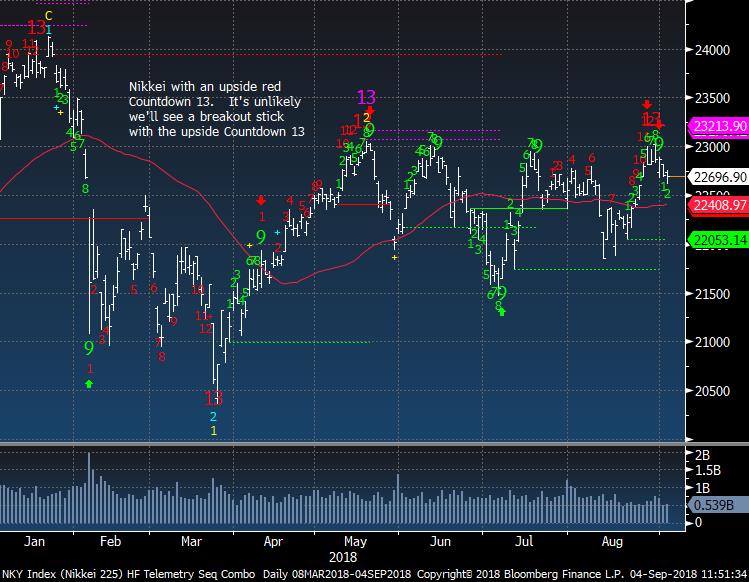
- Asian Market Update - Nikkei should work lower
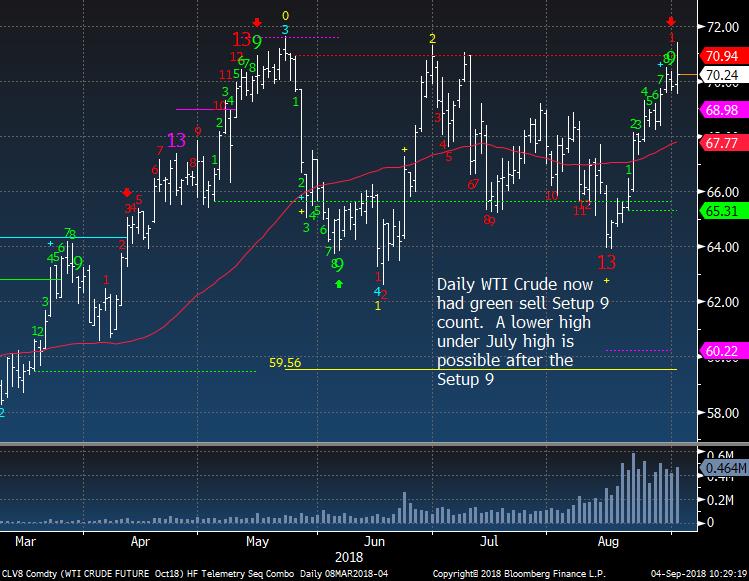
- Crude Update - Make or break levels
- Gold Update Removing my remaining long GLD
- Bond Update - Still with narrow range with COT positioning setup for a squeeze
- DeMark Screens - Daily, Weekly, Monthly upside/downside exhaustion signals within the S&P 1500 and Euro Stoxx 600 - NEW WEEKLY AND MONTHLY UPSIDE AND DOWNSIDE EXHAUSTION SIGNALS POSTED TODAY
|
|
|
|
|
Here's a link to the Hedge Fund Telemetry market sentiment page with 40 charts of sentiment including equities, bonds, currencies, and commodities updated each day.
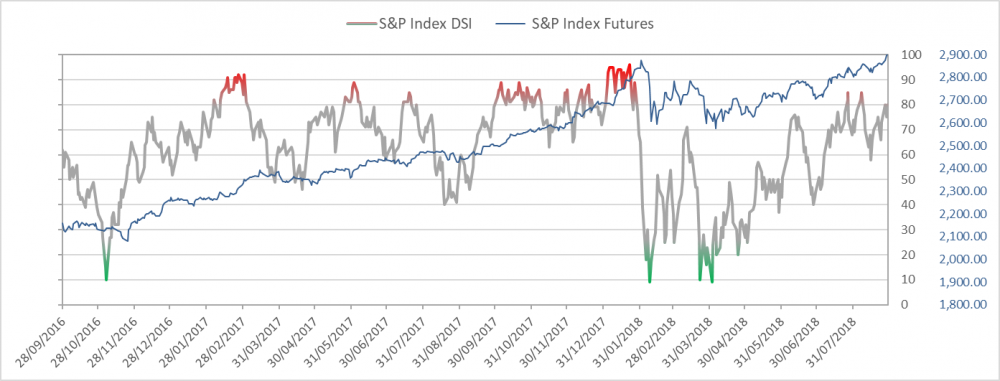
SPX bullish
sentiment is at 76% and remains elevated
|
|
|
|
|
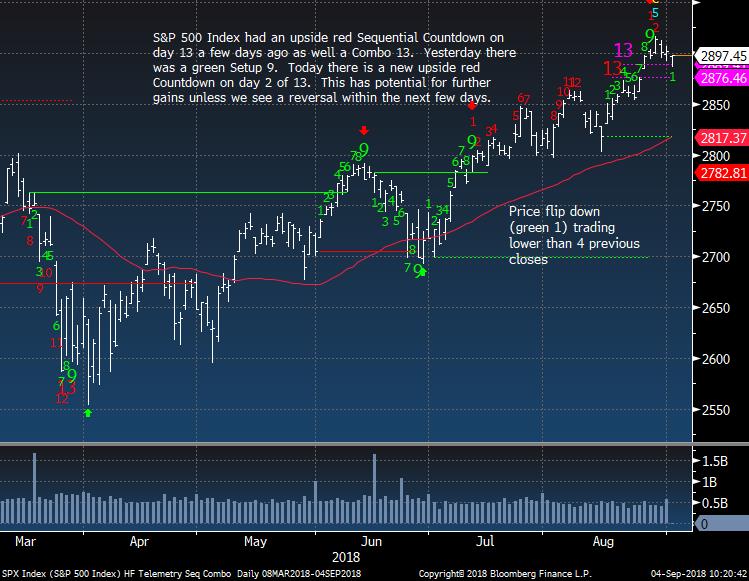
SPX daily turning over a little
|
|
|
|
|
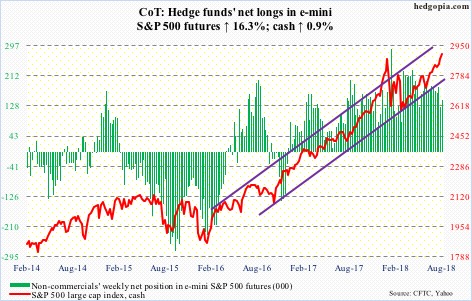
Commitment of Traders report shows an increase last week with long positioning by speculators. Still a very crowded trade
|
|
|
|
|
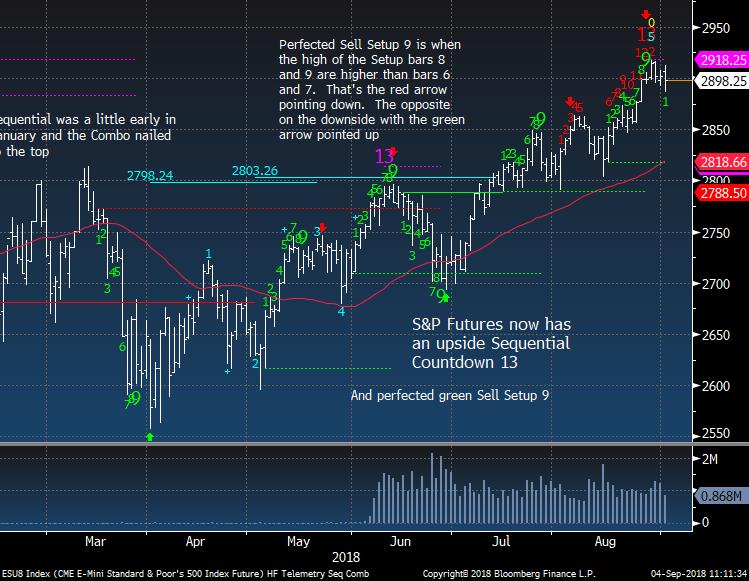
S&P EMini Futures price flip down today too
|
|
|
|
|
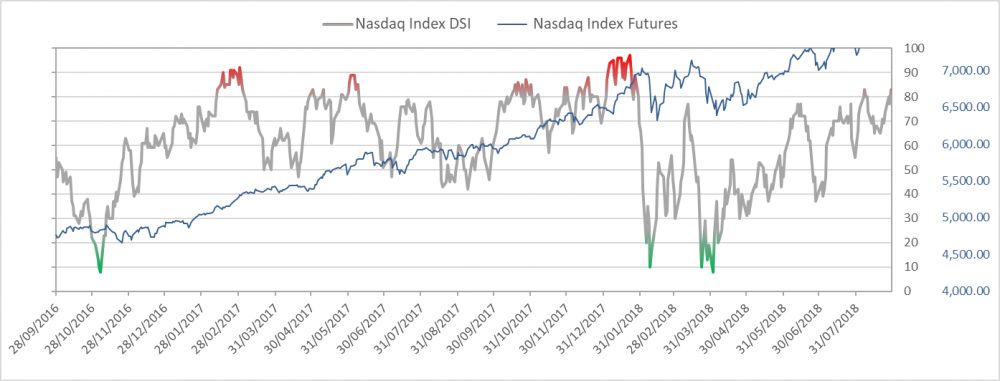
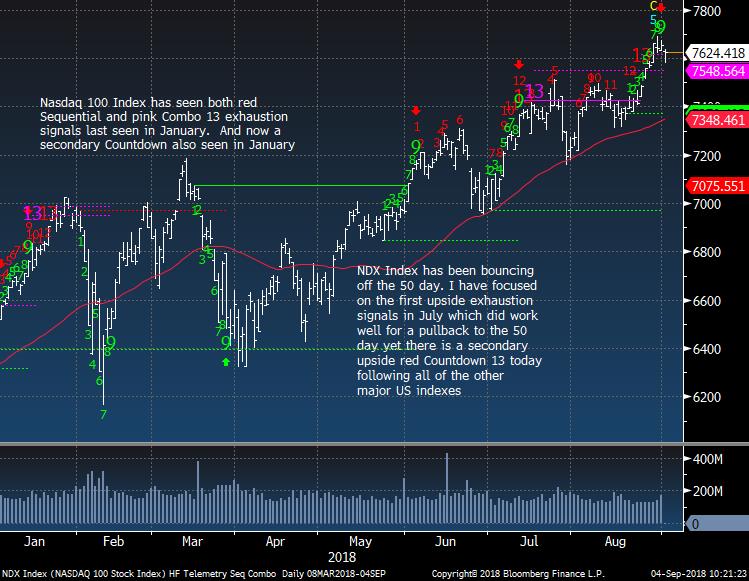
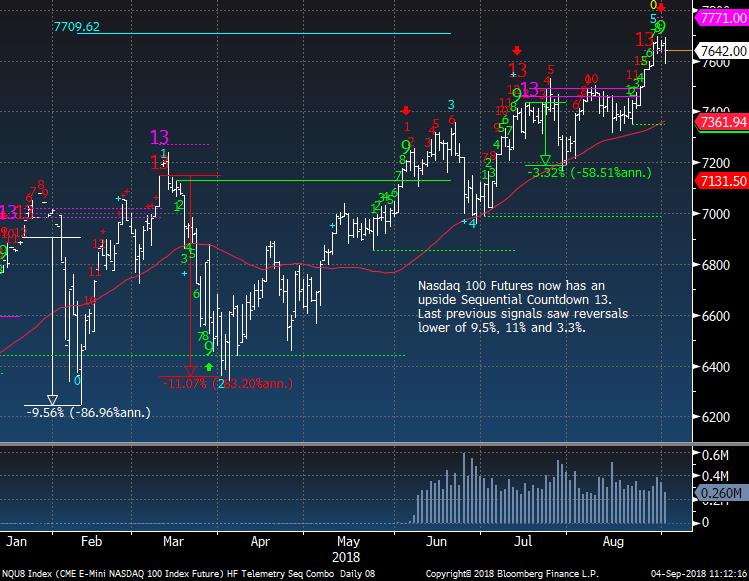
Nasdaq bullish sentiment is at 77%
|
|
|
|
|
|
|
|
|
|
|
|
|
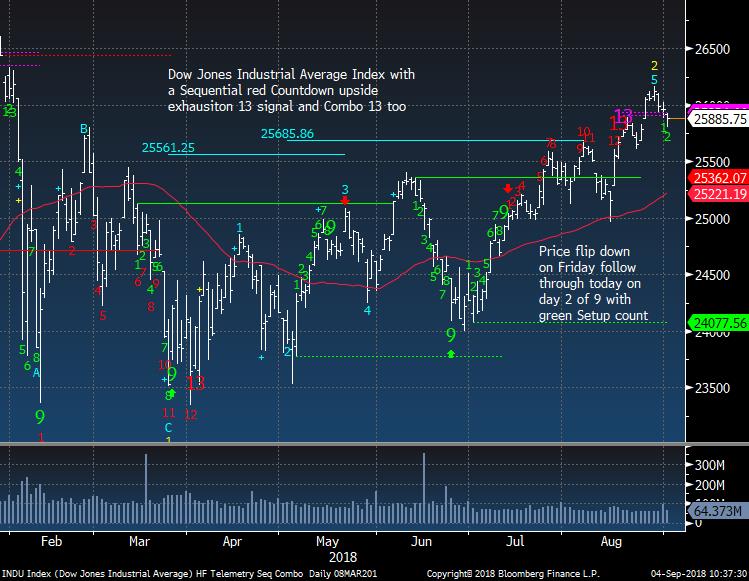
Dow Jones Industrial Average starting to slowly turn lower.
|
|
|
|
|
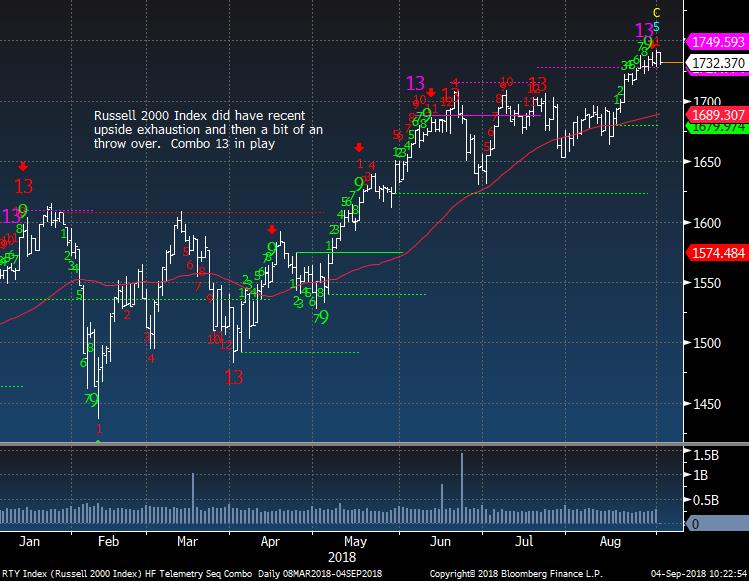
IWM Russell 2000 stalling
|
|
|
|
|
|
|
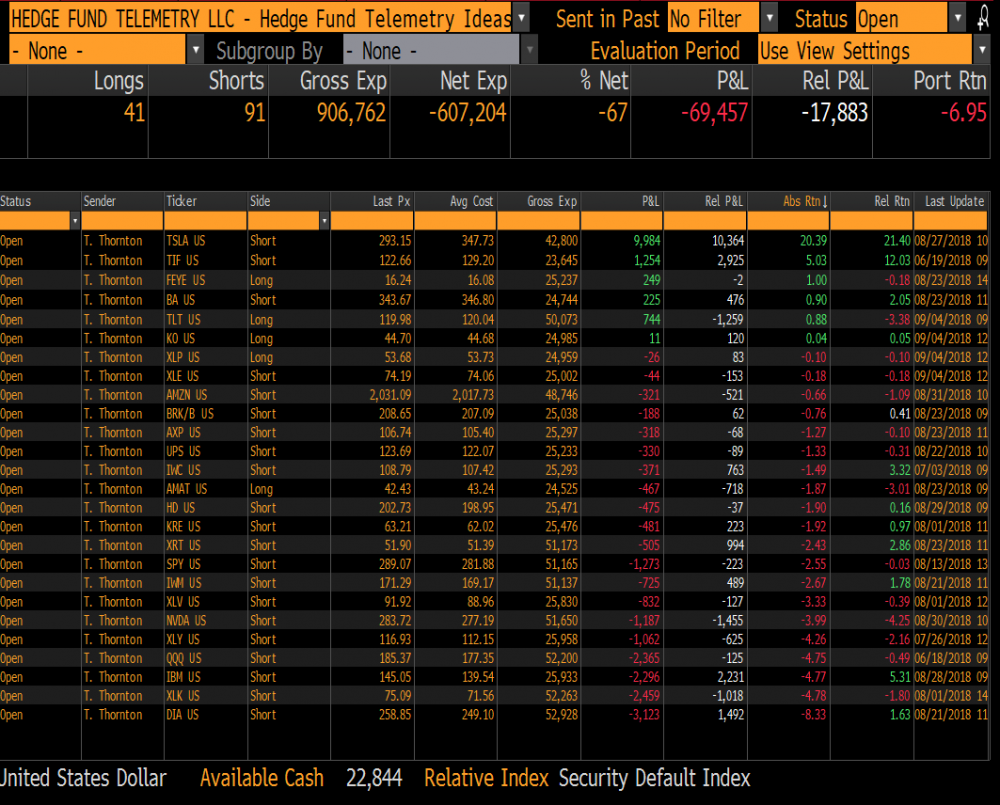
Hedge Fund Telemetry Trade Ideas
|
|
|
Trade Ideas - removed remaining GLD long. New short 2.5% size XLE, New longs 2.5% size XLP and KO. Note the XLE shows as a long on TMSG but it was input in error and now is a short
|
|
|
|
|
|
|
Asset Class Performance YTD and Since 1/26
|
|
|
Quite a lot of dispersion. I strongly believe the outperformance in the Nasdaq, tech and consumer discretionary is due to very few mega cap stocks doing the majority of the heavy lifting
|
|
|
|
|
|
|
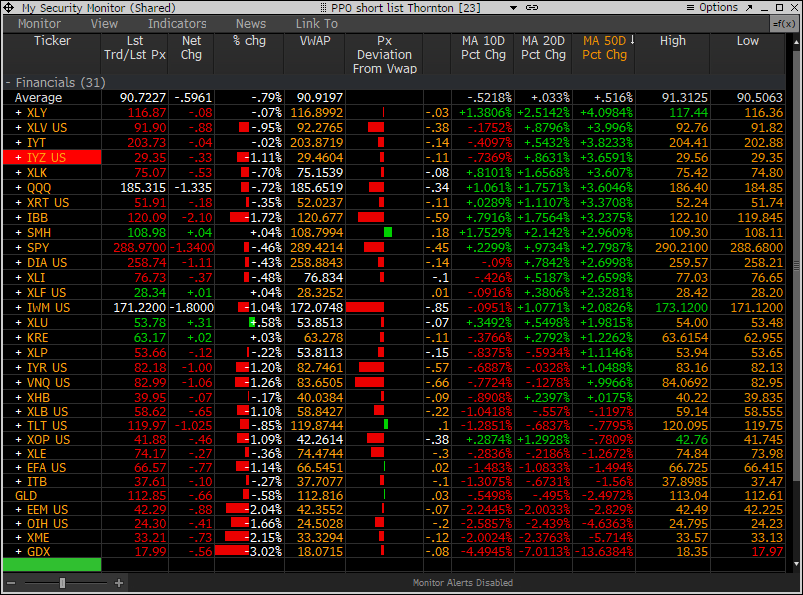
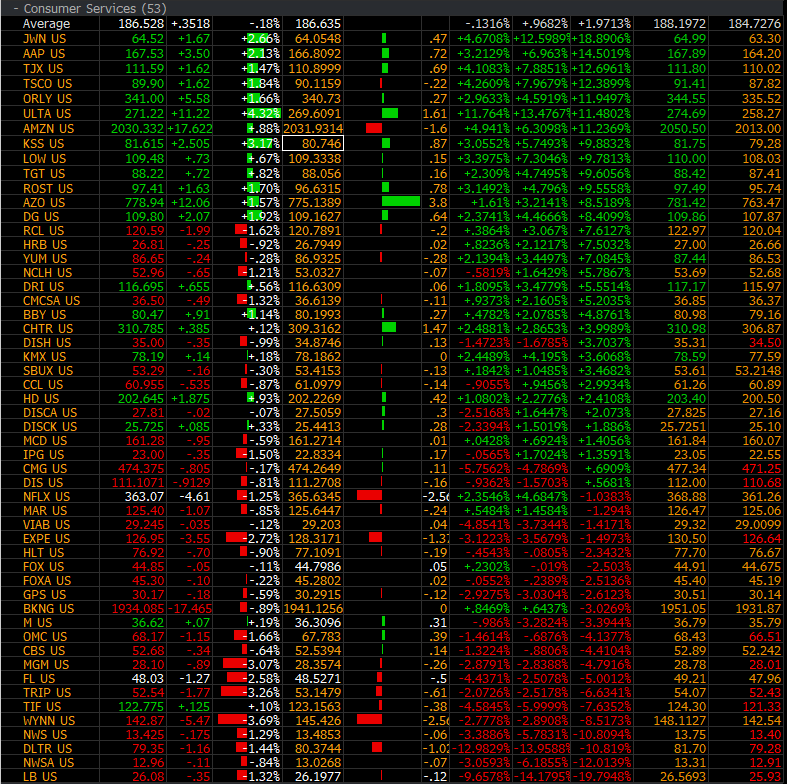
PPO Monitors - The Haves and the Have Nots
|
|
|
The PPO Monitors are available to all clients who have Bloomberg. Just let me know. This monitor force ranks sectors by % above/below the 50 day moving average. Those most above the 50 day are at the top and the opposite on the downside. It works well by watching the 10 day and 20 day readings too for reversals up or down. The markets are down today and the sectors at the highs are down less those on the bottom.
|
|
|
|
|
One of the cool things about the PPO monitor is I made it so you can open each ETF and see the components ranked in the same way. This is an even better view of those on the top being bought today and those on the bottom being sold. And on the right side there are a lot of 20 day highs in green and 20 day lows on the bottom in red
|
|
|
|
|
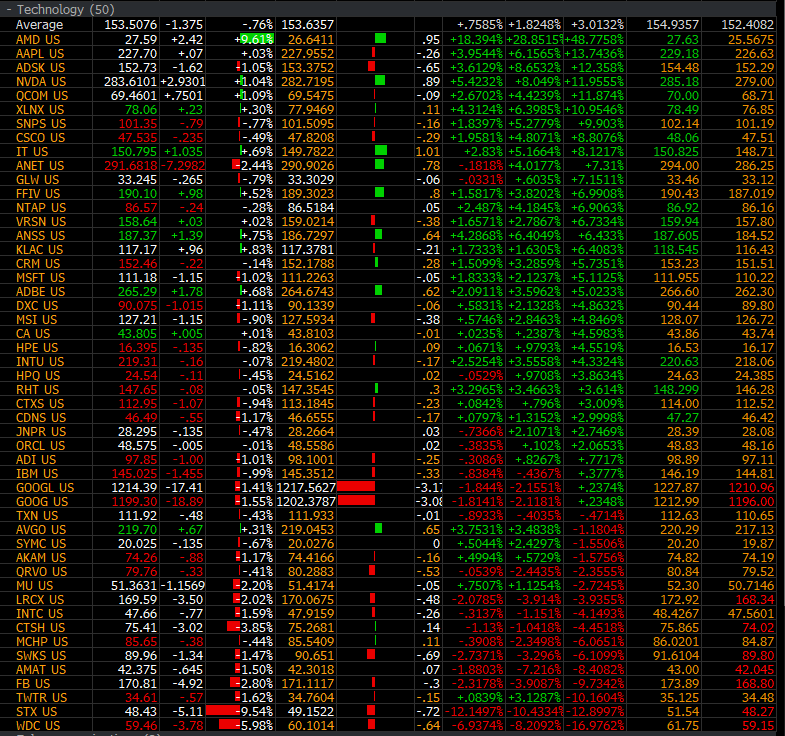
Tech is also seeing that dispersion too. Notice AMD is now 48% above the 50 day moving average. This is pretty excessive but I will be watching for the 10 day to break if I wanted to short it.
|
|
|
|
|
|
|
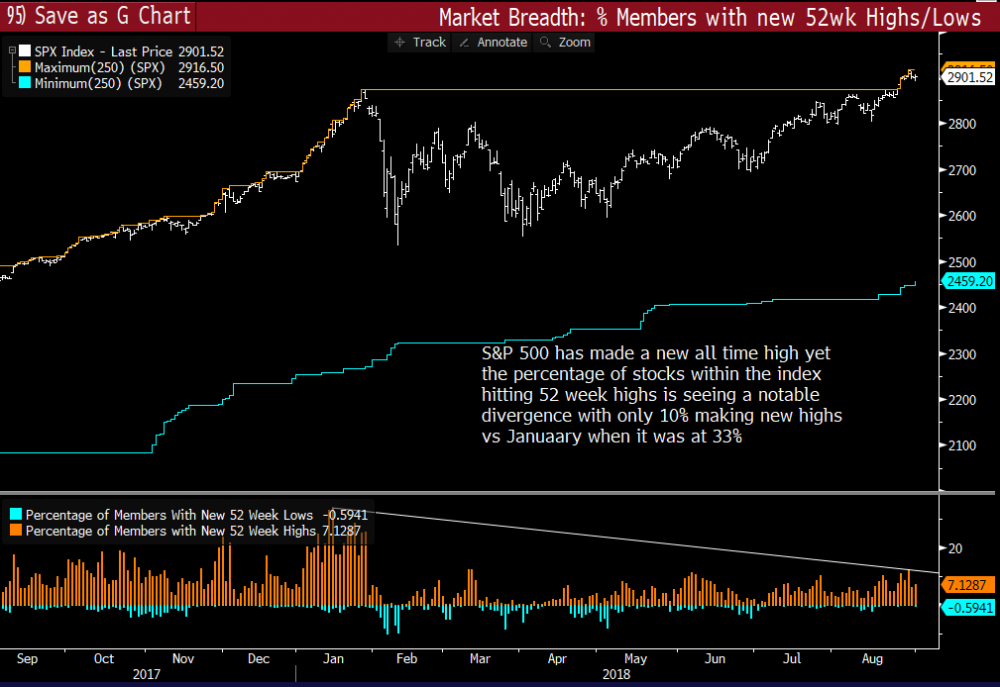
S&P New highs but fewer new individual 52 week highs
|
|
|
|
|
|
|
|
|
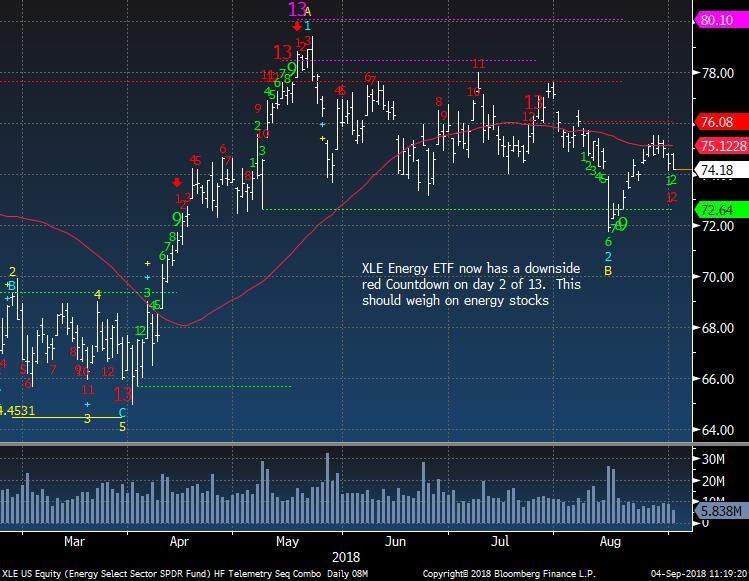
Energy Sectors look to be at risk of going lower
|
|
|
XLE lower highs and now a downside red Countdown on day 2 of 13. I added this to the Trade Ideas as a short today
|
|
|
|
|
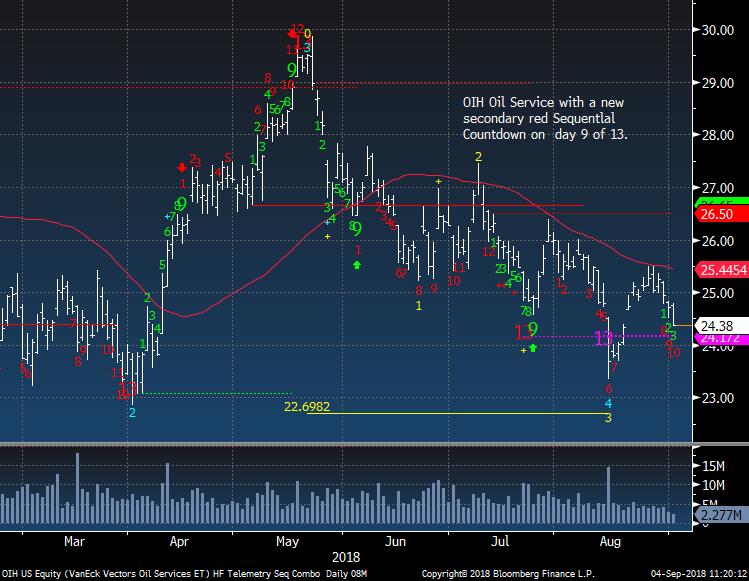
OIH has been quite weak with lower highs
|
|
|
|
|
|
|
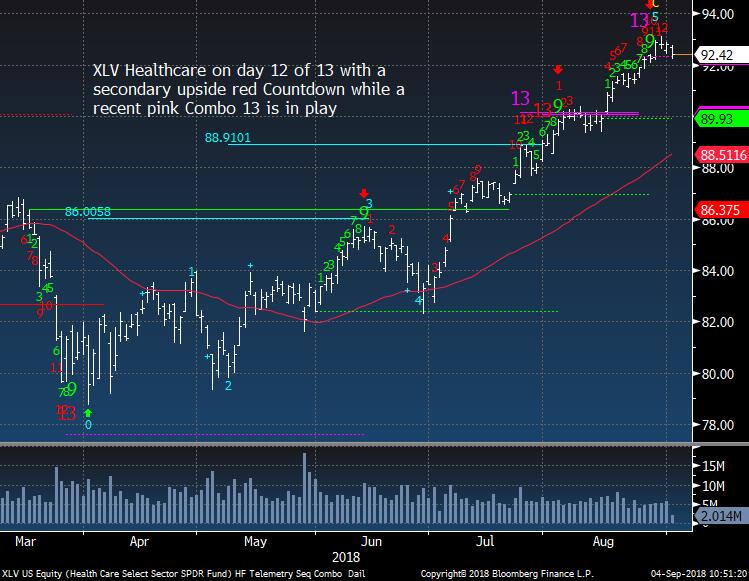
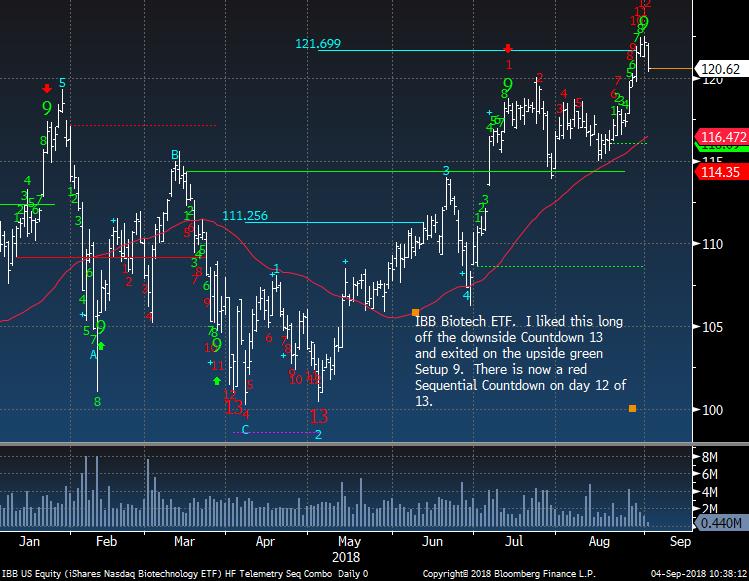
Healthcare and Biotech could be near a top
|
|
|
|
|
|
|
|
|
|
|
|
|
|
|
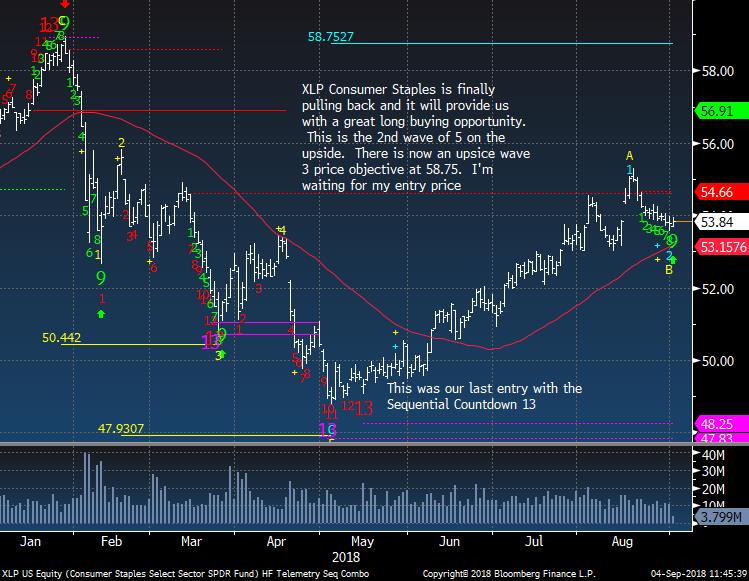
I'm adding a 2.5% sized long back in the Trade Ideas page with a upside wave 3 price objective of 58.75. If anything I like this on a relative basis if the market gets tough
|
|
|
|
|
|
|
|
|
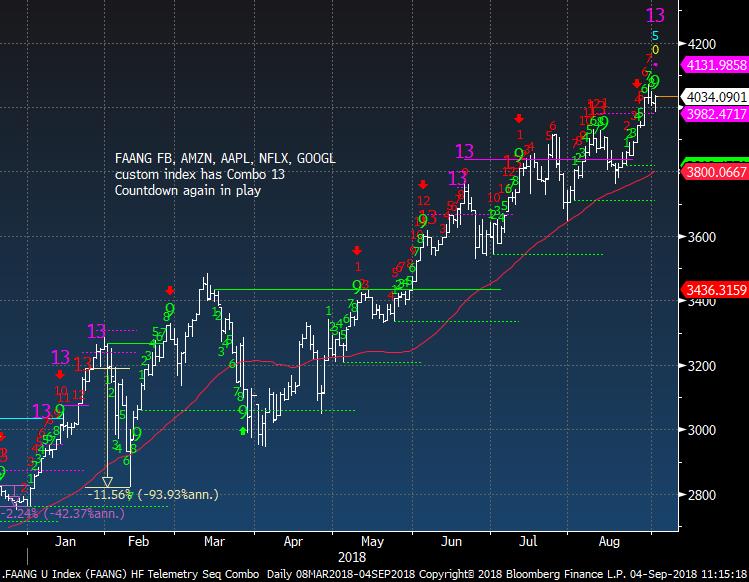
FAANG with a Combo 13 Countdown exhaustion today
|
|
|
|
|
|
|
|
|
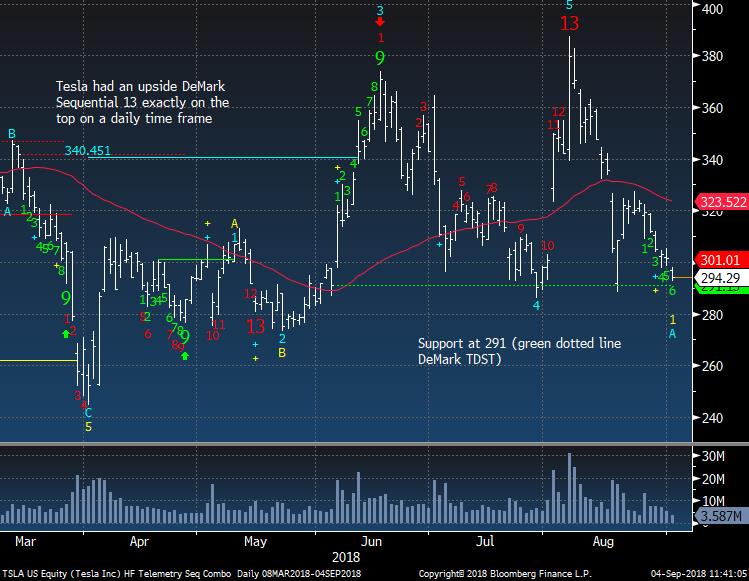
Tesla is nearing some previous support but I do not believe this will hold.
|
|
|
|
|
|
|
|
|
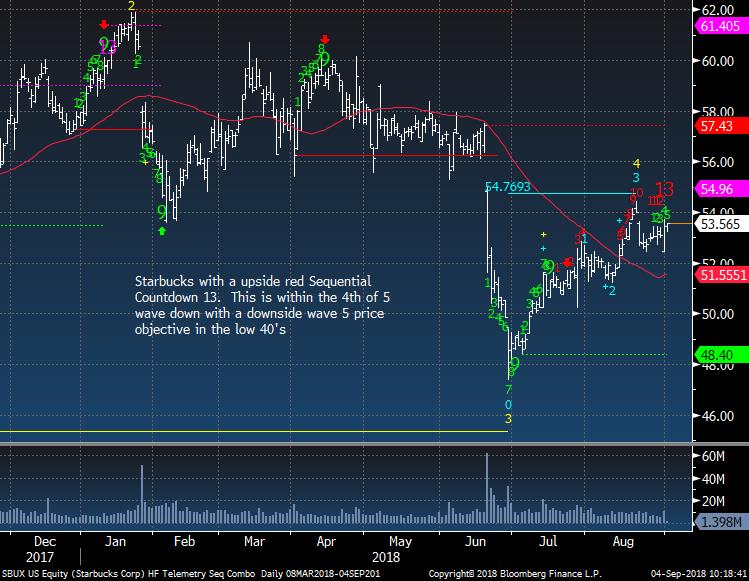
Starbucks really fell hard and bounced back but could not fill the gap. This is a wave 4 of 5 down waves and this should work lower
|
|
|
|
|
|
|
|
|
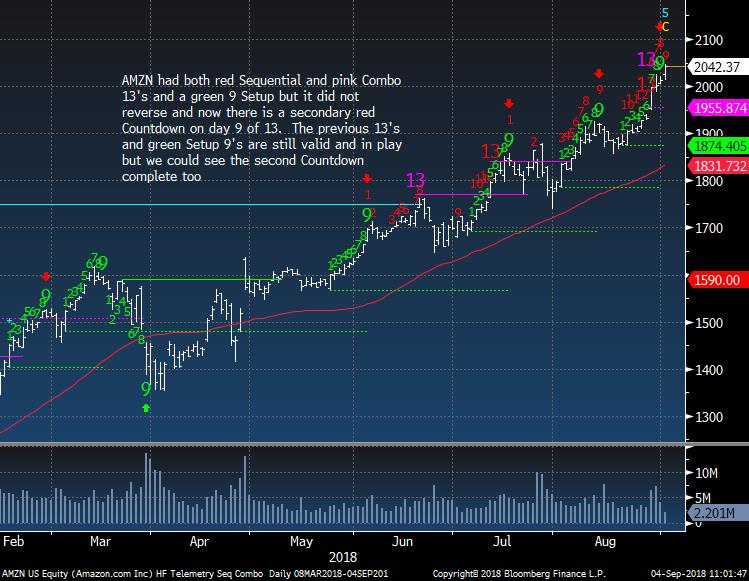
AMZN hit a trillion dollar market cap today. I'm staying short from entry late last week
|
|
|
|
|
|
|
|
|
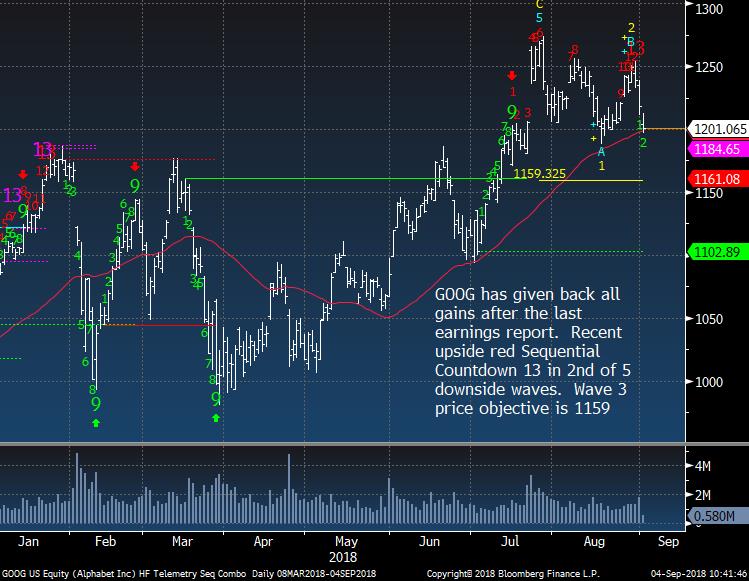
GOOGL was shown last week and it got to day 12 of 13 while GOOG did get the Countdown 13 and reversed.
|
|
|
|
|
|
|
|
|
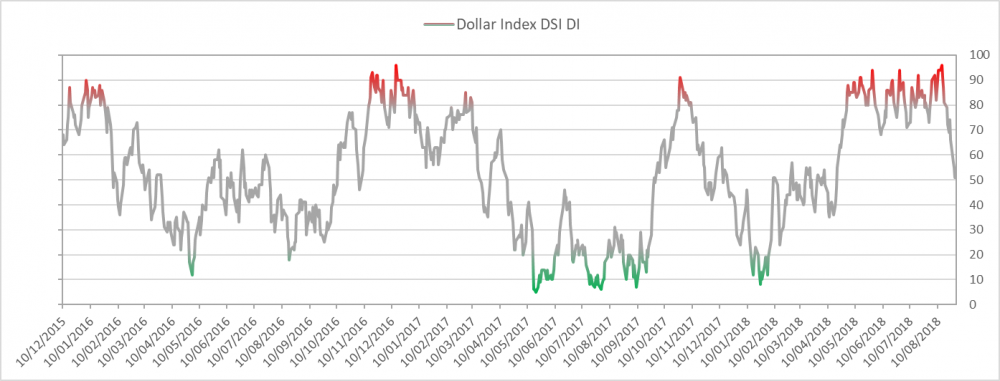
US Dollar bullish sentiment is at 60% and up from holding the 50% level
|
|
|
|
|
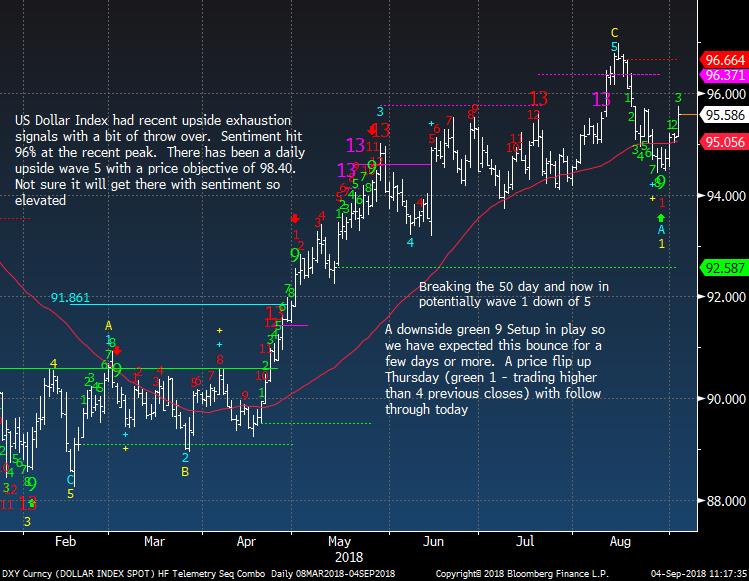
US Dollar Index reversing higher
|
|
|
|
|
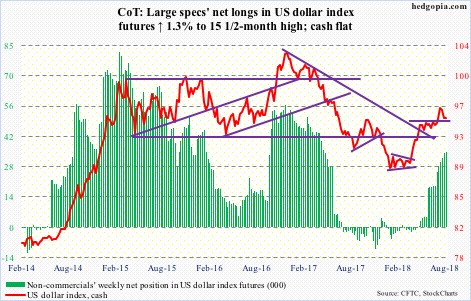
USD Commitment of Traders shows an increase with speculators long positioning but it certainly can get higher
|
|
|
|
|
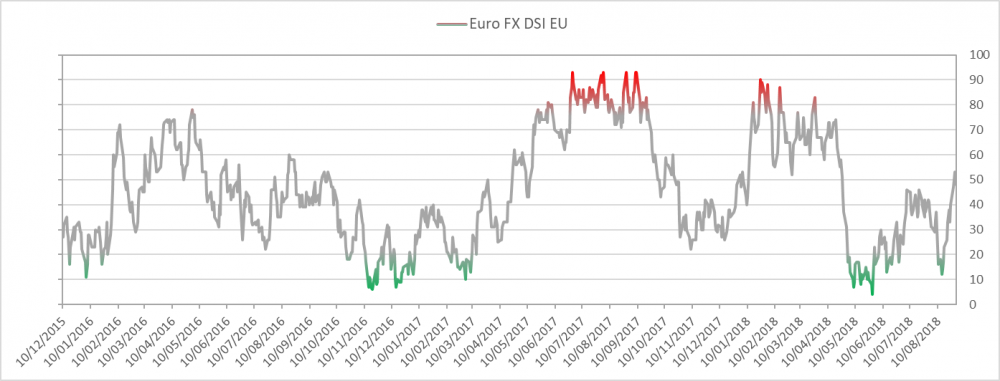
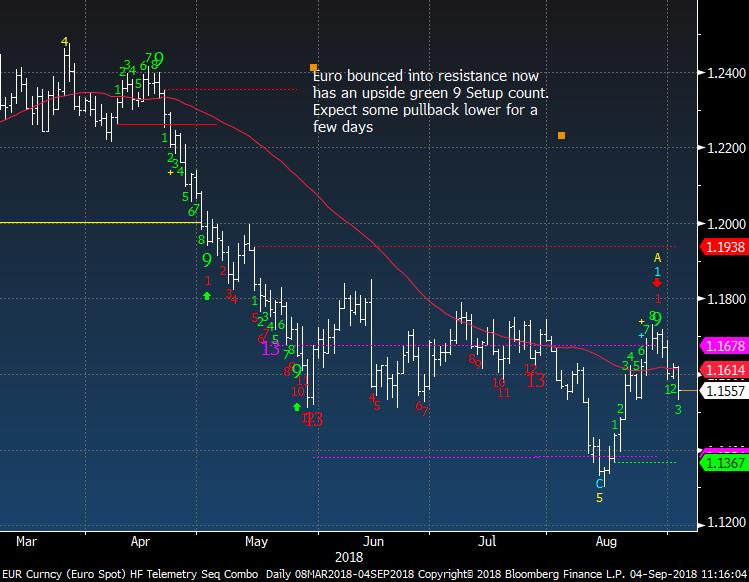
Euro bullish sentiment is at 44%
|
|
|
|
|
|
|
|
|
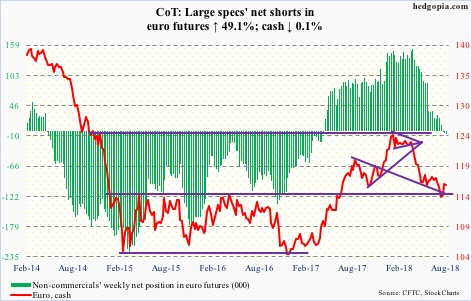
COT data now showing a small net short position after being set up very bullish
|
|
|
|
|
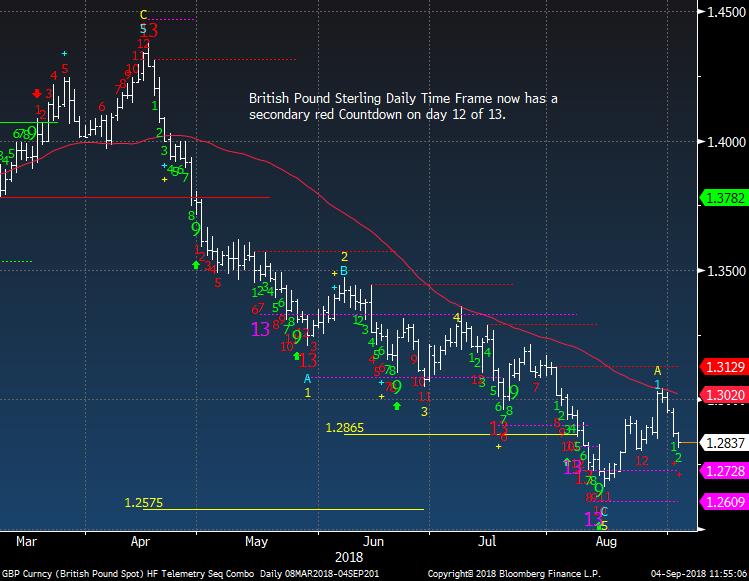
British Pound continues to fade
|
|
|
|
|
|
|
|
|
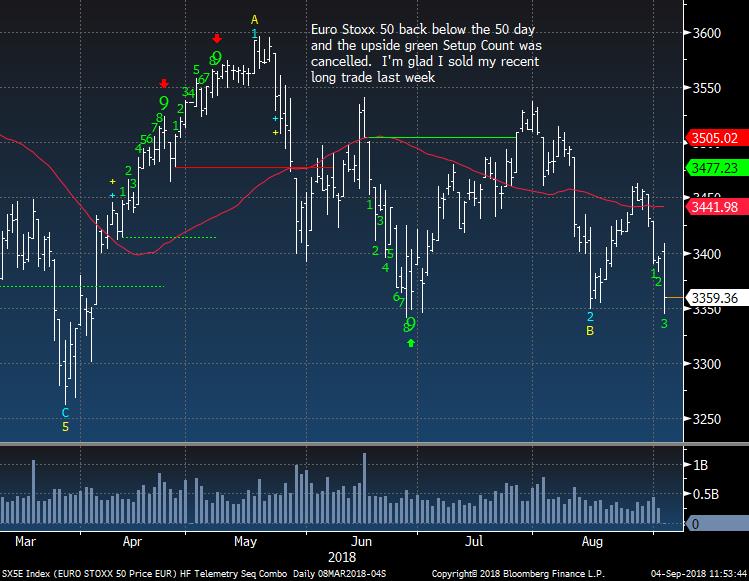
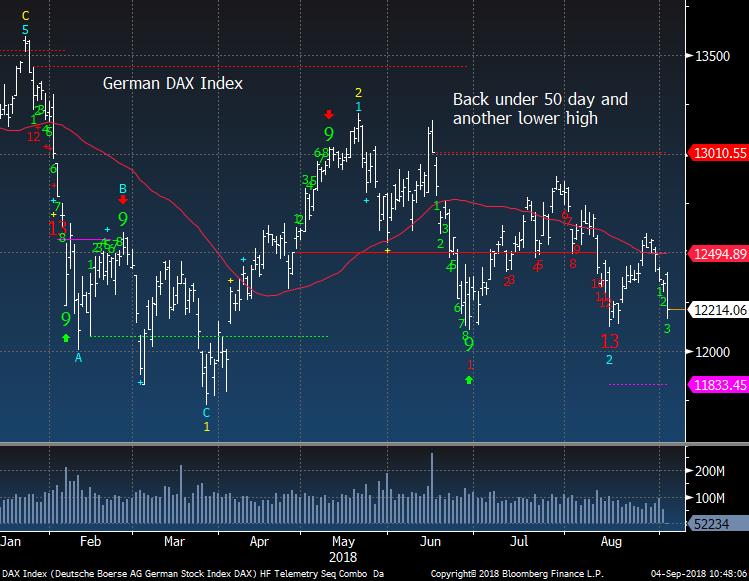
Euro Stoxx 50 another lower high
|
|
|
|
|
|
|
|
|
|
|
|
|
|
|
|
|
|
|
|
|
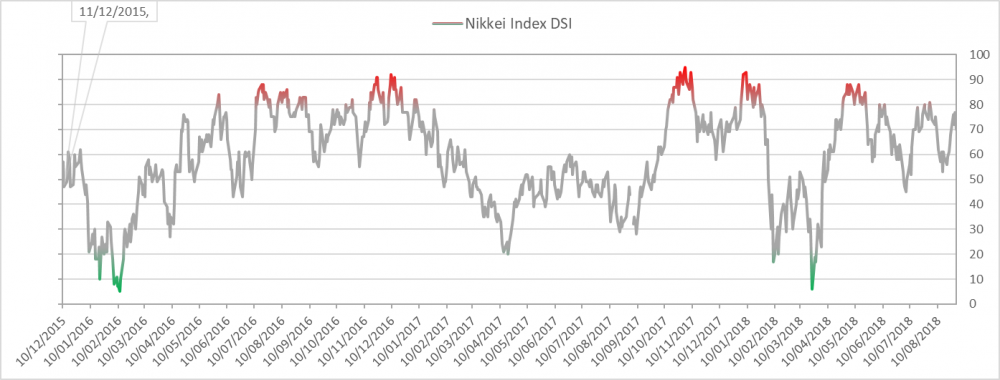
Nikkei bullish sentiment is at 74%
|
|
|
|
|
Nikkei should work lower after the recent upside exhaustion signals
|
|
|
|
|
|
|
|
|
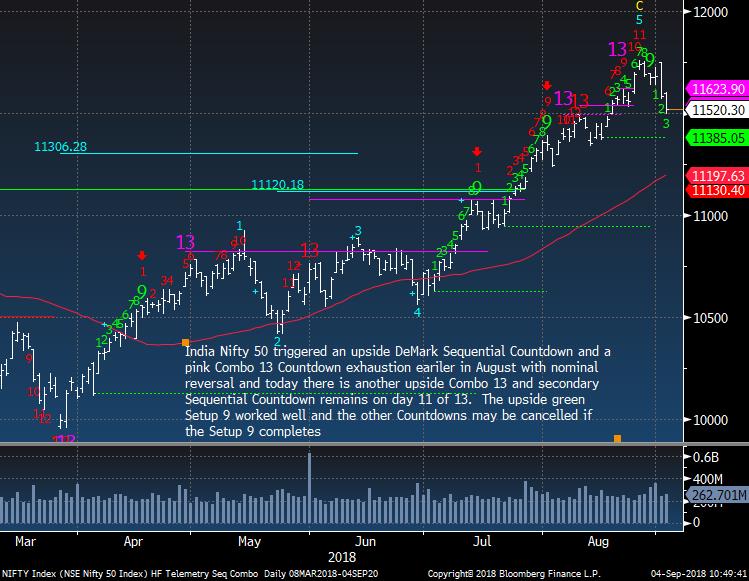
India Nifty 50 reversed on the green Setup 9
|
|
|
|
|
|
|
|
|
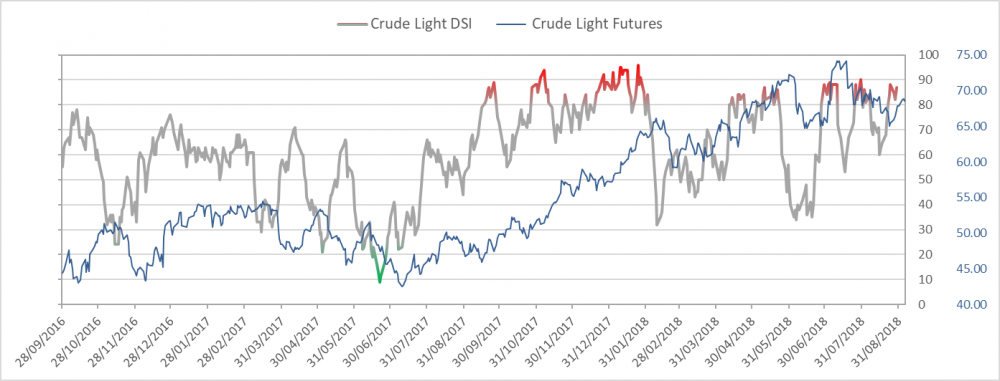
Crude bullish sentiment is at 86% and this is still extreme
|
|
|
|
|
Crude is at a make or break level
|
|
|
|
|
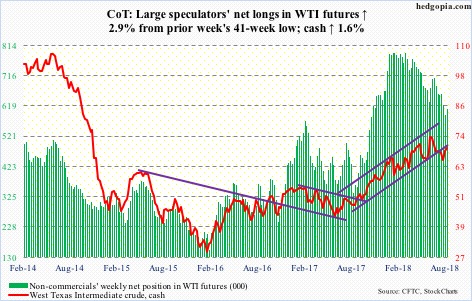
COT data shows speculator positioning coming down from earlier this year but this is still set up overly bullish
|
|
|
|
|
|
|
|
|
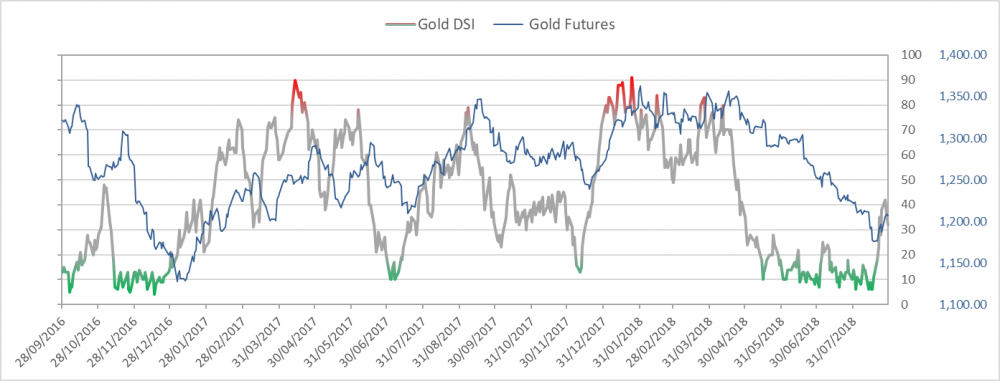
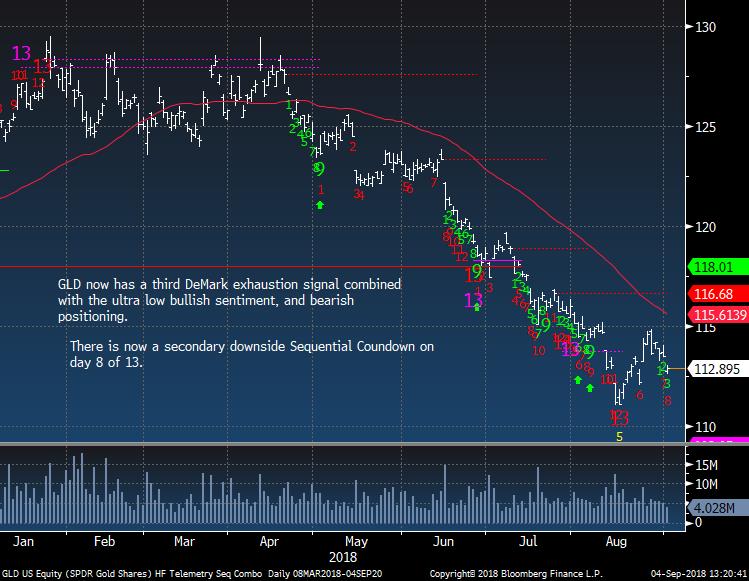
Gold bullish sentiment is at 26%
|
|
|
|
|
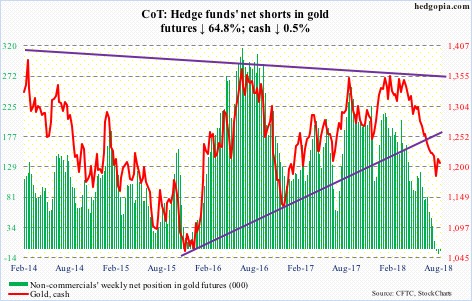
Gold has COT data now shows speculators set up net short.
|
|
|
|
|
GLD could not regain the 50 day and I'm taking off the small 2.5% sized long and will wait for a better turn
|
|
|
|
|
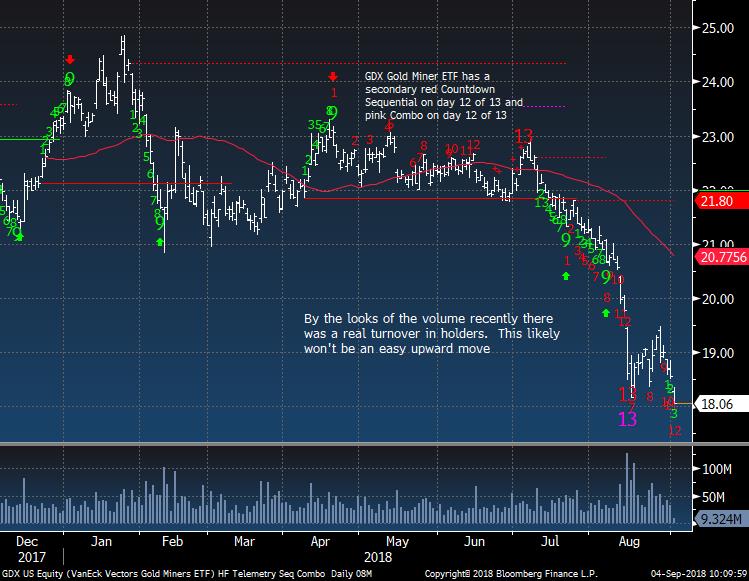
GDX Gold Miners on day 12 of 13 with a secondary Countdown
|
|
|
|
|
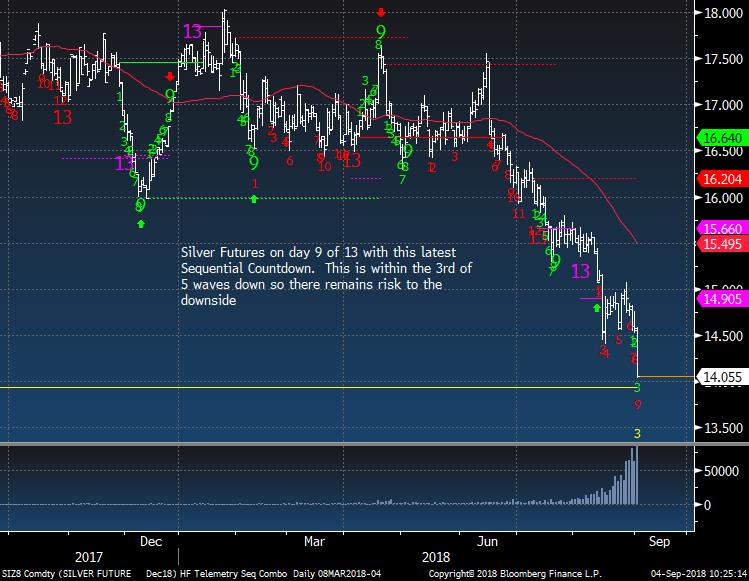
Silver Futures on day 9 of 13.
|
|
|
|
|
|
|
|
|
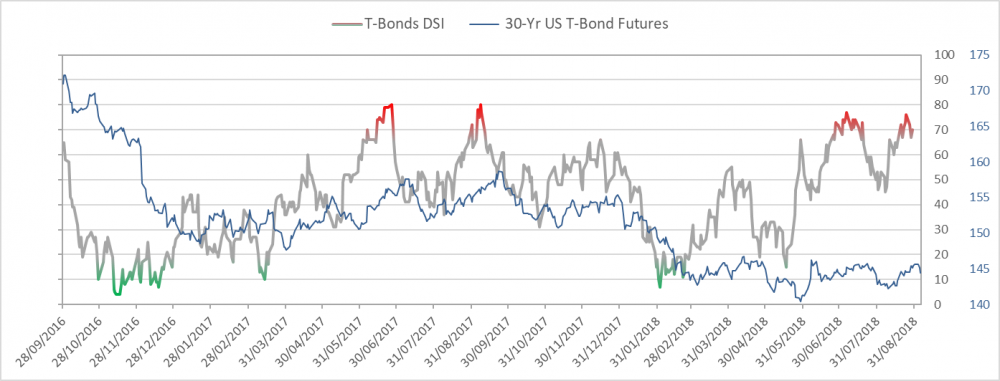
Bond bullish sentiment is at 73%
|
|
|
|
|
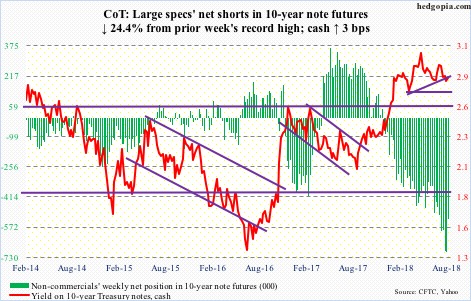
10 year COT data shows a very large short positioning with speculators. This is fuel when the 10 year yield breaks 2.80%
|
|
|
|
|
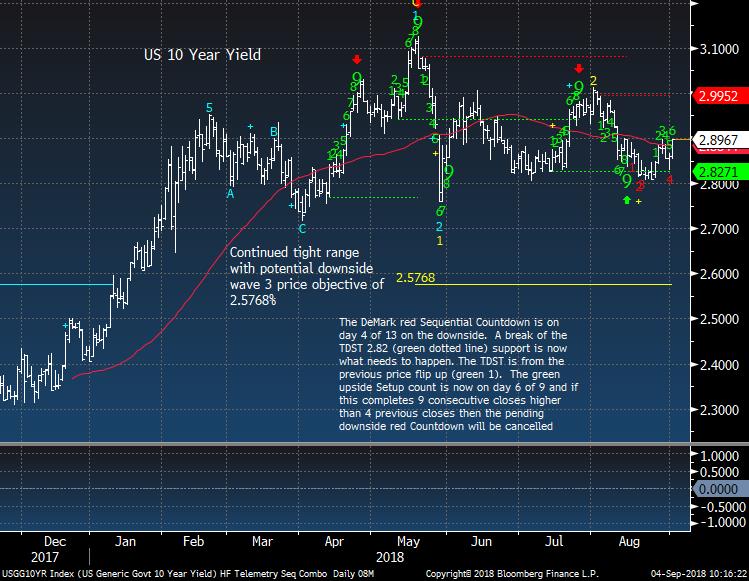
US 10 year yield remains in a tight range
|
|
|
|
|
|
|
DEMARK SCREENS - Daily, Weekly, Monthly Upside/Downside Exhaustion Signals
|
|
|
Daily/Weekly DeMark upside/downside exhaustion signals (Sequential) weekly updated on Monday's and monthly on the first day of the new month. Price flips occur when a stock closes higher/lower than four previous closes and increases conviction of a price turn.
The upside 13's are sell signals and downside 13's are buy signals. Price flip's are confirmation signals that increases potential for a price trend change. For example, if you are long a stock and there is an upside 13, you will want to take cautious action by selling down or out of a position. If initiating a short sale with the upside 13's, we tend to start with a 1/2 size and add with the downside price flip. The opposite is true for when there are downside 13's. Take a 1/2 size position
and add with the upside price flip. The DeMark Indicators are designed to assist the user with buying into weakness and selling into strength to anticipate trend exhaustion. Selling into a rally and buying into a decline often afford the opportunity to exit a trade without too serious a loss if wrong.
S&P 1500 Universe:
DAILY UPSIDE 13: EIG, LLL, NP, PKI, SBUX
DAILY DOWNSIDE 13: BLK, PBCT
DAILY UPSIDE WITH PRICE FLIP REVERSAL DOWN: AXP, CLH, COO, ENR, GOOG, HBAN, MNST, MOH, OII, ROG, RPM, SAIC
DAILY DOWNSIDE WITH PRICE FLIP REVERSAL UP: DF, EAT
Updated: 9/4/18
WEEKLY UPSIDE 13: AWR, CA, DHR, DRI, FOR, GRMN, LLL, MA, MANH, NDSN, NFLX, PTC, SHOO, SIVB, STI, TDC, TXRH, WRLD
WEEKLY DOWNSIDE 13: CHS
Updated: 9/4/18
MONTHLY
UPSIDE 13: AFG, AJG, AMD, CBT, CECO, EIG, IR, MAA, MRCY, MSA, MSFT, NSC, ORI, ROK, TDY, TTWO, UNT, UNP, WCG, WTR
MONTHLY DOWNSIDE 13: FTR, RRD, SMCI, SSI
Euro Stoxx 600 Universe:
DAILY UPSIDE 13: KYG ID, AHT LN, HAS LN
DAILY DOWNSIDE 13: BIA GR, EMD LN, ITV LN, STJ LN, TEF SM, BMW GR, GLEN LN, LIN GR, LXS GR, VOD LN
DAILY UPSIDE WITH PRICE FLIP REVERSAL DOWN: AC FP, AI FP, AMS SM, BNR, GR, CDI FP, INDUA SS, INVEB SS, LOGN SW, MTX, GR, SAP GR, SEBA SS, UCB BB, WDI GR, COFB BB, DRX LN, GJF NO, GPOR LN, MAERSKB DC, NDA SS, PGHN SW, PHIA NA
DAILY
DOWNSIDE WITH PRICE FLIP REVERSAL UP: CNA LN, JUP LN, TCH FP, LIN GR
Updated: 9/4/18
WEEKLY UPSIDE 13: CBG LN, DSY FP, FGR FP, SECUB SS, SOBI SS
WEEKLY DOWNSIDE 13: NONE
Updated: 9/4/18
MONTHLY UPSIDE 13: ACKB BB, GALP PL, IPN FP, KOMB CP, MTX GR, UCB BB
MONTHLY DOWNSIDE 13: ALPHA GA, BARC LN, TL5 SM
|
|
|
Unsubscribe me from Hedge Fund Telemetry
Hedge Fund Telemetry LLC, P.O. Box 4675, Greenwich, CT 06861, United States
CONFIDENTIALITY NOTE and DISCLAIMER: This message is for the named person's use only. It may contain confidential, proprietary or legally privileged material. No confidentiality or privilege is waived by any accidental or unintentional transmission. If you receive this message in error, please immediately delete it and all copies of it from your system, destroy any hard copies and notify the sender. You must not, directly or indirectly, use, disclose,
distribute, print or copy any part of this message if you are not the intended recipient. Hedge Fund Telemetry LLC. cannot guarantee the confidentiality of the material transmitted; therefore, information of a sensitive or confidential nature should not be transmitted. There is risk in trading markets. Hedge Fund Telemetry LLC reports are based on information gathered from various sources and believed to be reliable, but are not guaranteed as to accuracy and completeness. The information is subject to change without notice and Hedge Fund Telemetry LLC has no obligation to provide any updates or changes. Hedge Fund Telemetry LLC is providing this data for informational and educational purposes and does not believe that it is sufficient to base an investment decision on. This information should not be regarded as a solicitation or recommendation of any particular security or to engage in any trading strategy. One should always check with your licensed financial
advisor to determine suitability of any investments.
|
|
|
|
|