|
|
|
|
|
|
Do not dive in the shallow end
|
|
|
|
|
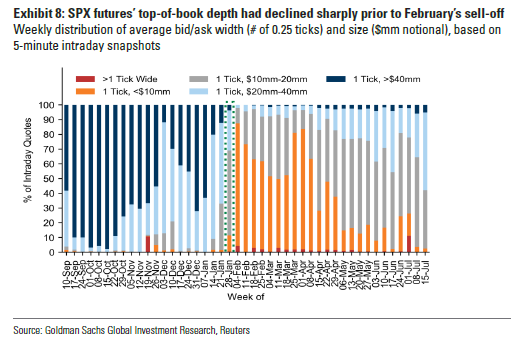
As the US equity markets keep rising the liquidity in the market is diminishing. Throughout 2017 liquidity was unusually abundant and that could be why dips were so infrequent and shallow. In 2018 it has turned around 180 degrees. Back in January and early February the S&P Futures depth of book dropped considerably potentially contributing to the VIX spike. Months after that VIX spike, the bid/ask is not back to normal. Liquidity is hard to monitor but looking at top of book
depth is an important metric. Top of book depth is when you look at bid ask spreads as well how much notional volume there is under the bid. Essentially if need to sell $20 billion of S&P futures instead of moving it very little with a well bid market (like 2017) the potential for moving the market lower is much greater. Think if people in passive funds decide to sell at the same time with nobody to sell to. This deserves a longer explanation but I think you get the point.
When I consider the Erlanger short interest data showing the stocks within the sectors leading on the way up are type 4 (stocks that have very little short interest and that are vulnerable to long squeezes lower) combined with the lack of liquidity in the futures and ETF markets, I have to say this could get ugly really fast. Then add on S&P and Nasdaq bullish sentiment is back to 80% (the extreme zone) and every major US index and futures contract with a recent upside DeMark
exhaustion signal and we have some potential risk ahead just as we had in January. I will admit I am very surprised that the markets have lifted as much as they have from the April lows yet with all of this evidence I have to stay focused on managing risk which I see as pretty high right now.
- US Markets - Extreme sentiment, tons of upside DeMark exhaustion signals is similar to January
- Hedge Fund Telemetry Trade Ideas - added NVDA back short, trimmed IBM short
- New highs
on the Indexes but fewer percentage of individual 52 week highs
- Amazon - New upside DeMark Countdown 13 exhaustion today
- Nvdia - Added back short
- Currency Update
- European Market Update
- Global Market Update
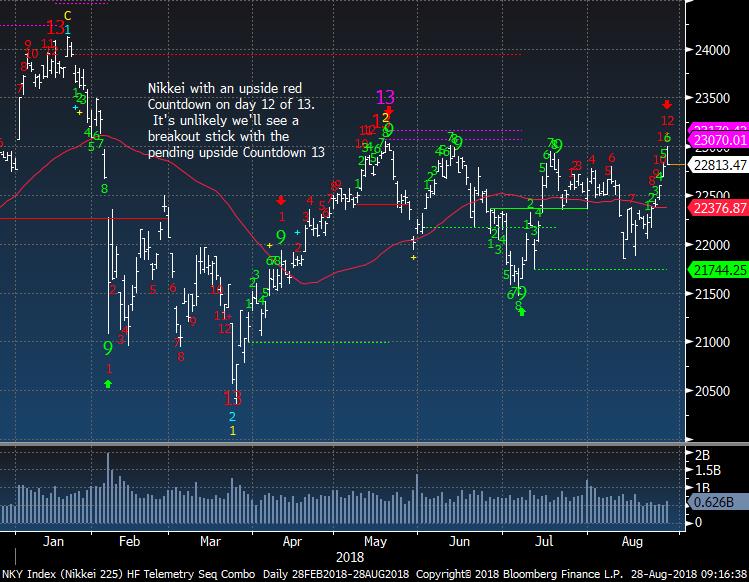
- Asian Market Update - Nikkei will have an upside exhaustion Countdown 13 tomorrow
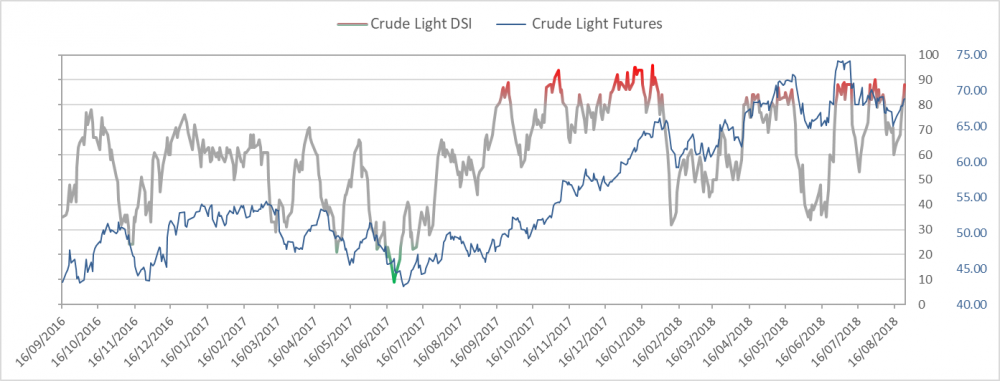
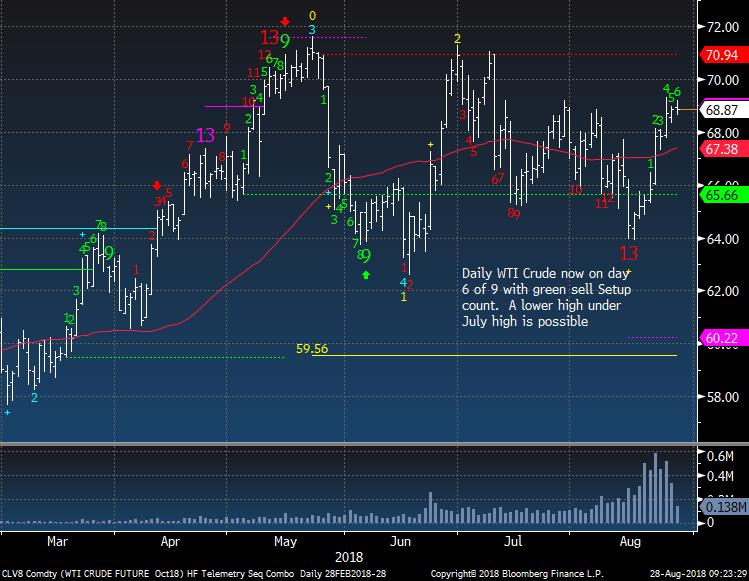
- Crude Update - quiet day but sentiment is extreme
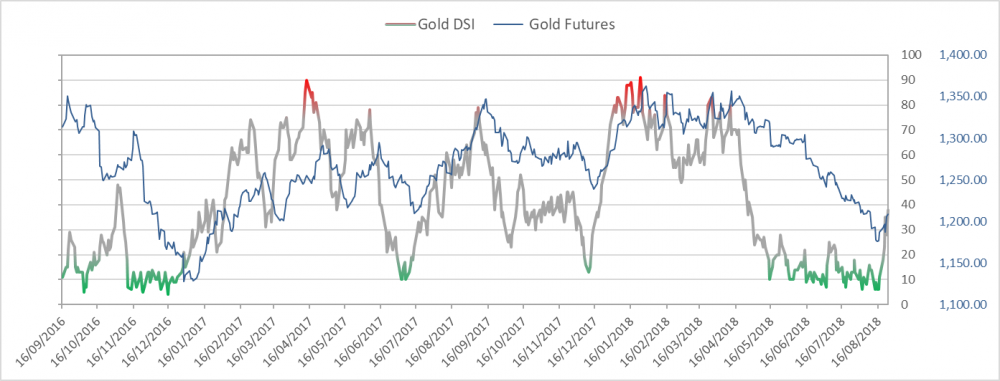
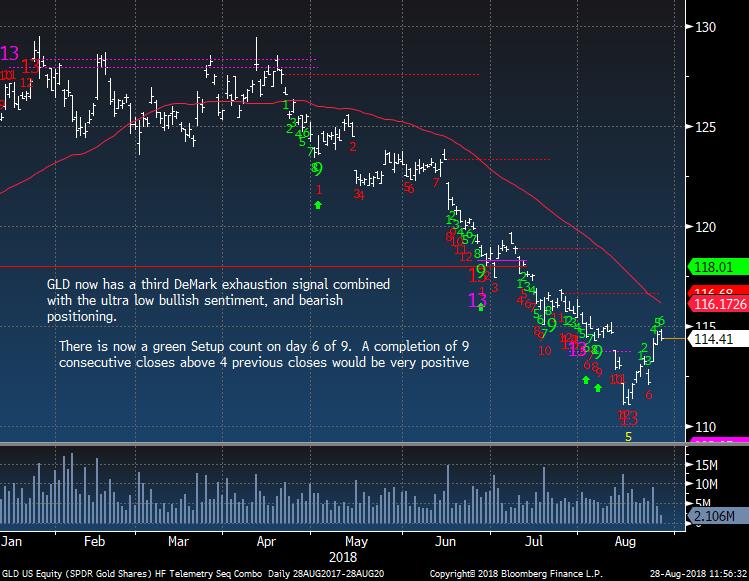
- Gold Update - Sentiment new recent high but price just taking its time
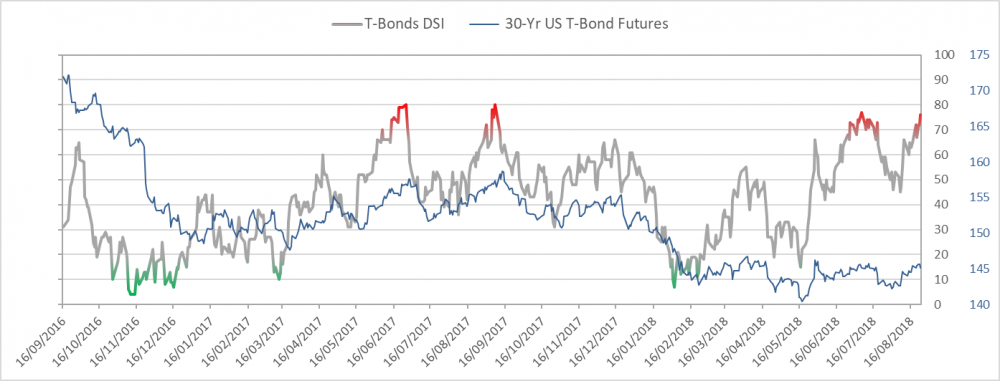
- Bond Update
- DeMark Screens - Daily, Weekly, Monthly upside/downside exhaustion signals within the S&P 1500 and Euro Stoxx 600
|
|
|
|
|
Here's a link to the Hedge Fund Telemetry market sentiment page with 40 charts of sentiment including equities, bonds, currencies, and commodities updated each day.
SPX bullish sentiment is at 80%
|
|
|
|
|
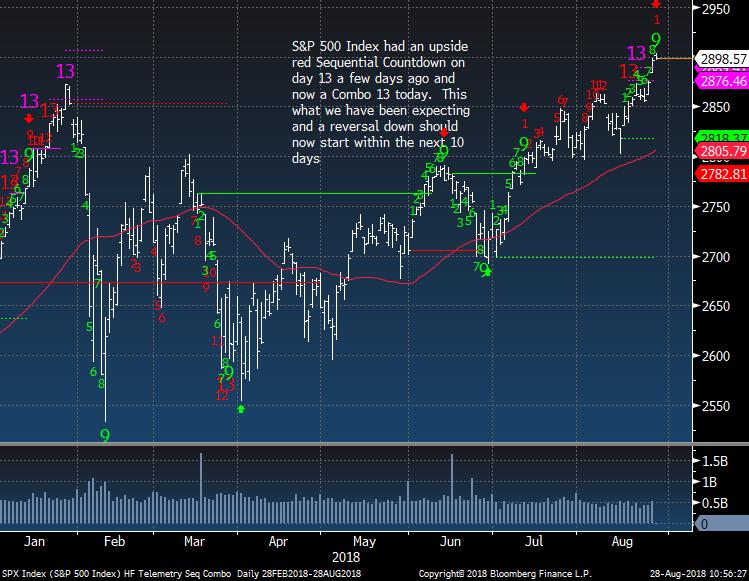
SPX daily with a green Setup 9 too
|
|
|
|
|
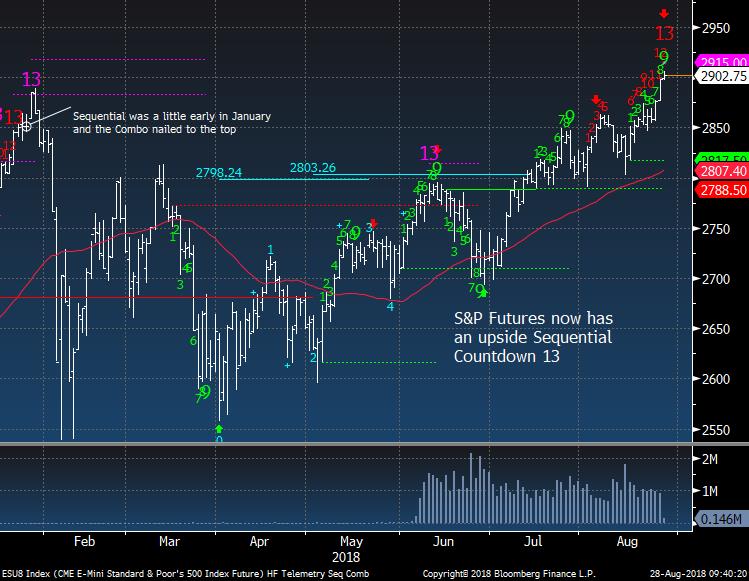
S&P Emini Futures with both a Countdown 13 and Setup 9
|
|
|
|
|
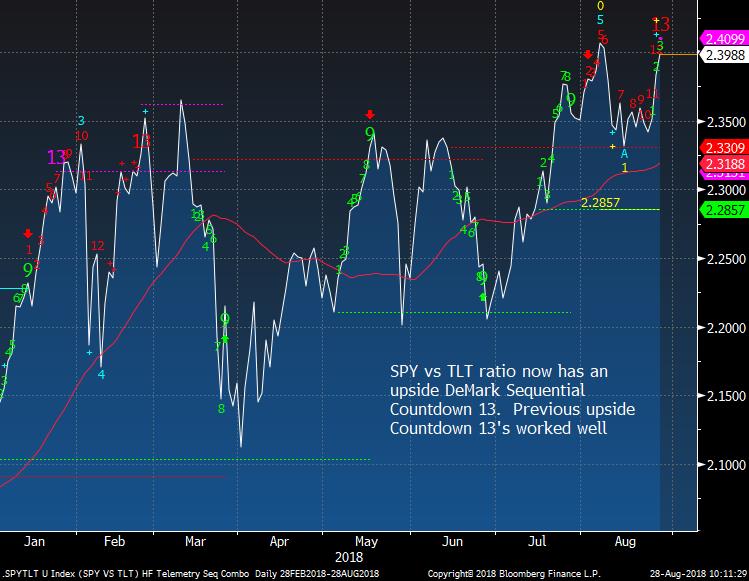
SPY vs TLT ratio did get the upside 13 too today
|
|
|
|
|
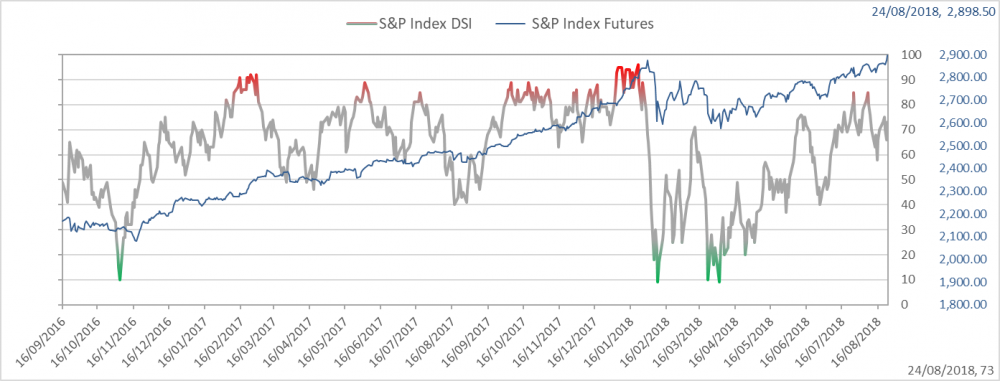
Goldman derivatives put out a great note on market liquidity and depth of market. This chart shows the February levels and today. There is no liquidity to absorb a sharp downside reaction
|
|
|
|
|
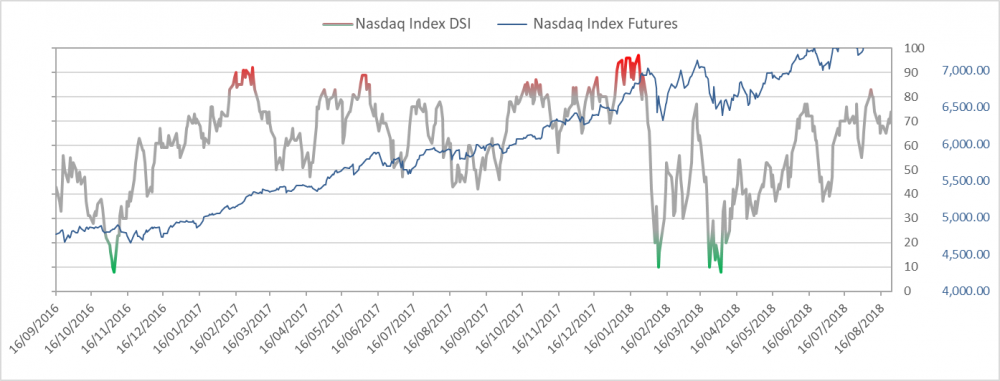
Nasdaq bullish sentiment is at 80%
|
|
|
|
|
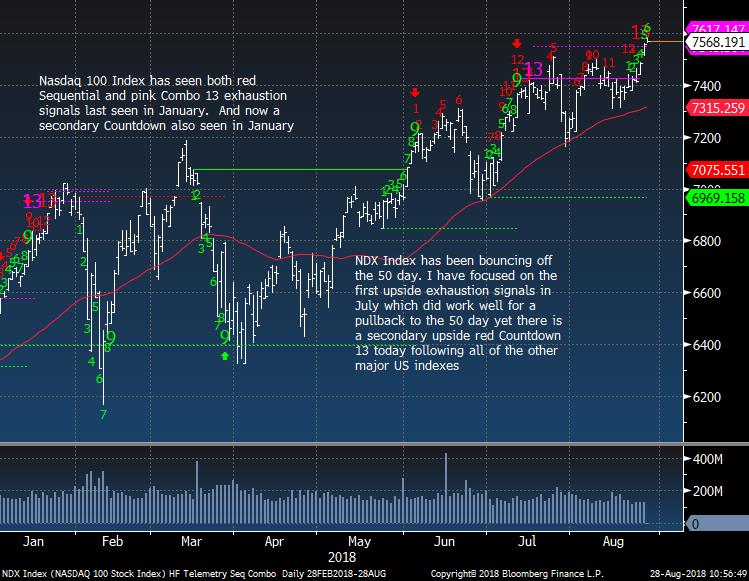
NDX Index did have a recent upside exhaustion too
|
|
|
|
|
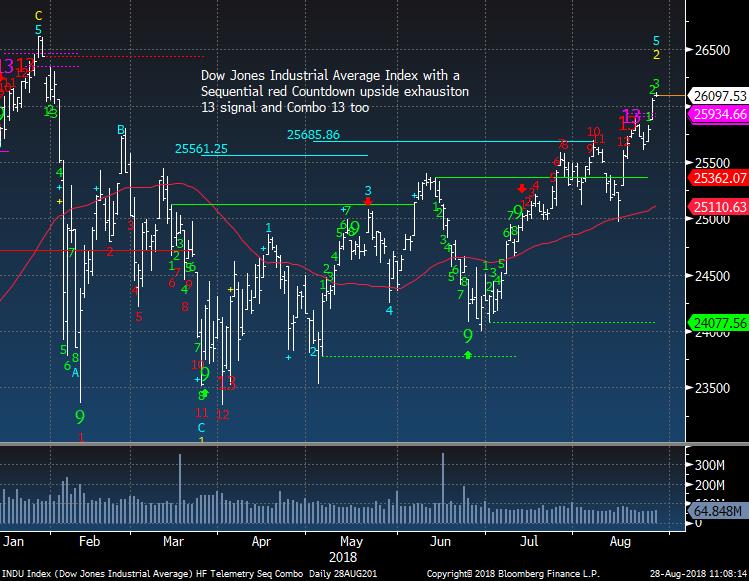
Dow Jones Industrial Average has thrown over after the recent upside exhaustion signals - similar to what happened in late January too.
|
|
|
|
|
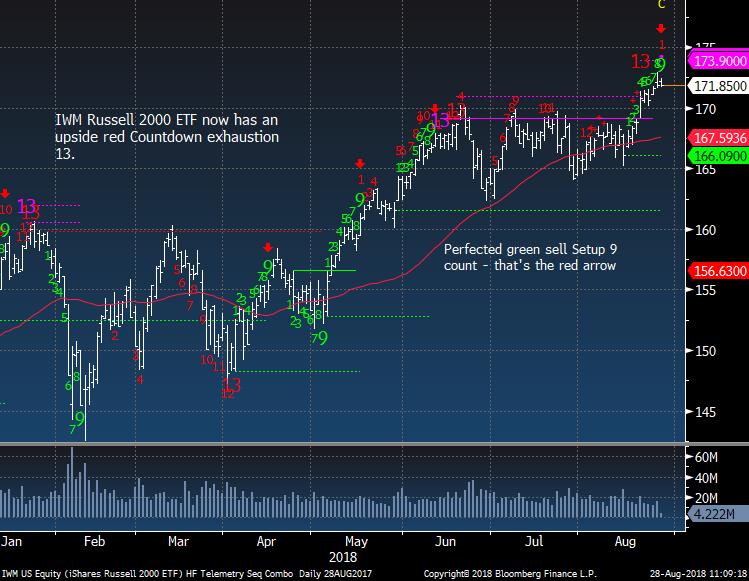
IWM Russell 2000 with green Setup 9 today
|
|
|
|
|
|
|
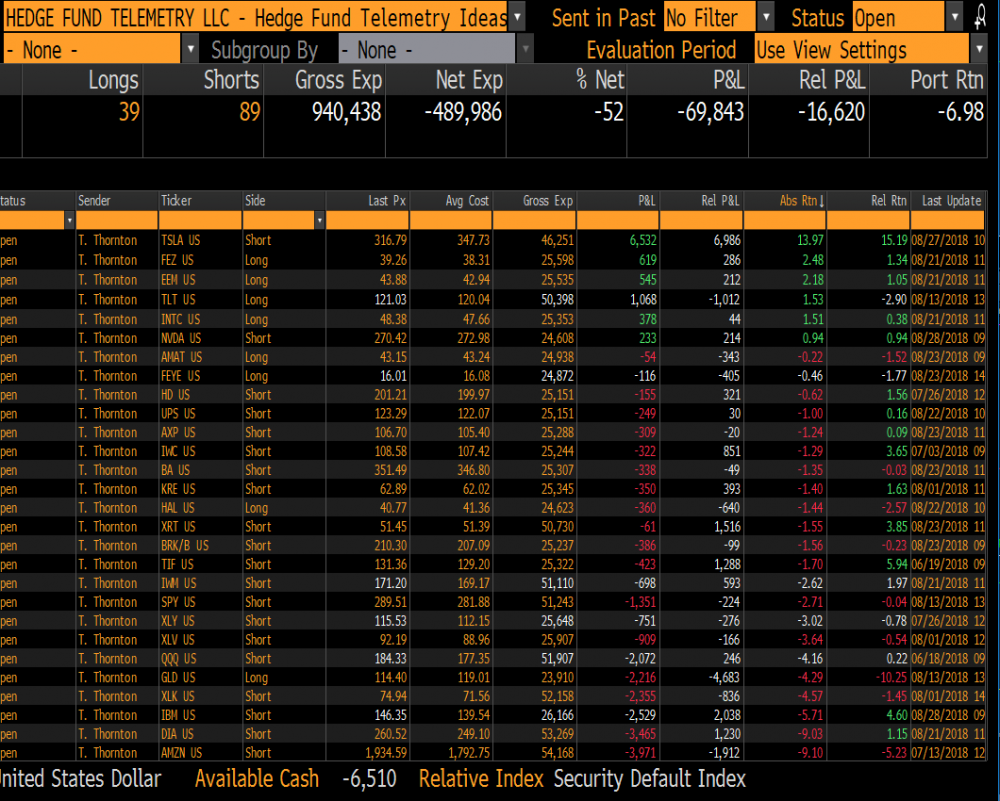
Hedge Fund Telemetry Trade Ideas
|
|
|
Trade Ideas - trimmed some IBM short to 2.5% from 5% (it really needs to break 140 to press) and added back NVDA short with a 2.5% sized position
|
|
|
|
|
|
|
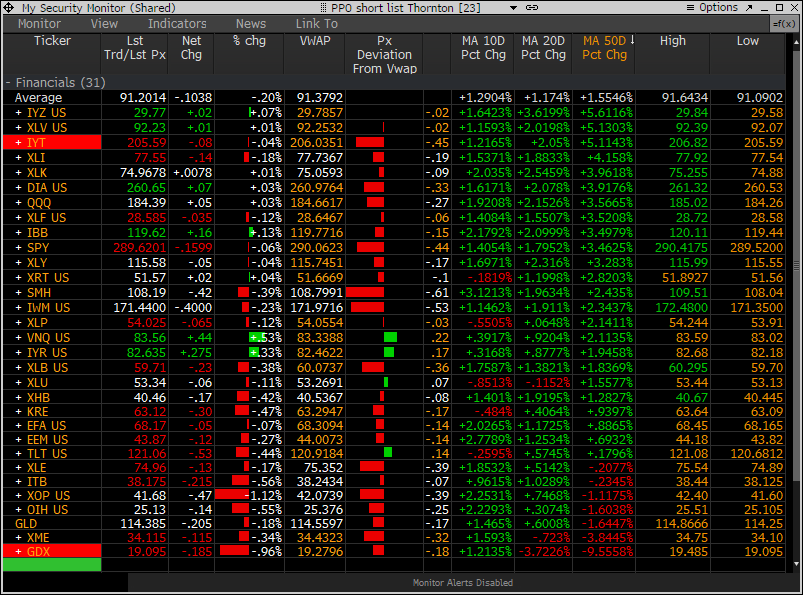
PPO Percentage Price Oscillator
|
|
|
The PPO Monitor today is showing most ETF's under the intraday VWAP yet some are barely down. The ones on the bottom are those sectors that have been relatively weaker and are getting sold harder today
|
|
|
|
|
|
|
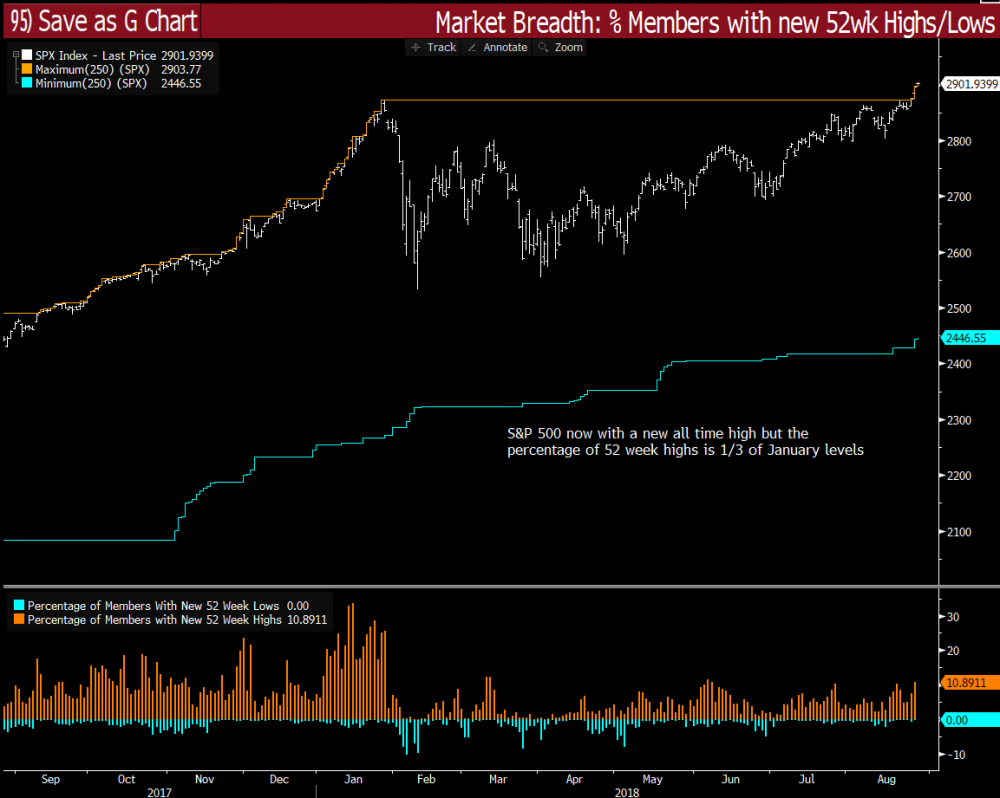
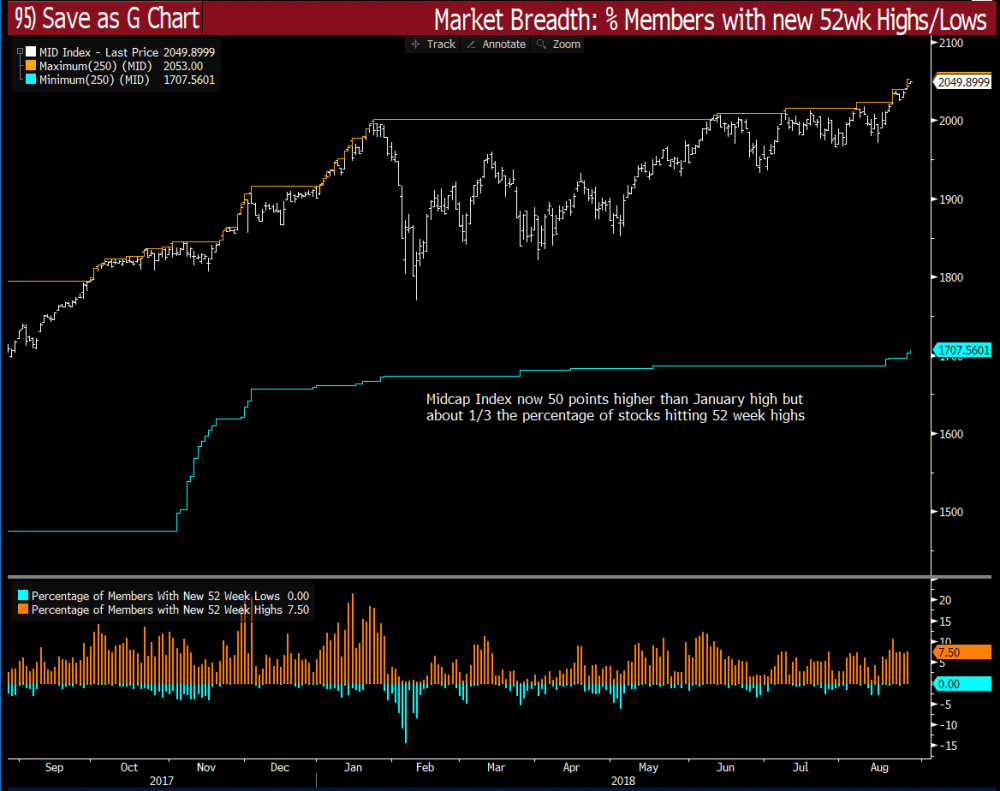
New highs on indexes but fewer individual new 52 week highs
|
|
|
SPX new high on the index but lower % of new 52 week highs
|
|
|
|
|
Same with Midcap Index and this is not as skewed with some weighting anomalies
|
|
|
|
|
|
|
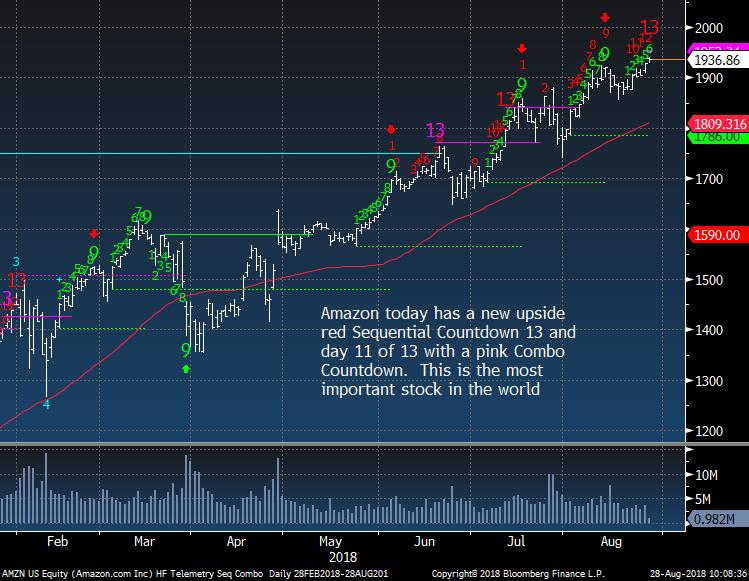
Amazon Upside Sequential Countdown 13
|
|
|
AMZN has a upside Countdown 13 today as we have been anticipating
|
|
|
|
|
|
|
|
|
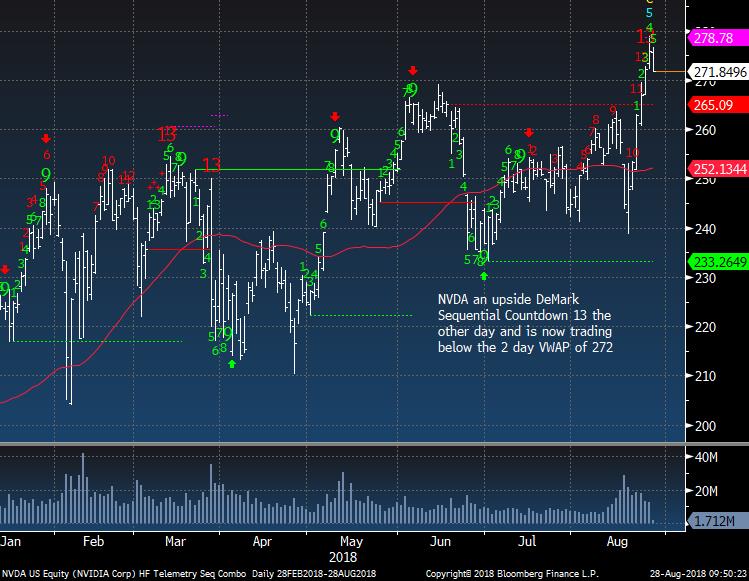
I'm back short 2.5% in NVDA after the recent upside exhaustion Countdown 13 and that it is now trading under the 2 day VWAP
|
|
|
|
|
|
|
|
|
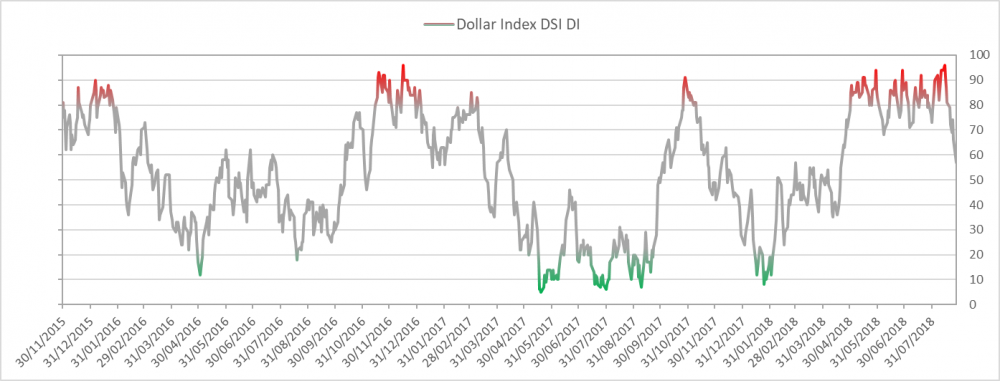
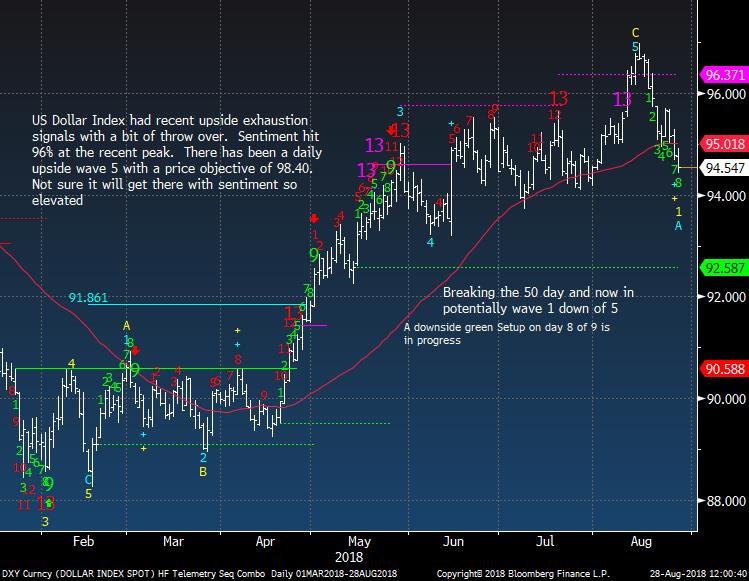
US Dollar bullish sentiment is at 57% and down from 96% on 8/14
|
|
|
|
|
US Dollar Index could see a bounce after the 9 tomorrow
|
|
|
|
|
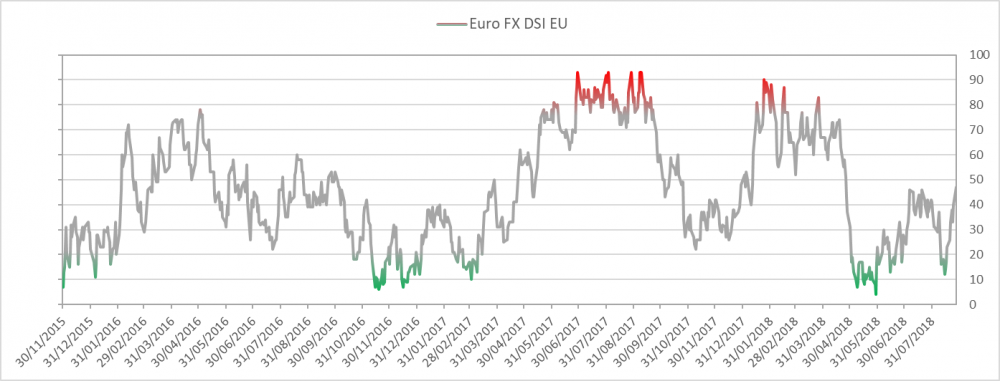
Euro bullish sentiment is at 47% and still under 50%
|
|
|
|
|
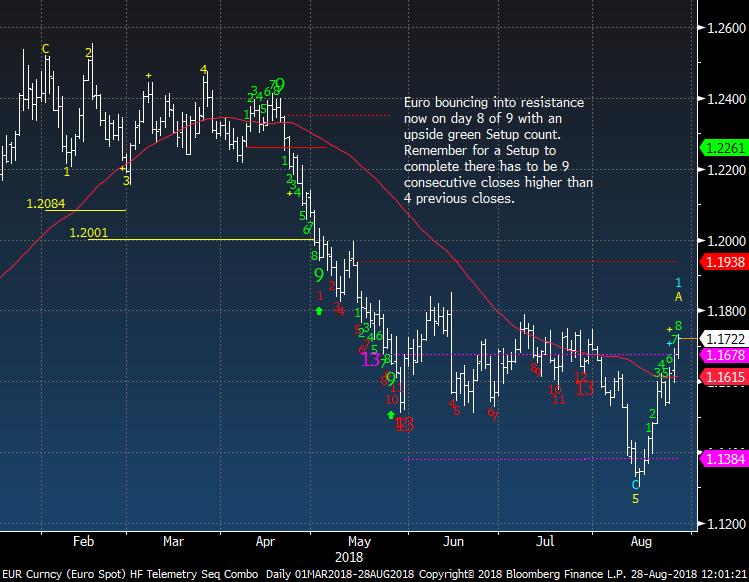
Euro Spot same with 8/9 on the Setup as the USD
|
|
|
|
|
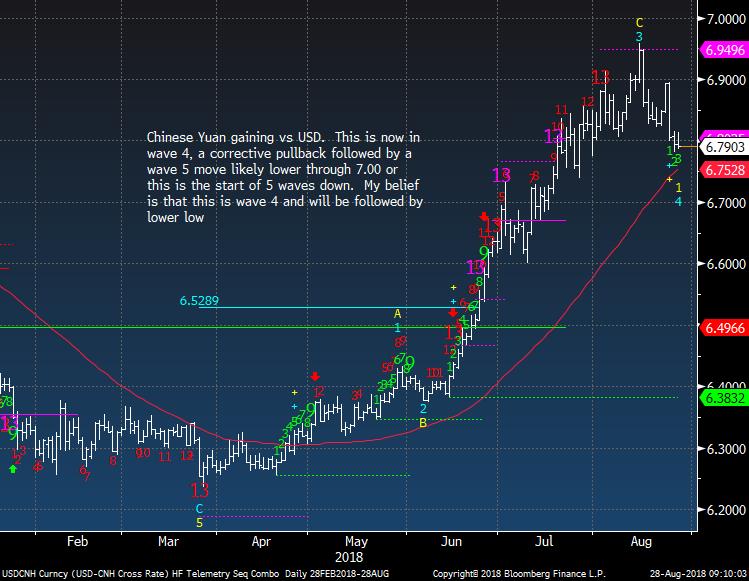
Yuan strengthened last night a little but I still think this could be the 4th wave of 5 (5 will break through 7)
|
|
|
|
|
|
|
|
|
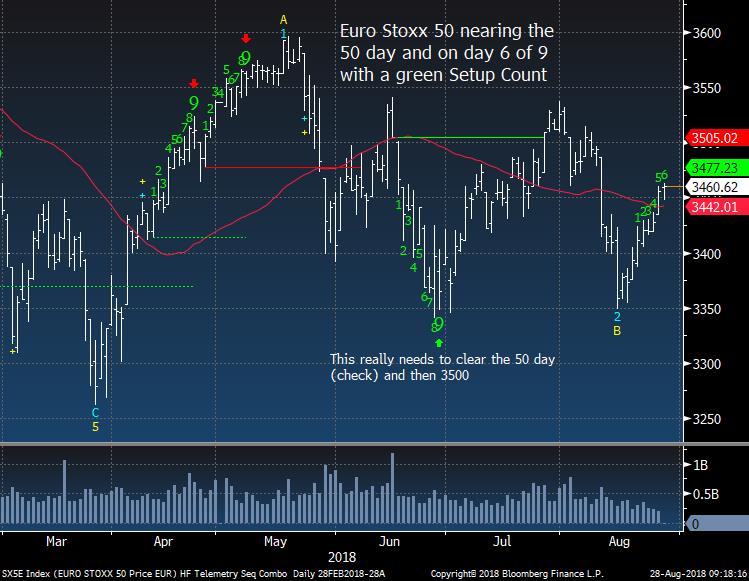
Euro Stoxx 50 still like it long.
|
|
|
|
|
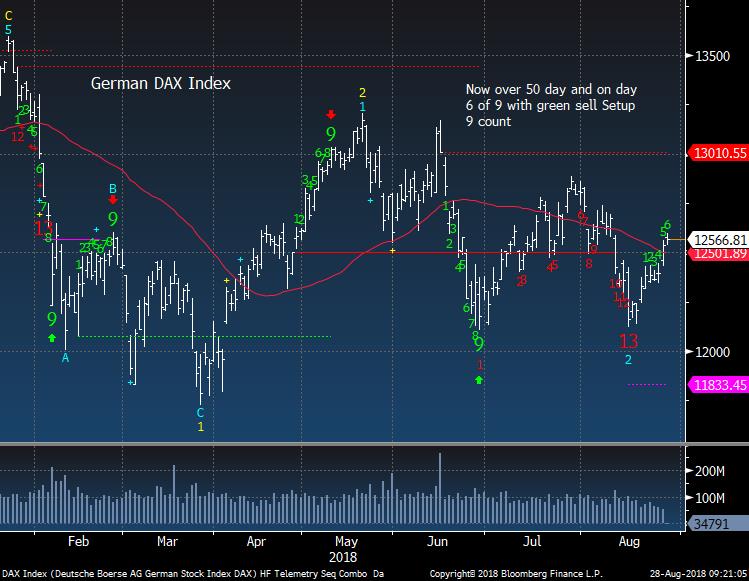
German DAX needs to break the string of lower highs
|
|
|
|
|
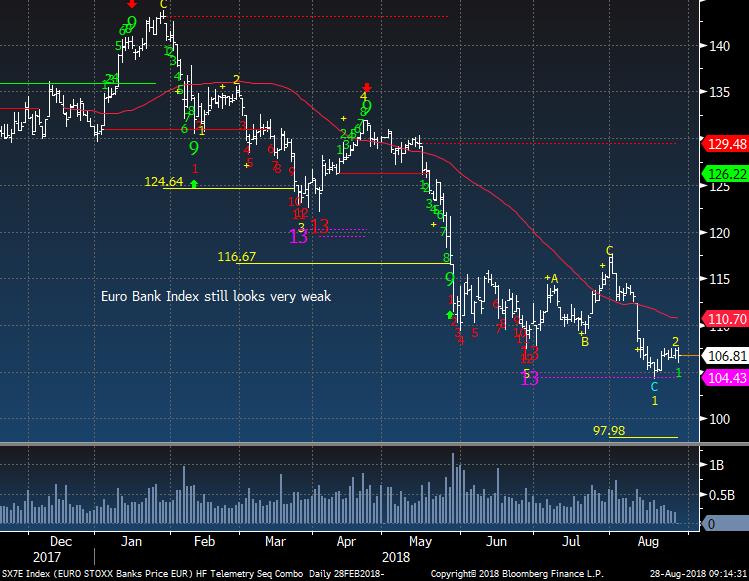
Euro Banks still look weak
|
|
|
|
|
|
|
|
|
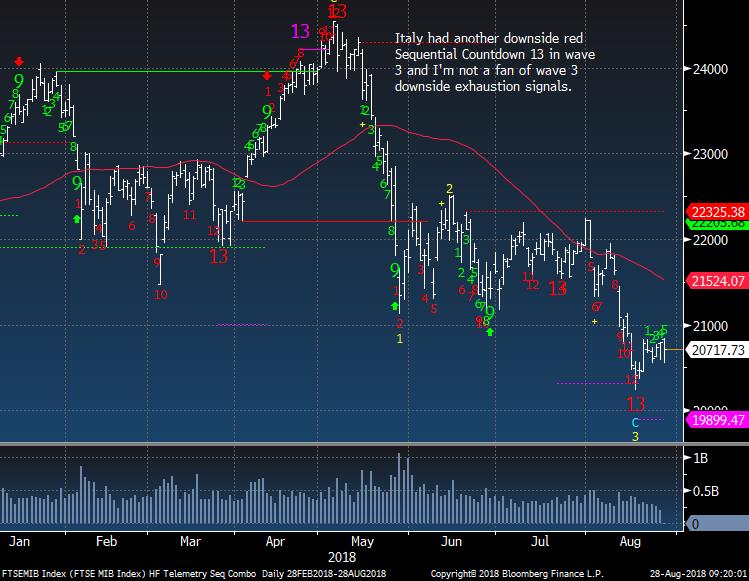
Italy couldn't get moving much after the downside 13. No rush to buy Italian stocks
|
|
|
|
|
|
|
|
|
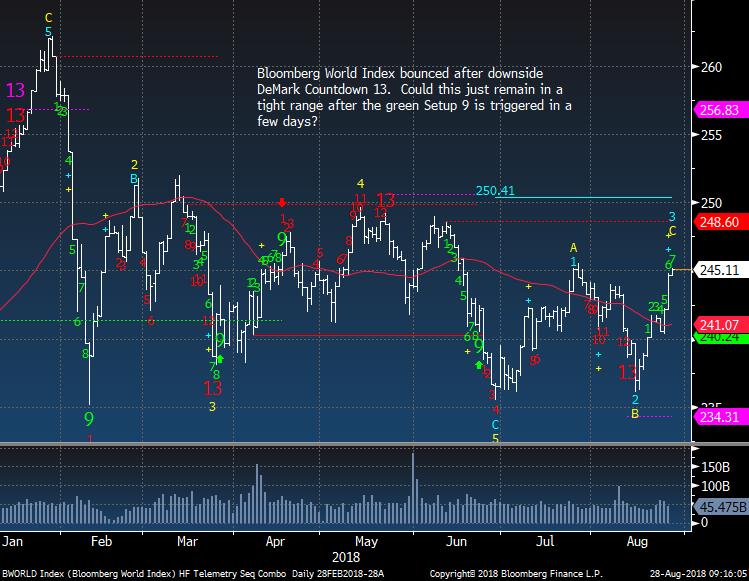
Bloomberg World Index bouncing but still well off highs
|
|
|
|
|
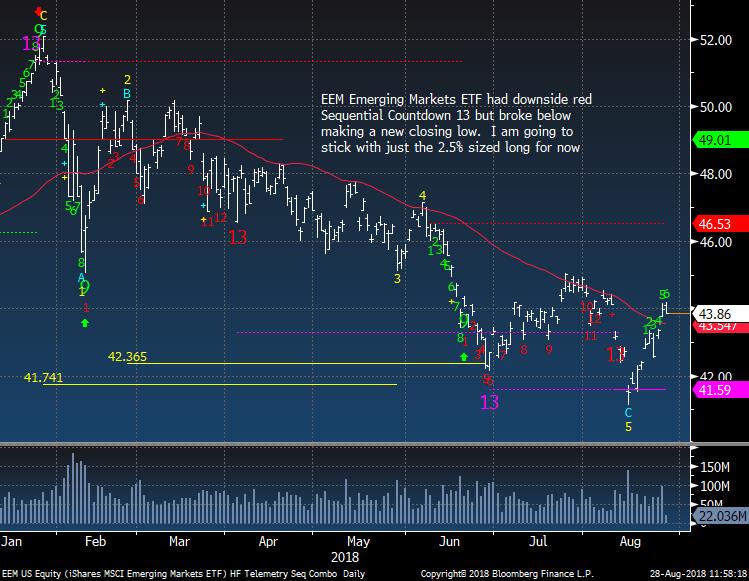
EEM Emerging Markets ETF still like it long
|
|
|
|
|
|
|
|
|
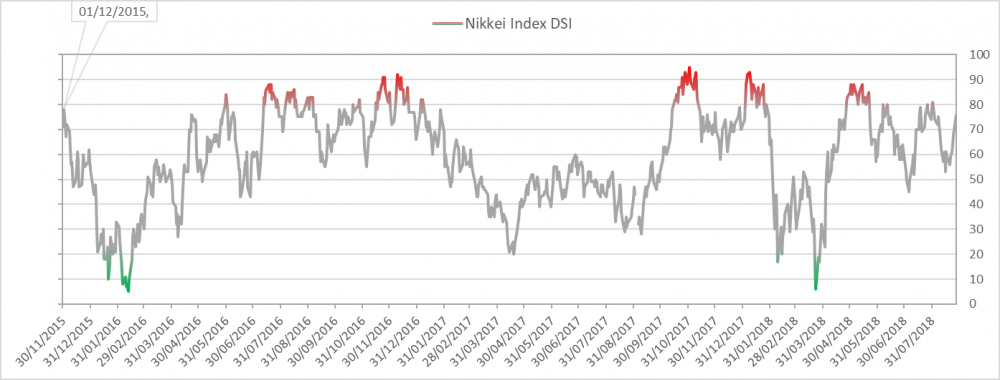
Nikkei bullish sentiment is at 76%
|
|
|
|
|
Nikkei should get the upside exhaustion in the next few days
|
|
|
|
|
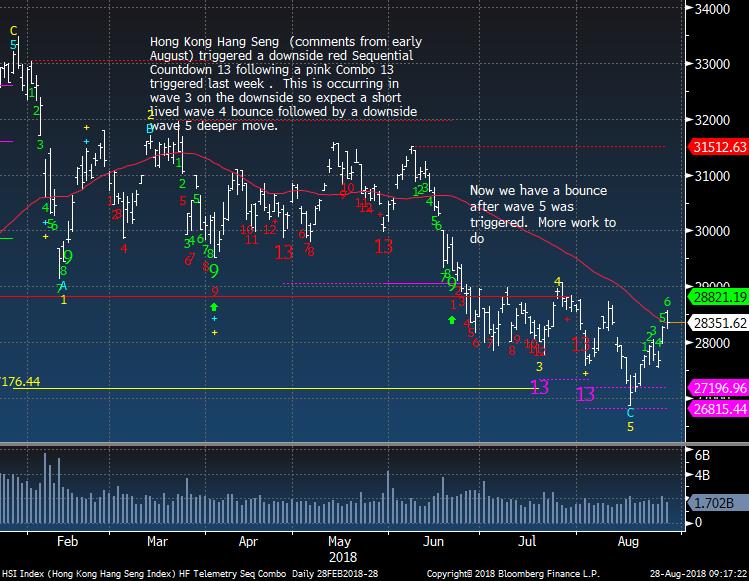
Hong Kong traded up but closed near the low. Still more work needed
|
|
|
|
|
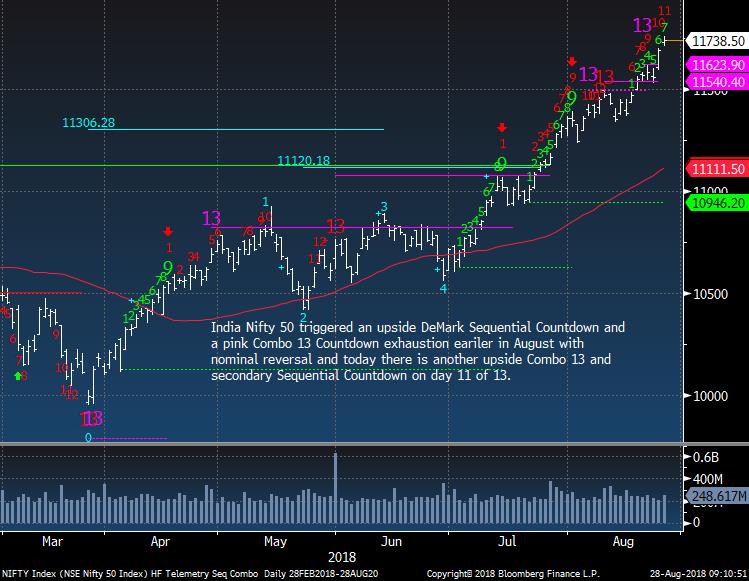
India's Nifty 50 on day 11 of 13 now
|
|
|
|
|
|
|
|
|
Crude bullish sentiment is at 85% and is extreme
|
|
|
|
|
|
|
|
|
|
|
|
|
Gold bullish sentiment is at 42% and another new high for this move
|
|
|
|
|
Gold still has work to do but it seems to be moving in the right direction albeit a bit slow
|
|
|
|
|
|
|
|
|
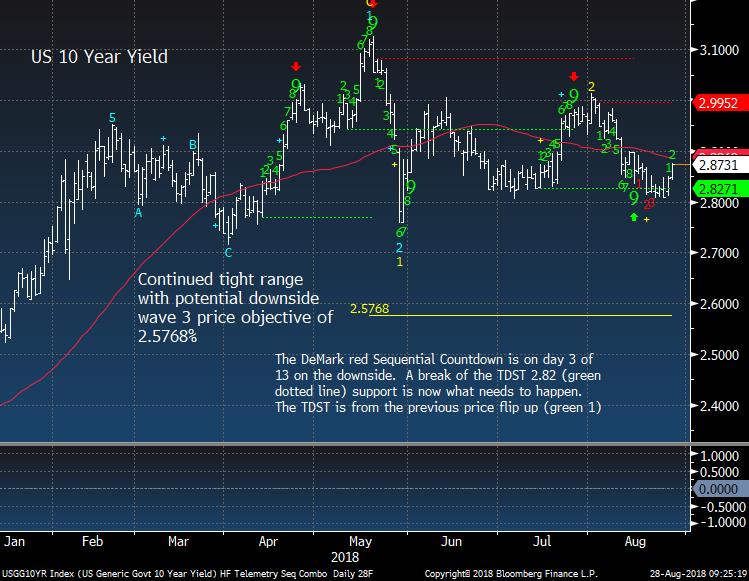
Bond bullish sentiment is at 72%
|
|
|
|
|
US 10 year yield I feel should move lower but it just can't break the downside at 2.80%
|
|
|
|
|
|
|
|
|
|
|
DEMARK SCREENS - Daily, Weekly, Monthly Upside/Downside Exhaustion Signals
|
|
|
Daily/Weekly DeMark upside/downside exhaustion signals (Sequential) weekly updated on Monday's and monthly on the first day of the new month. Price flips occur when a stock closes higher/lower than four previous closes and increases conviction of a price turn.
The upside 13's are sell signals and downside 13's are buy signals. Price flip's are confirmation signals that increases potential for a price trend change. For example, if you are long a stock and there is an upside 13, you will want to take cautious action by selling down or out of a position. If initiating a short sale with the upside 13's, we tend to start with a 1/2 size and add with the downside price flip. The opposite is true for when there are downside 13's. Take a 1/2 size position
and add with the upside price flip. The DeMark Indicators are designed to assist the user with buying into weakness and selling into strength to anticipate trend exhaustion. Selling into a rally and buying into a decline often afford the opportunity to exit a trade without too serious a loss if wrong.
S&P 1500 Universe:
DAILY UPSIDE 13: ACIW, ADBE, AMGN, AMSF, ATR, BDC, BLL, BMS, CACI, CDNS, CRM, FIS, FISV, GPN, HMSY, ISRG, KIRK, LAMR, MA, MAA,
MANT, MCO, MSI, NSC, ORCL, RTN, TYL, WFC, WM
DAILY DOWNSIDE 13: EWBC
DAILY UPSIDE WITH PRICE FLIP REVERSAL DOWN: ASH, DG, DISCA, HPT, STRA, TBI, UBA
DAILY DOWNSIDE WITH PRICE FLIP REVERSAL UP: ETFC, EV, LTM
Updated: 8/27/18
WEEKLY UPSIDE 13: AGYS, ANF, ARQL, CNC, DIN, DOV, ELY, EME, GCO, IT, MED, NSC, TMK, TUES, TYL, WSM, YUM
WEEKLY DOWNSIDE 13: PM
Updated: 8/1/18
MONTHLY UPSIDE 13: AIZ, ATR, BIO, CBU, CDNS, CMS, CSX, DGX, EE, FCN, FIX, GTY, HAE, HAS, IDXX, IEX, KSU, MA, NI, NPK, PTC, RLI, ROL, WEC
MONTHLY DOWNSIDE 13: CIR, HIBB
Euro Stoxx 600 Universe:
DAILY UPSIDE
13: AC FP, DSV DC, LOGN SW, MAERSKB DC
DAILY DOWNSIDE 13: NONE
DAILY UPSIDE WITH PRICE FLIP REVERSAL DOWN: COLR BB
DAILY DOWNSIDE WITH PRICE FLIP REVERSAL UP: NONE
Updated: 8/27/18
WEEKLY UPSIDE 13: HXS LN, UCB BB, IVS SM
WEEKLY DOWNSIDE 13: BAYN GR, DC/ LN, HUH1V FH, TKA GR
Updated: 8/1/18
MONTHLY UPSIDE 13: TEMN SW
MONTHLY DOWNSIDE 13: CO FP, GETIB SS, RXL FP, TALK LN
|
|
|
Unsubscribe me from Hedge Fund Telemetry
Hedge Fund Telemetry LLC, P.O. Box 4675, Greenwich, CT 06861, United States
CONFIDENTIALITY NOTE and DISCLAIMER: This message is for the named person's use only. It may contain confidential, proprietary or legally privileged material. No confidentiality or privilege is waived by any accidental or unintentional transmission. If you receive this message in error, please immediately delete it and all copies of it from your system, destroy any hard copies and notify the sender. You must not, directly or indirectly, use, disclose,
distribute, print or copy any part of this message if you are not the intended recipient. Hedge Fund Telemetry LLC. cannot guarantee the confidentiality of the material transmitted; therefore, information of a sensitive or confidential nature should not be transmitted. There is risk in trading markets. Hedge Fund Telemetry LLC reports are based on information gathered from various sources and believed to be reliable, but are not guaranteed as to accuracy and completeness. The information is subject to change without notice and Hedge Fund Telemetry LLC has no obligation to provide any updates or changes. Hedge Fund Telemetry LLC is providing this data for informational and educational purposes and does not believe that it is sufficient to base an investment decision on. This information should not be regarded as a solicitation or recommendation of any particular security or to engage in any trading strategy. One should always check with your licensed financial
advisor to determine suitability of any investments.
|
|
|
|
|