If you are having difficulty seeing this email, you can view in your browser or click here to
print.
|
|
|
|
|
04/18/2024
Thomas Thornton
info@hedgefundtelemetry.com
|
|
|
Retest is the new healthy correction
|
|
|
I'm starting to hear more chatter (from perennial bulls) of a coming "Retest" as if it's a good thing. Just like when I heard "Healthy Correction" which didn't feel that way for bulls when it was in progress. Considering how we saw massive ETF outflows with the recent correction (quick trigger fingers) I continue to expect lower lows with the back drop of weaker sentiment. Let's review a little...
In December bullish sentiment for the S&P was extreme with
>80% bulls and I had recommended for a few months to have ~25% cash especially considering the S&P and every index had an unusually calm (no pullbacks) and strong year of performance. In mid January, bullish sentiment hit record highs (96% bulls), momentum indicators on every time frame were at record highs (RSI's day, week, month, quarter, year >80%) and all we heard was a constant FOMO. I dipped my toes in the water on the short side with a 5% AUM size with some OTM April puts with the SPY, QQQ, and IWM. As a clarification, I size everything at inception of a trade at 2.5% or 5% of my total AUM. It's a sizing formula that works for me and if I'm right it works out fine and if stopped out, my month doesn't get blown up. And second note, I set stops when I do the trade at reasonable levels usually 5% away from the entry. Sometimes tighter and occasionally wider depending on what I'm trading. My job is not to be a hero but to maintain a discipline
so I can make hay when the sun shines, survive storms and deliver on my performance goals. On today's note, I am increasing short exposure and posting charts of 20+ S&P 500 stocks that are short candidates. Each one will have a no questions asked stop out level and I would advise using your own risk tolerances which includes minimal sizing for each.
On 2/8 and 2/9 at the lows on this recent correction, I laid out sufficient evidence that a bounce was likely and I sold those puts for a 4x gain. More than I expected and I felt lucky. My call was that the bounce would be a lower high (wave 2/B) bounce with the belief a lower low (from 2/9) was a probability. One of the reasons was bullish sentiment dropped from 96% to 9% within a couple weeks and even Jake Bernstein (who runs the Daily Sentiment Index) told me he's
seen it before but it's rare. My call was it would go back to the mid point at 50% (it hit 52%) and fade. Earlier this week I said to ring the register on some recent gains off the lows. I believe the bounce is likely complete at least for a majority of stocks.
Just because sentiment gets oversold it doesn't equate to a buy signal as it can stay low for a period of time. In August-September 2015 the market was hit hard and sentiment hit 5% but the S&P dropped another 200 handles with the low sentiment readings. In January 2016 bullish sentiment hit 7% and finally bottomed 5 weeks later. I pointed out how it was very likely a period of more than a week was likely for a bottom to
develop. Even when the market was dropping hard recently and with volatility was spiking, the fear wasn't really there. A week later, CNBC was back to "What to buy now." I know if you have a long term time horizon buying markets at the top is rewarded overtime and buying good companies at the top is rewarded most of the time. But I'm different. Back in Q3 2007 there was a thing Jim Cramer came up with called the "Four Horseman of Tech" Apple, Amazon, Google and Blackberry (for old timers - Research in Motion). You were rewarded if you held 3/4 of them but you had to suffer through a +50% pullback on all of them. 50%... When that happens, to get back to even they have to go up 100%. 100%... If you work at a hedge fund that has a risk management bone in their body, you can't and won't let anything drop more than 10%. You're out of the game with many firms if you loose 5%. I believe we are in a period where having the flexibility and discipline to trade both long and short (with tight stops and proper sizing) as well to have a larger cash percentage will be prudent.
Lastly, I am watching for support the VWAP levels calculated from 2/9 3:30pm lows. SPY 268.78, QQQ 162.45, IWM 150.60, DIA 248.55. Breaking these levels could see an acceleration in selling.
Notable:
- The most important index charts I'm watching today and US sentiment
- Short Candidates from within the S&P 500
- Crude Update
- Lumber - Extreme sentiment combined with upside exhaustion
- DeMark Screens
|
|
|
|
|
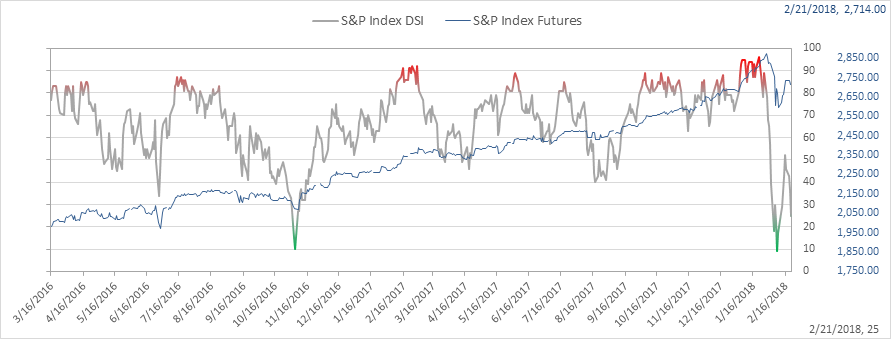
SPX bullish sentiment is at 25%. It hit 96% in January (a record), then dropped to 9% in February, bounced to 52% and now is at 25%. THIS is why it is so vital to look at this everyday
|
|
|
|
|
|
|
|
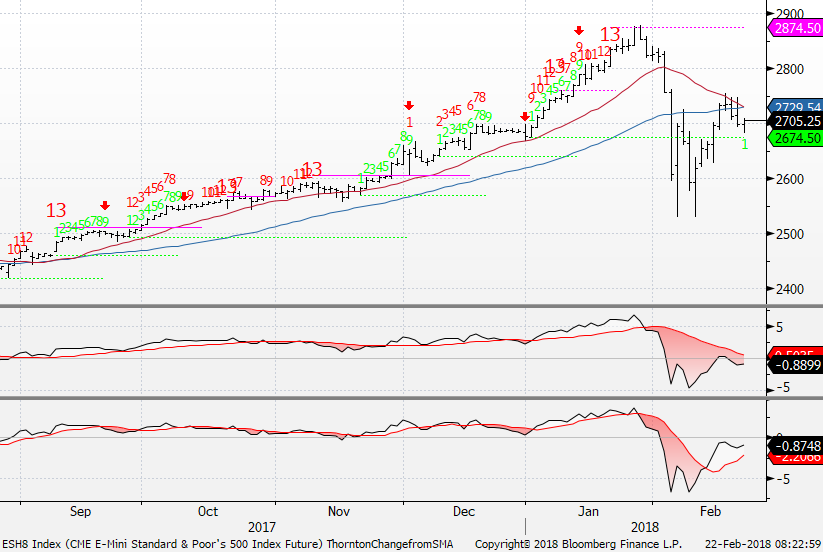
SPX futures has a downside price flip down and the green Setup count that was in progress was nullified as the pattern of 9 consecutive days higher than 4 previous closes was interrupted. A price flip is when a new direction starts with a new 4 day low or high. A low in this case. Even with the higher levels from when I pulled this chart the price flip is there. It has to be over 2734 to have the upside Setup continue
|
|
|
|
|
|
|
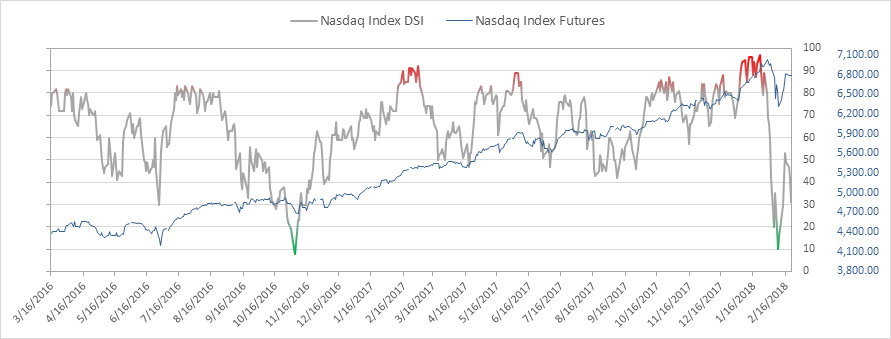
Nasdaq bullish sentiment is at 31%
|
|
|
|
|
|
|
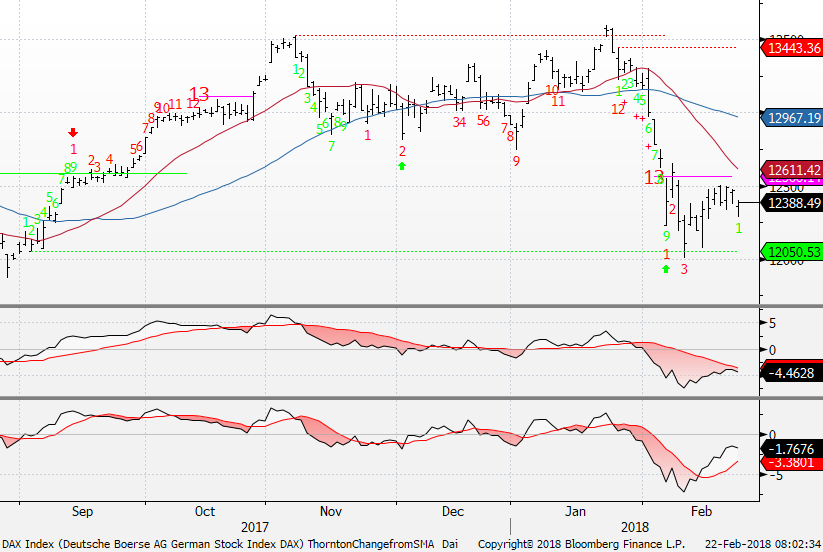
German DAX also lost the upside green Setup and has a price flip down
|
|
|
|
|
|
|
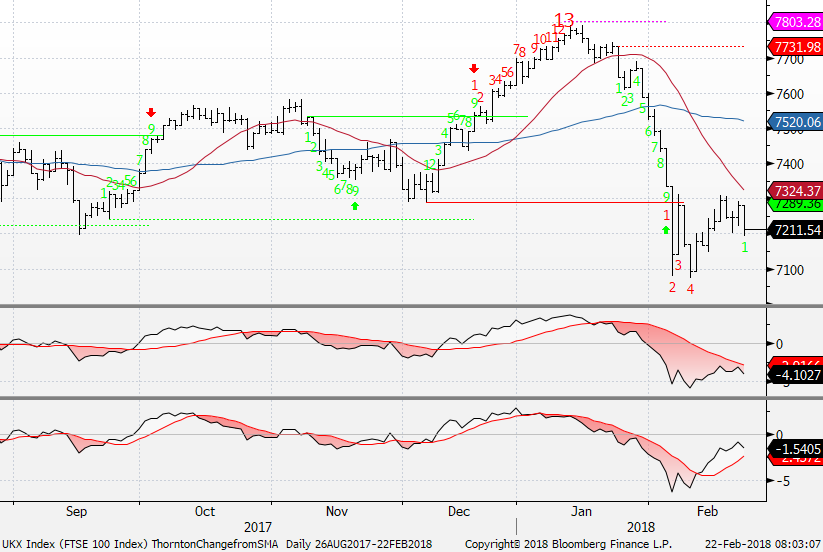
UK FTSE also lost the upside Setup and has a price flip down
|
|
|
|
|
|
|
|
|
|
|
|
|
|
|
|
|
|
|
|
|
On all of these short candidates, there are several attributes of the screening process. Some have already dropped into a downside wave pattern and some have recent upside exhaustion signals. There are couple that should move a little higher to achieve an upside exhaustion too.
I try to avoid
"The Obvious" when it comes to shorting and that includes some with crowded shorts or those that attract shorts whenever there is a down move. However on occasion I will break the "obvious" rule when there is a stock that I can live with some of the volatility knowing you just have to be there. There are no obvious shorts in this list.
|
|
|
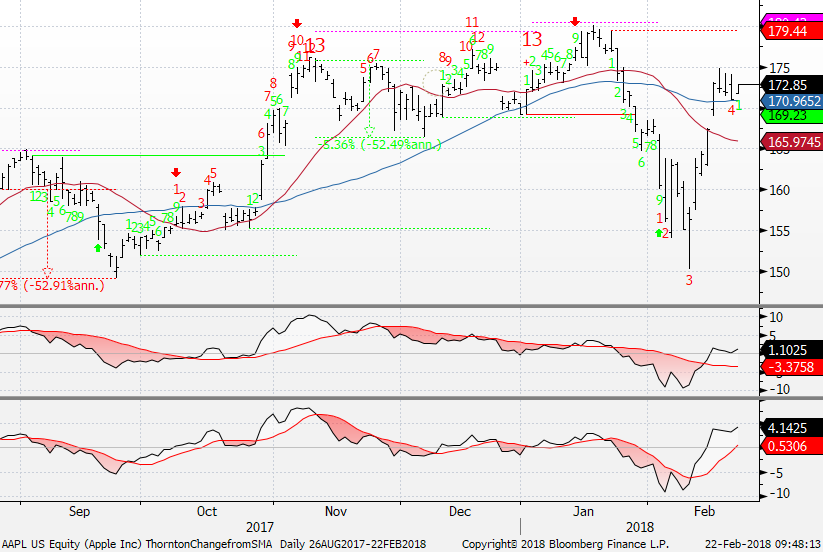
AAPL had several upside exhaustion signals last quarter and has broken down. The bounce is likely complete as there is a downside red Countdown on day 4 of 13 and take a look at the last 3 days bars - they closed well off the highs and on the lows suggesting supply is entering. 182 stop
|
|
|
|
|
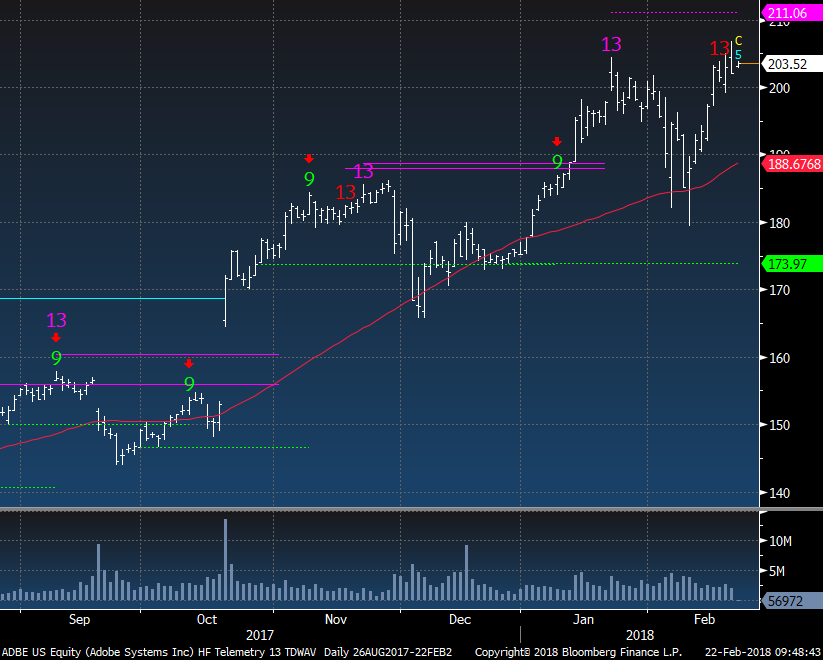
ADBE has been a monster stock but also one that has seen good inflection after upside exhaustion signals. 211 stop
|
|
|
|
|
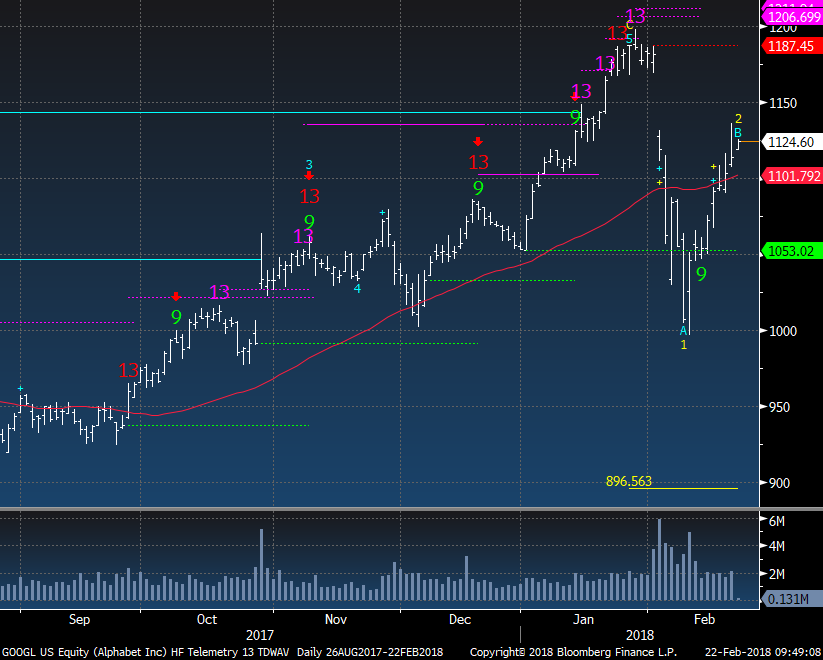
GOOGL has some recent upside exhaustion signals with a gap down after earnings. There is a downside wave 3 price objective of 896. With wave price objectives, they are calculated by taking the difference between the top and the bottom of the first wave down multiplied by 1.618 and subtracted from the top. They serve as a
guide and may or may not be achieved. The bigger issue is the wave pattern. 1190 stop
|
|
|
|
|
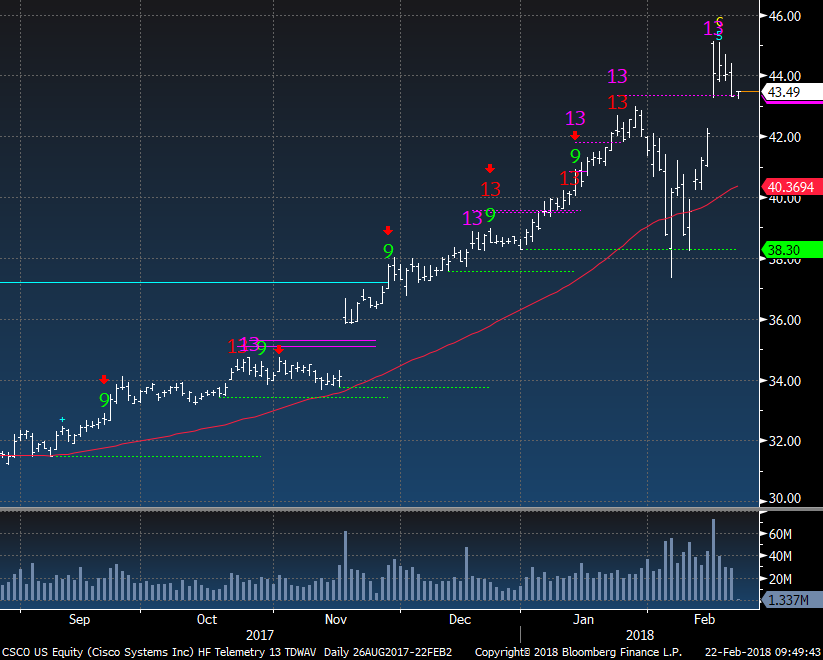
CSCO just had a good earnings report gapped up with an upside exhaustion (catching shorts off sides where they likely covered). This could fill the gap to the downside. 46.00 stop
|
|
|
|
|
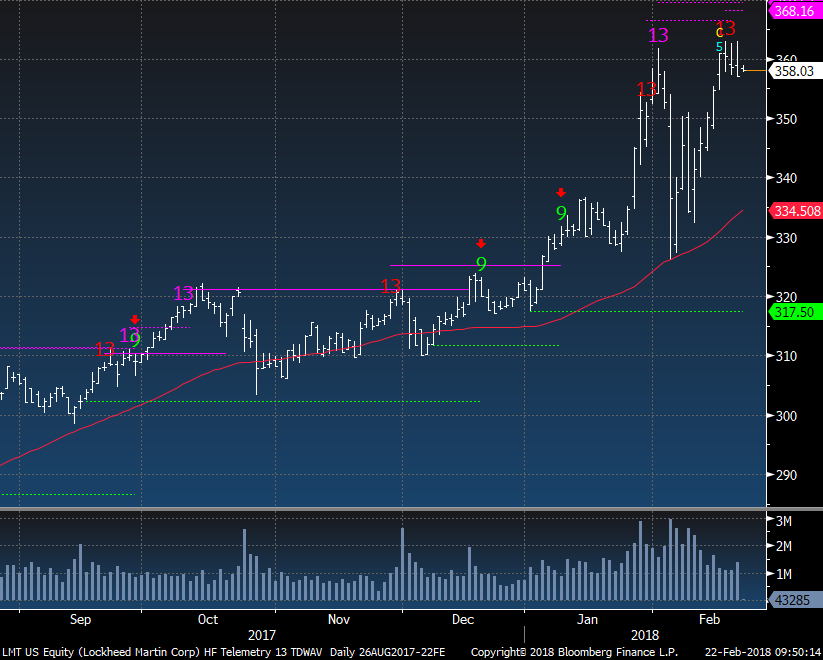
LMT moved quickly off the February lows and had another upside exhaustion. It's extended now. 375 stop
|
|
|
|
|
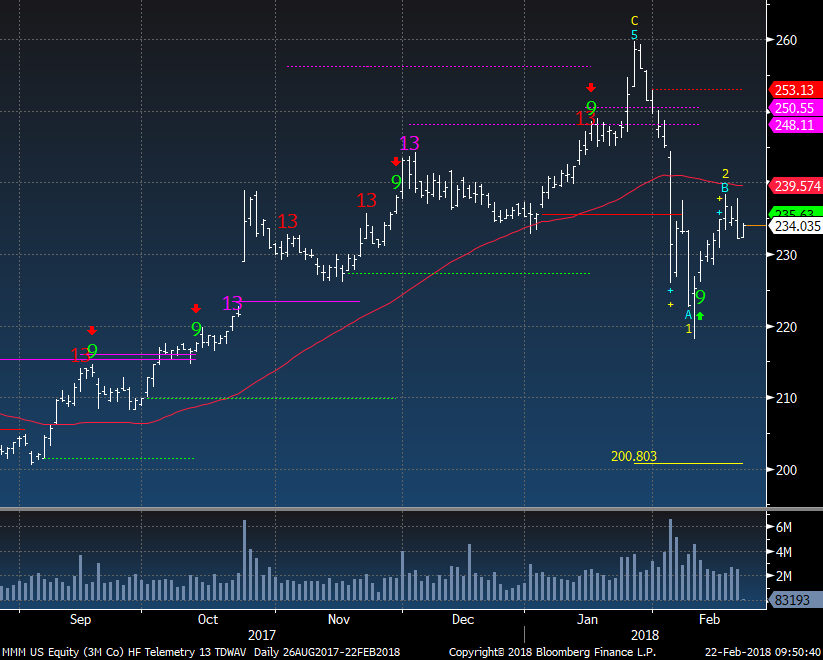
MMM had a steep drop, bounced and failed at the 50 day moving average. There is a downside wave 3 price objective of 200.80. 253 stop
|
|
|
|
|
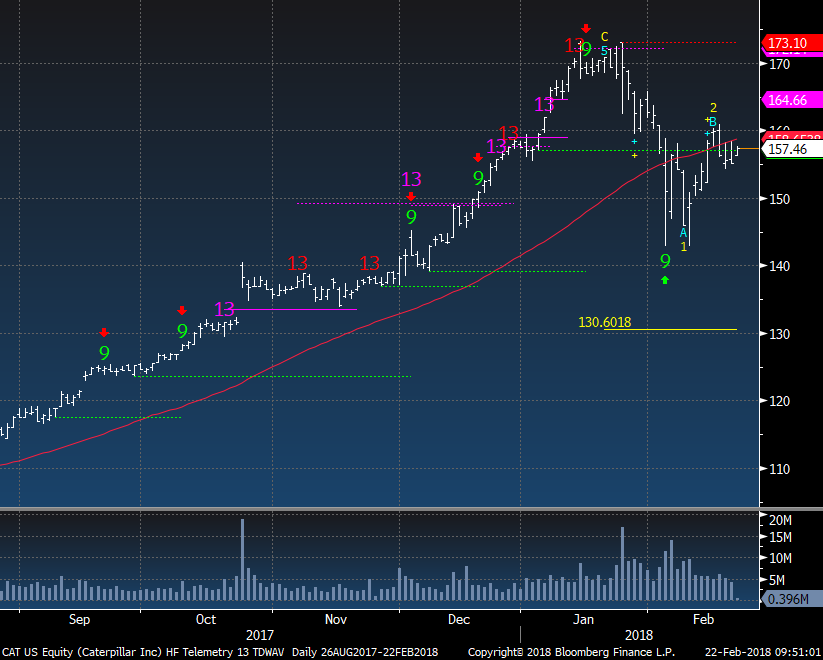
CAT also had a steep drop, bounced and looks to be failing at the 50 day. There is also besides the recent upside daily exhaustion signals (which finally worked) a weekly AND monthly upside signals too. 170 stop
|
|
|
|
|
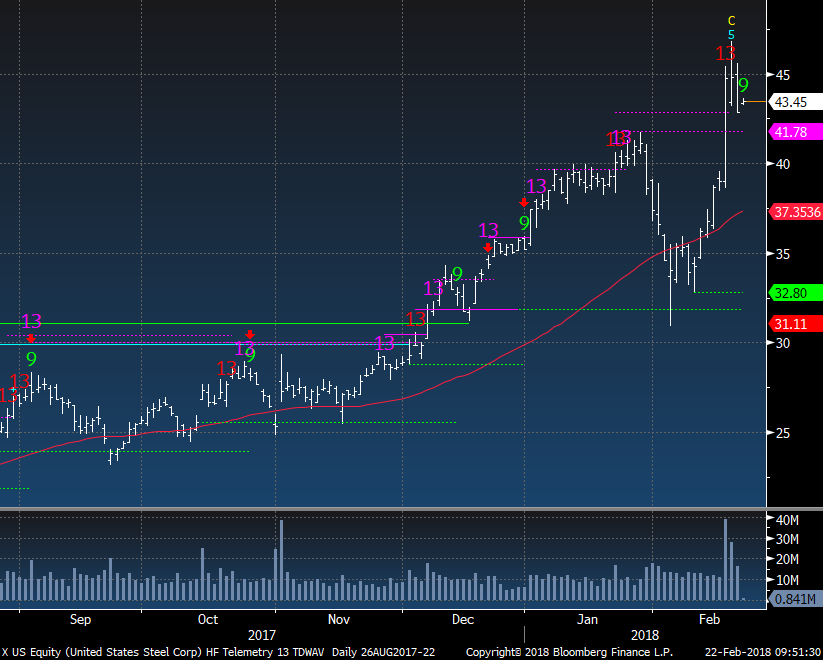
X US Steel spiked and had a new upside exhaustion signal and now is off the highs. Just as a note the recent high in January was the top of wave 5 and the drop in February was the first down wave BUT with the new high the wave 5 to the upside continues and the downside wave is null.
|
|
|
|
|
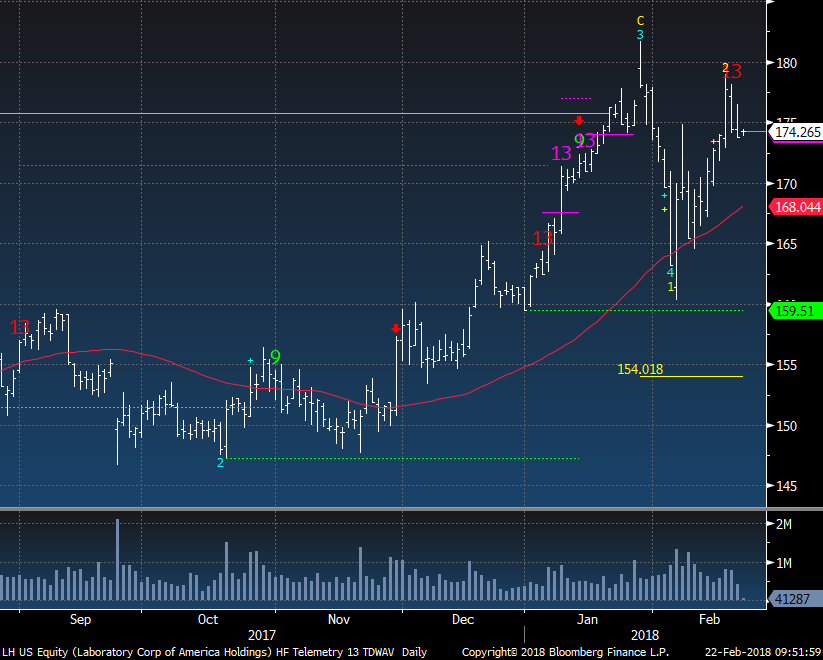
LH bounced and had an upside exhaustion and there is a downside wave pattern potentially in play. 182 stop - a little tighter
|
|
|
|
|
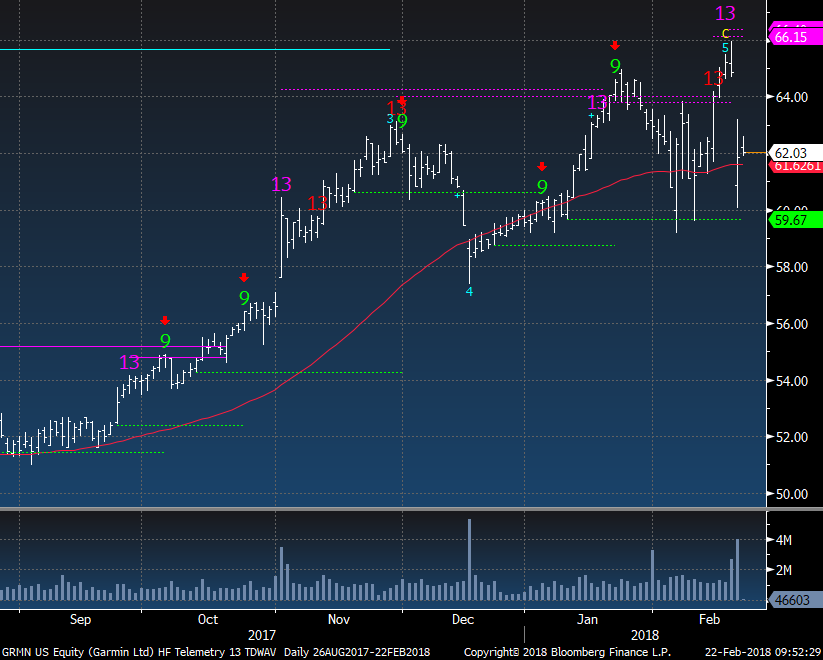
GRMN had a nice upside exhaustion followed by a gap lower. This has support between 58-60 and if this can break, there is an air pocket to 50. 68 stop
|
|
|
|
|
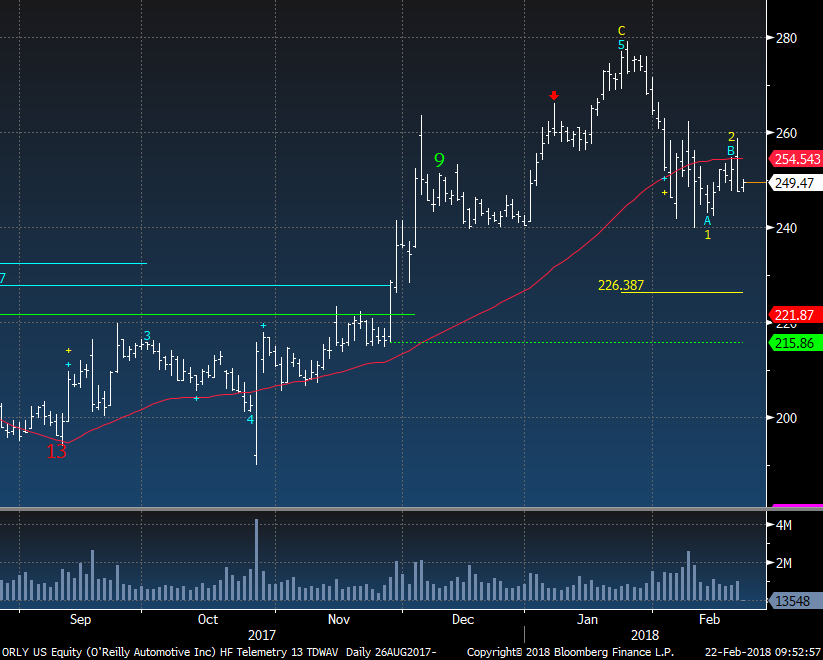
ORLY has a downside wave 3 target at 226.38 and has a lot of support at 240. If that breaks then this could go all the way back to 200. 265 stop
|
|
|
|
|
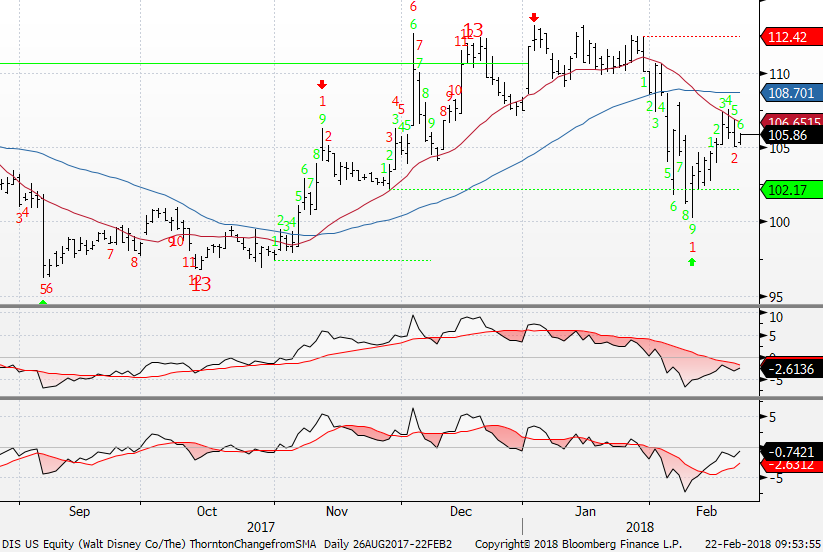
DIS had upside exhaustion in December (right when Star Wars came out) and fell in February. The bounce has found resistance under the 50 day (blue line) and there's a downside red Countdown but also a green Setup in play. 111 stop.
|
|
|
|
|
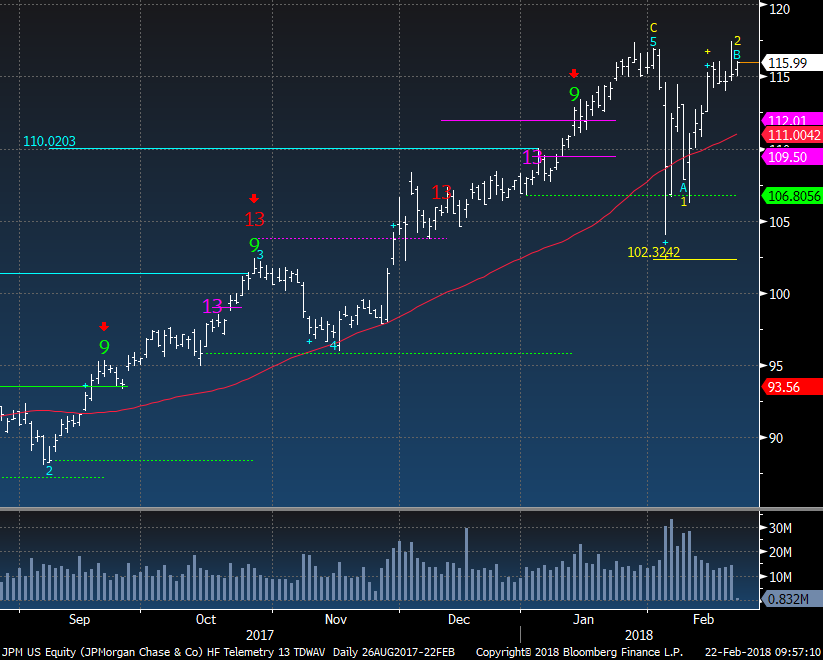
JPM is all about threading the needle. This is on day 12/13 but has to move just a little higher (above the 8th red bar - yes I know it's hidden) for the exhaustion 13. If a new high happens the 2/B reverts to the continuation of 5th wave which had a price objective of 110.02. 120 stop
|
|
|
|
|
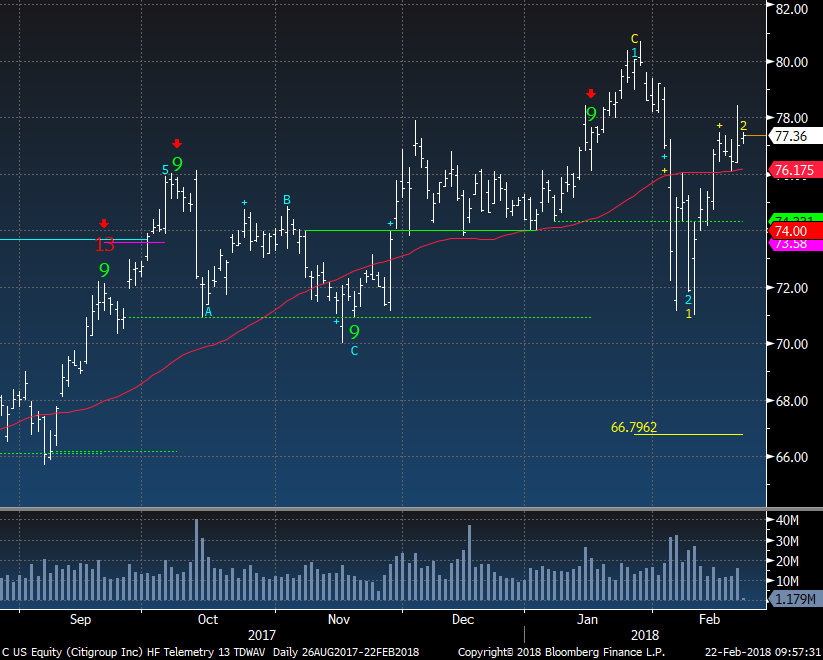
C Citi has actually been one that I have liked on the long side for a while but feel the downside wave pattern could be stronger. 82 stop
|
|
|
|
|
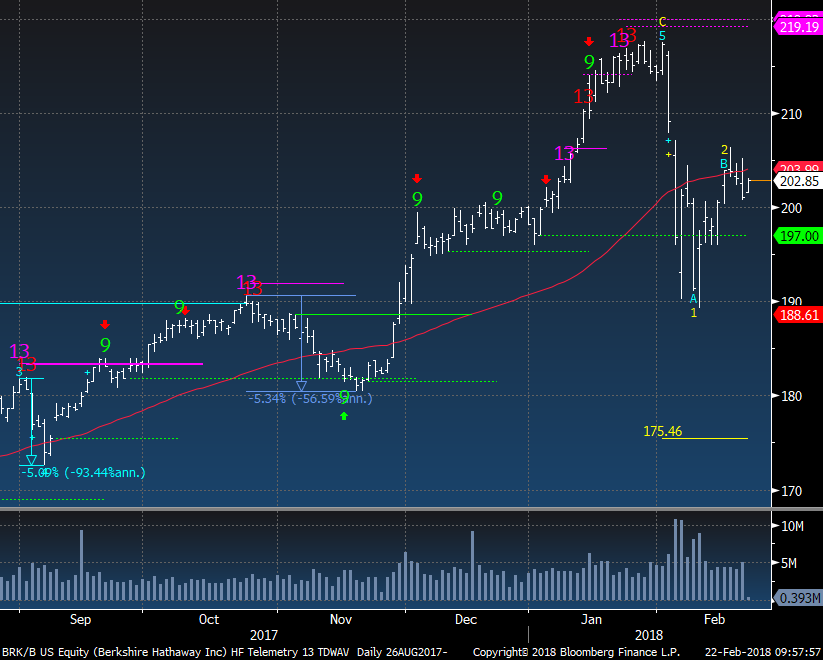
BRK/B This weekend is when Berkshire's Buffett releases his yearly letter and people will be reading it for all sorts of value investing wisdom. Enjoy it. I like this short with the wave pattern as well all of the recent upside exhaustion signals. 212 stop
|
|
|
|
|
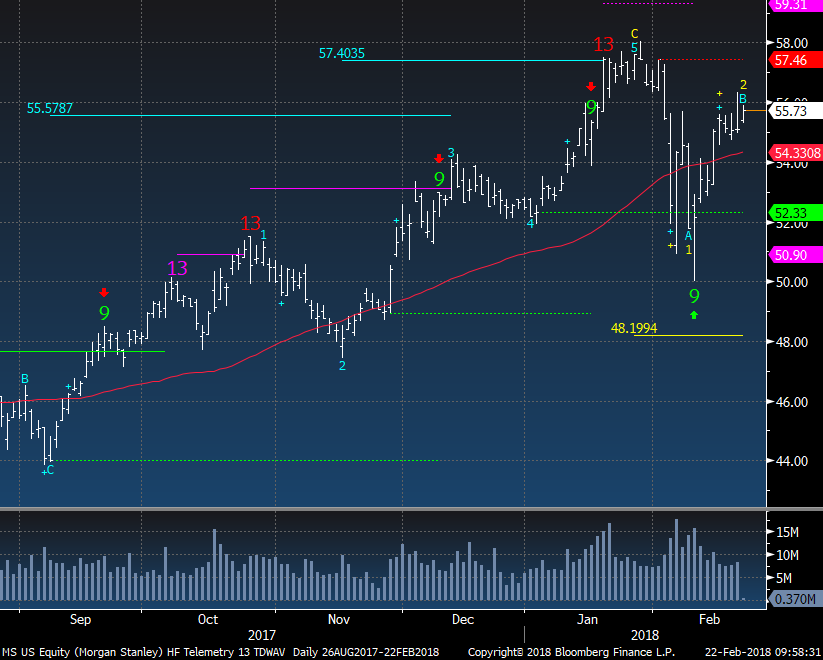
MS also has bounced very strong like some of the others. 59 stop
|
|
|
|
|
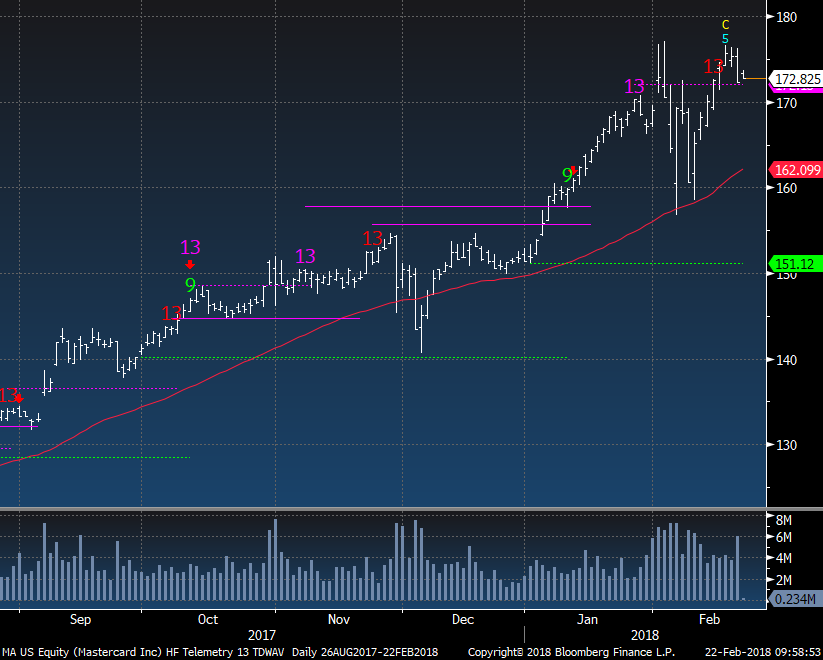
MA is a beast of a stock but there's a recent upside exhaustion that I believe could see this back at the 50 day moving average or lower. (red line) 180 stop
|
|
|
|
|
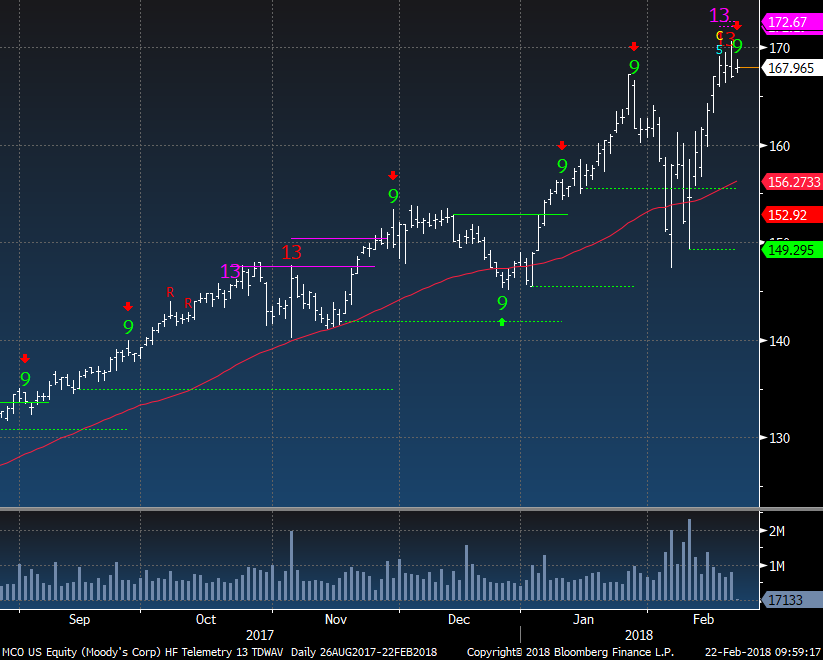
MCO has a cluster of some upside exhaustion - pink Combo, red Sequential and green Setup. 174 stop
|
|
|
|
|
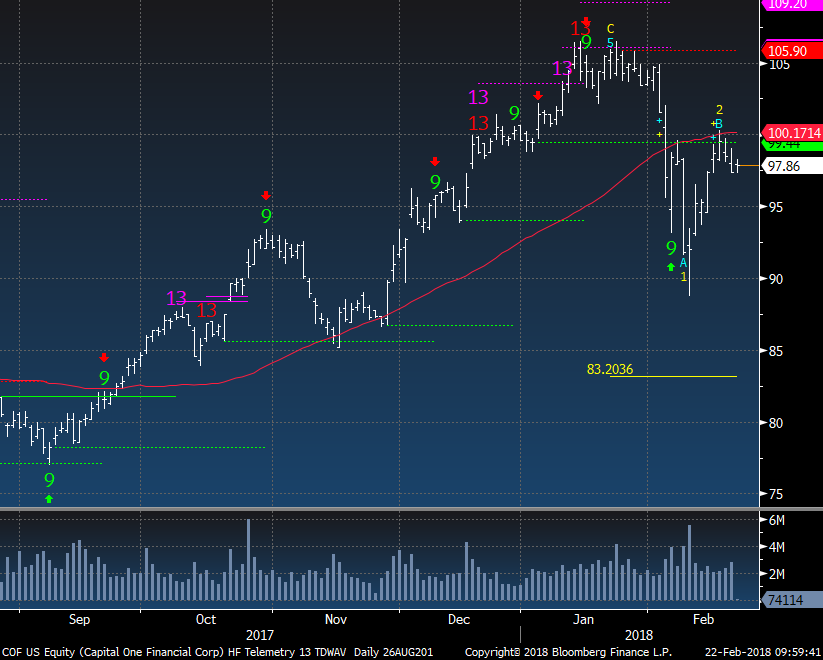
COF had some upside clustering exhaustion signals at the recent highs, dropped and bounced to under the 50 day. There is a downside wave 3 price objective of 83.20. 106 stop
|
|
|
|
|
|
|
|
|
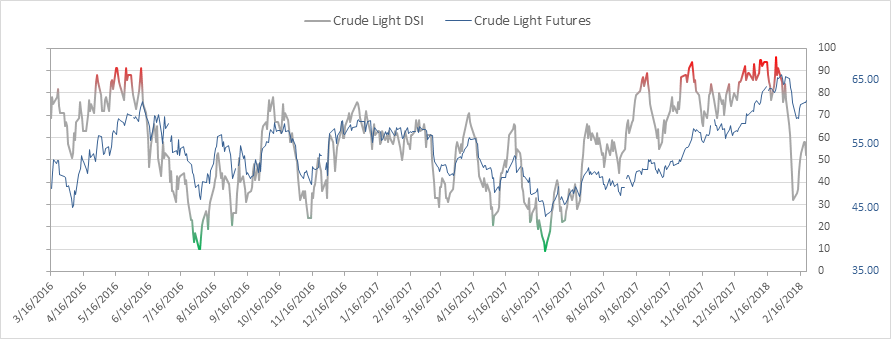
Crude bullish sentiment is at 52% and could be making a lower high after the recent drop and bounce. Crude seasonality is good in February-June but I've found that when it's run up in Q4 historically not good seasonality, the spring disappoints the bulls. Lastly remember speculators are positioned very bullish and that's not a great sign either.
|
|
|
|
|
|
|
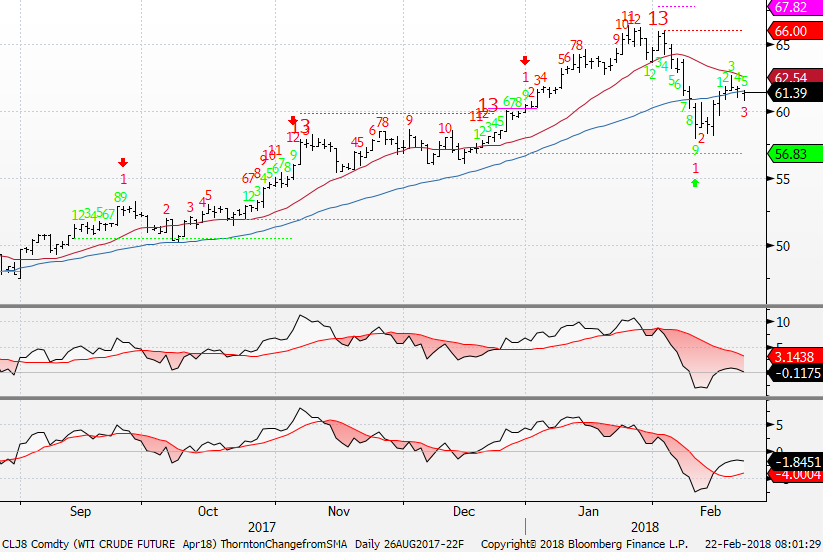
WTI Crude futures had a nice upside exhaustion that worked better than the last one, dropped, bounced to the 50 day and now has a downside Countdown on day 3 of 13 but there's an upside green Setup on day 5 of 9 so I'll be monitoring this close.
|
|
|
|
|
|
|
|
|
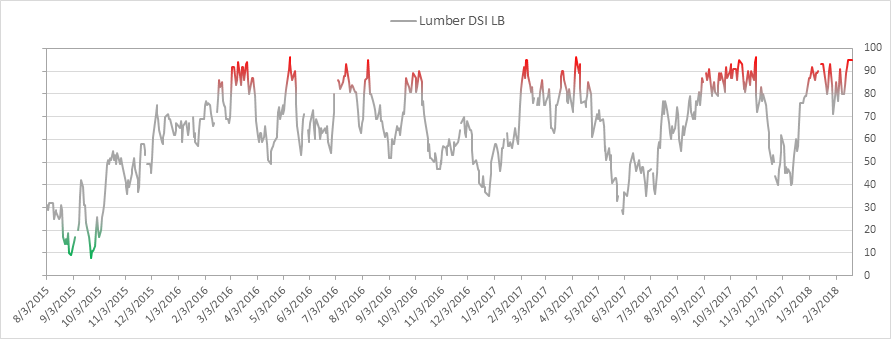
Lumber bullish sentiment is at 95% for the 3rd day in a row. It's been strong no doubt
|
|
|
|
|
|
|
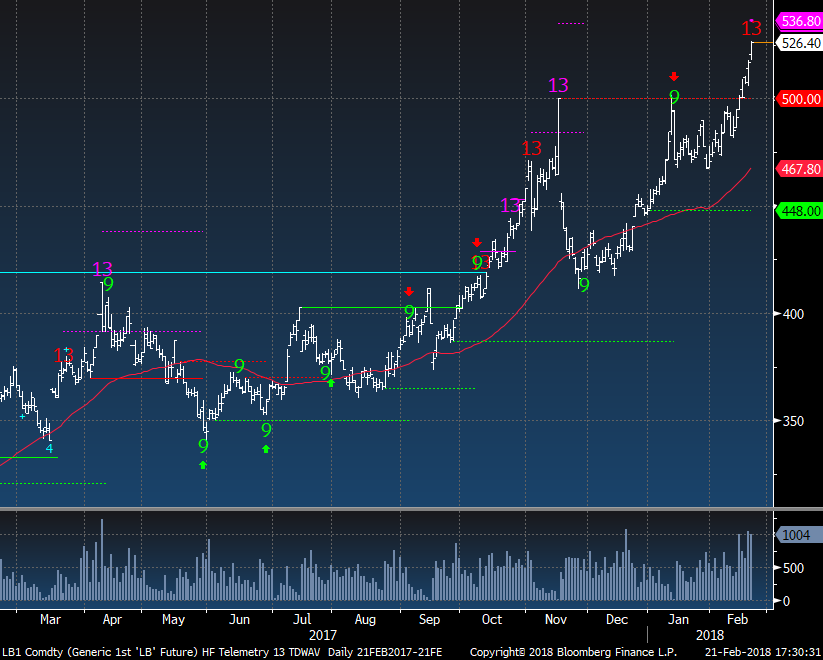
Lumber futures had an upside exhaustion yesterday and combined with the extreme bullish sentiment I would be a seller
|
|
|
|
|
|
|
DEMARK SCREENS - Daily, Weekly, Monthly Upside/Downside Exhaustion Signals
|
|
|
Daily/Weekly DeMark upside/downside exhaustion signals (Sequential) Weekly updated on Monday's. Price flips occur when a stock closes higher/lower than four previous closes.
S&P 1500 Universe:
DAILY UPSIDE 13: ASTE, RHT, SHLM, SMP
DAILY DOWNSIDE 13: AKR, EXC, FORR, FRT, HR, KRG, WRI
DAILY UPSIDE WITH PRICE FLIP REVERSAL DOWN: CATM, CBSH, CPSI, GRMN, HAYN KAMN, MA, MSI, PRAA, TXRH
DAILY DOWNSIDE WITH PRICE FLIP REVERSAL UP: CRVL
Updated: 2/20/18
WEEKLY UPSIDE 13: AOI
WEEKLY DOWNSIDE 13: ACN, ANDE, HWKN, MTSC, PSA
Updated: 2/1/1
MONTHLY UPSIDE 13: CHD, CLGX, CLX, CNMD, DVA, FICO, IDCC, MSCI, ORLY, PAYX, TFX, VMC, XYL
MONTHLY DOWNSIDE 13: GPOR
Euro Stoxx 600 Universe:
DAILY UPSIDE 13: AC FP, IGG LN, SRT3 GR, VWS DC
DAILY DOWNSIDE 13: DGE LN, ESNT LN
DAILY UPSIDE WITH PRICE FLIP REVERSAL DOWN: AMEAS FH
DAILY DOWNSIDE WITH PRICE FLIP REVERSAL UP: NONE
Updated: 2/20/18
WEEKLY UPSIDE 13: AC FP, DB1 GR
WEEKLY DOWNSIDE 13: INTU LN, INVEB SS, ITV LN, MKS LN, NCCB SS, PFC LN, PROX BB, SESG FP, TELIA SS
Updated: 2/1/18
MONTHLY UPSIDE 13: COFB BB, GAS SM, GKN LN, ING FP, KINVB SS, OML LN, VIS SM
MONTHLY DOWNSIDE 13: NONE
|
|
|
Unsubscribe me from Hedge Fund Telemetry
Hedge Fund Telemetry LLC, P.O. Box 4675, Greenwich, CT 06861, United States
CONFIDENTIALITY NOTE and DISCLAIMER: This message is for the named person's use only. It may contain confidential, proprietary or legally privileged material. No confidentiality or privilege is waived by any accidental or unintentional transmission. If you receive this message in error, please immediately delete it and all copies of it from your system, destroy any hard copies and notify the sender. You must not, directly or indirectly, use, disclose,
distribute, print or copy any part of this message if you are not the intended recipient. Hedge Fund Telemetry LLC. cannot guarantee the confidentiality of the material transmitted; therefore, information of a sensitive or confidential nature should not be transmitted. There is risk in trading markets. Hedge Fund Telemetry LLC reports are based on information gathered from various sources and believed to be reliable, but are not guaranteed as to accuracy and completeness. The information is subject to change without notice and Hedge Fund Telemetry LLC has no obligation to provide any updates or changes. Hedge Fund Telemetry LLC is providing this data for informational and educational purposes and does not believe that it is sufficient to base an investment decision on. This information should not be regarded as a solicitation or recommendation of any particular security or to engage in any trading strategy. One should always check with your licensed financial
advisor to determine suitability of any investments.
|
|
|
|
|