|
|
|
|
|
|
|
|
Fear of missing out season is in the air. As some of the major indexes hit new highs portfolio managers are gearing up for the final push into the year end. When a portfolio manager has a benchmark like the S&P up 7% YTD they want to beat it and in many cases they HAVE to beat it. Some portfolio manager will resort to some style drift and will move into something outside of their stated mandate or overweight something that is moving. I've seen it before 100 times. But this year
isn't so easy as the indexes might be telling you since the January high only a few of the major sectors are up from that level. And many are down 5% to 20%. Rotations within sectors are good and healthy but when markets are hitting new all time highs I'd like to see more than 10% of the indexes hitting at least 52 week highs. This divergence has been debated as those who are bullish focus on cumulative breadth which has been good although I see some limitations as well from a timing point of view, it is a terrible indicator. Yesterday I showed how the majority of sectors are being led by stocks with very low short interest. Typically fuel for a sustained rally is generated by shorts having to cover but this isn't the case and it also happened last January too. People were chasing performance. And when the music stopped suddenly the lack of natural buyers (short sellers) created a vacuum down of 10%. In January there were also an abundance of daily
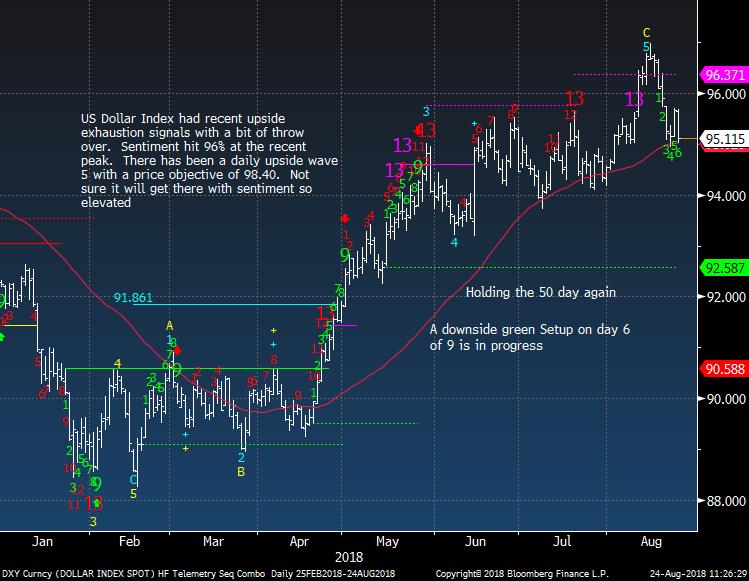
DeMark upside Sequential Countdown exhaustion signals while bullish sentiment was at 96% bulls on the S&P. Today bullish sentiment is elevated but not extreme.
Fed Chairman Powell stuck to the script as expected and the markets have responded today as they do on most days when there is some Fed activity. I have no changes to my cautious bias. Have a great weekend and thank you for your continued support.
- US Markets - Sentiment, Daily upside exhaustion signals now on just about every major US Index
- Hedge Fund Telemetry Trade Ideas - Bought long FEYE
- PPO Monitor - Weaker sectors
are being bought today
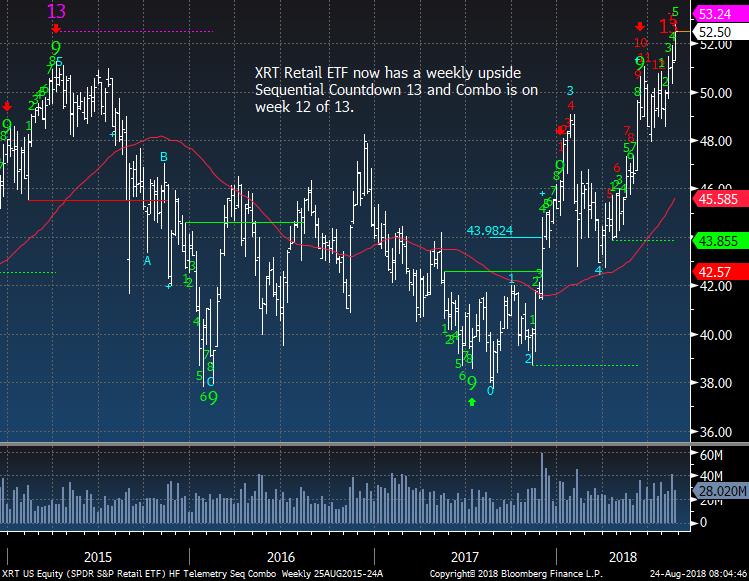
- XRT Retail ETF - Weekly chart
- A couple of stocks I'm watching NVDA, FEYE
- Amazon The most important stock in the world - On day 12 of 13 with upside Countdown
- Currency Update - An interesting wave 5 price objective now on Yuan
- European Market Update - Still like Euro Stoxx 50 slowly rising
- Global Market Update - Not a lot of momentum to get very excited but I'm getting constructive
- Asian Market Update
- Crude Update - Still has some room on the upside to go
- Gold Update - Best day in a long time catching up with improved sentiment
- Bond Update - US 10 year yield should go lower and HYG ETF near upside exhaustion
- DeMark Screens - Daily, Weekly, Monthly upside/downside exhaustion signals within the S&P 1500 and Euro Stoxx 600
|
|
|
|
|
Here's a link to the Hedge Fund Telemetry market sentiment page with 40 charts of sentiment including equities, bonds, currencies, and commodities updated each day.
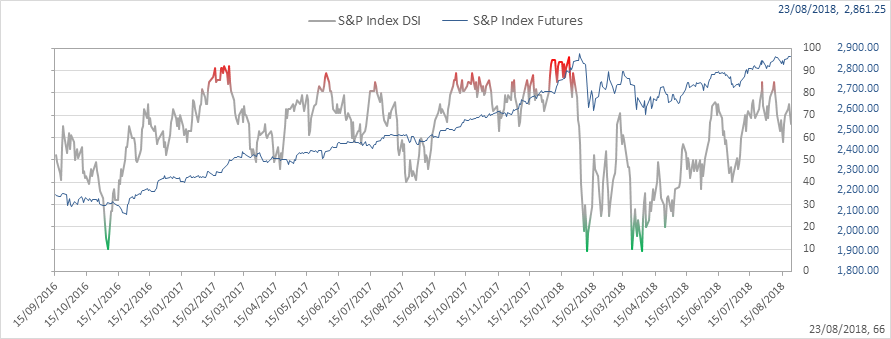
SPX bullish sentiment is at 66%
|
|
|
|
|
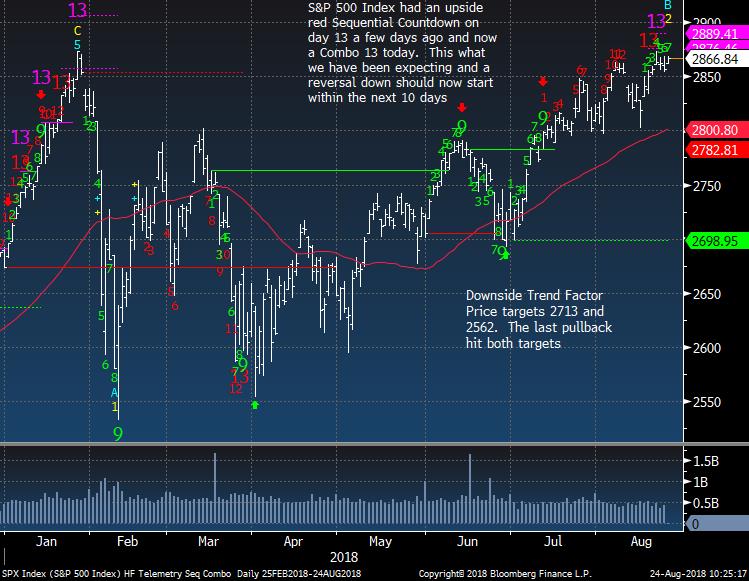
SPX daily upside Countdown 13's still in play
|
|
|
|
|
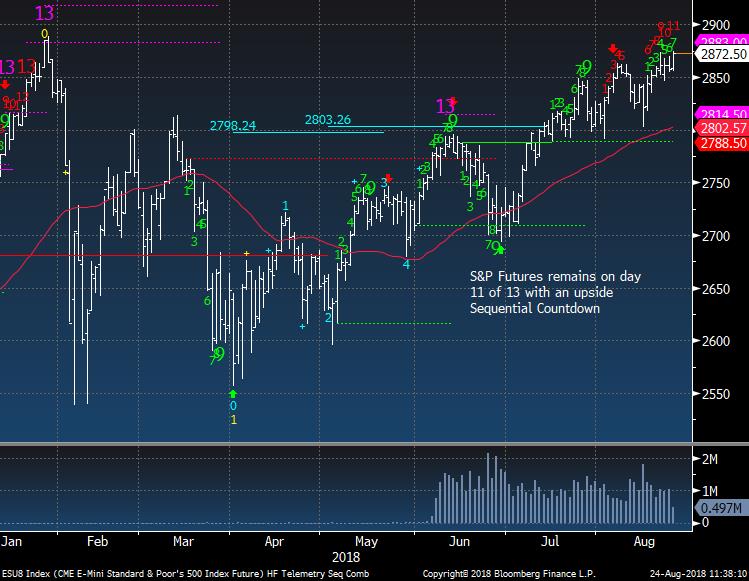
S&P Futures emini's on day 11 of 13
|
|
|
|
|
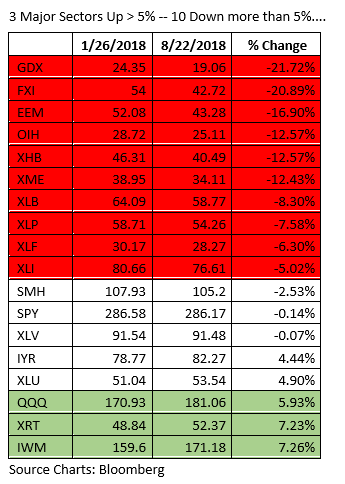
Tech and Consumer Discretionary are the notable major sectors above the January highs but look as some these below that are still down from January highs. This dispersion is why a lot of fund managers are trailing the S&P
|
|
|
|
|
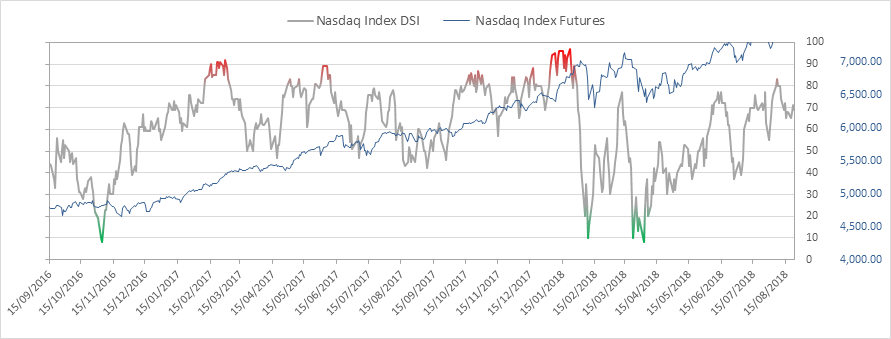
Nasdaq bullish sentiment is at 69%
|
|
|
|
|
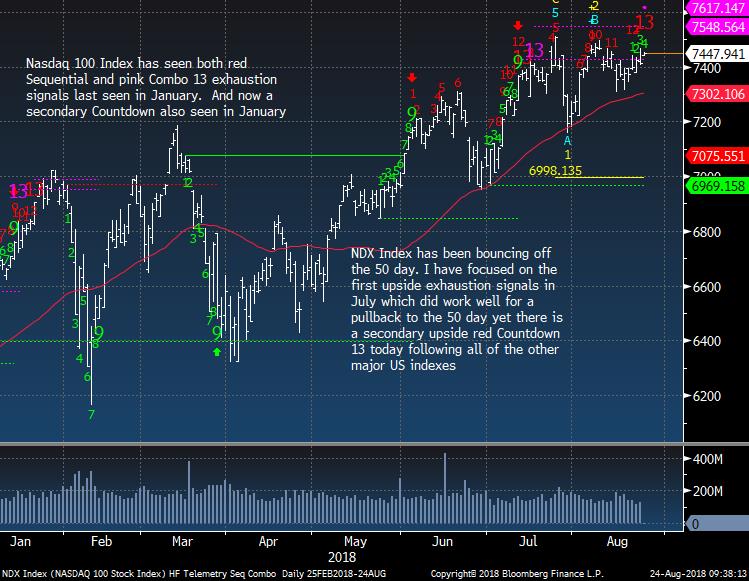
NDX Index got the upside Sequential Countdown 13 today
|
|
|
|
|
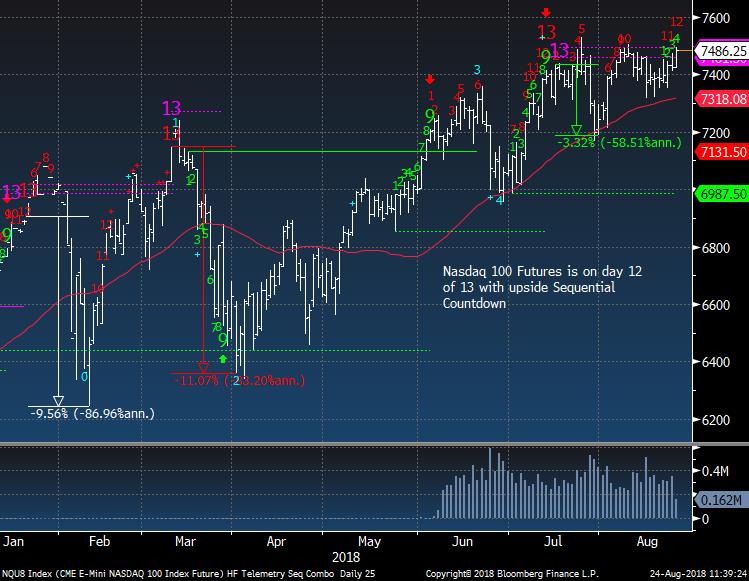
Nasdaq 100 Futures is on day 12 of 13
|
|
|
|
|
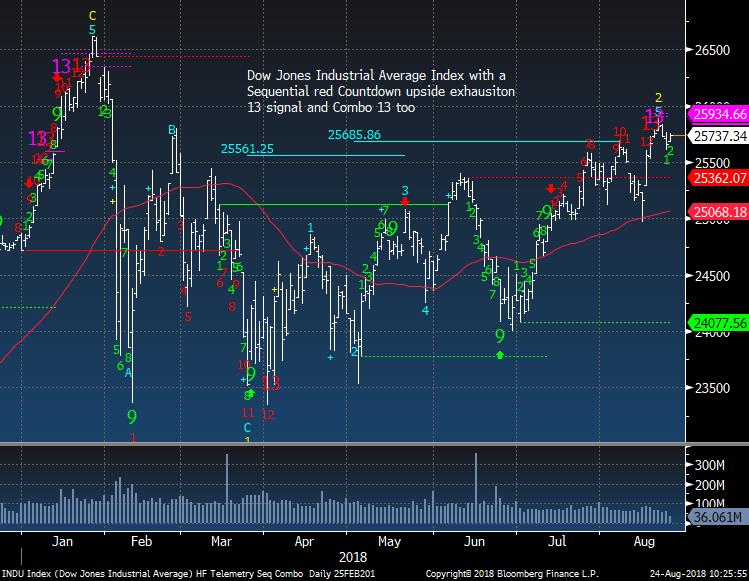
Dow Jones did not get above the January high and is stalling after some upside exhaustion signals
|
|
|
|
|
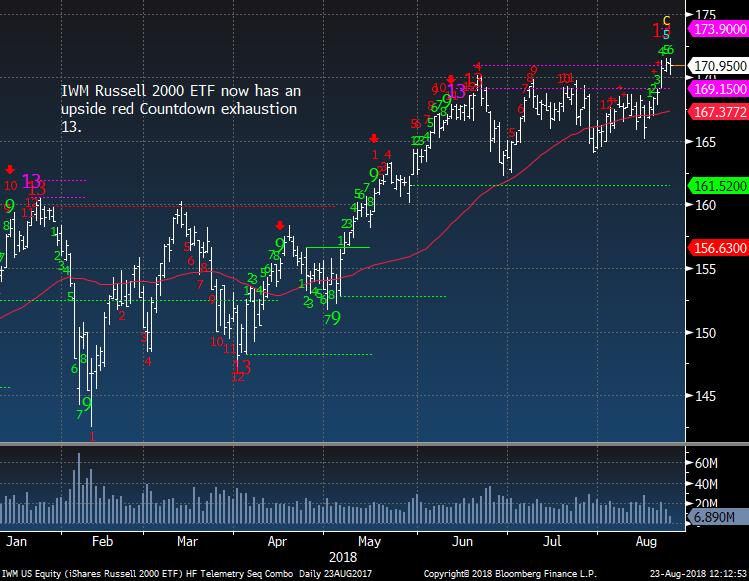
IWM Russell 2000 got the upside 13 two days ago
|
|
|
|
|
|
|
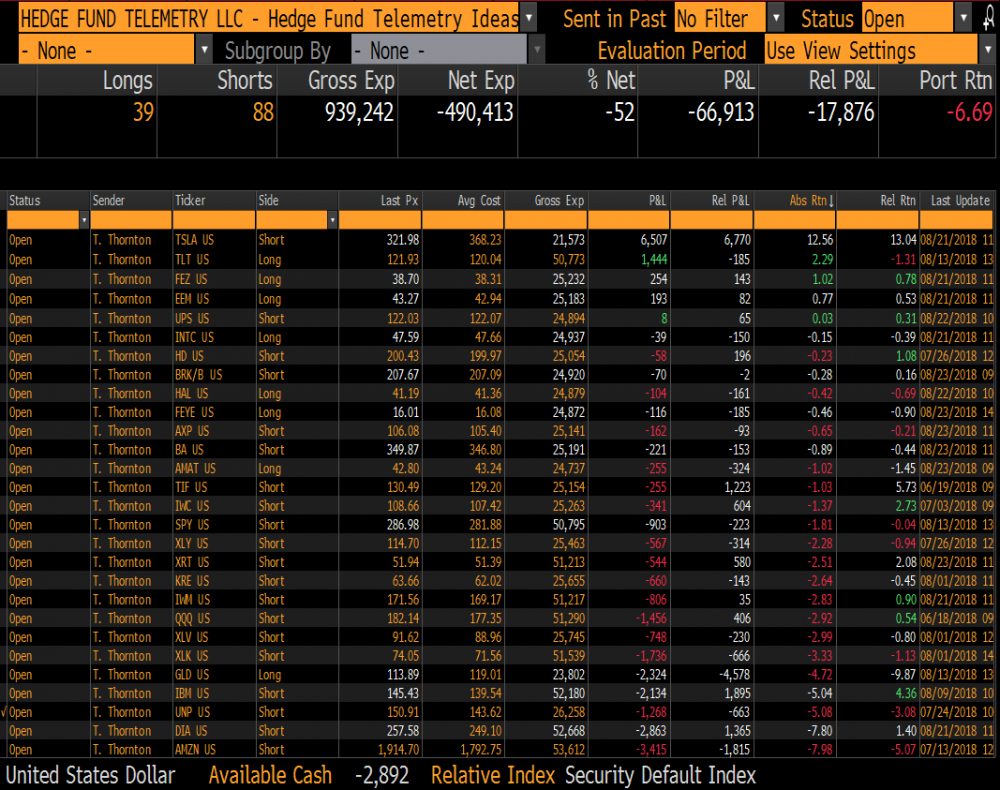
Hedge Fund Telemetry Trade Ideas
|
|
|
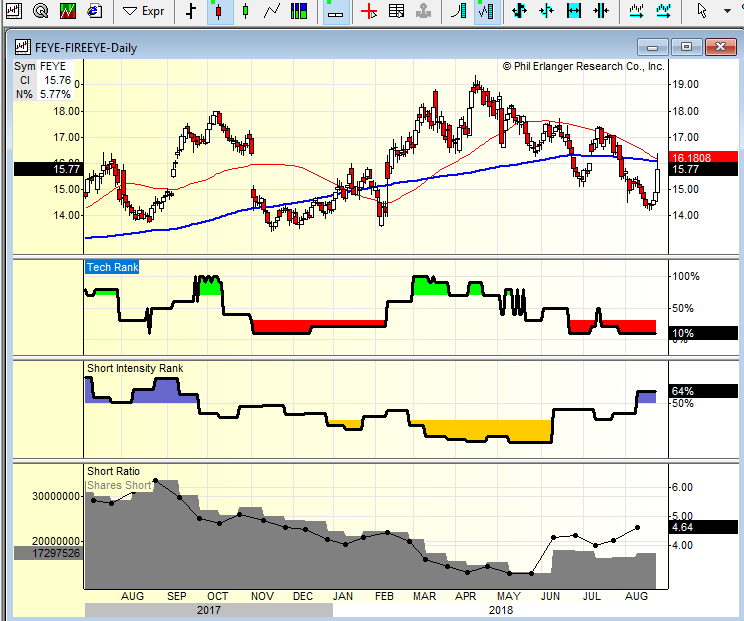
Trade Ideas -Added FEYE long 2.5% yesterday afternoon. I've talked about this one before and I like the security software space.
|
|
|
|
|
|
|
|
|
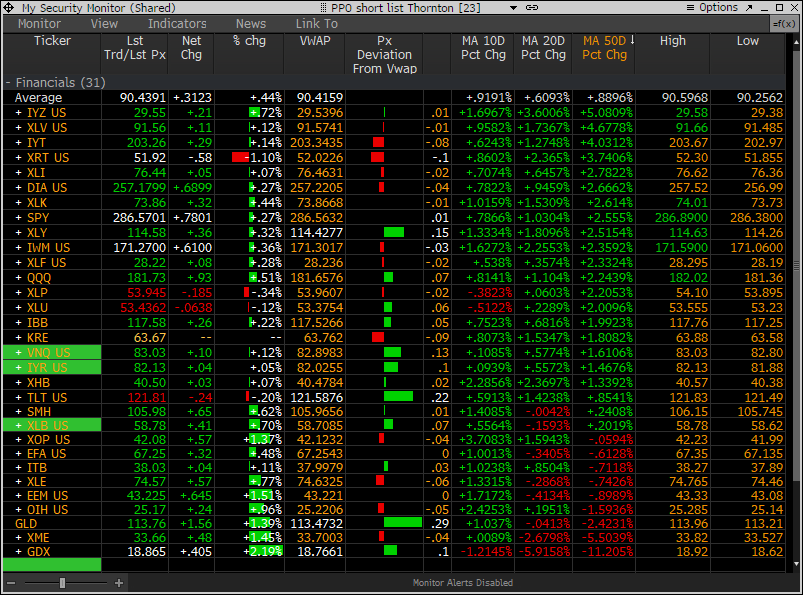
Notice the sectors that have been lately weak are leading today. XRT retail down the most today
|
|
|
|
|
|
|
|
|
This is the weekly of XRT. I expect a reversal in the coming weeks
|
|
|
|
|
|
|
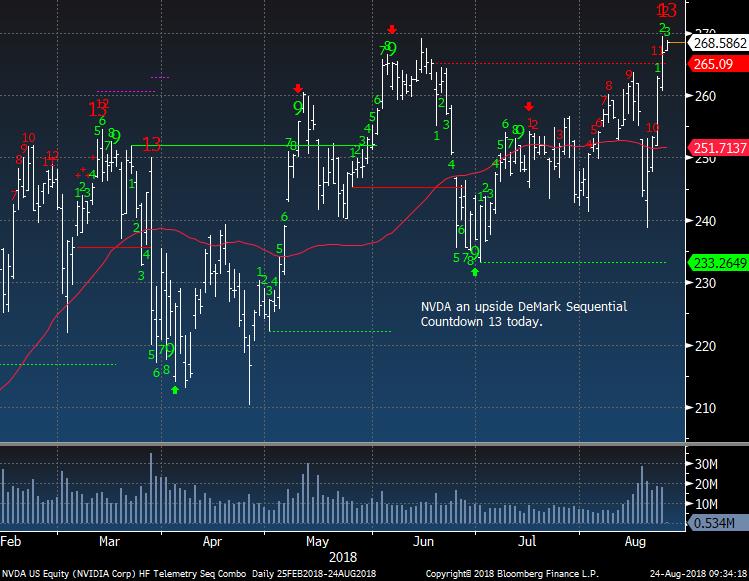
A couple stocks I'm watching
|
|
|
NVDA missed earnings dropped and then popped. This is a chasers stock but today there is a new upside Sequential Countdown 13
|
|
|
|
|
FEYE Fire eye is a new long and I like how the short intensity rank is lifting. The CEO has been saying at conferences how they feel very comfortable with the second half of 18 and beginning of 19. The next war will be cyber war. Google just hired them yesterday by the way.
|
|
|
|
|
|
|
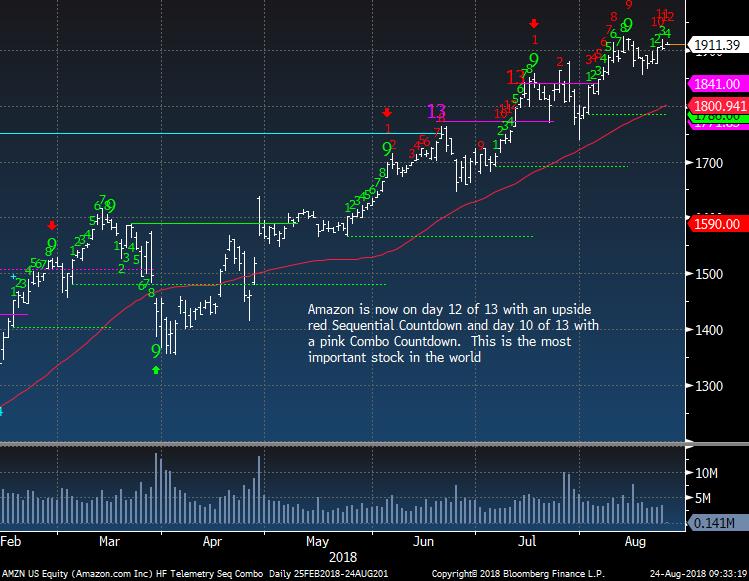
Amazon The Most Important Stock In The World
|
|
|
AMZN on day 12 of 13. Hopefully Monday we'll get the 13 upside exhaustion
|
|
|
|
|
|
|
|
|
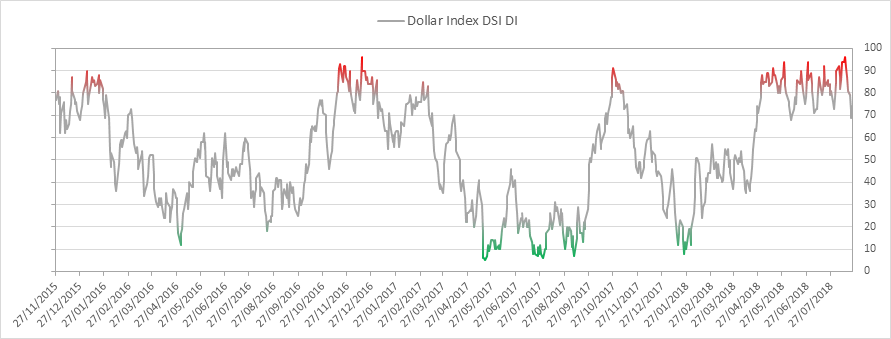
US Dollar bullish sentiment is at 74% down from recent high of 96%. At the time I said the USD will come back down
|
|
|
|
|
|
|
|
|
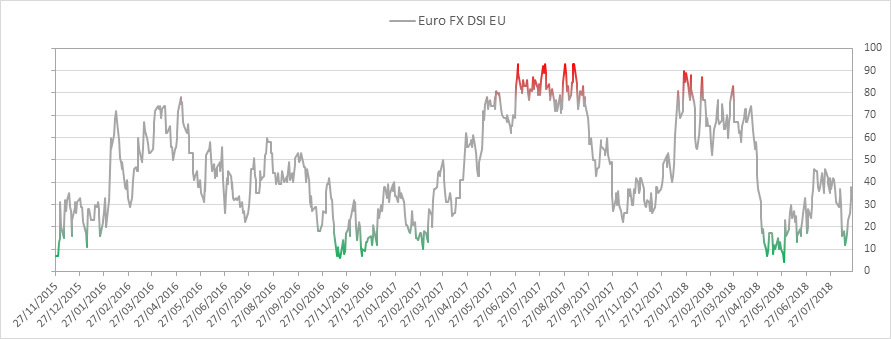
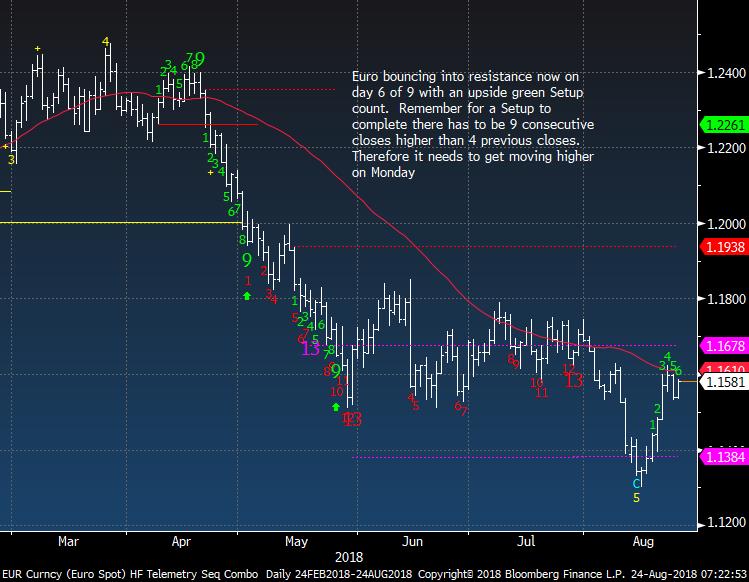
Euro bullish sentiment is at 33%
|
|
|
|
|
Euro Spot still not above the 50 day but close
|
|
|
|
|
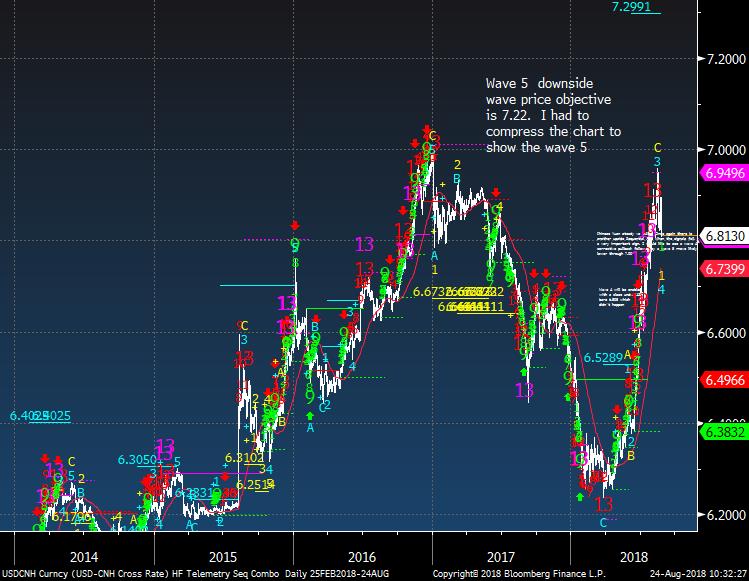
Chinese Yuan. I compressed this chart because it shows the downside wave 5 price objective of 7.2291. If this breaks 7.00 things could get out of control with many other markets.
|
|
|
|
|
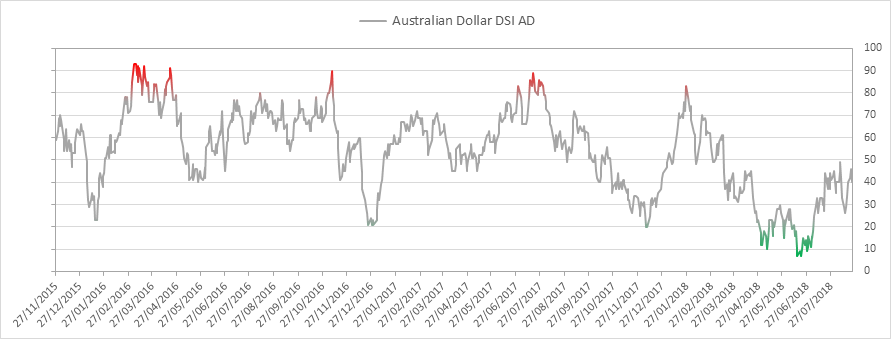
Australian Dollar bullish sentiment is at 40% and trying to move above 50%
|
|
|
|
|
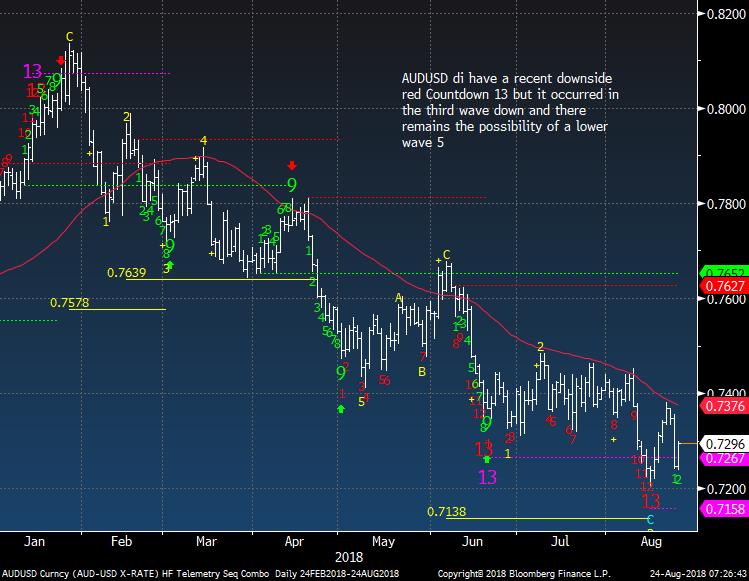
AUDUSD needs to move above the 50 day and 0.74
|
|
|
|
|
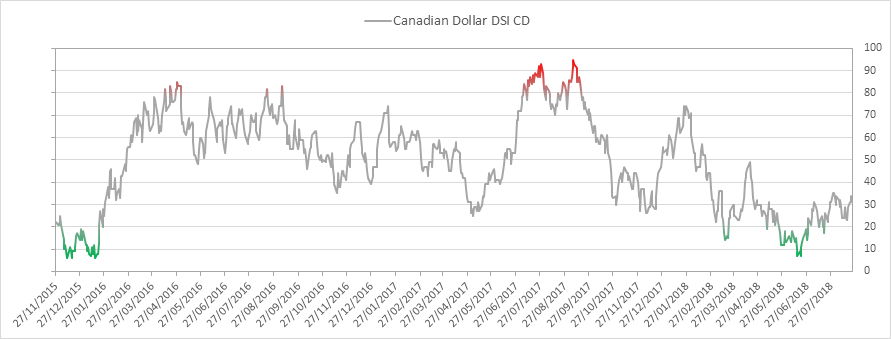
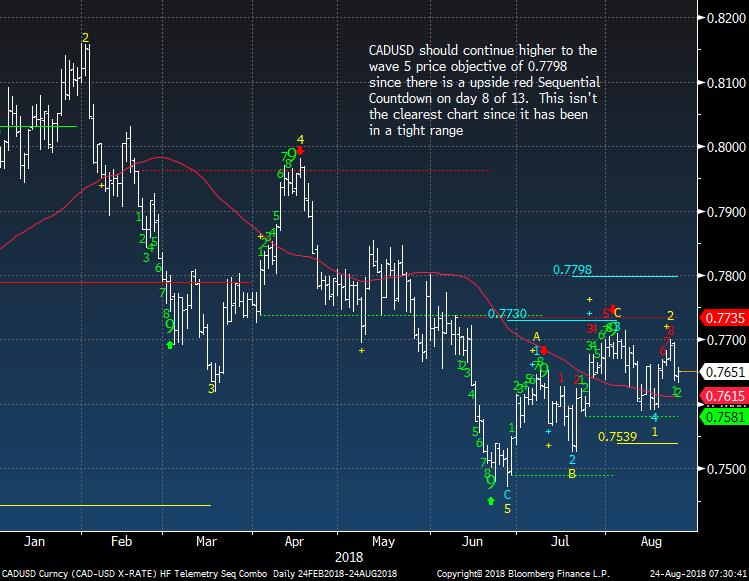
Canadian Dollar bullish sentiment is at 33% and trying to move higher
|
|
|
|
|
|
|
|
|
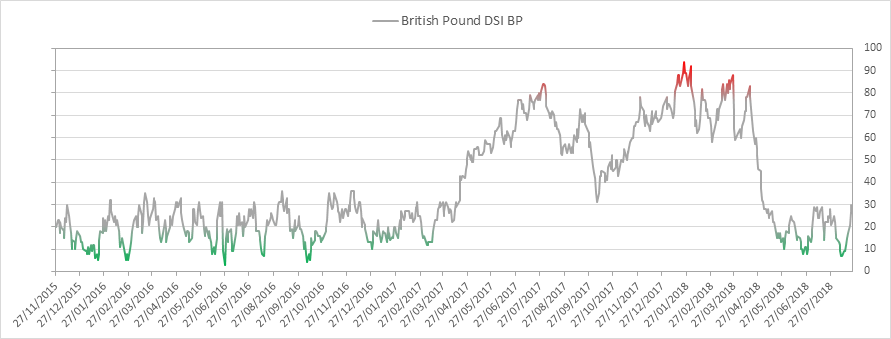
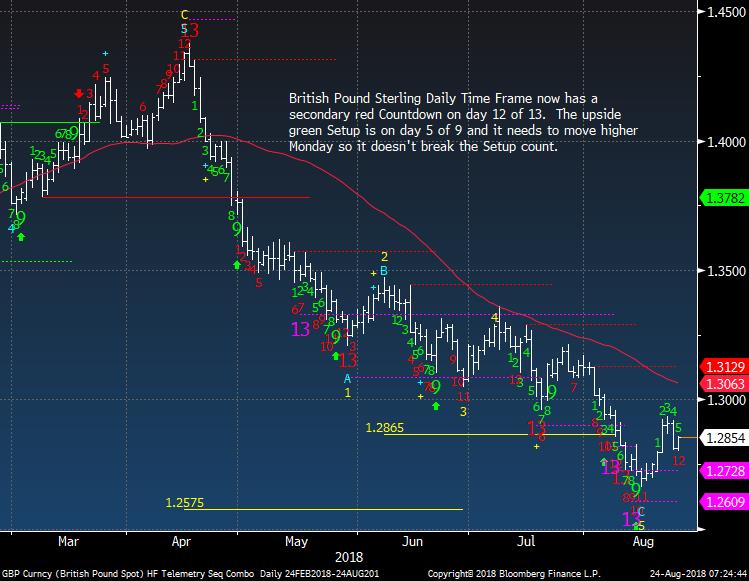
British Pound Sterling bullish sentiment is at 26% and up from a recent low of 7%
|
|
|
|
|
|
|
|
|
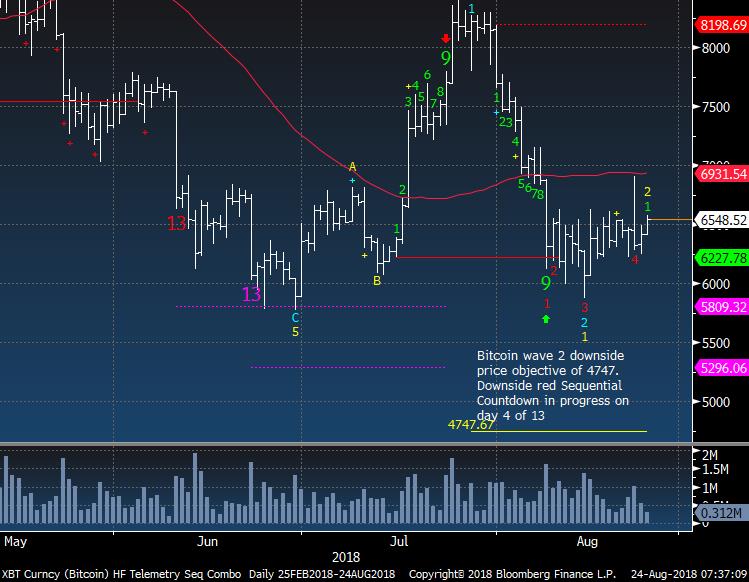
Bitcoin has held the June closing lows and if this breaks the lows a wave 3 downside price objective of 4747 is possible. There is also a downside red Countdown on day 4 of 13 in progress
|
|
|
|
|
|
|
|
|
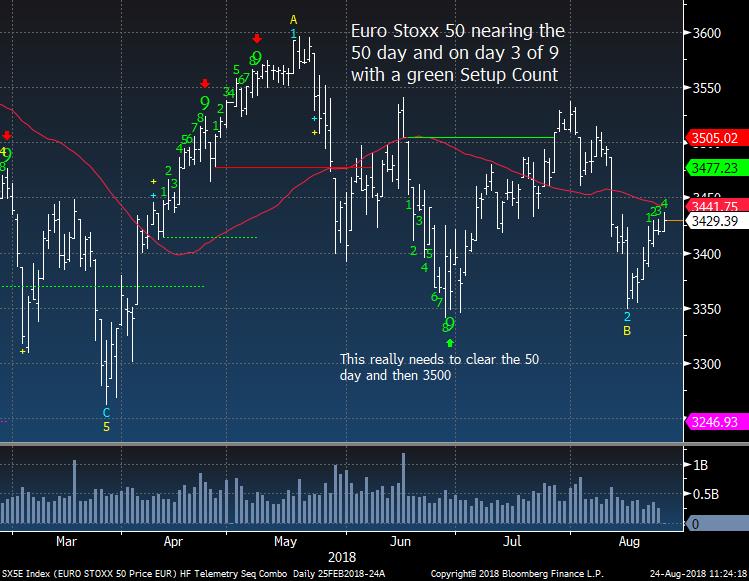
Euro Stoxx 50 still slowly moving higher
|
|
|
|
|
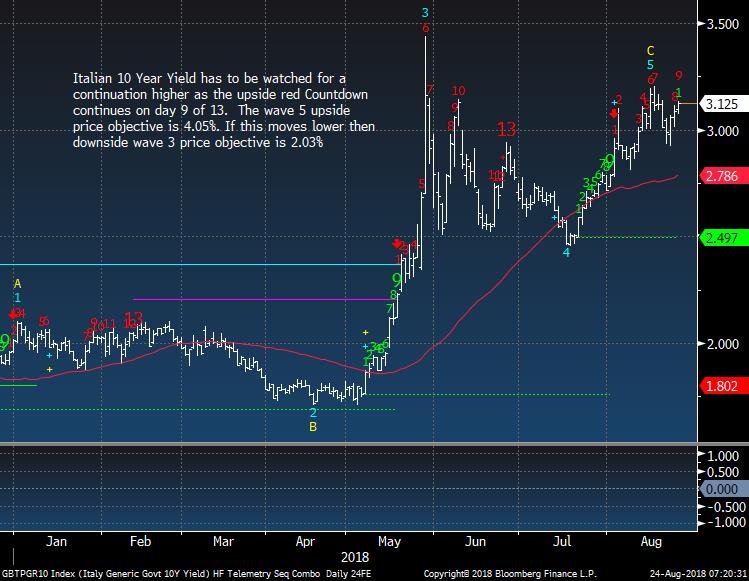
Today's news reports that President Trump offered to buy Italian bonds is rather unprecedented. He doesn't drink (thank God) but maybe he just mentioned it to the Italian PM in passing. Yields look higher on day 9 of 13
|
|
|
|
|
|
|
|
|
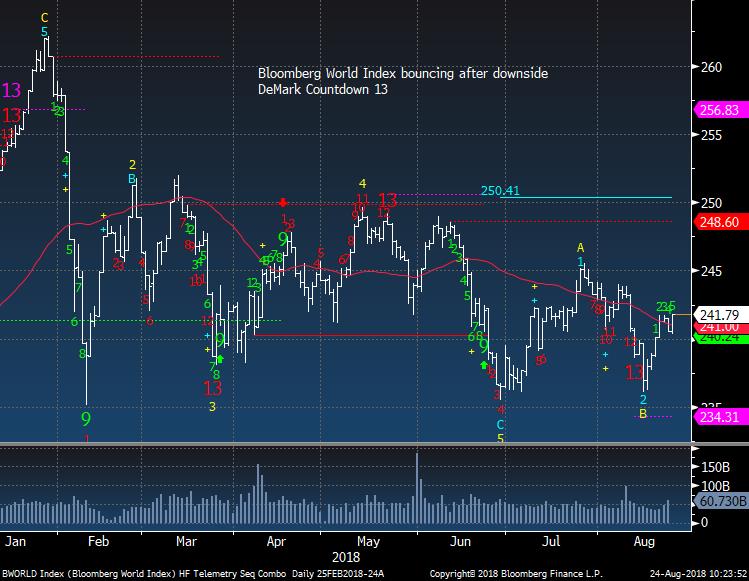
Bloomberg World Index shows how bad the global market has been this year. It's trying to move up and could continue with the recent improvement in some markets.
|
|
|
|
|
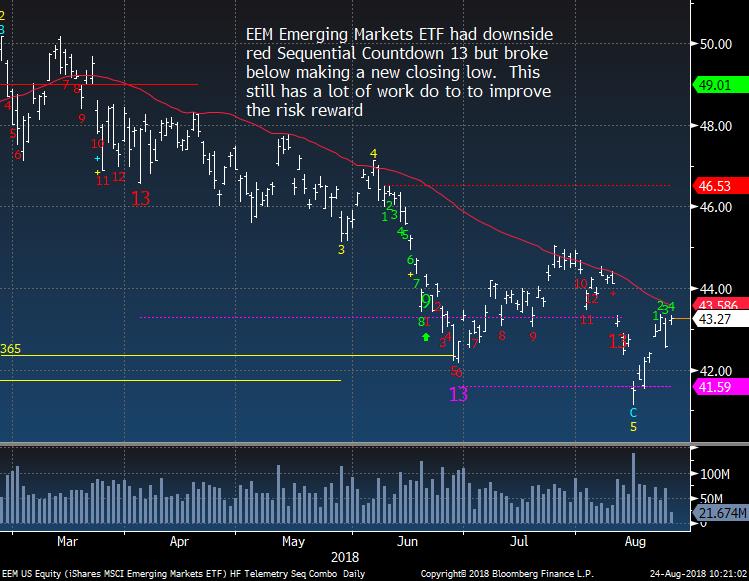
EEM Emerging Markets ETF improving but needs to clear 44
|
|
|
|
|
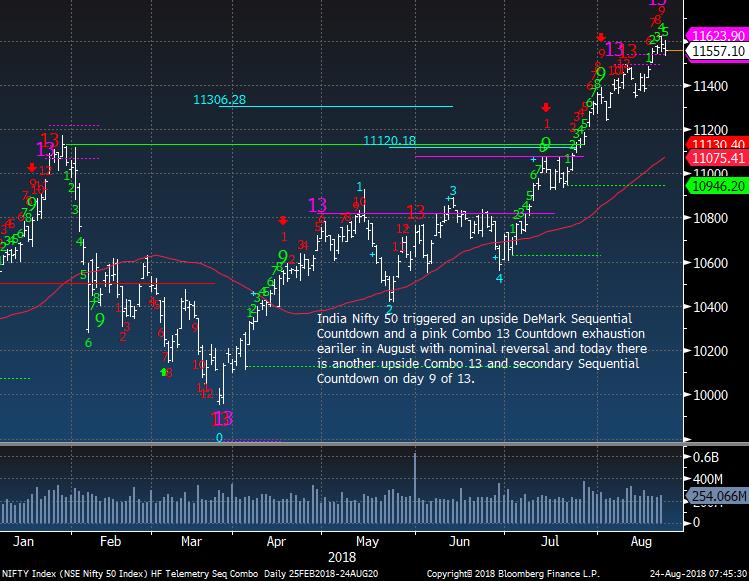
India Nifty Fifty Index on day 9 of 13 with red Sequential Countdown
|
|
|
|
|
|
|
|
|
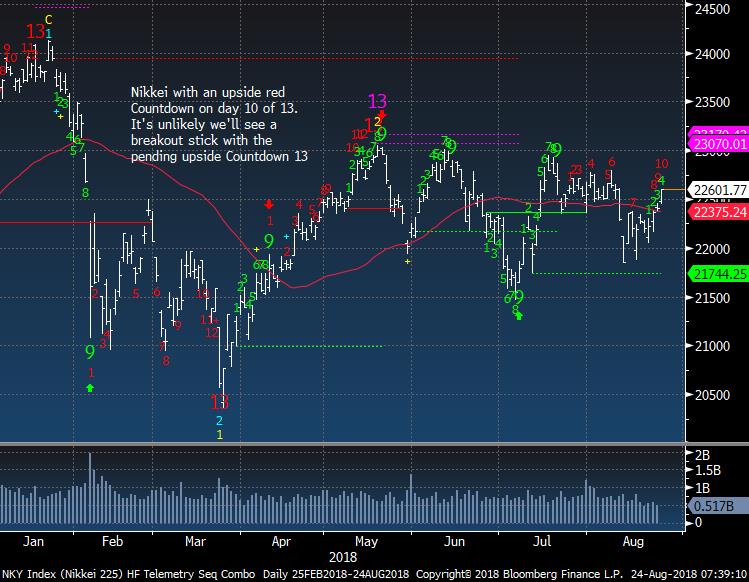
Nikkei is without any momentum
|
|
|
|
|
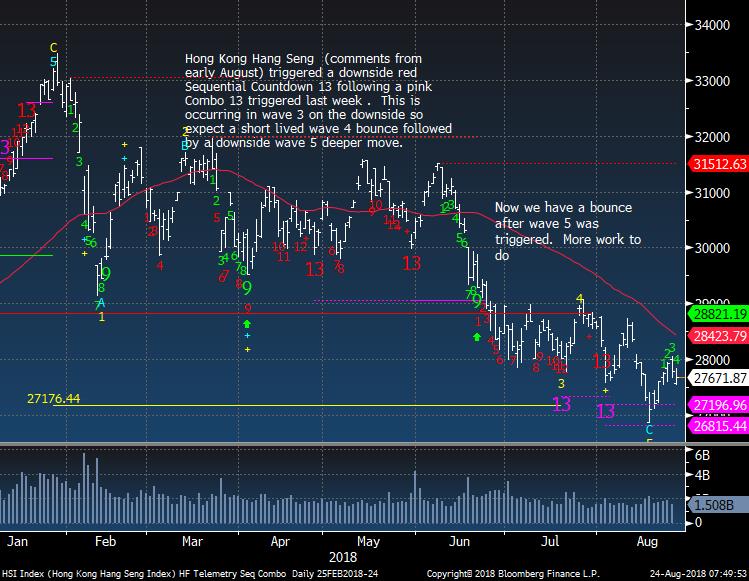
Hong Kong still struggling
|
|
|
|
|
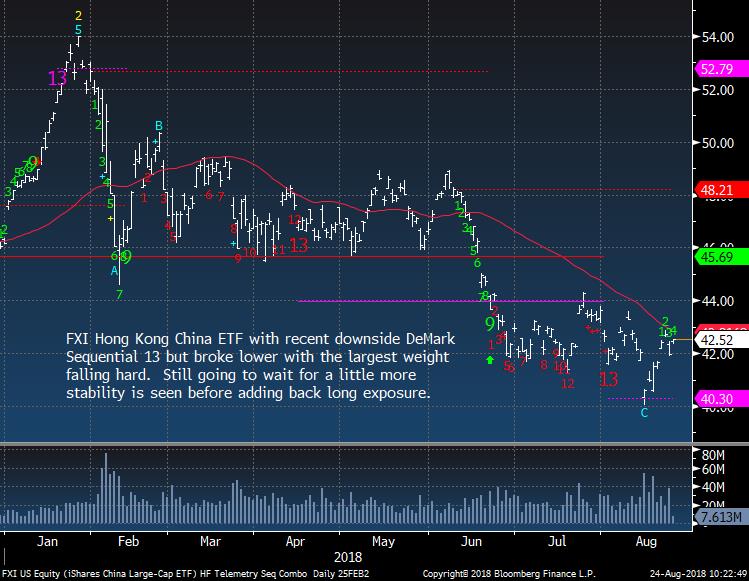
FXI nearing the 50 day but needs a clean breakout over 44
|
|
|
|
|
|
|
|
|
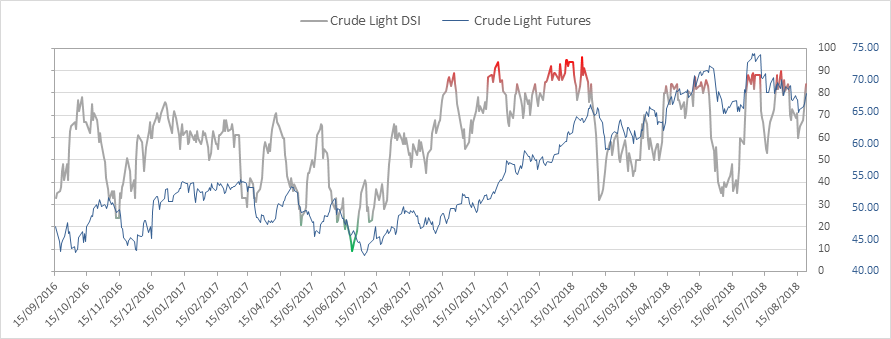
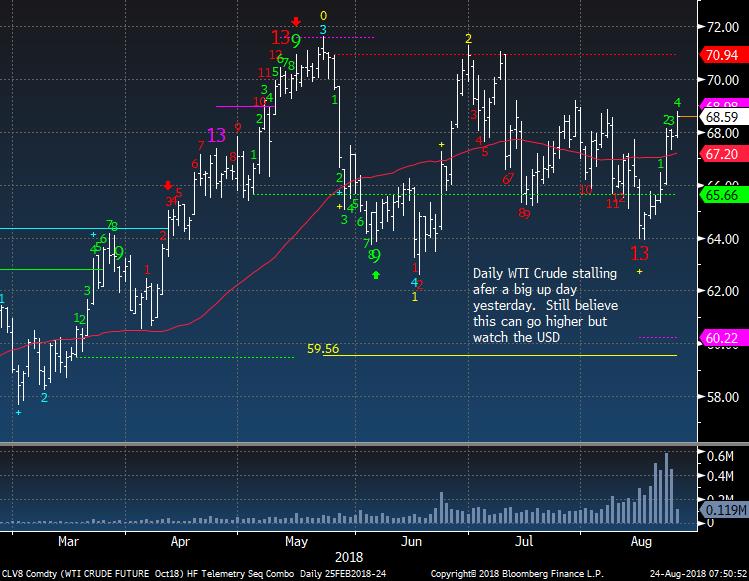
Crude bullish sentiment is at 84%
|
|
|
|
|
Crude continues higher as I've felt could happen recently
|
|
|
|
|
|
|
|
|
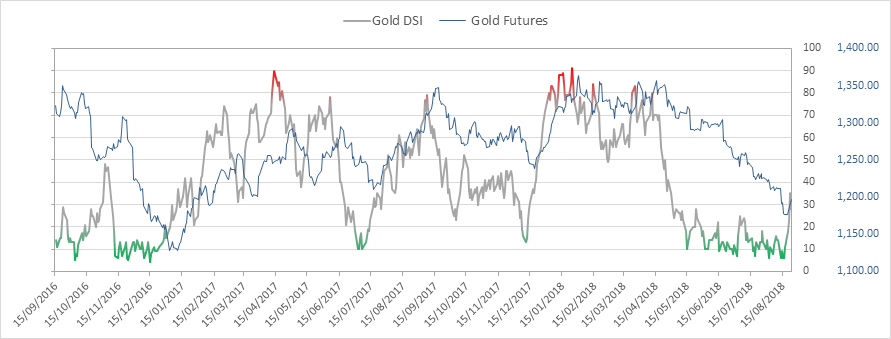
Gold bullish sentiment is at 28% down from 35% the previous day.
|
|
|
|
|
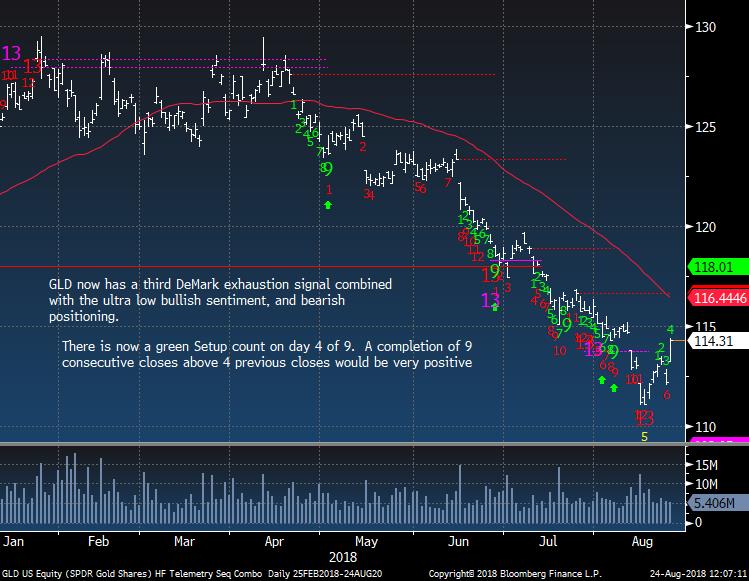
Gold GLD having a good day (finally)
|
|
|
|
|
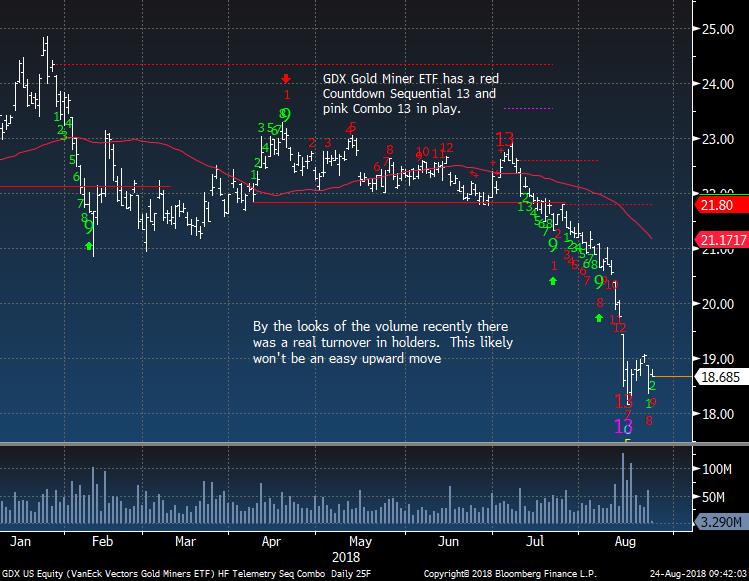
GDX bouncing today but has a lot of rebuilding to do
|
|
|
|
|
|
|
|
|
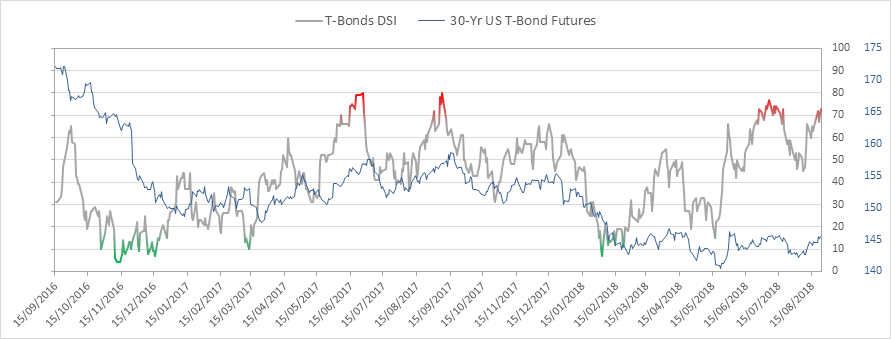
Bond bullish sentiment is at 73%
|
|
|
|
|
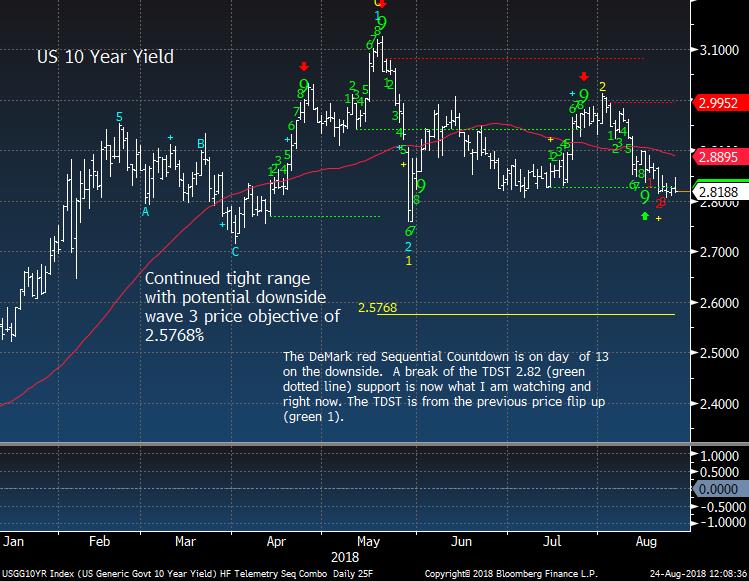
US 10 year yield reversed earlier weakest in bond market and now is lower
|
|
|
|
|
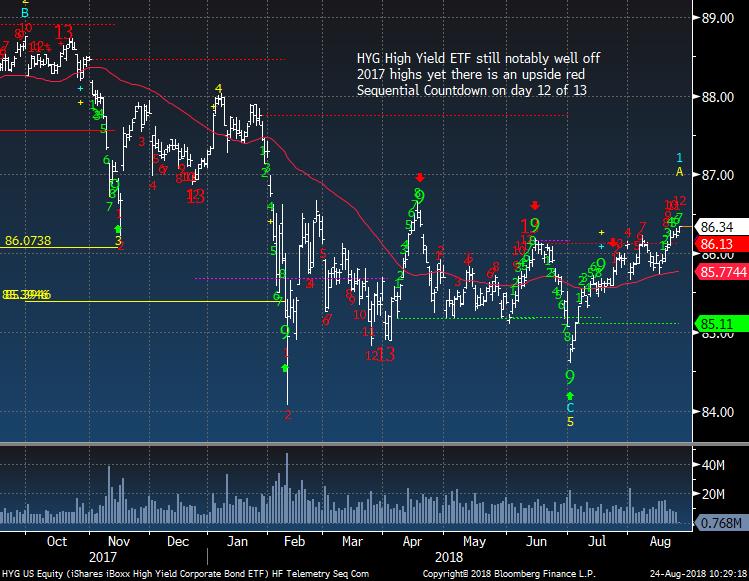
HYG High Yield ETF on day 12 of 13. This used to mirror some equity markets but it really has diverged. By the way the Setup 9's and 13's have been pretty spot on
|
|
|
|
|
|
|
DEMARK SCREENS - Daily, Weekly, Monthly Upside/Downside Exhaustion Signals
|
|
|
Daily/Weekly DeMark upside/downside exhaustion signals (Sequential) weekly updated on Monday's and monthly on the first day of the new month. Price flips occur when a stock closes higher/lower than four previous closes and increases conviction of a price turn.
The upside 13's are sell signals and downside 13's are buy signals. Price flip's are confirmation signals that increases potential for a price trend change. For example, if you are long a stock and there is an upside 13, you will want to take cautious action by selling down or out of a position. If initiating a short sale with the upside 13's, we tend to start with a 1/2 size and add with the downside price flip. The opposite is true for when there are downside 13's. Take a 1/2 size position
and add with the upside price flip. The DeMark Indicators are designed to assist the user with buying into weakness and selling into strength to anticipate trend exhaustion. Selling into a rally and buying into a decline often afford the opportunity to exit a trade without too serious a loss if wrong.
S&P 1500 Universe:
DAILY UPSIDE 13: CLH, FARO, HAE, HOS, LGND, NTGR, TSCO, TSS, VRSN
DAILY DOWNSIDE 13: EAT, EV, GEF, UNM, WSO
DAILY UPSIDE WITH PRICE FLIP REVERSAL DOWN: AVAV, BAX, BXS, CELG, CHRW, CTAS, CVS, GOV, GTY, HII, HRB, LII, LPX, MRK, NNN, OGS, PH, REG, ROP, SCL, SSP, UPS, VTR, WRI
DAILY DOWNSIDE WITH PRICE FLIP REVERSAL UP: NONE
Updated: 8/20/18
WEEKLY UPSIDE 13: DG, FORR, KSS, LII, MRK, MSCI, MSFT, NEE, ORI, ORLY, POWL, URBN, V, VVI, WMT, WWW
WEEKLY DOWNSIDE 13: LL
Updated: 8/1/18
MONTHLY UPSIDE 13: AIZ, ATR, BIO, CBU, CDNS, CMS, CSX, DGX, EE, FCN, FIX, GTY, HAE, HAS, IDXX, IEX, KSU, MA, NI, NPK, PTC, RLI, ROL, WEC
MONTHLY DOWNSIDE 13: CIR, HIBB
Euro Stoxx 600 Universe:
DAILY UPSIDE
13: DMGT LN, DSY FP, HEN3 GR, SKAB SS, TEMN SW, UCB BB
DAILY DOWNSIDE 13: ANTO LN, JUP LN, ML FP
DAILY UPSIDE WITH PRICE FLIP REVERSAL DOWN: AZN LN, GSK LN, HL/ LN, SGC LN, SWEDA SS, SWMA SS
DAILY DOWNSIDE WITH PRICE FLIP REVERSAL UP: EUROB GA, STM IM, TEF SM
Updated: 8/20/18
WEEKLY UPSIDE 13: ADM LN, GJF NO, HSX LN, SWMA SS
WEEKLY DOWNSIDE 13: JUP LN, KPN NA, SAB SM
Updated: 8/1/18
MONTHLY UPSIDE 13: TEMN SW
MONTHLY DOWNSIDE 13: CO FP, GETIB SS, RXL FP, TALK LN
|
|
|
Unsubscribe me from Hedge Fund Telemetry
Hedge Fund Telemetry LLC, P.O. Box 4675, Greenwich, CT 06861, United States
CONFIDENTIALITY NOTE and DISCLAIMER: This message is for the named person's use only. It may contain confidential, proprietary or legally privileged material. No confidentiality or privilege is waived by any accidental or unintentional transmission. If you receive this message in error, please immediately delete it and all copies of it from your system, destroy any hard copies and notify the sender. You must not, directly or indirectly, use, disclose,
distribute, print or copy any part of this message if you are not the intended recipient. Hedge Fund Telemetry LLC. cannot guarantee the confidentiality of the material transmitted; therefore, information of a sensitive or confidential nature should not be transmitted. There is risk in trading markets. Hedge Fund Telemetry LLC reports are based on information gathered from various sources and believed to be reliable, but are not guaranteed as to accuracy and completeness. The information is subject to change without notice and Hedge Fund Telemetry LLC has no obligation to provide any updates or changes. Hedge Fund Telemetry LLC is providing this data for informational and educational purposes and does not believe that it is sufficient to base an investment decision on. This information should not be regarded as a solicitation or recommendation of any particular security or to engage in any trading strategy. One should always check with your licensed financial
advisor to determine suitability of any investments.
|
|
|
|
|