|
|
|
|
|
|
|
|
A bad day yesterday for President Trump's advisers and naturally the market seems to brush off all concerns. This is a politics free zone as I have said numerous times but there is a bit of game theory with regards to the markets that I thought of last night. A lot of people in the markets will be OK with the possibility of Trump exiting in some form. Lose the crazy tweets, trade wars, and harsh rhetoric and the market can do what it is going to do without any negatives coming out
of the blue (bird) right? But the first real risk is if Trump fights anything that comes his way and if he does, it's likely going to hit the fan around the midterm elections. Uncertainty is never good for markets especially with leader of the US under impeachment and don't forget there's precedent with this too. The second risk is let's say Trump is gone and the Democrats take back the House and Senate majority and President Pence is the President. This isn't bullish in my view as the partisanship will be worse than ever creating a terrible gridlock as well rollbacks of some of the very market friendly Trump policies like tax cuts would be in play. The growth policies will be gone and the benefits from the tax cuts will start to run out of effectiveness or will be rolled back. We'll see how this all plays out as it won't be an uneventful second half of the year.
We now have all but one of the major US Indexes with daily DeMark upside Sequential
Countdown 13 exhaustion signals. S&P bullish sentiment is at 75% and remains elevated. Time to tighten stops, be sharp with new buys and to look for hedges to deploy. A little extra cash is smart especially if your year is tracking ahead of the indexes. I also like the potential for a bond bounce.
- US Markets - Sentiment remains elevate with a lot of upside DeMark Sequential signals in play
- Hedge Fund Telemetry Trade Ideas - See earlier
email
- Who's running up this market?
- Some recent stock ideas with Erlanger short interest data
- Currency Update USD at 50 day support
- European Market Update Still like Euro Stoxx 50 long
- Emerging Market Update - Still like long
- Asian Market Update - Some improvement in Japan and China
- Crude Update - Weekly chart makes me think this goes higher
- Gold Update - Sentiment turning up but GLD has a lot of work to do
- Bond Update - Things are lining up for a bond bounce
- DeMark Screens - Daily, Weekly, Monthly upside/downside exhaustion signals within the S&P 1500 and Euro Stoxx 600
|
|
|
|
|
Here's a link to the Hedge Fund Telemetry market sentiment page with 40 charts of sentiment including equities, bonds, currencies, and commodities updated each day.
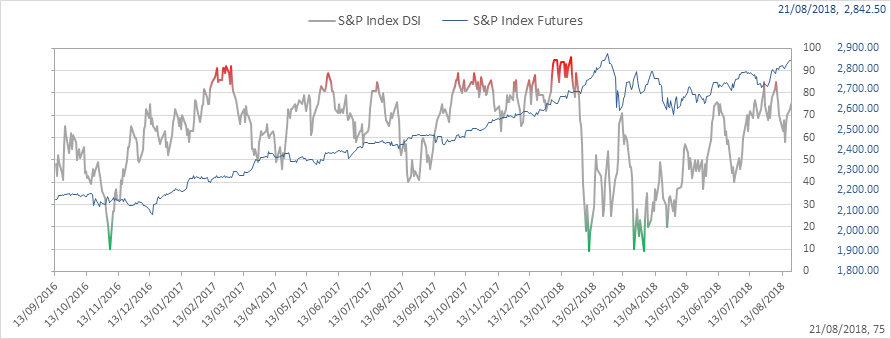
SPX bullish sentiment is at 75%
|
|
|
|
|
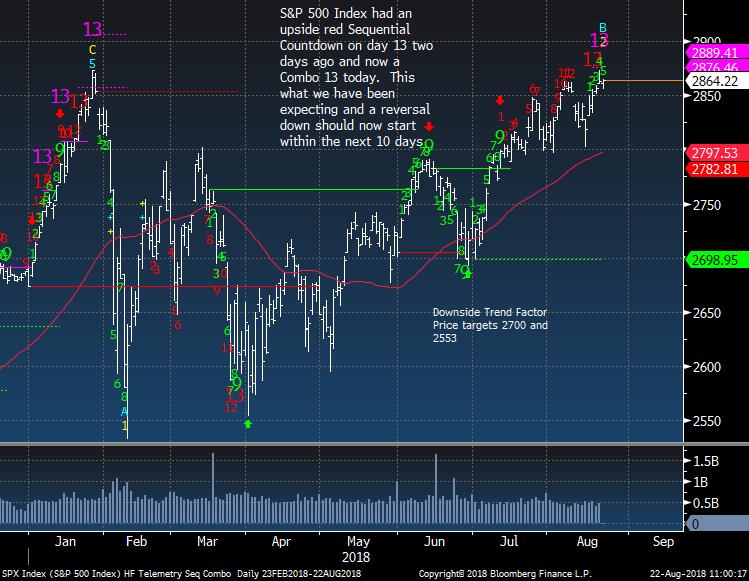
SPX daily still no closing high keeps the wave 2 intact. Although that will probably revert back to wave 5
|
|
|
|
|
|
|
|
|
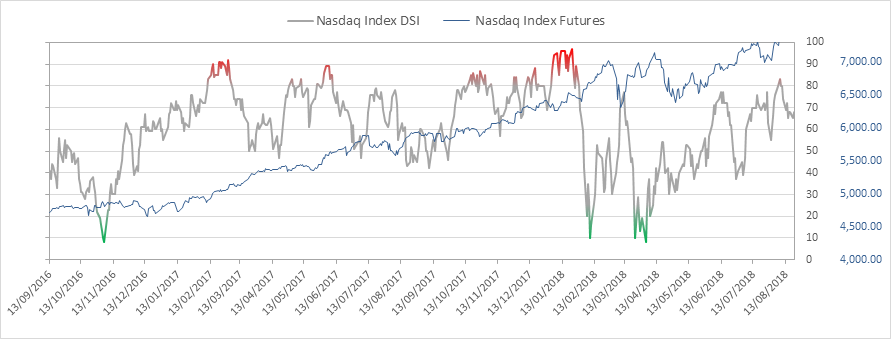
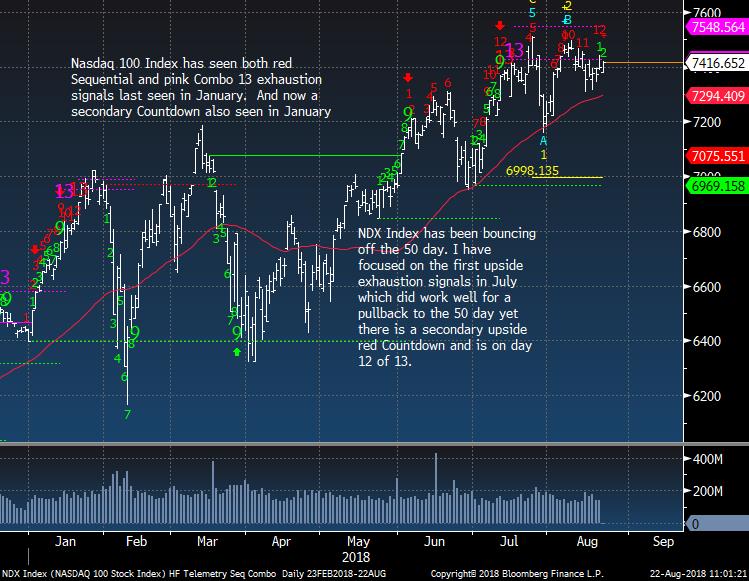
Nasdaq bullish sentiment is at 68% and divergent from index price
|
|
|
|
|
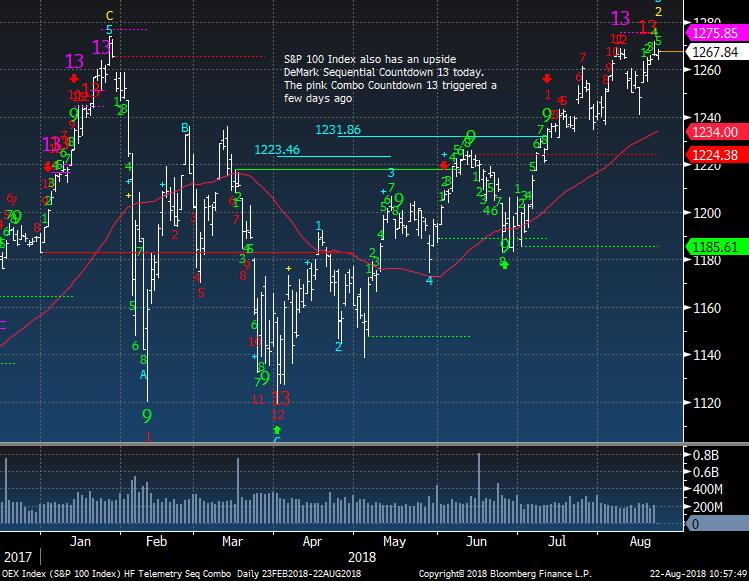
NDX Index still on day 12 of 13
|
|
|
|
|
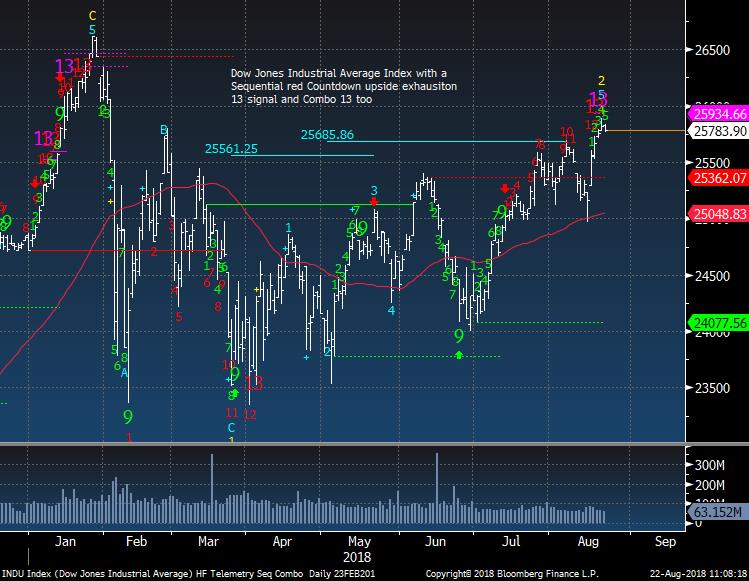
Dow Jones Industrial Average slight reversal today with some big industrial names weak.
|
|
|
|
|
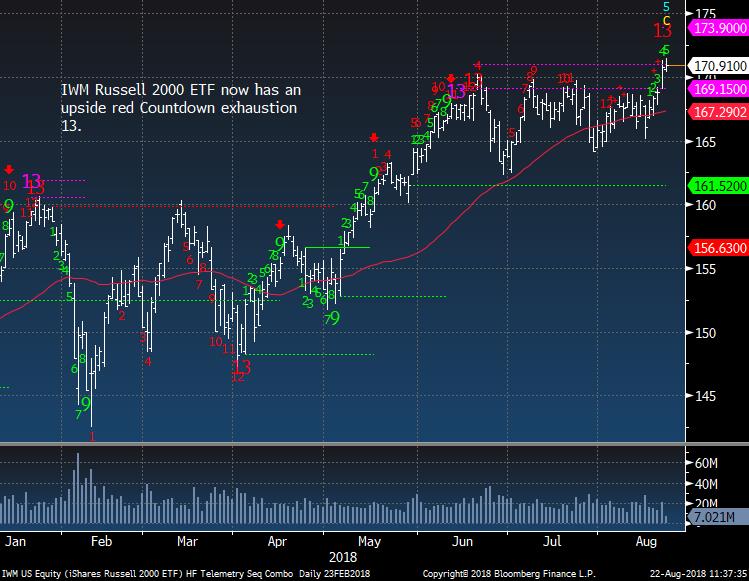
IWM Russell 2000 triggered the upside 13 yesterday
|
|
|
|
|
|
|
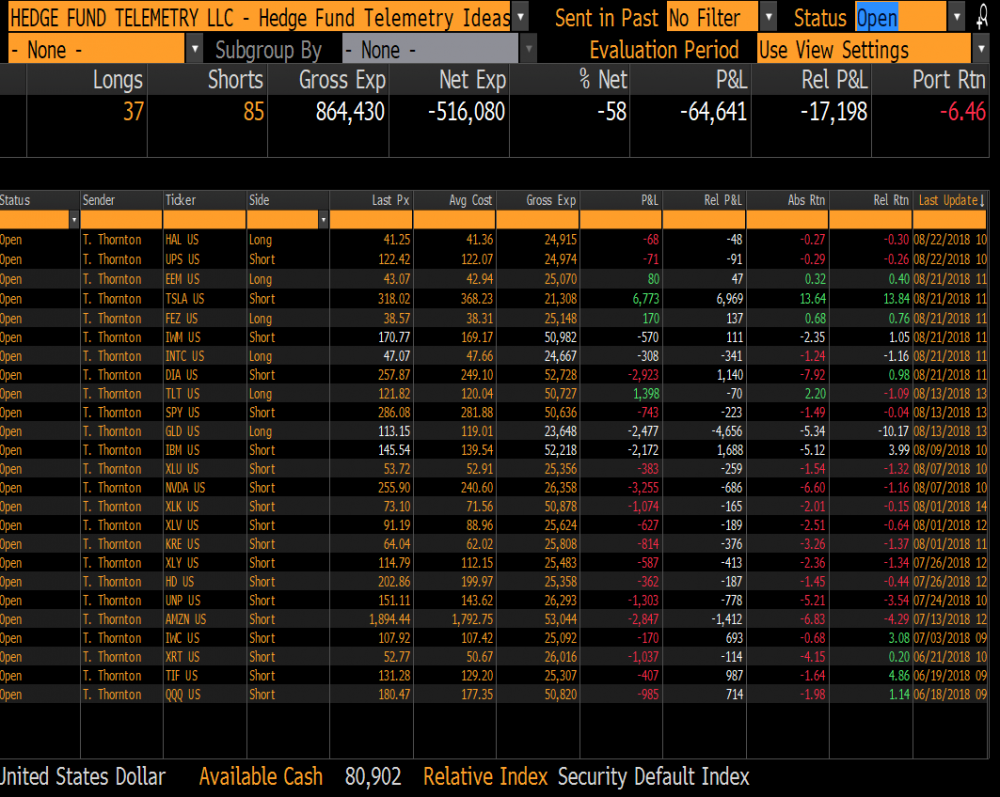
Hedge Fund Telemetry Trade Ideas
|
|
|
Trade Ideas - Sent a bunch of changes earlier. Some potential ideas below
|
|
|
|
|
|
|
Who's running this market up?
|
|
|
I showed this chart from Erlanger recently. They are the only people I trust when it comes to analyzing short interest. They have four types. Type 1 are heavily shorted stocks to buy that tend to run up in squeezes. Type 2 are recognized strength but not overly shorted yet that you hold. Type 3 are those stocks where shorts are right. Lastly, type 4 is where there are very few shorts as the stocks are crowded on the long side. These are also called
long squeezes. This chart below has a lot of stuff but let me focus on two things. First the purple highlighted area is showing a high number of type 4's leading the market higher. This is dangerous as type 4's are where people are chasing and without the natural buyer (short seller) there is risk to the downside. Second the turquoise blue boxes have a high amount of shorts that have been correct in software and services, pharma, semi's, and materials. But these could and should develop into areas where you want to look for long opportunities. One of the reasons I bought INTC yesterday and covered AMD. Also look below at AMAT as a potential long soon.
|
|
|
|
|
As you see when there are a high number of type 4's in the market it can be followed by weakness.
|
|
|
|
|
|
|
Some recent stock ideas with Erlanger Short Interest Data
|
|
|
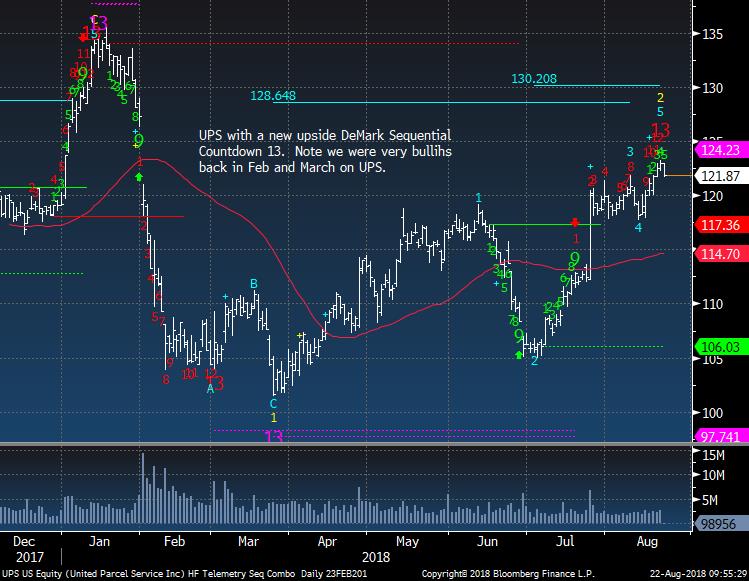
UPS has an upside Sequential 13 in play. We loved this back in February and March
|
|
|
|
|
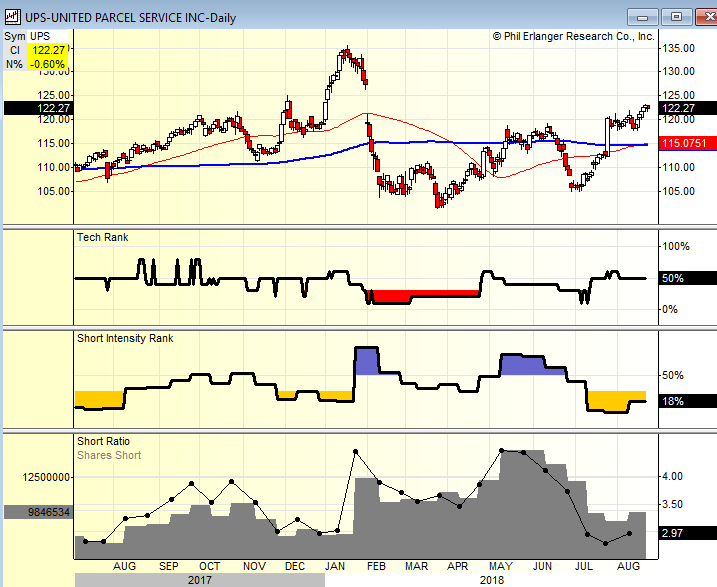
Erlanger shows from the bottom up the short ratio very low then the short intensity rank at 18% and that's low (type 4) and then the technical rank that is neutral.
|
|
|
|
|
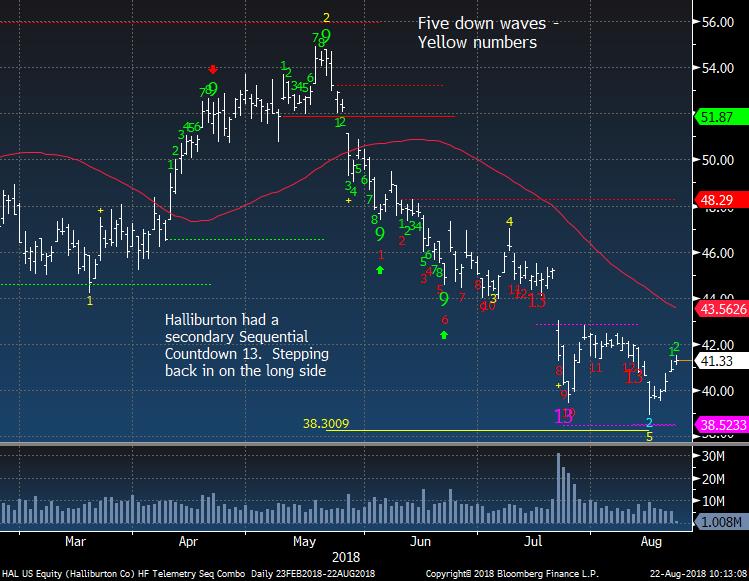
HAL trying to turn up and I'm giving it another shot on the long side
|
|
|
|
|
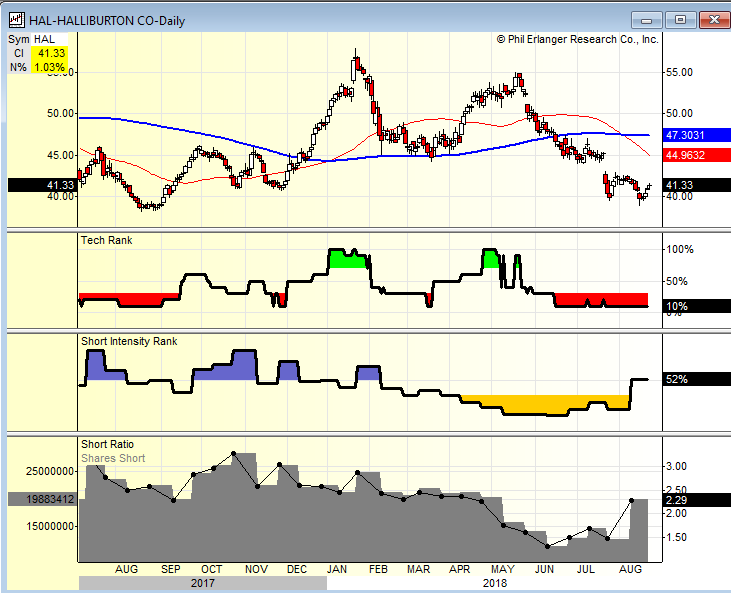
H'AL has a short ratio increasing (shorts are entering at the lows) and the short intensity rating is lifting too
|
|
|
|
|
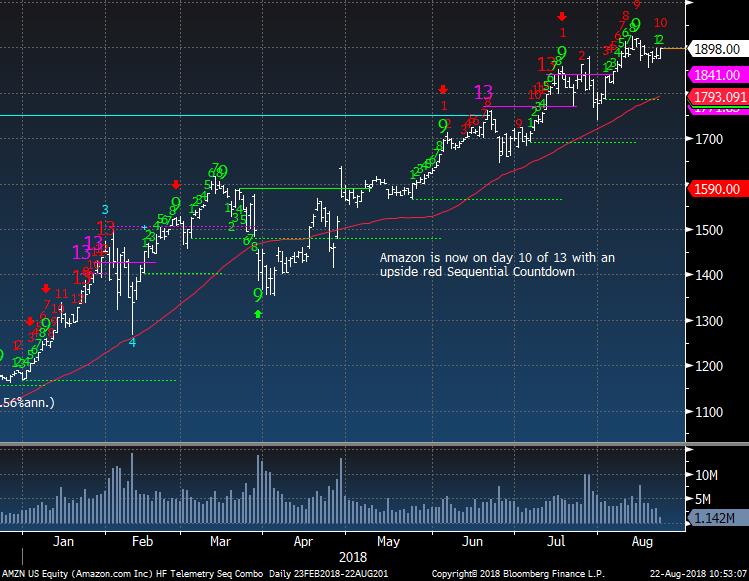
AMZN is still on day 10 of 13 and is the most important stock in the world right now
|
|
|
|
|
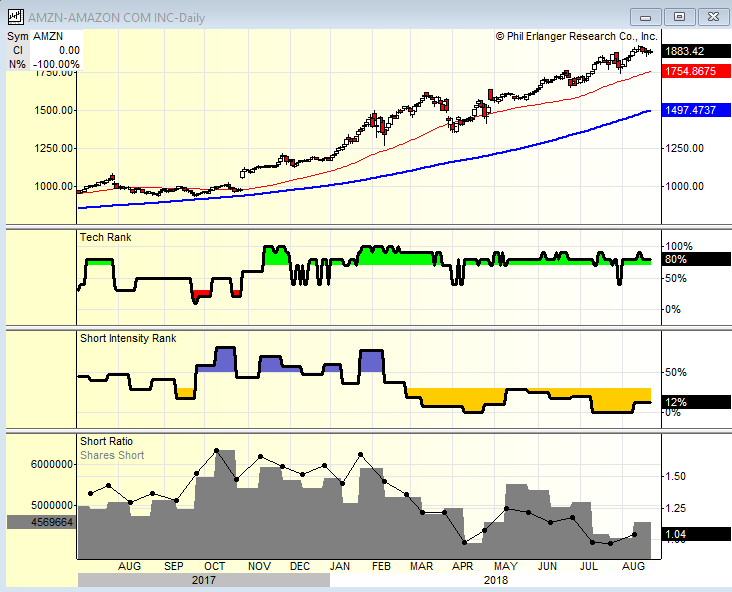
AMZN short ratio is very low at 1.04 and the short intensity rank is at 12%. Another type 4. Nobody is short this thing
|
|
|
|
|
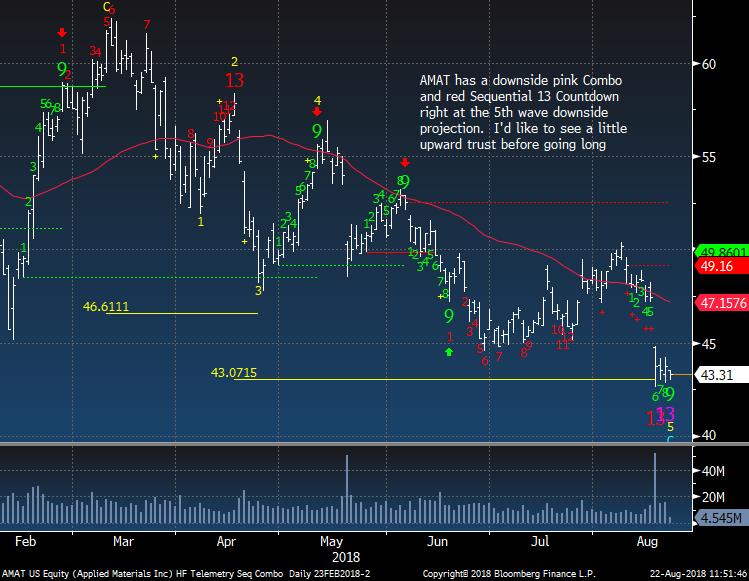
Applied Materials is the leading semiconductor equipment stock and it's been beat pretty back with 5 down waves and now both Combo and Sequential 13's are in play.
|
|
|
|
|
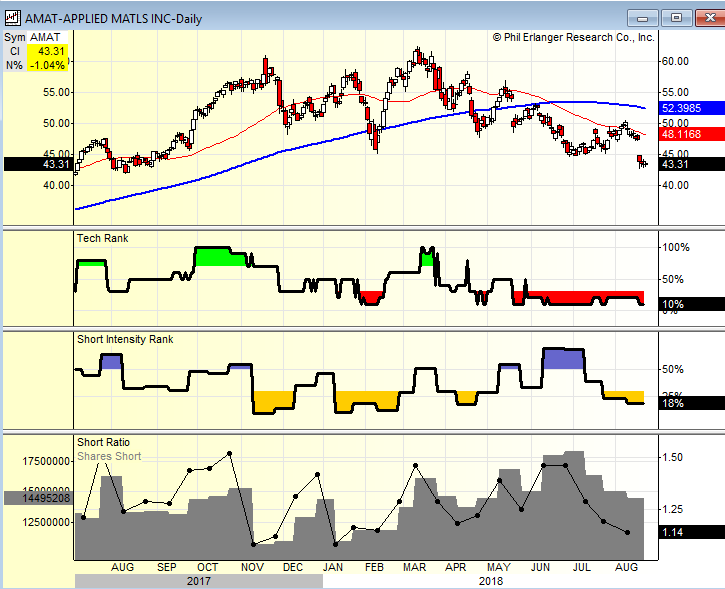
AMAT short interest has come down and that gives me pause to get long. If and when this starts to lift then it will have the right elements needed
|
|
|
|
|
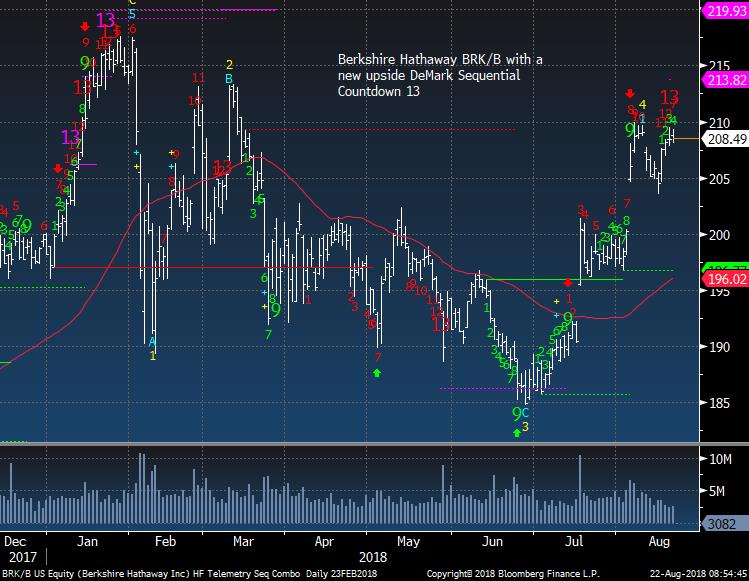
BRK/B Berkshire Hathaway. Another 13 Countdown
|
|
|
|
|
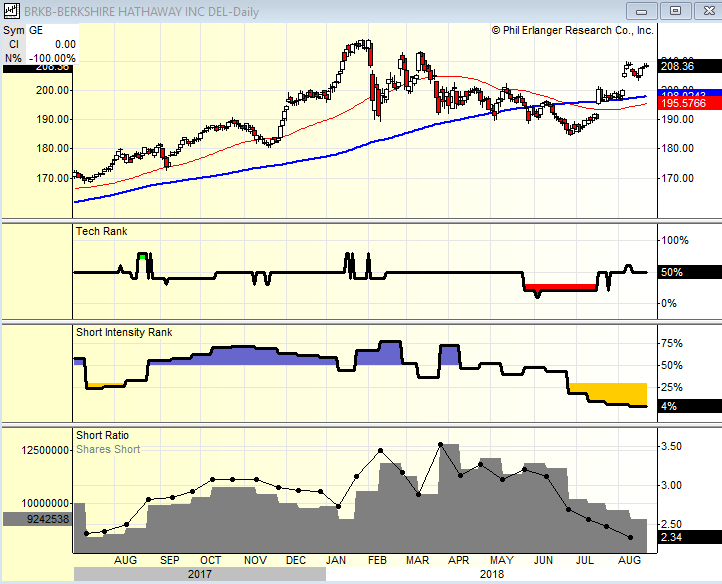
BRK/B short interest is very very low and is perfect for a short. By the way the stock went up on the announcement that they OK'd doing stock buybacks. I doubt they are buying here
|
|
|
|
|
|
|
|
|
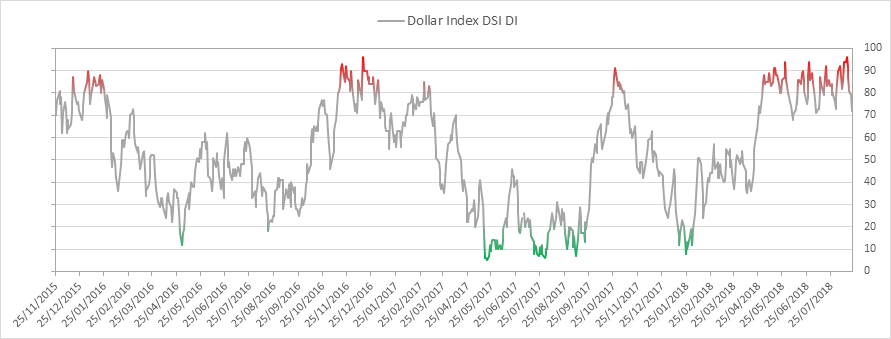
US Dollar bullish sentiment is at 72% down from the extreme high of 96%
|
|
|
|
|
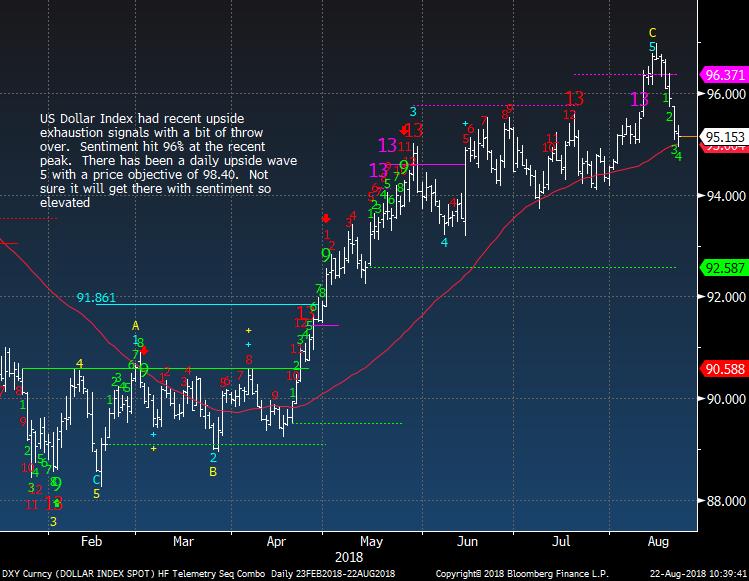
US Dollar Index right at the 50 day . 94 is next support
|
|
|
|
|
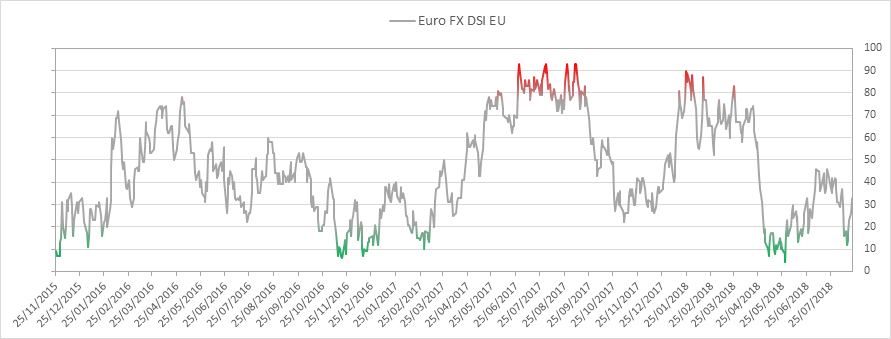
Euro bullish sentiment is at 33% and trying to lift again
|
|
|
|
|
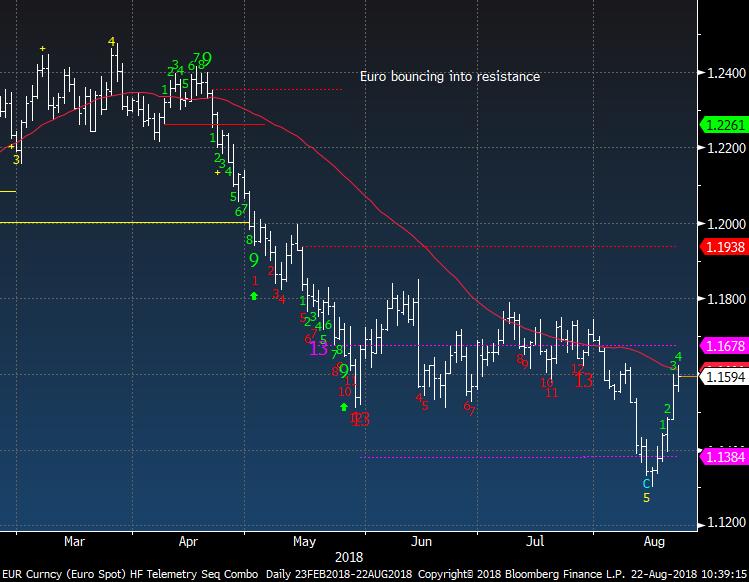
Euro Spot also at the 50 day
|
|
|
|
|
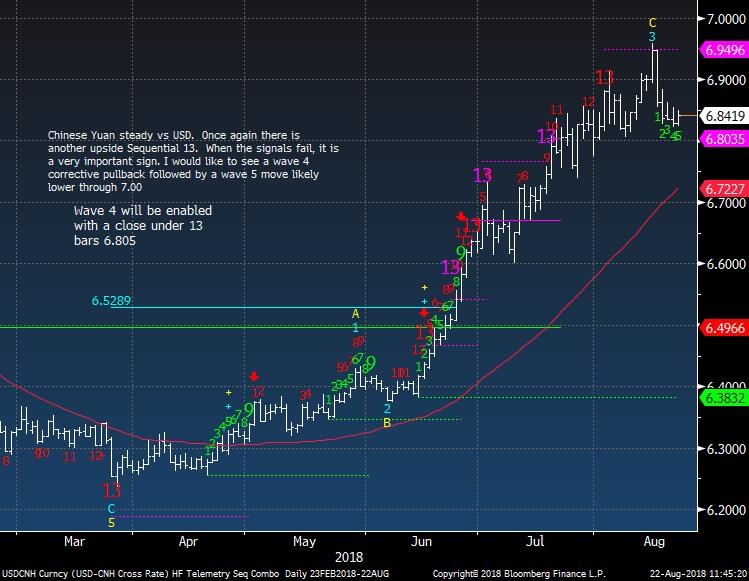
Yuan a little weaker but nobody noticing with the other news last night
|
|
|
|
|
|
|
|
|
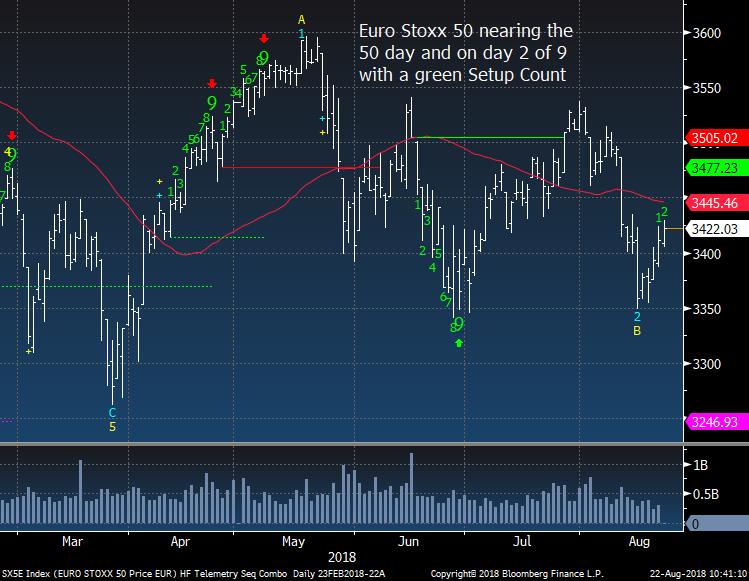
Euro Stoxx 50 up again and I'll hold the FEZ long and want to add a little higher
|
|
|
|
|
|
|
|
|
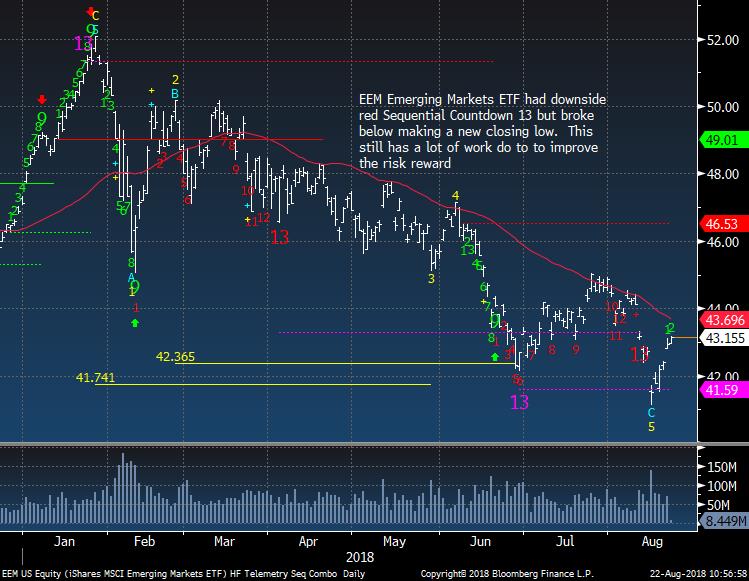
EEM Emerging Markets ETF up again today with the weaker USD
|
|
|
|
|
|
|
|
|
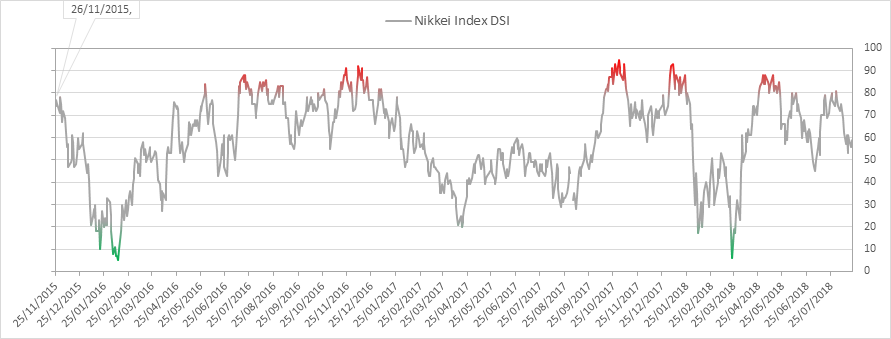
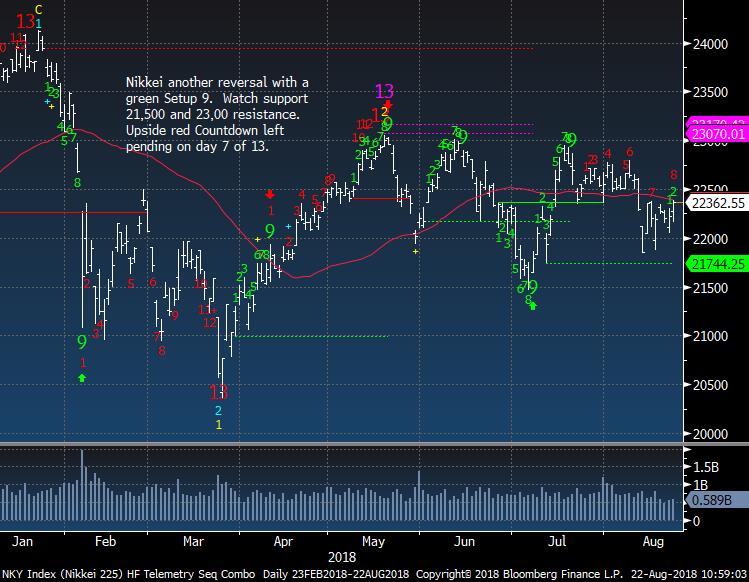
Nikkei bullish sentiment is at 59%
|
|
|
|
|
Nikkei still in a range and on day 8 of 13 with a red Sequential Countdown.
|
|
|
|
|
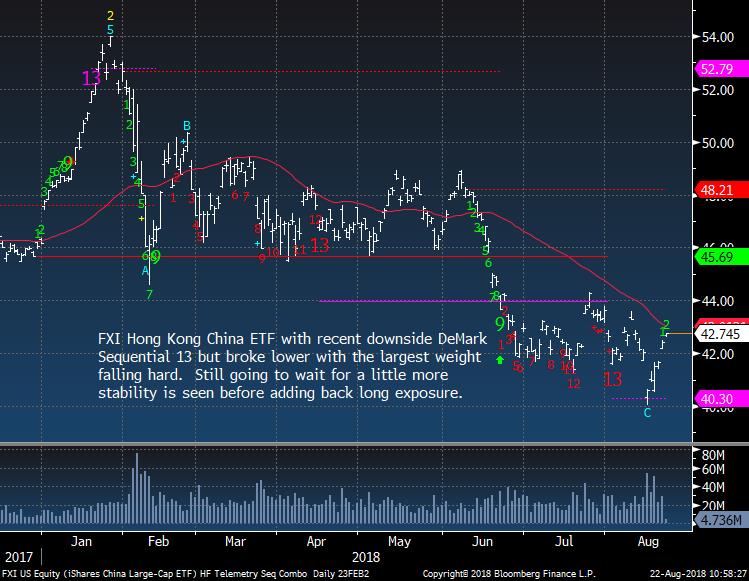
FXI Hong Kong China ETF up again and near the 50 day. 44 level is a real break out
|
|
|
|
|
|
|
|
|
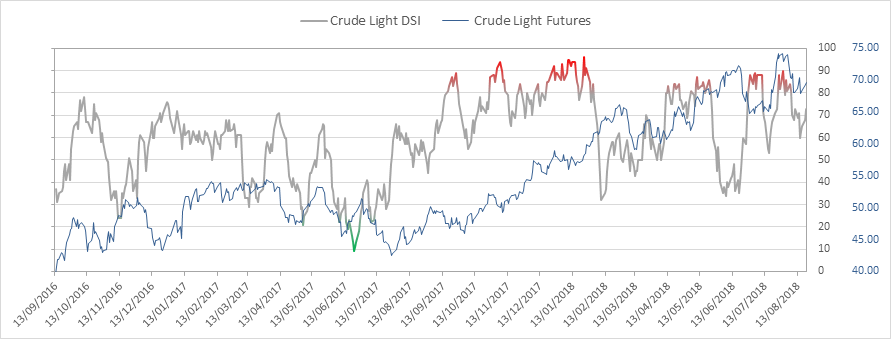
Crude bullish sentiment is at 73% and bouncing from 60% level
|
|
|
|
|
|
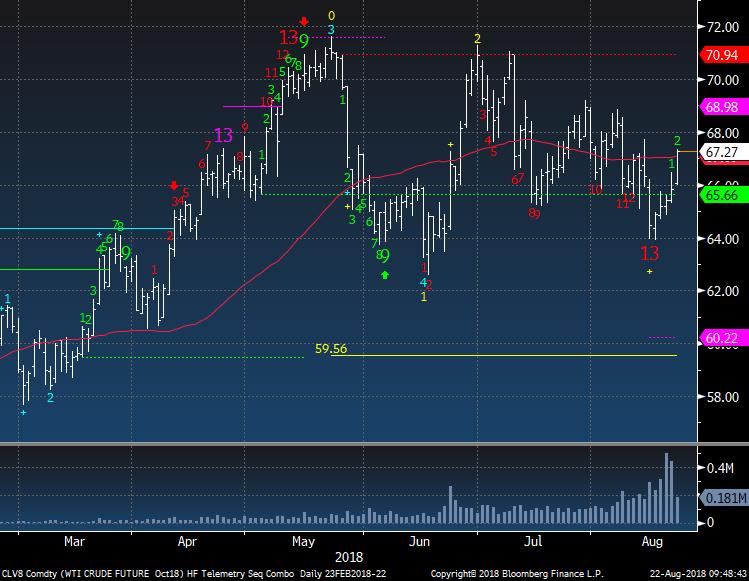
WTI crude futures weekly shows a DeMark Countdown 13 and I'm thinking this can move higher
|
|
|
|
|
|
|
|
|
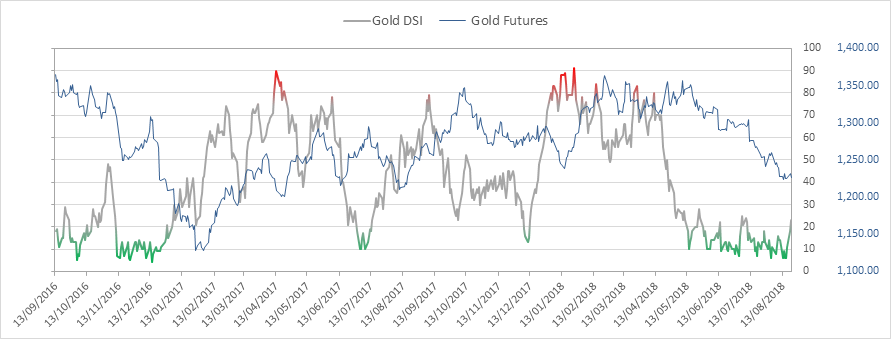
Gold bullish sentiment is at 23% and this is the highest since July. Come on baby move
|
|
|
|
|
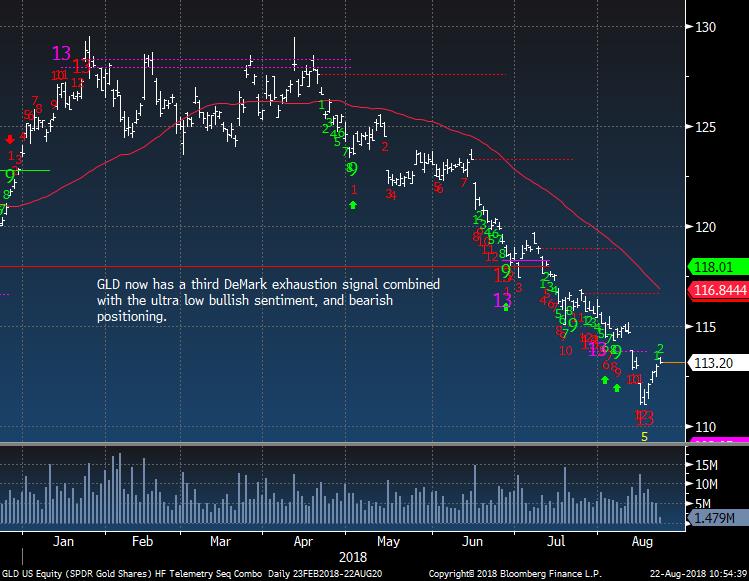
Gold still has a ton of work to do in order to turn up.
|
|
|
|
|
|
|
|
|
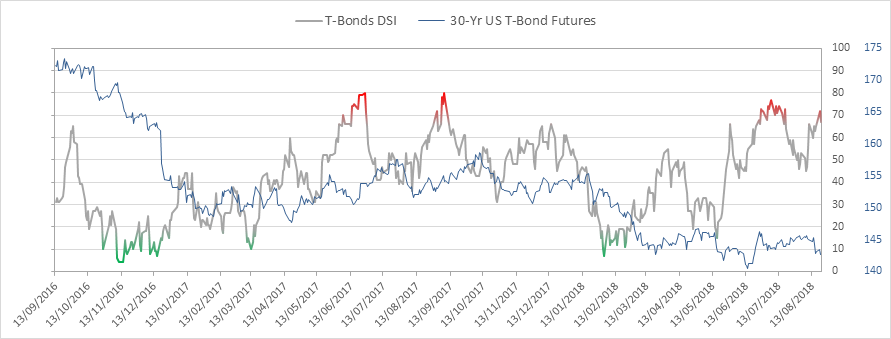
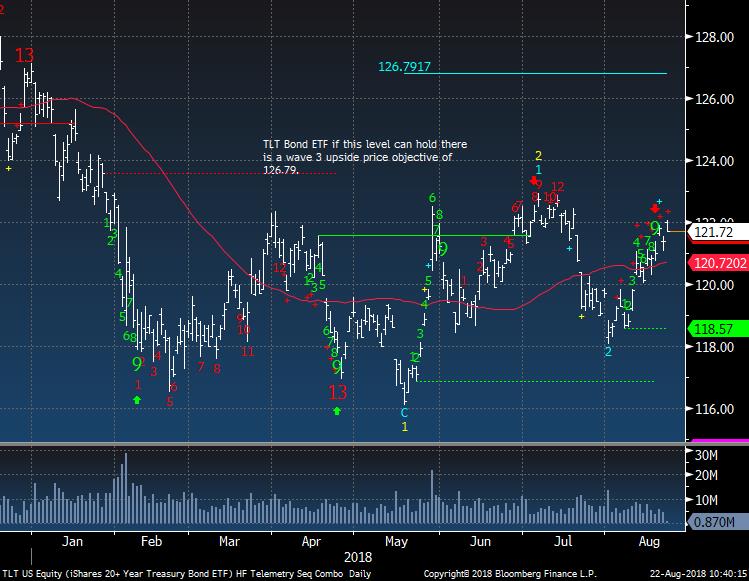
Bond bullish sentiment is at 67%
|
|
|
|
|
|
|
|
|
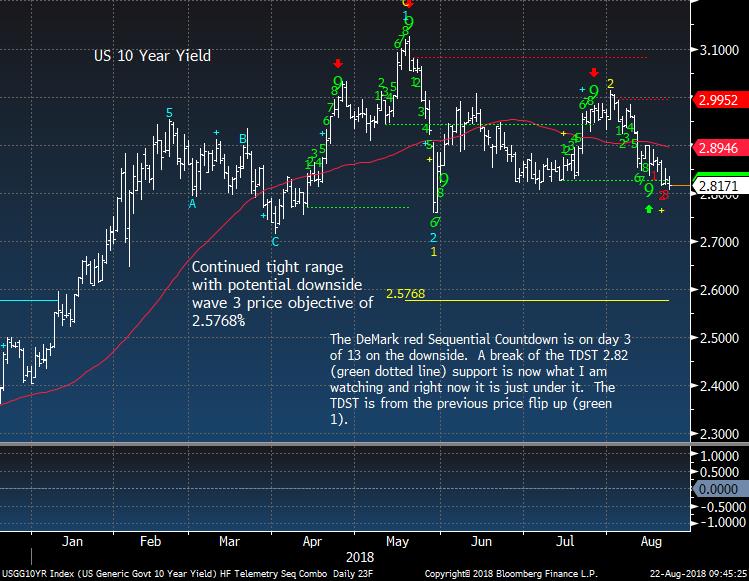
TLT Bond ETF still looks higher
|
|
|
|
|
|
|
DEMARK SCREENS - Daily, Weekly, Monthly Upside/Downside Exhaustion Signals
|
|
|
Daily/Weekly DeMark upside/downside exhaustion signals (Sequential) weekly updated on Monday's and monthly on the first day of the new month. Price flips occur when a stock closes higher/lower than four previous closes and increases conviction of a price turn.
The upside 13's are sell signals and downside 13's are buy signals. Price flip's are confirmation signals that increases potential for a price trend change. For example, if you are long a stock and there is an upside 13, you will want to take cautious action by selling down or out of a position. If initiating a short sale with the upside 13's, we tend to start with a 1/2 size and add with the downside price flip. The opposite is true for when there are downside 13's. Take a 1/2 size position
and add with the upside price flip. The DeMark Indicators are designed to assist the user with buying into weakness and selling into strength to anticipate trend exhaustion. Selling into a rally and buying into a decline often afford the opportunity to exit a trade without too serious a loss if wrong.
S&P 1500 Universe:
DAILY UPSIDE 13: ADTN, ASH, BAX, BXS, CELG, CF, DAL, DRI, FICO, IRM, K, MMSI, MRK, PH, PJC, ROL, RPM, STRA, THG, TRV, UEIC,
UPS, URBN
DAILY DOWNSIDE 13: NDSN
DAILY UPSIDE WITH PRICE FLIP REVERSAL DOWN: AEP, AKRX, ATO, BMY, CCE, CLI, CMG, DAKT, DUK, ED, MKC, PNW, SYY
DAILY DOWNSIDE WITH PRICE FLIP REVERSAL UP: ATI, CEVA, DLPH, EMN, EXP, GE, HAL, JAKK, LM, LRCX, MU, NEM, PDCE, PVH, RGLD,
RTEC, SLB, VECO
Updated: 8/20/18
WEEKLY UPSIDE 13: DG, FORR, KSS, LII, MRK, MSCI, MSFT, NEE, ORI, ORLY, POWL, URBN, V, VVI, WMT, WWW
WEEKLY DOWNSIDE 13: LL
Updated: 8/1/18
MONTHLY UPSIDE 13: AIZ, ATR, BIO, CBU, CDNS, CMS, CSX, DGX, EE, FCN, FIX, GTY, HAE, HAS, IDXX, IEX, KSU, MA, NI, NPK, PTC, RLI, ROL, WEC
MONTHLY DOWNSIDE 13: CIR, HIBB
Euro Stoxx 600 Universe:
DAILY UPSIDE 13: AMS SM, AZN LN, ETL FP, MMB FP, PGHN SW, SOBI SS
DAILY DOWNSIDE 13: NONE
DAILY UPSIDE WITH PRICE FLIP REVERSAL DOWN: NONE
DAILY DOWNSIDE WITH PRICE FLIP REVERSAL UP: AAL LN, AENA SM, BAS GR, BBY LN, BMPS IM, CBK GR, DAI GR, GET FP, III LN. OERL SW, POM FP, RHM GR, RIO LN, SAND SS, TIT IM, TLW LN, TRELB SS
Updated: 8/20/18
WEEKLY UPSIDE 13: ADM LN, GJF NO, HSX LN, SWMA SS
WEEKLY DOWNSIDE 13: JUP LN, KPN NA, SAB SM
Updated: 8/1/18
MONTHLY UPSIDE 13: TEMN SW
MONTHLY DOWNSIDE 13: CO FP, GETIB SS, RXL FP, TALK LN
|
|
|
Unsubscribe me from Hedge Fund Telemetry
Hedge Fund Telemetry LLC, P.O. Box 4675, Greenwich, CT 06861, United States
CONFIDENTIALITY NOTE and DISCLAIMER: This message is for the named person's use only. It may contain confidential, proprietary or legally privileged material. No confidentiality or privilege is waived by any accidental or unintentional transmission. If you receive this message in error, please immediately delete it and all copies of it from your system, destroy any hard copies and notify the sender. You must not, directly or indirectly, use, disclose,
distribute, print or copy any part of this message if you are not the intended recipient. Hedge Fund Telemetry LLC. cannot guarantee the confidentiality of the material transmitted; therefore, information of a sensitive or confidential nature should not be transmitted. There is risk in trading markets. Hedge Fund Telemetry LLC reports are based on information gathered from various sources and believed to be reliable, but are not guaranteed as to accuracy and completeness. The information is subject to change without notice and Hedge Fund Telemetry LLC has no obligation to provide any updates or changes. Hedge Fund Telemetry LLC is providing this data for informational and educational purposes and does not believe that it is sufficient to base an investment decision on. This information should not be regarded as a solicitation or recommendation of any particular security or to engage in any trading strategy. One should always check with your licensed financial
advisor to determine suitability of any investments.
|
|
|
|
|
|
|