|
|
|
|
|
|
|
|
S&P bullish sentiment a week ago was at 85%, an extreme level of bullishness. On Friday it had dipped to 70% which is still pretty elevated. Earlier today the US markets erased early losses and were trading up just like nothing is going on in the world and now the markets are falling again. The S&P is up 5.75% YTD and the Vanguard Global (ex US) ETF is down 13% YTD. The Nasdaq 100 is up 15% YTD and the top 3 stocks are attributing 64% of the total gain (see below). The big mega
cap names have not gone up on short covering as they do not have short interest more than 1% of total float, but they have gone up by people chasing momentum. The risk is that everyone runs for the exits all at once. Liquidity is not great as every derivative trader has told me for months. Why would anyone run for the exits? Contagion.
Contagion is happening and it's a risk because the global markets are incredibly more than ever intertwined and dependent on each other. Markets have been under pressure all year in China, Russia, Turkey, South Africa, Argentina, Brazil, and on and on. Currencies have fallen hard vs. the US Dollar and if this path continues there could be economies collapse. Emerging market economies have feasted on QE and Central Bank gifts but now we are seeing the risks. European banks are falling hard because they have exposures to these countries under pressure. US banks have started to weaken as there is no doubt
they have some exposure too. Certainly not as much as European banks do but when markets need liquidity the most they will sell anything that is liquid. Going back to the Nasdaq 100 and the strength of the largest weights (safe havens?), there is risk that if things continue to deteriorate in the countries under pressure, holders could start to look for the liquidity and don't be surprised if these mega caps join the selling parade. This is a serious moment and if you have not taken defensive posturing, please raise some cash.
- US Markets - Sentiment dropping. Upside Countdowns did not fully trigger
- Hedge Fund Telemetry Trade Ideas - Made a few changes today
- What is moving the market higher in the US
- Italian 10 Year Yields - This is another risk with contagion
- Currency Update - Sentiment with the USD is very extreme
- Currencies under duress - TRY, ARS, RUB
- European Market Update - DAX on day 11/13
- Global Market Update - Downside exhaustion signals seen in Global ETF's - a potential positive
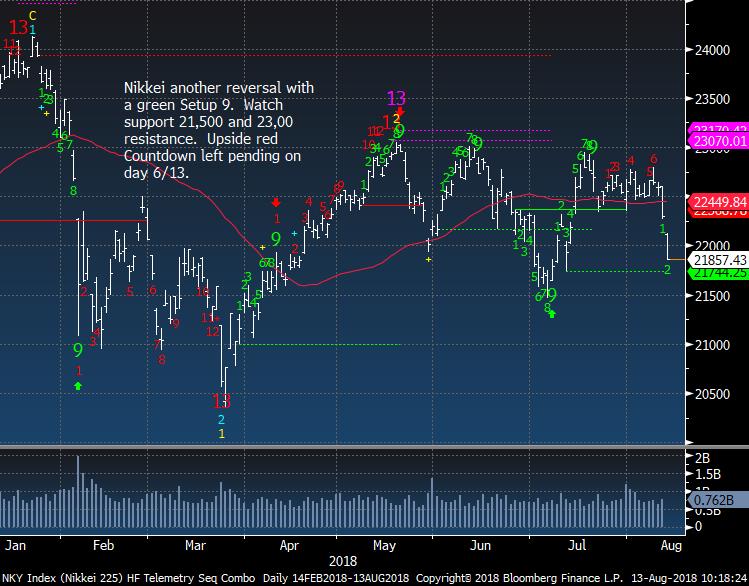
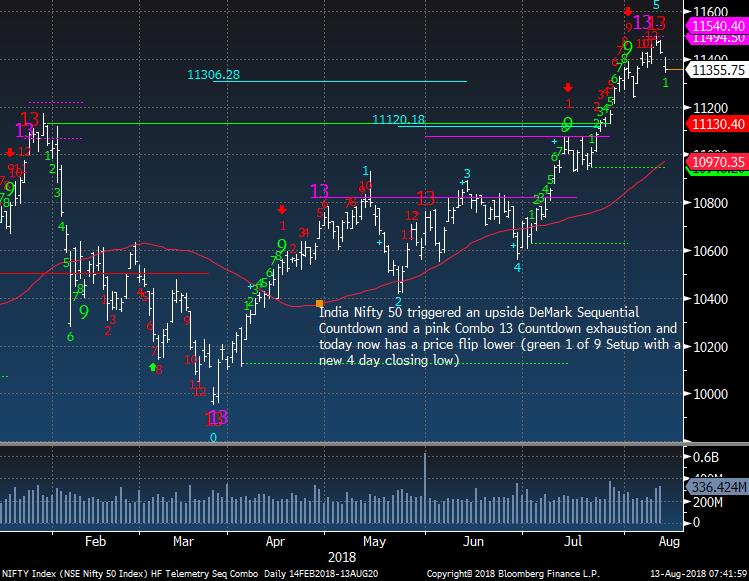
- Asian Market Update - Nikkei still in range, China still stuck, India topping
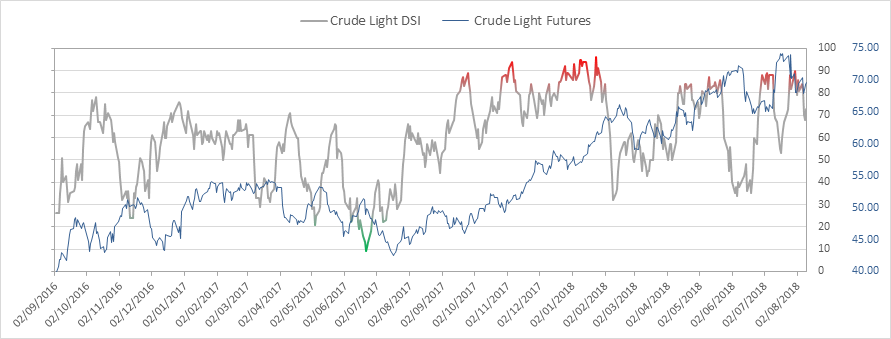
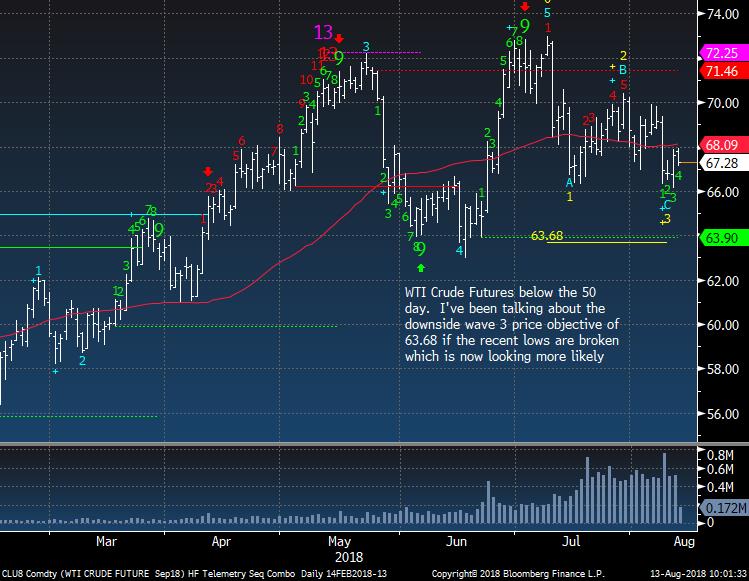
- Crude Update - Still weak
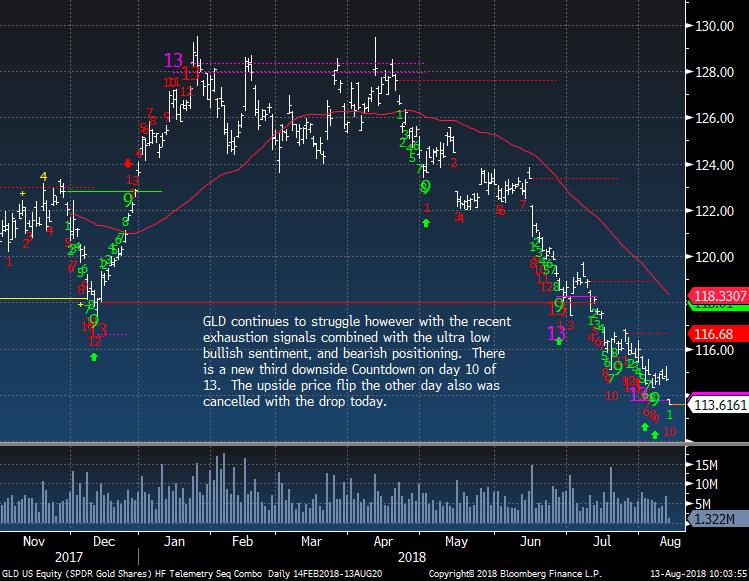
- Gold Update - Not working so reducing 1/2 of long and will add back with a definitive turn up
- Bond Update - VERY short positioning with COT data could see a squeeze in Bonds
- DeMark Screens - Daily, Weekly, Monthly upside/downside exhaustion signals within the S&P 1500 and Euro Stoxx 600
|
|
|
|
|
Here's a link to the Hedge Fund Telemetry market sentiment page with 40 charts of sentiment including equities, bonds, currencies, and commodities updated each day.
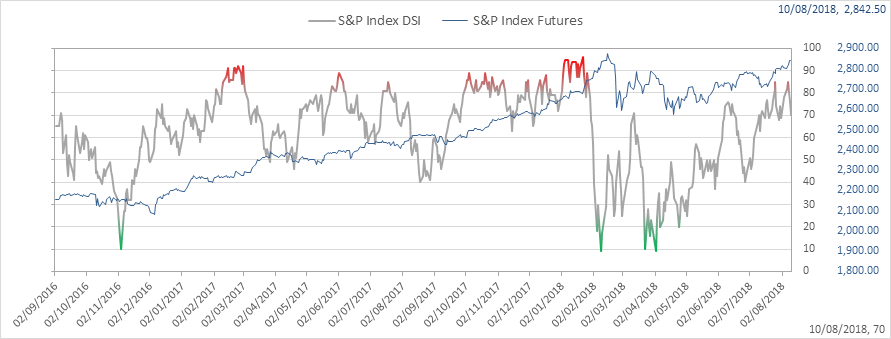
SPX bullish sentiment is at 70% and today's reading should be lower again. Breaking 50% and I believe the bottom will fall out and we will get a bullish sentiment reading near 10% when it's all over
|
|
|
|
|
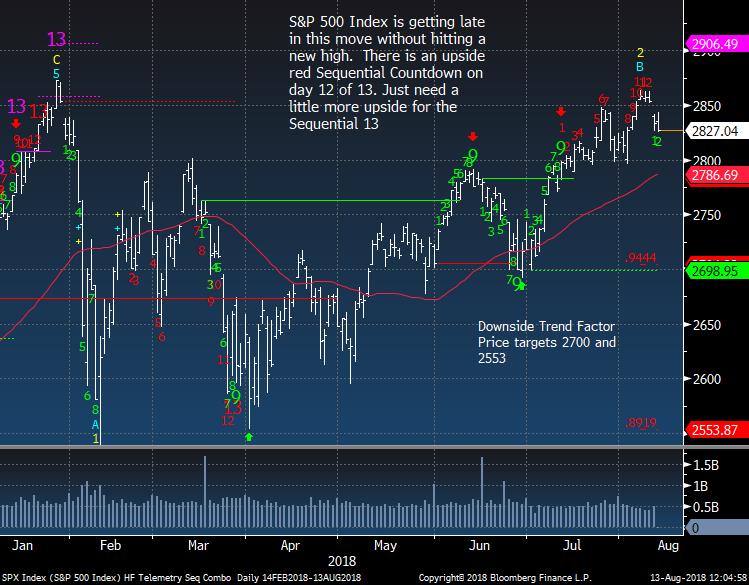
SPX daily did not get the upside 13 as it was left hanging on day 12
|
|
|
|
|
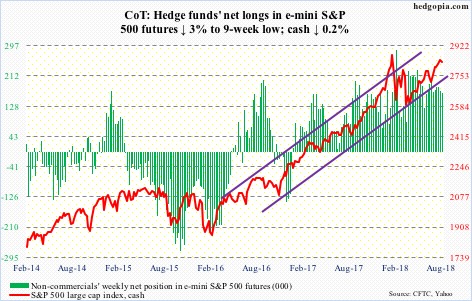
Commitment of Traders speculators still positioned bullish but slightly down week over week
|
|
|
|
|
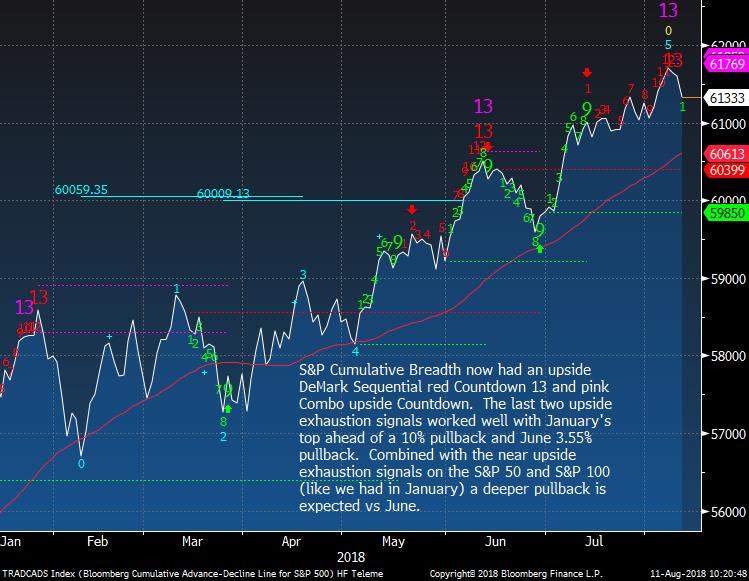
SPX Cumulative breadth had the upside exhaustion signals and I can't tell you how many people were critical of my analysis
|
|
|
|
|
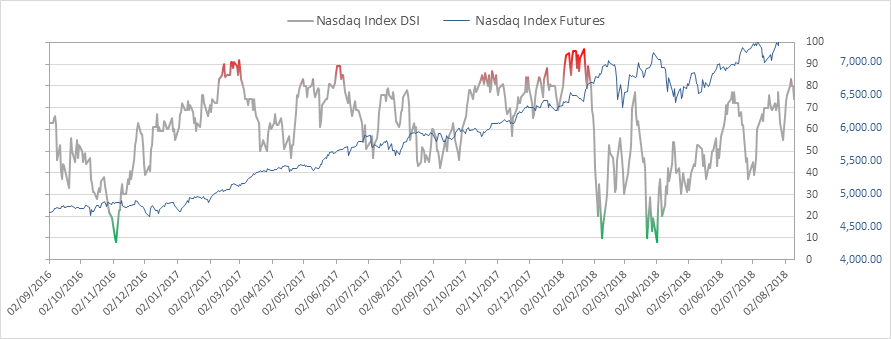
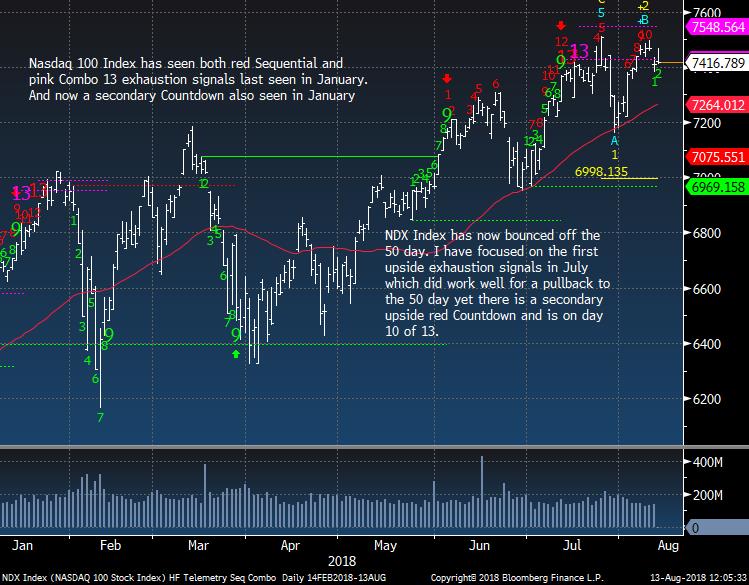
Nasdaq bullish sentiment is at 74%
|
|
|
|
|
NDX Index stuck on day 10 of 13.
|
|
|
|
|
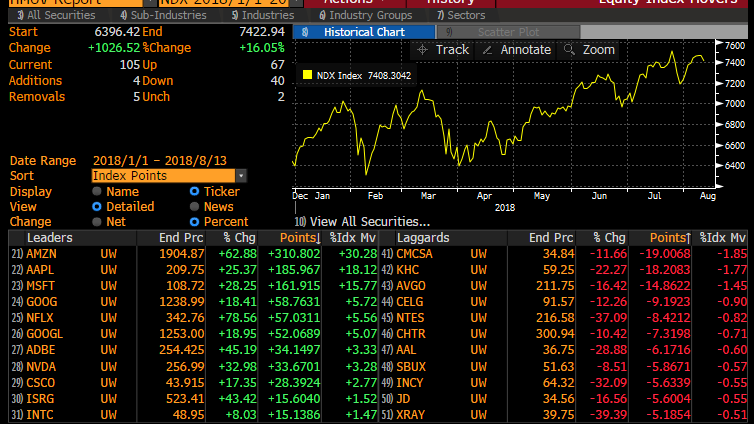
NDX YTD Attribution - look at % index Movers. AMZN is 30% of the total gain YTD. Breadth isn't that great too. Only 67/40
|
|
|
|
|
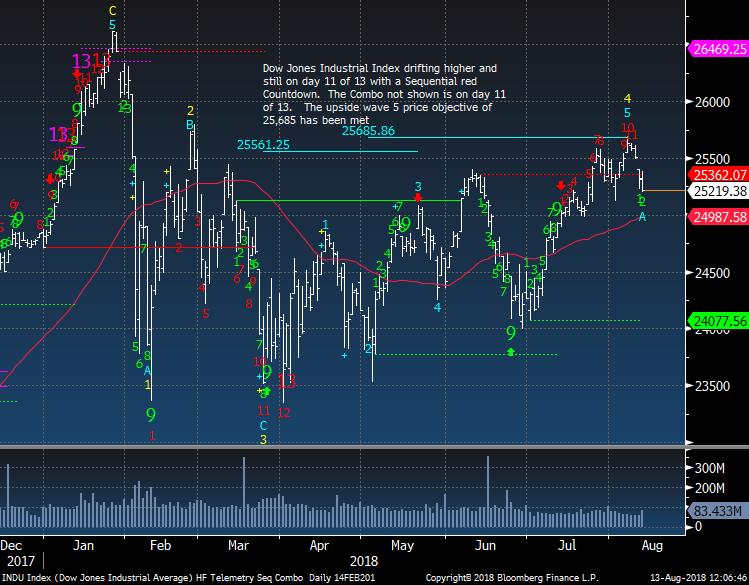
Dow Jones Industrial Average also fading ahead of the 13.
|
|
|
|
|
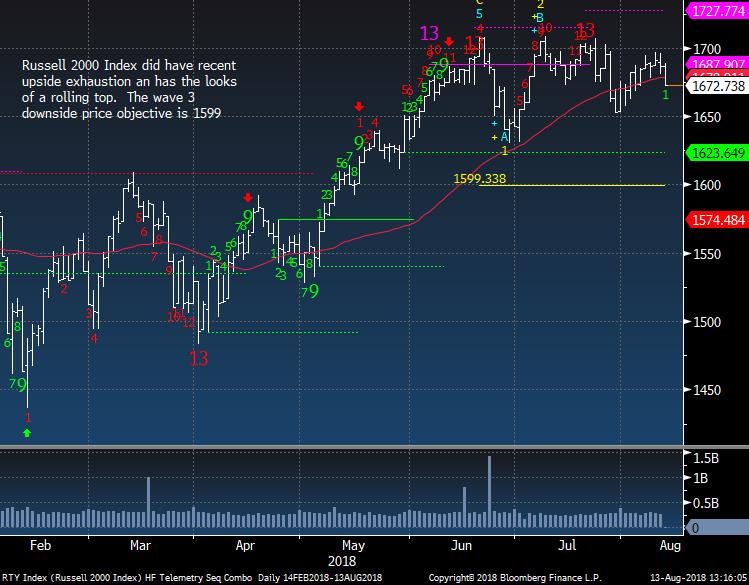
Russell 2000 breaking the 50 day today
|
|
|
|
|
|
|
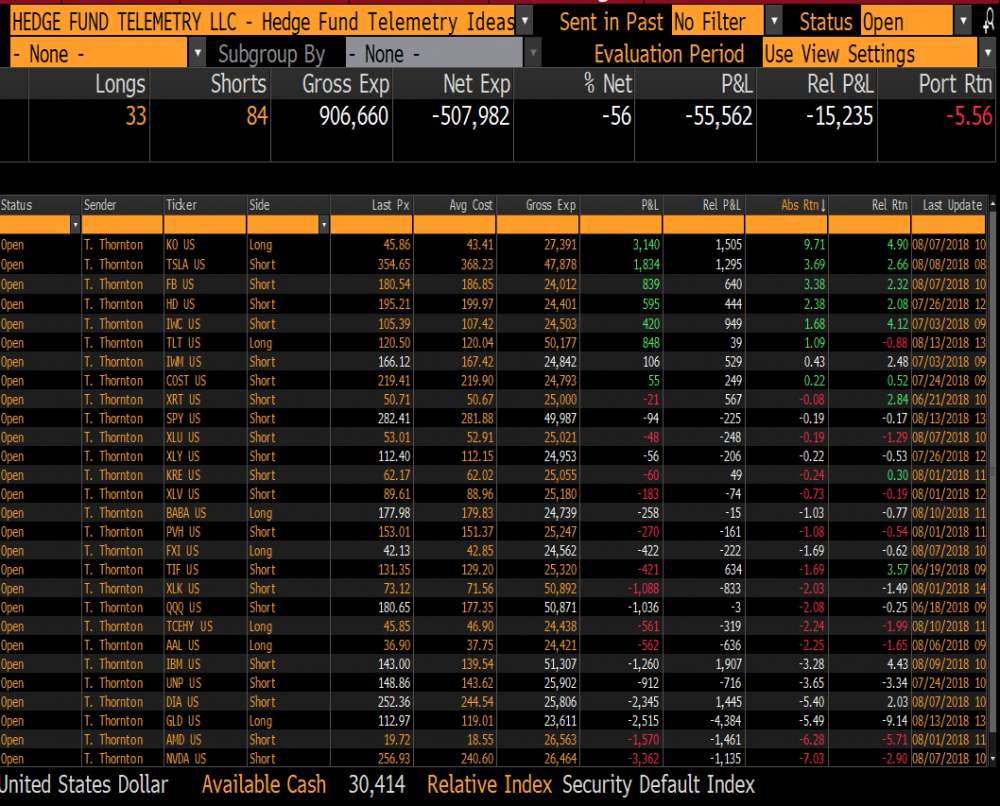
Hedge Fund Telemetry Trade Ideas
|
|
|
Trade Ideas - added 2.5% to TLT long, Sold short SPY 5%, reduced GLD long. Closed HAL long +1%. Will revisit Gold and oil drillers again soon.
|
|
|
|
|
|
|
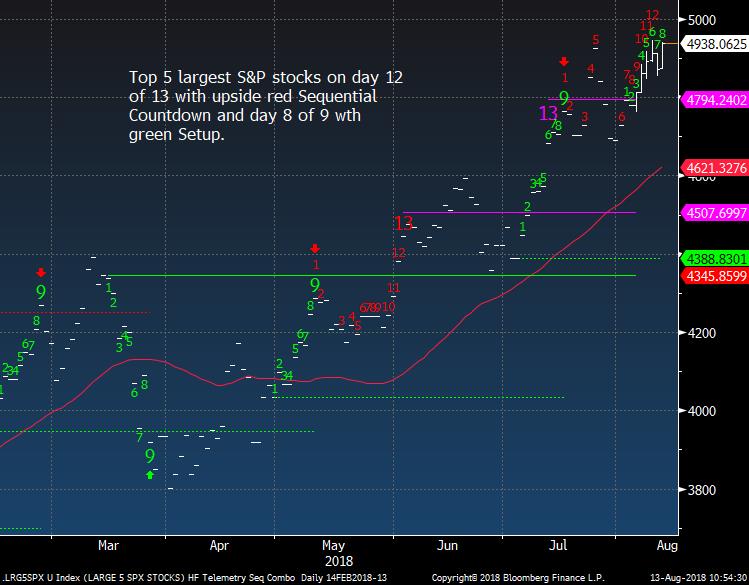
What's been leading the market
|
|
|
The top 5 market cap names in the SPX nearly have an upside exhaustion.
|
|
|
|
|
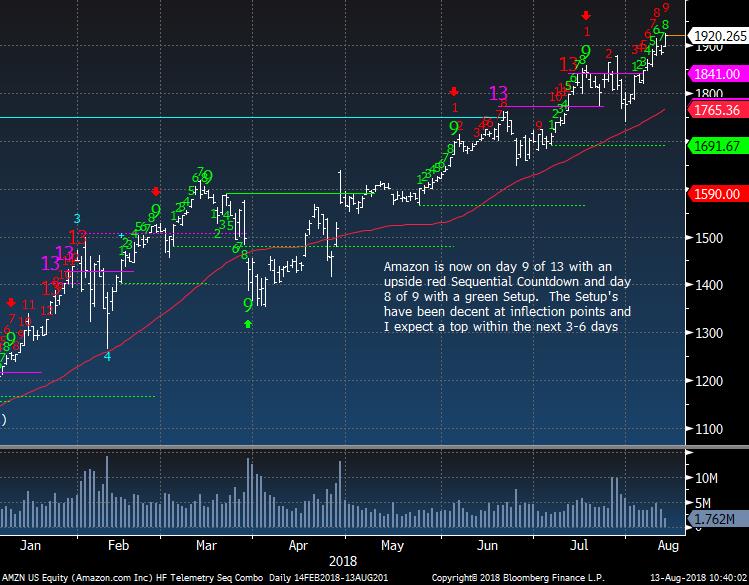
AMZN continues higher but it's getting late in the move and tomorrow could see a green Setup 9 and those have see inflection points on upside and downside work
|
|
|
|
|
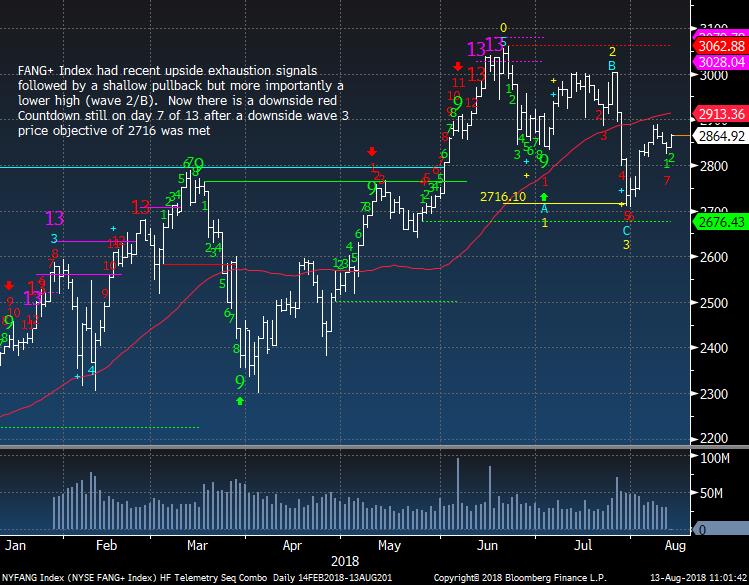
FANG + Index potential making another lower high
|
|
|
|
|
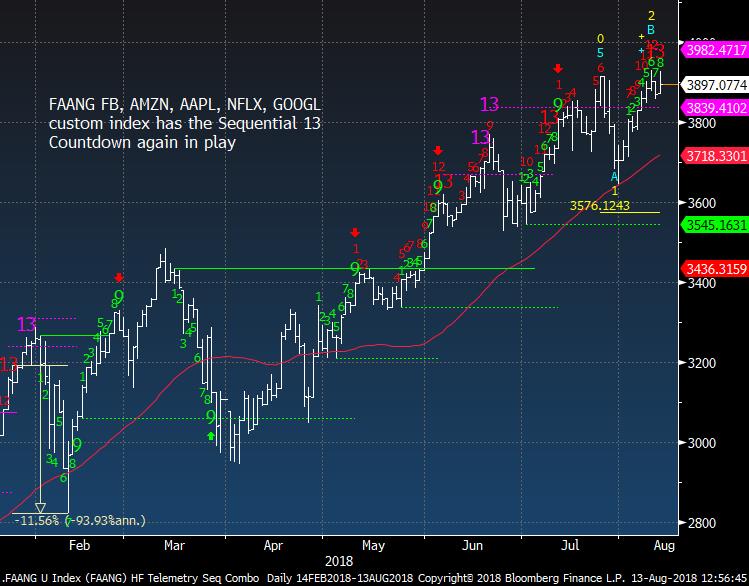
FAANG Custom Index did have the upside exhaustion 13
|
|
|
|
|
|
|
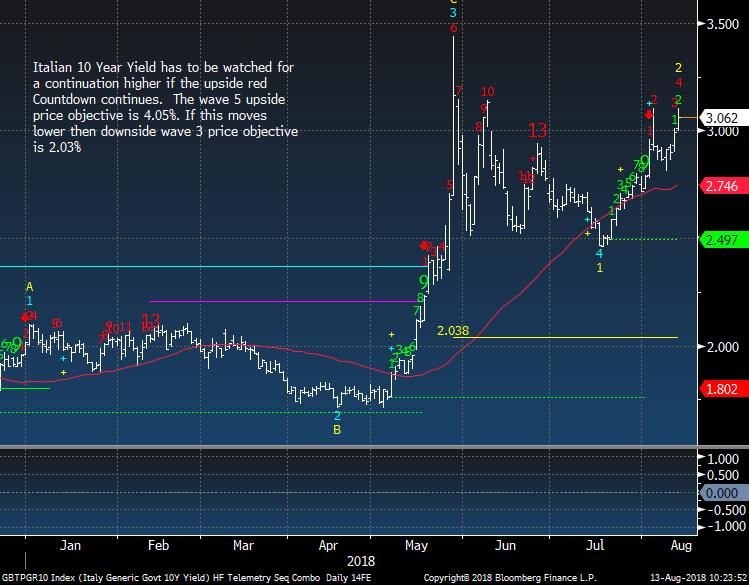
Italian 10 Year Yield - Another contagion risk
|
|
|
The Italian bond market is the largest bond market in Europe and the Italian bond market is under pressure with the 10 year yield moving higher with an upside Countdown on day 4 of 13
|
|
|
|
|
|
|
|
|
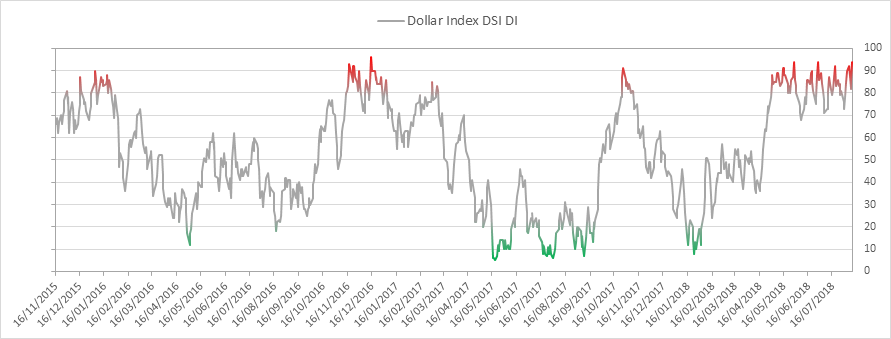
US Dollar bullish sentiment is at 94% and this is very extreme but it can and might stay up in this range until there is a trigger that turns it lower
|
|
|
|
|
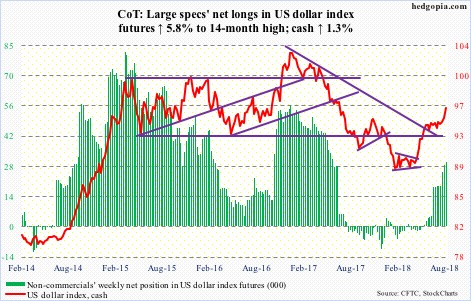
US Dollar Index positioning with COT data shows a continued move to more bullishness but still way below what we've seen in past years
|
|
|
|
|
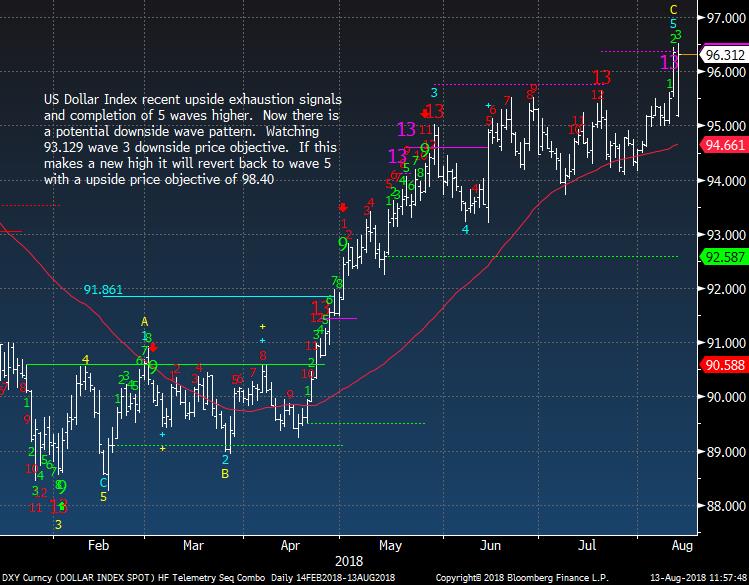
US Dollar Index is moving above the yesterday's high ignoring the pink Combo from Thursday. This should pullback with high sentiment and the Combo but the trend might be just too strong.
|
|
|
|
|
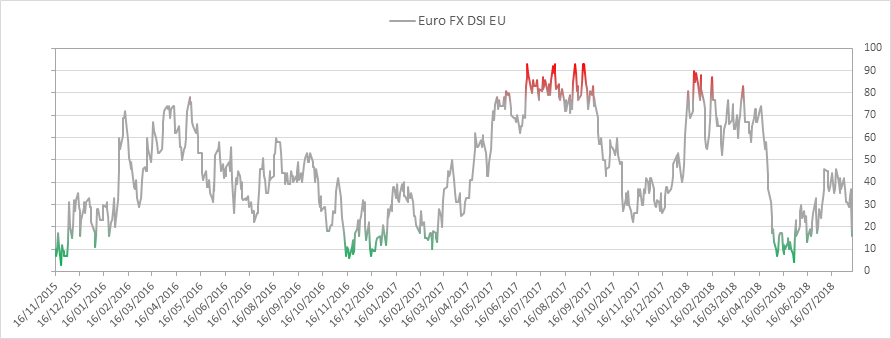
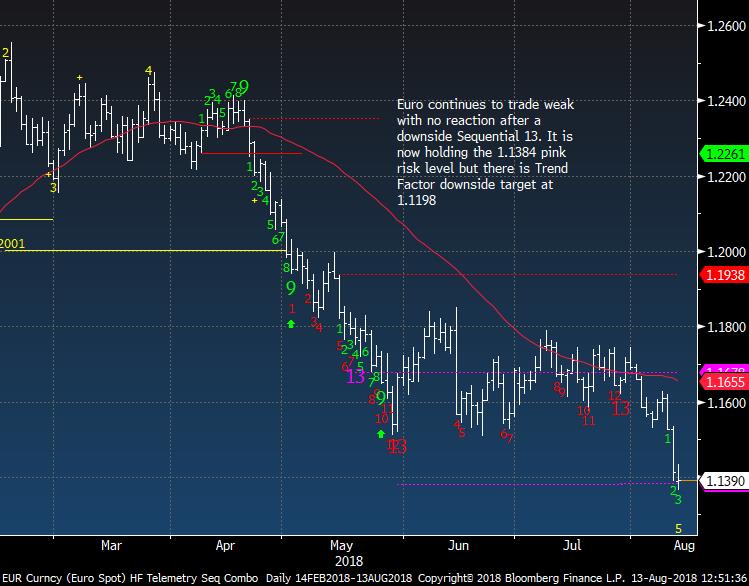
Euro bullish sentiment is at 16% and the British Pound is at 7% - both very low
|
|
|
|
|
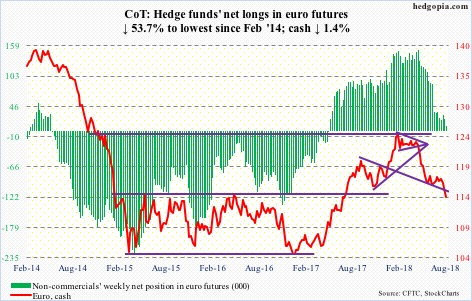
COT Euro speculator positioning was set up very bullish but has dropped and could start to move into the short side
|
|
|
|
|
Euro stalled on the downside 13's but has now broken and could move to 1.1198
|
|
|
|
|
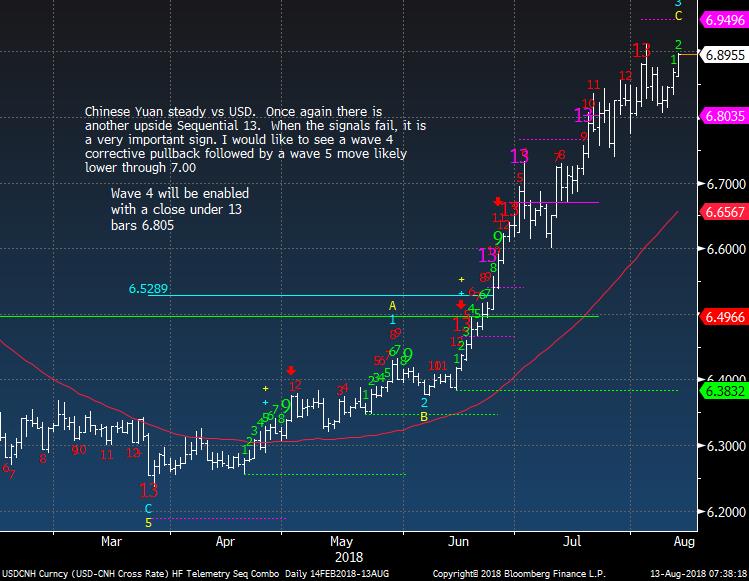
Yuan was briefly under 6.90 today and on this daily chart the 13's have truly been ignored
|
|
|
|
|
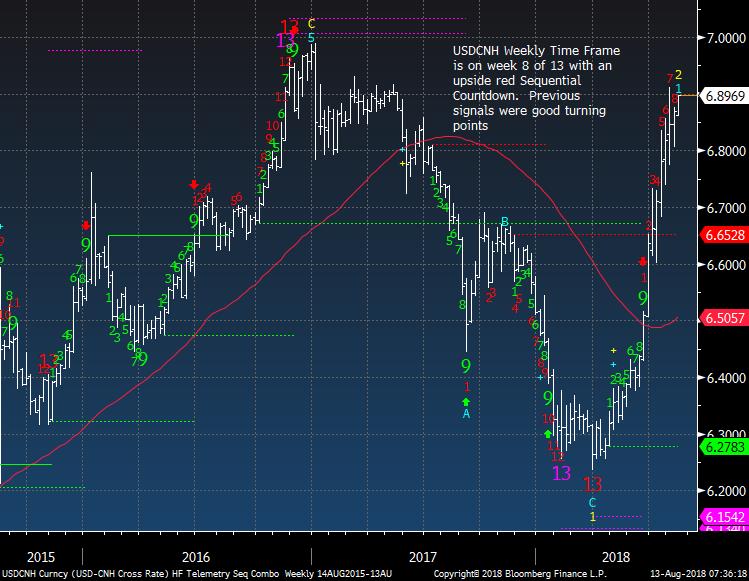
Yuan on a weekly time frame is a much better tell vs the daily time frame. More downside ahead
|
|
|
|
|
|
|
|
|
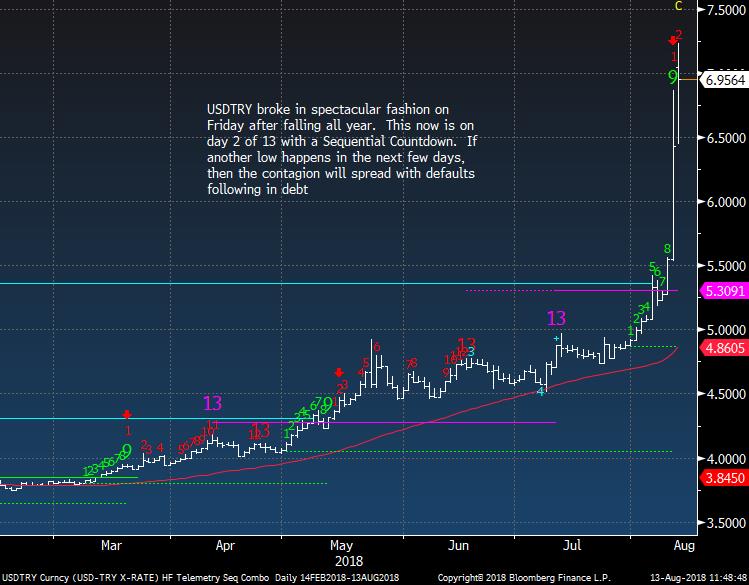
Turkish Lira hit the breaking point last Friday and if this continues a few more down days, this currency will collapse
|
|
|
|
|
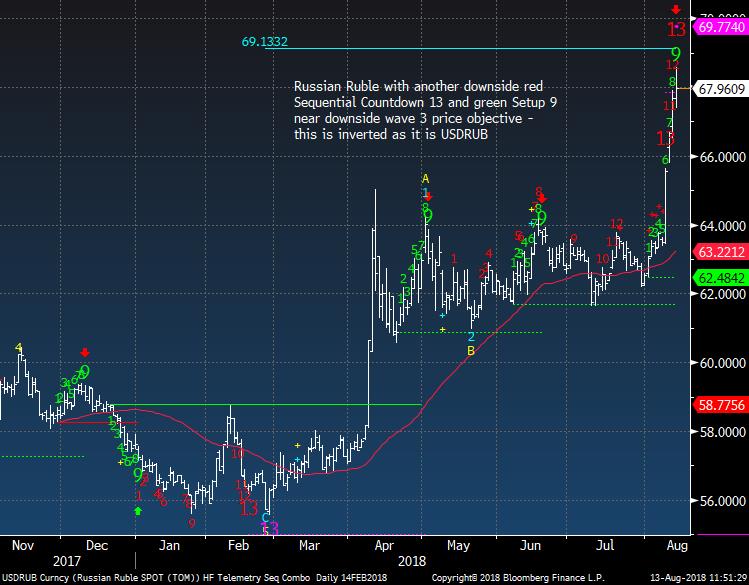
Russian Ruble did get another downside 13 today and might turn tomorrow.
|
|
|
|
|
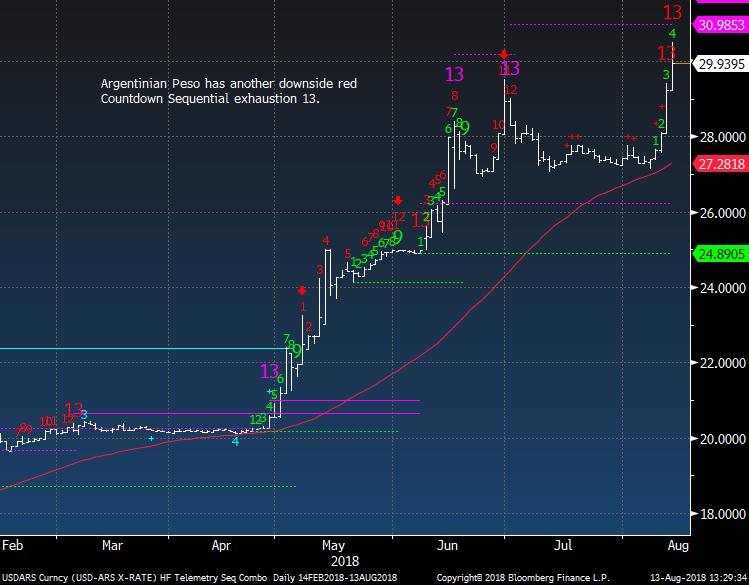
Argenina Peso like Russian Ruble likely will gain in the coming days
|
|
|
|
|
|
|
|
|
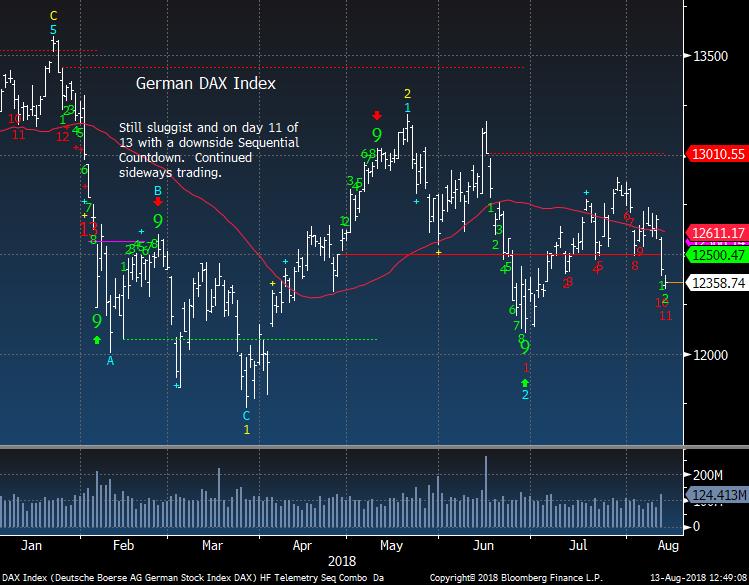
German DAX Index on day 11 of 13 and perhaps we can get a turn that works and will break the chain of lower highs
|
|
|
|
|
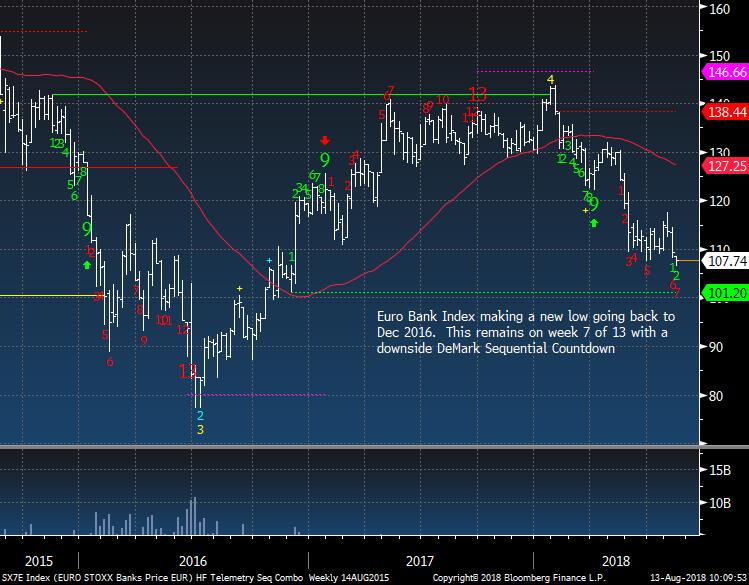
Euro Bank Index weekly is the most important chart in Europe.
|
|
|
|
|
|
|
|
|
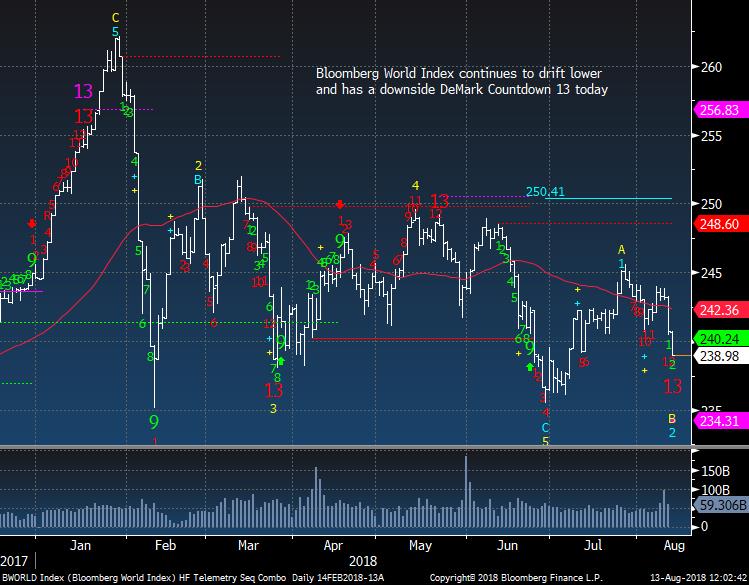
Bloomberg World Index did get the Sequential 13 today. This is a potential positive
|
|
|
|
|
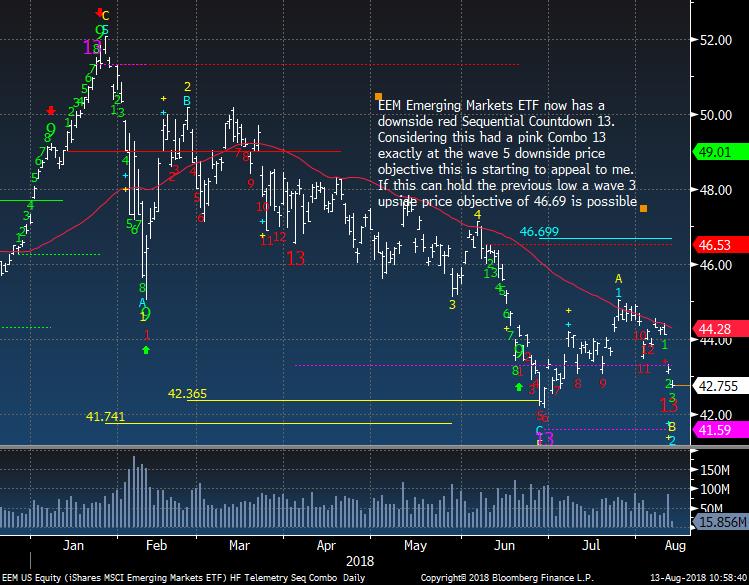
EEM Emerging Markets ETF has a downside exhaustion 13 too
|
|
|
|
|
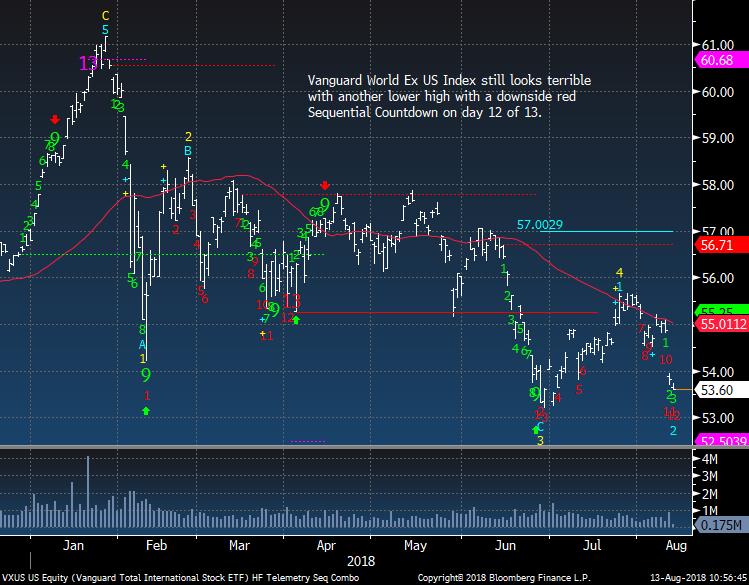
Vanguard Global ex US is on day 12 of 13. Another potential positive
|
|
|
|
|
|
|
|
|
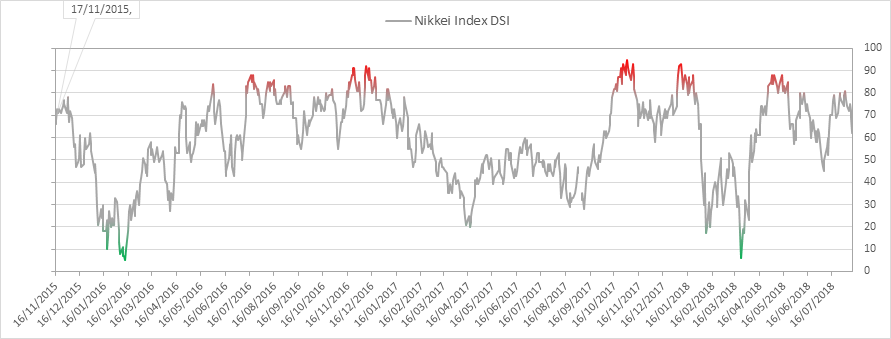
Nikkei bullish sentiment is at 62%
|
|
|
|
|
Nikkei has been range bound.
|
|
|
|
|
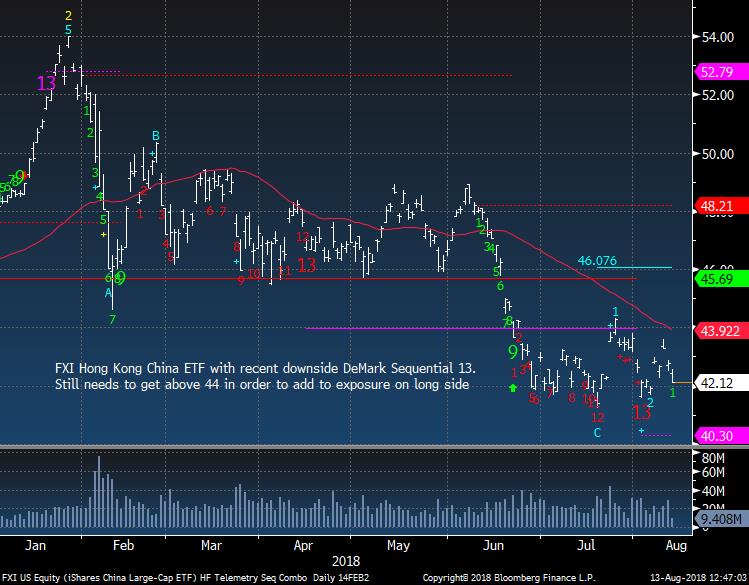
FXI Hong Kong China ETF still can't get any mojo on the upside...yet
|
|
|
|
|
India Nifty Fifty price flip down today
|
|
|
|
|
|
|
|
|
Crude bullish sentiment is at 73%
|
|
|
|
|
Crude has been stair stepping down
|
|
|
|
|
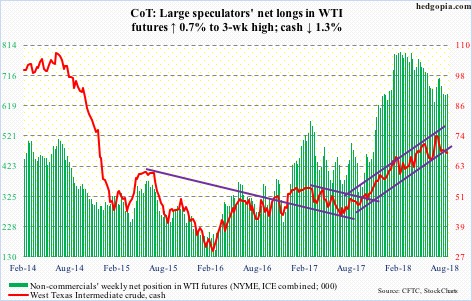
COT data shows for crude shows speculators still with very bullish positioning
|
|
|
|
|
|
|
|
|
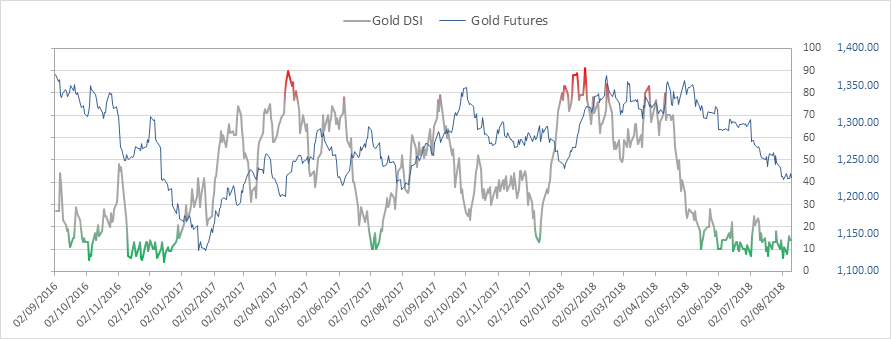
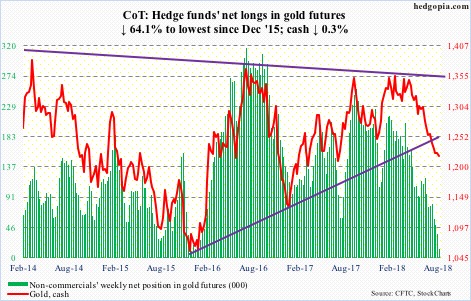
Gold bullish sentiment is at 14%
|
|
|
|
|
Gold could not hold and I am reducing my long until we see a turn in the 10 day moving average (it currently is 2% below the 10 day and I want to see it turn up and will add into strength. This just hasn't turned despite the signals, low sentiment and positive seasonality coming
|
|
|
|
|
COT data shows gold positioning with speculators at VERY low levels and this is somewhat a bullish backdrop
|
|
|
|
|
|
|
|
|
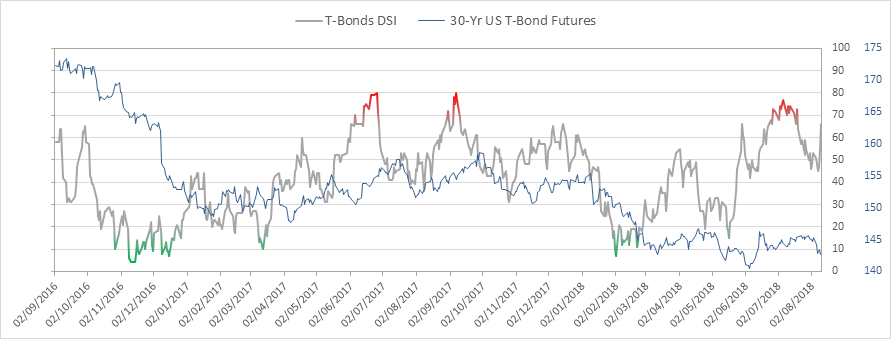
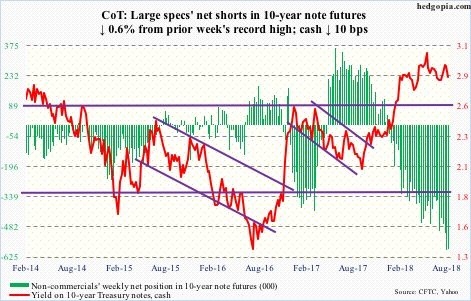
Bond bullish sentiment is at 66% and increasing from 55% the previous day
|
|
|
|
|
|
|
|
|
COT data shows VERY LARGE short positioning with speculators (hedge funds). This is a bullish read as a short squeeze potential is strong
|
|
|
|
|
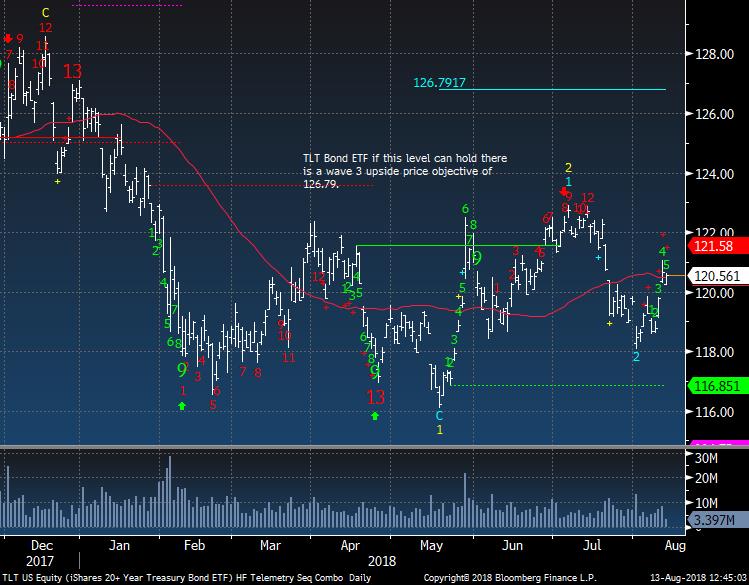
TLT Bond ETF held the recent lows and has a wave 3 upside price objective of 126.79. I added back 2.5% long to make the long 5% again. I sold 2.5% at the red 12.
|
|
|
|
|
|
|
DEMARK SCREENS - Daily, Weekly, Monthly Upside/Downside Exhaustion Signals
|
|
|
Daily/Weekly DeMark upside/downside exhaustion signals (Sequential) weekly updated on Monday's and monthly on the first day of the new month. Price flips occur when a stock closes higher/lower than four previous closes and increases conviction of a price turn.
The upside 13's are sell signals and downside 13's are buy signals. Price flip's are confirmation signals that increases potential for a price trend change. For example, if you are long a stock and there is an upside 13, you will want to take cautious action by selling down or out of a position. If initiating a short sale with the upside 13's, we tend to start with a 1/2 size and add with the downside price flip. The opposite is true for when there are downside 13's. Take a 1/2 size position
and add with the upside price flip. The DeMark Indicators are designed to assist the user with buying into weakness and selling into strength to anticipate trend exhaustion. Selling into a rally and buying into a decline often afford the opportunity to exit a trade without too serious a loss if wrong.
S&P 1500 Universe:
DAILY UPSIDE 13: ADP, CCE, ED, ETR, FNFG, MNK, PNW, QCOR, TBI, WCG, XEL
DAILY DOWNSIDE 13: BBT, BWA, CAT, EL, GE, HAL, SLB
DAILY UPSIDE WITH PRICE FLIP REVERSAL DOWN: ADC, ADM, AKRX, CACI, CASY, LXP, MRK, OFC, POST, SLG, TBI, ZTS
DAILY DOWNSIDE WITH PRICE FLIP REVERSAL UP: CPWR, SLB
Updated: 8/13/18
WEEKLY UPSIDE 13: BAC, BKE, CMG, EXPD, FE, FISV, HSII, JPM, MNRO, MTRX, POWL, RSG, TJX, ZTS, ZUMZ
WEEKLY DOWNSIDE 13: AHL
Updated: 8/1/18
MONTHLY UPSIDE 13: AIZ, ATR, BIO, CBU, CDNS, CMS, CSX, DGX, EE, FCN, FIX, GTY, HAE, HAS, IDXX, IEX, KSU, MA, NI, NPK, PTC, RLI, ROL, WEC
MONTHLY DOWNSIDE 13: CIR, HIBB
Euro Stoxx 600 Universe:
DAILY UPSIDE 13: HL/ LN, SBRY LN, UCB BB, WKL NA
DAILY DOWNSIDE 13: ENGI FP, LR FP, TEF SM, TIT IM
DAILY UPSIDE WITH PRICE FLIP REVERSAL DOWN: NONE
DAILY DOWNSIDE WITH PRICE FLIP REVERSAL UP: BAS GR
Updated: 8/13/18
WEEKLY UPSIDE 13: RI FP
WEEKLY DOWNSIDE 13: NONE
Updated: 8/1/18
MONTHLY UPSIDE 13: TEMN SW
MONTHLY DOWNSIDE 13: CO FP, GETIB SS, RXL FP, TALK LN
|
|
|
Unsubscribe me from Hedge Fund Telemetry
Hedge Fund Telemetry LLC, P.O. Box 4675, Greenwich, CT 06861, United States
CONFIDENTIALITY NOTE and DISCLAIMER: This message is for the named person's use only. It may contain confidential, proprietary or legally privileged material. No confidentiality or privilege is waived by any accidental or unintentional transmission. If you receive this message in error, please immediately delete it and all copies of it from your system, destroy any hard copies and notify the sender. You must not, directly or indirectly, use, disclose,
distribute, print or copy any part of this message if you are not the intended recipient. Hedge Fund Telemetry LLC. cannot guarantee the confidentiality of the material transmitted; therefore, information of a sensitive or confidential nature should not be transmitted. There is risk in trading markets. Hedge Fund Telemetry LLC reports are based on information gathered from various sources and believed to be reliable, but are not guaranteed as to accuracy and completeness. The information is subject to change without notice and Hedge Fund Telemetry LLC has no obligation to provide any updates or changes. Hedge Fund Telemetry LLC is providing this data for informational and educational purposes and does not believe that it is sufficient to base an investment decision on. This information should not be regarded as a solicitation or recommendation of any particular security or to engage in any trading strategy. One should always check with your licensed financial
advisor to determine suitability of any investments.
|
|
|
|
|