|
|
|
|
|
|
Here's what type of stock is lifting today's
market
|
|
|
First, a couple of announcements. Tomorrow I will be doing a live Webinar - Hedge Fund Telemetry Daily Note Live at 10:15am - 10:45am instead of a sending a note. The focus will be only on indexes that are nearing DeMark upside exhaustion signals combined with the extreme levels in sentiment. Here is the sign up link. There will be a reply sent shortly after the webinar to all clients. Second, next week I am going to be traveling to Dallas, taking my youngest daughter to college. I will do my best to send something each day if the tears stop long enough for my to fire up the Bloomberg.
We are starting to get a lot of upside DeMark Countdown 13's on some major indexes and ETF's with the backdrop of extreme levels in bullish
sentiment. Similar to January's top. Today I'm introducing a few new charts I've used with my process for many years. Phil Erlanger, used to be the head of technical analysis at Fidelity years ago before he set off on his own to create his own firm and proprietary indicators. One area of his specialty is his groundbreaking analysis of short interest. I have two charts below that will explain what type of stock is lifting this market. I was very surprised when I saw the overwhelming type of stock is lifting this market. It really matters because the liquidity in the markets isn't very good according to every derivative trader I speak with and with Prime Broker data. I'll explain more below. Let's get to it.
- US Markets - Sentiment is extreme, upside exhaustion signals are near. People doing same thing they did in January.
- Hedge Fund Telemetry Trade Ideas - No changes
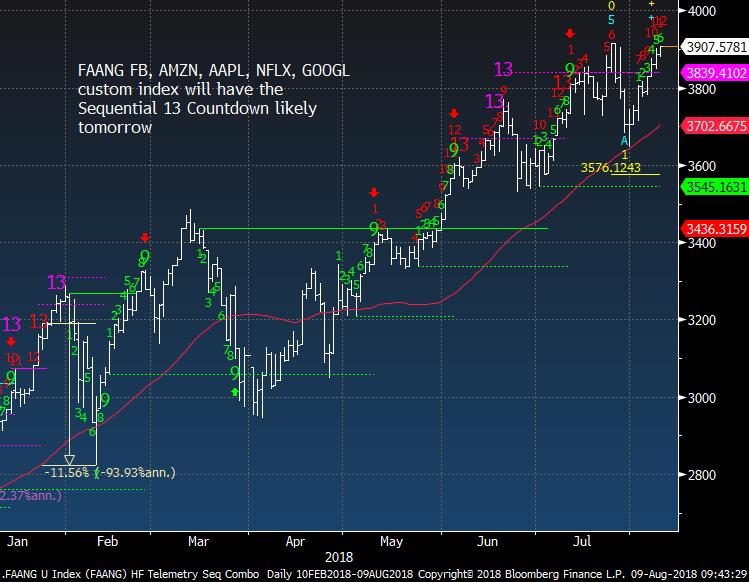
- FAANG Update -
Near upside exhaustion
- Erlanger - Type 4's are leading the market higher and that's not good
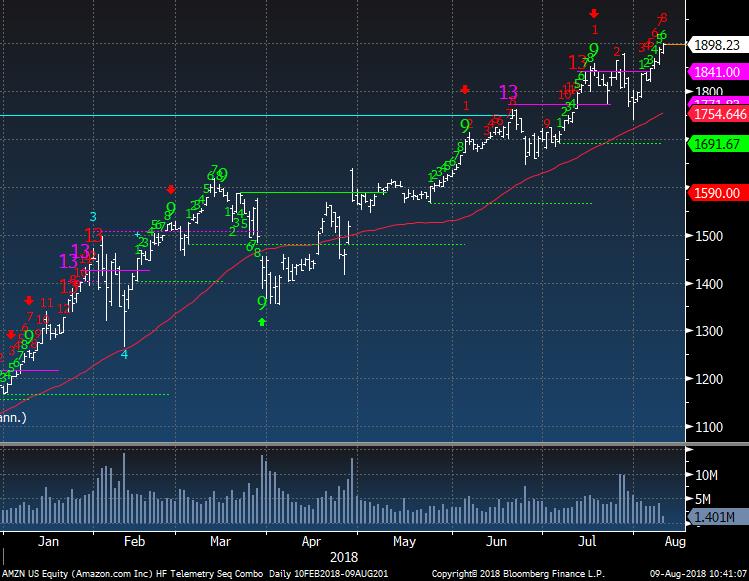
- Amazon - Not only do they own the world but they own this market
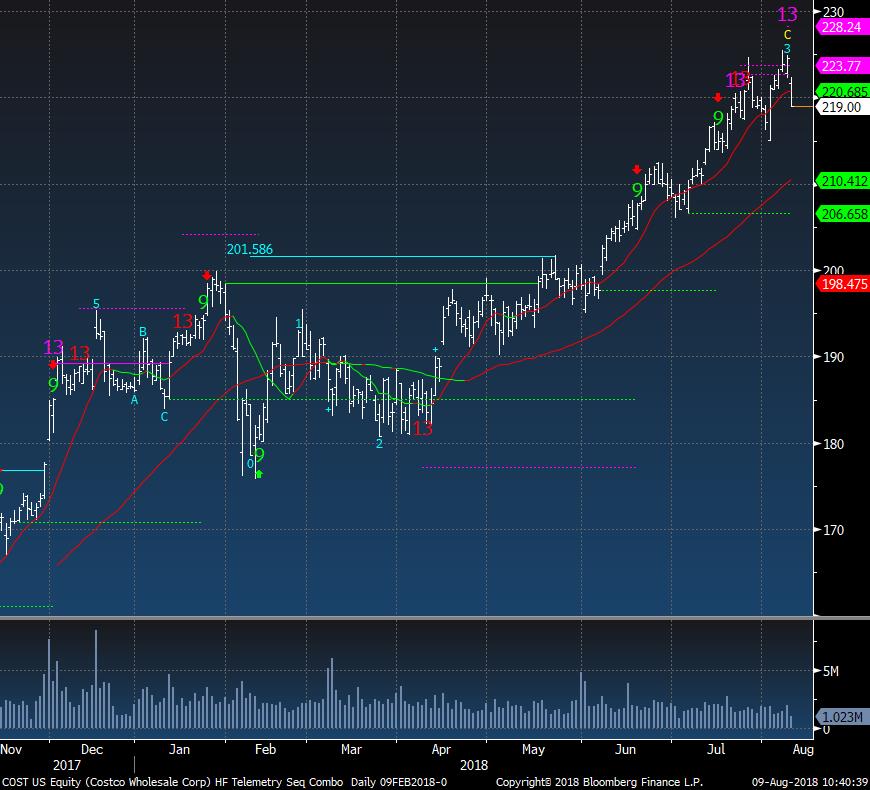
- Costco Update
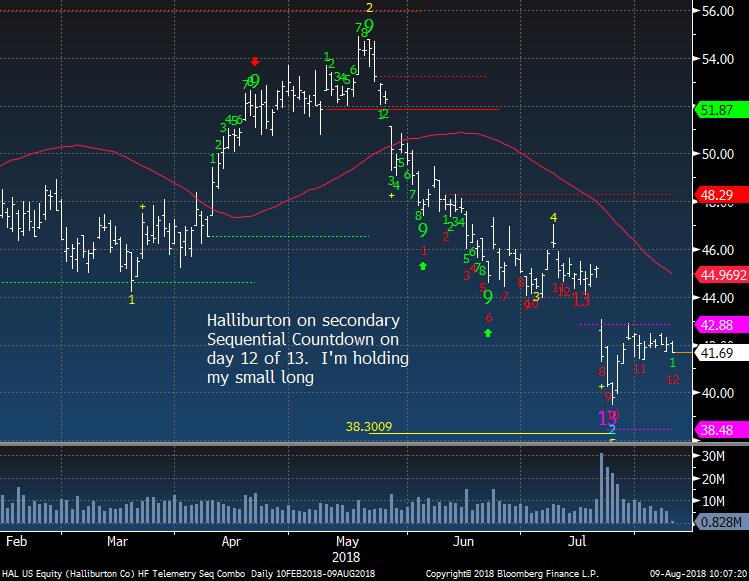
- Halliburton Update
- PVH Update
- XRT Retail ETF Weekly Upside exhaustion signal
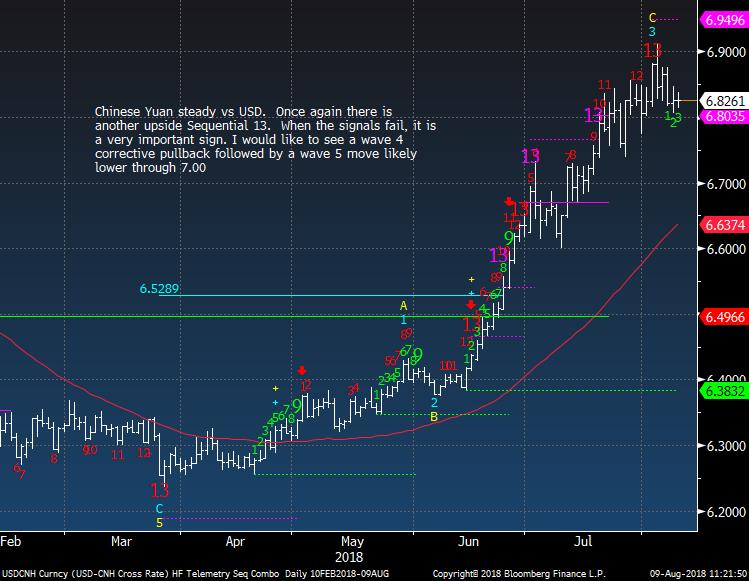
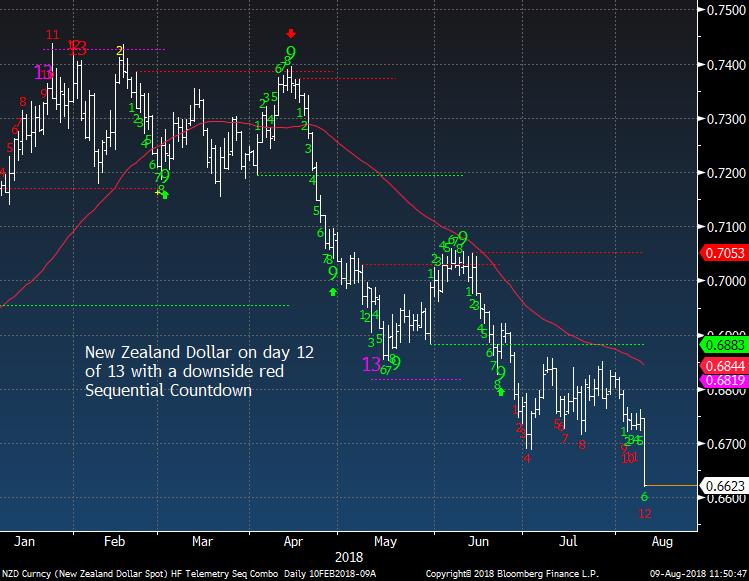
- Currency Update - Some potential for upside in USD, Sterling downside exhaustion today. Lira crazy. New Zealand Dollar big move today
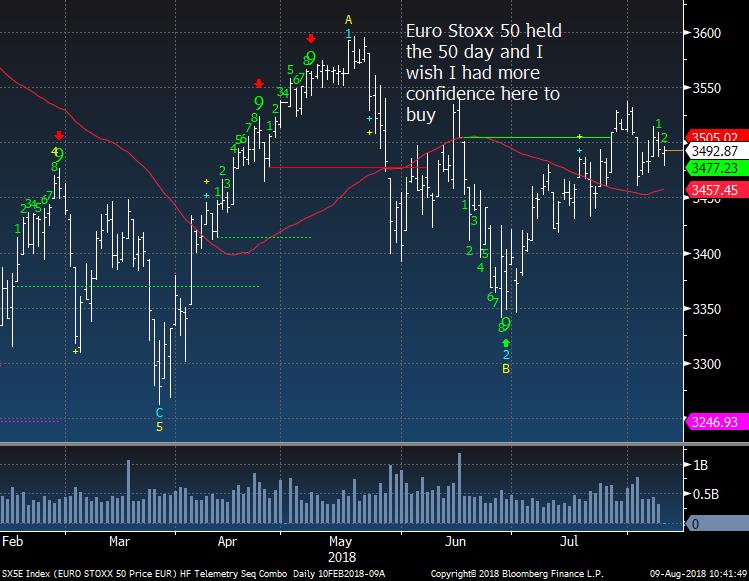
- European Market Update - I am tempted to buy Europe
- Global Market Update - EEM still at 50 day
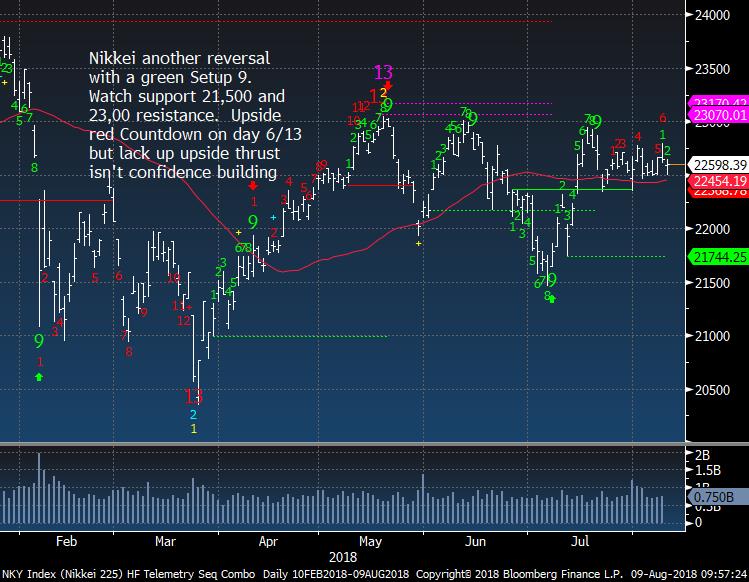
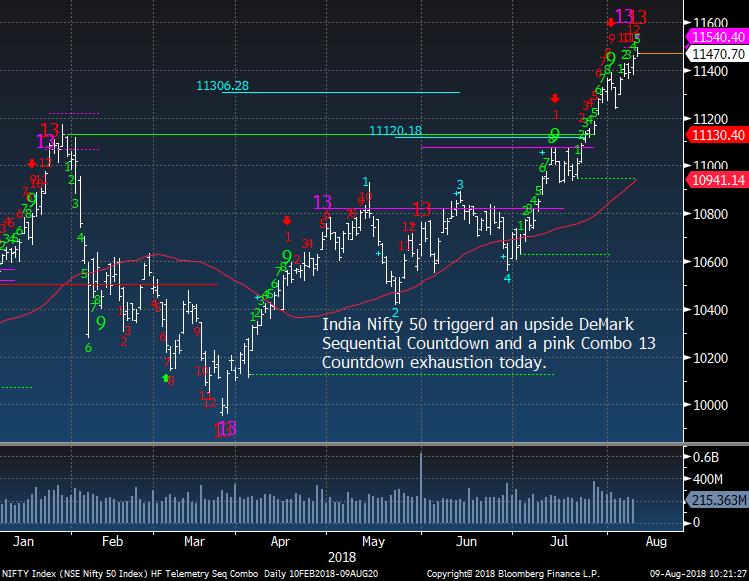
- Asian Market Update - FXI looks good as does Hong Kong, India Nifty Fifty upside exhaustion today
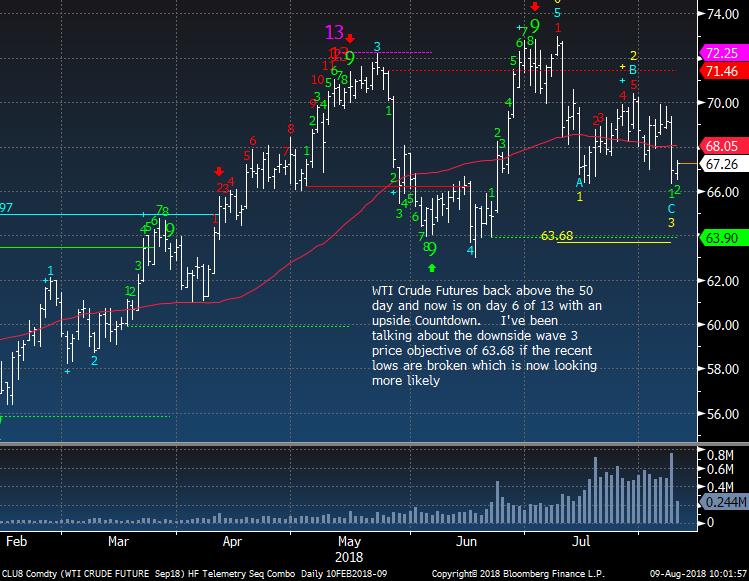
- Crude Update - Trying to hold after big down day
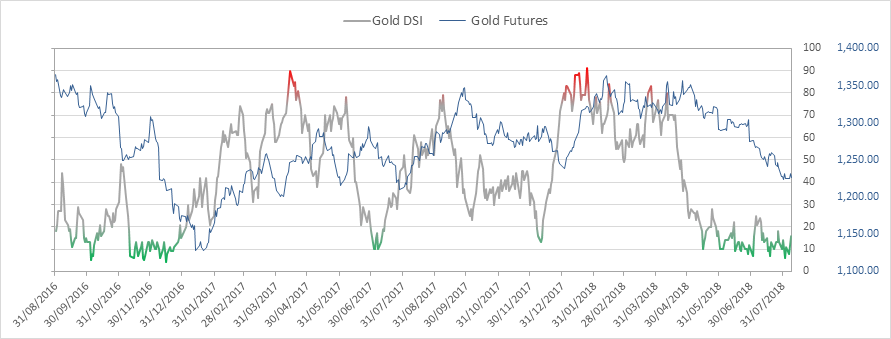
- Gold Update
- A little positive action but don't get too excited yet
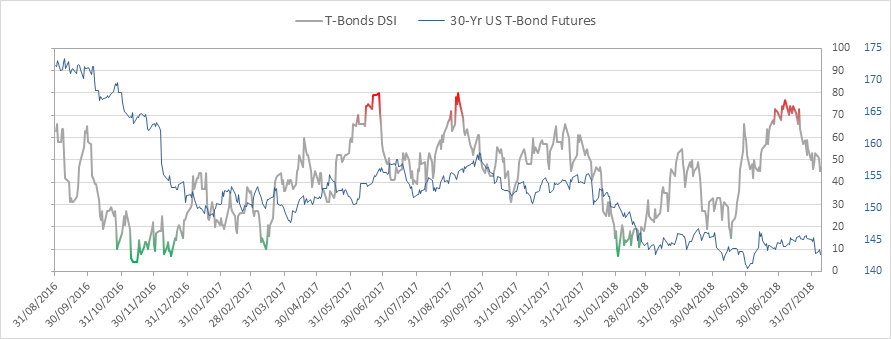
- Bond Update - Mixed picture still in tight range.
- DeMark Screens - Daily, Weekly, Monthly upside/downside exhaustion signals within the S&P 1500 and Euro Stoxx 600
|
|
|
|
|
Here's a link to the Hedge Fund Telemetry market sentiment page with 40 charts of sentiment including equities, bonds, currencies, and commodities updated each day.
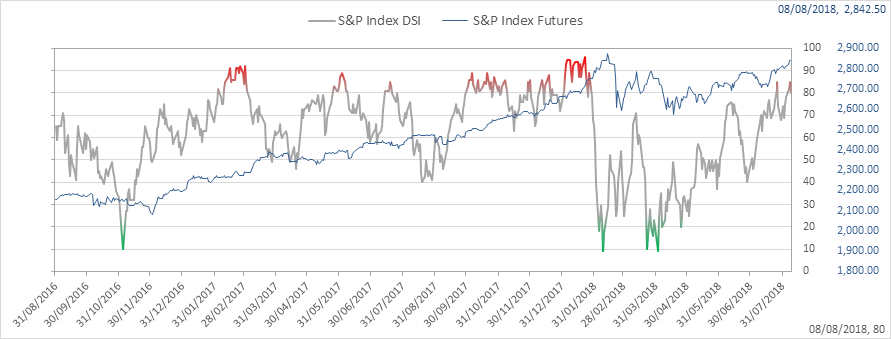
SPX bullish sentiment is at 80% still extreme
|
|
|
|
|
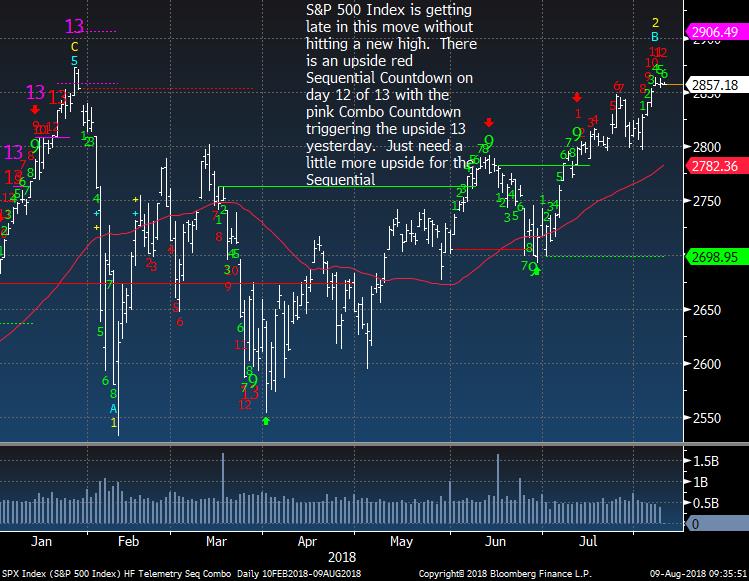
SPX daily remains in day 12 of 13
|
|
|
|
|
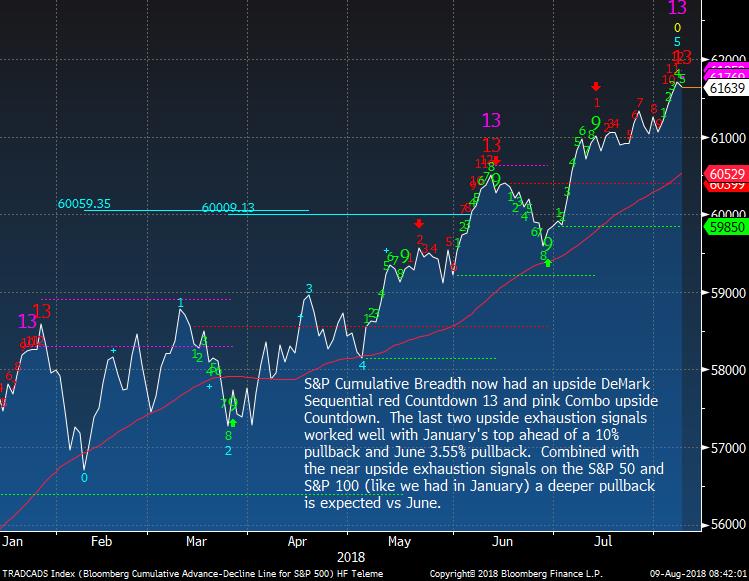
S&P Cumulative breadth now has both red Sequential and pink Combo 13. This really gets people revved up because "breadth is good... breadth is good... breadth is good"
|
|
|
|
|
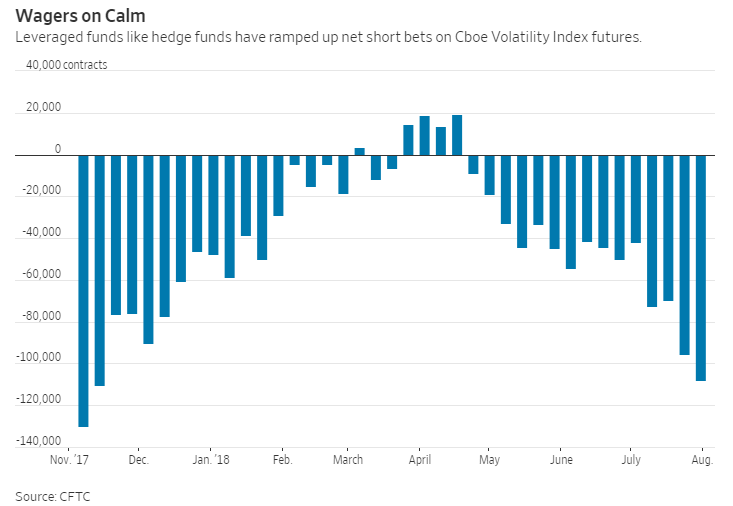
You all recall when I clipped a headline from the WSJ in January that was about investors abandoning hedges? Here's another one to file under "They never learn"
|
|
|
|
|
|
|
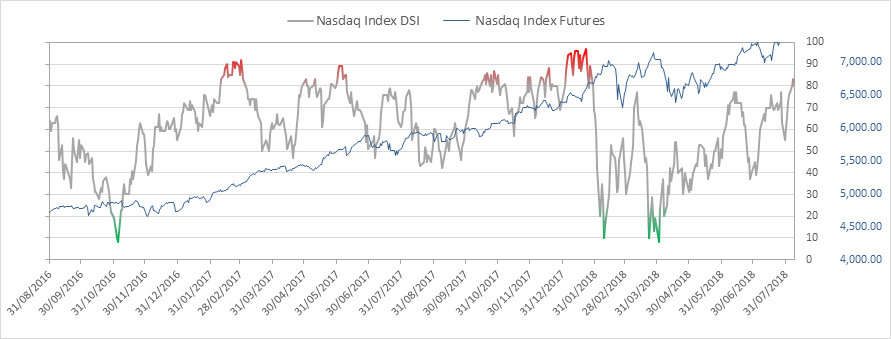
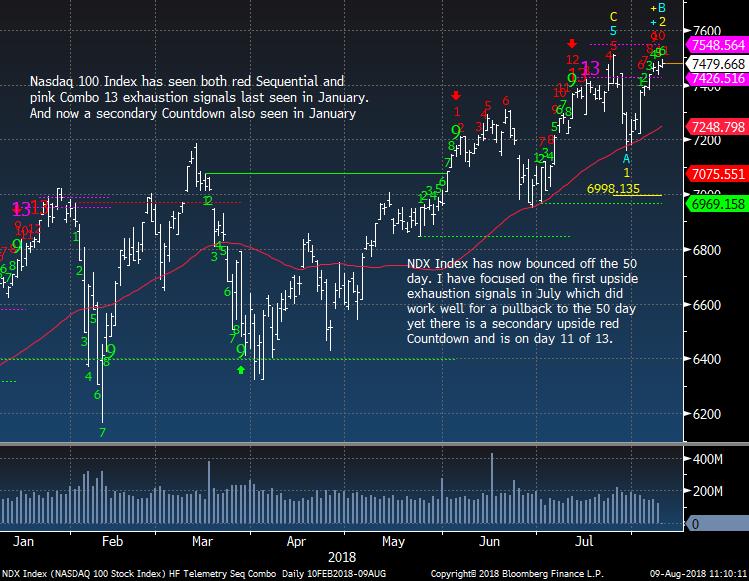
Nasdaq bullish sentiment is at 80%
|
|
|
|
|
NDX Index on day 11 of 13
|
|
|
|
|
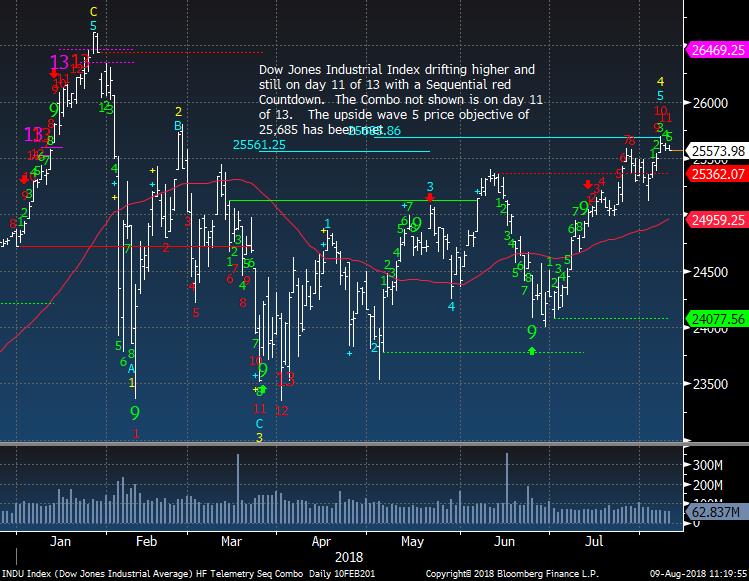
Dow Jones Industrial Average on day 11 of 13 too
|
|
|
|
|
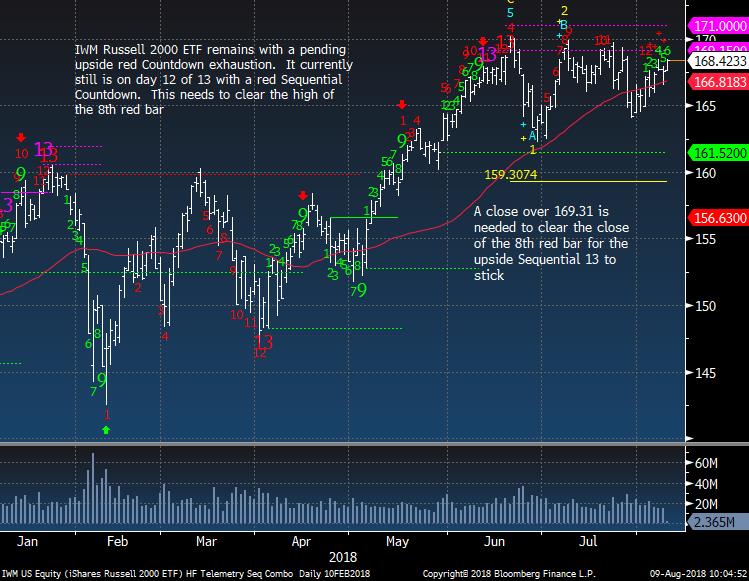
IWM Russell 2000 is on day 12 of 13 and needs a little more upside for the 13
|
|
|
|
|
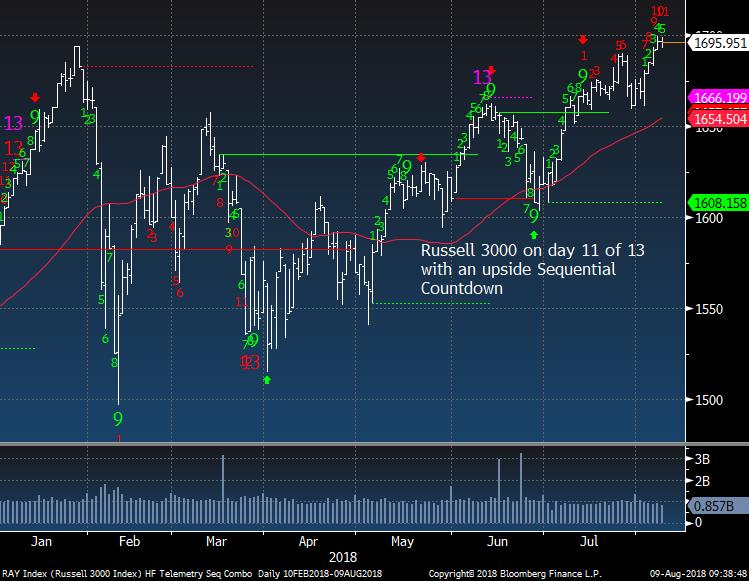
Russell 3000 hit a new high yesterday with only 4% of the index making a 52 week high. This seems troubling considering in January the percentage of stocks hitting 52 week highs was a lot higher. This is on day 11 of 13 too
|
|
|
|
|
|
|
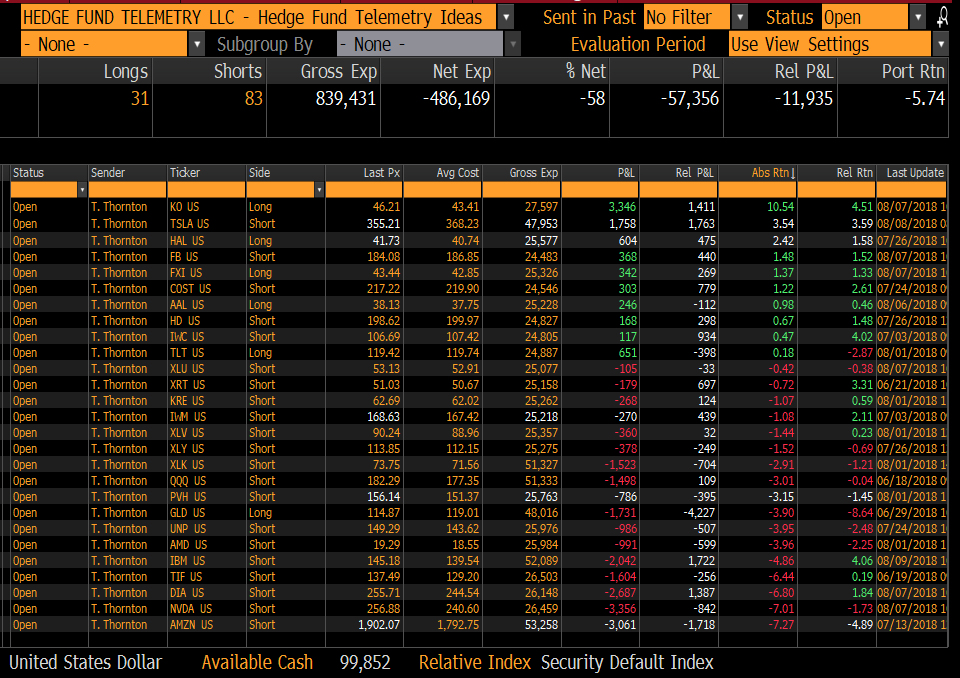
Hedge Fund Telemetry Trade Ideas
|
|
|
Trade Ideas - No changes today.
|
|
|
|
|
|
|
Erlanger Data - Type 4's leading the market is not a good sign
|
|
|
Erlanger has separated stocks into 4 types with regards to short interest. Type 1's are short squeeze candidates. Super high short interest squeeze potential high. Type 2's are stocks that have recognized strength (usually attracting short sellers after a larger move). Type 3''s are when short sellers are right and the stocks are dropping. Type 4's are long squeezes which is when there are stocks that have relatively low short interest that could slip
lower without the natural short seller buyer. A stock like Facebook or Netflix were a type 4 as short interest was relatively low and they were crowded longs. The type 4's are dangerous stocks to be long especially in an extended market and one that lacks strong liquidity. The chart below shows a high level of type 4's (purple) as well the red column that has a proprietary technical rank with every sector under 50% and that's not strong. Another way of looking at the Erlanger 1-4 types: Type 1 = buy, Type 2 = hold, Type 3 = sell, Type 4 = sell short. I'll have more in coming notes. A lot more.
|
|
|
|
|
This is a chart of the SPX with the number of type 4's and when over 9% it's a dangerous place
|
|
|
|
|
|
|
|
|
|
|
|
|
|
|
|
|
Amazon not only has taken over the world but markets too. It has attributed to the YTD NDX gains by nearly 30% now. It's on day 8/13 with a secondary upside Countdown. I am short near 1800 and I look at it as being short at 18 and it's moved to 19. This takes some of the emotion out of it when you think of it being up 100 points. I'm wrong on this again but will wait for the upside Countdowns as this has led going up and will lead going
down.
|
|
|
|
|
|
|
|
|
Costco reported some comps today which were fine but online sales were not so great. I'm staying short as I believe it should see the 50 day
|
|
|
|
|
|
|
|
|
HAL has a secondary downside Countdown on day 12/13 and I'm sticking with my small long position even with some of the nasty action in energy stocks.
|
|
|
|
|
|
|
|
|
|
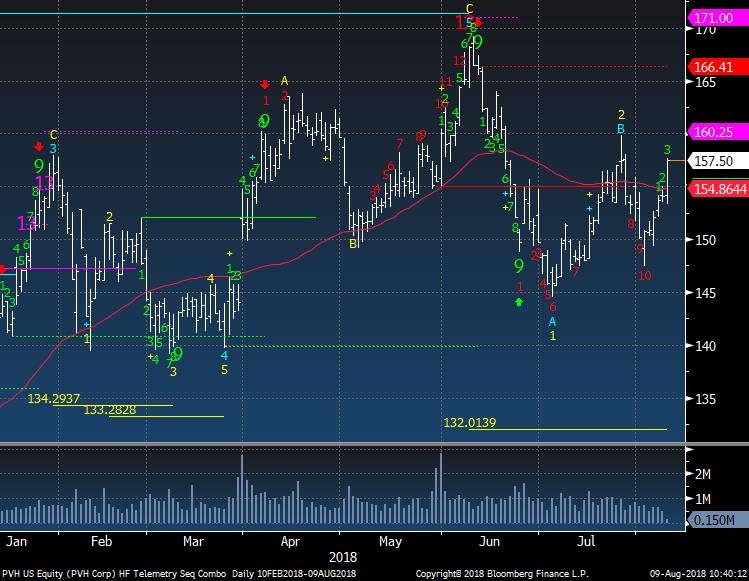
Choppy action in PVH and the break under 150 did not continue lower. I'll stay short for now since I see some weekly issues with XRT below.
|
|
|
|
|
|
|
|
|
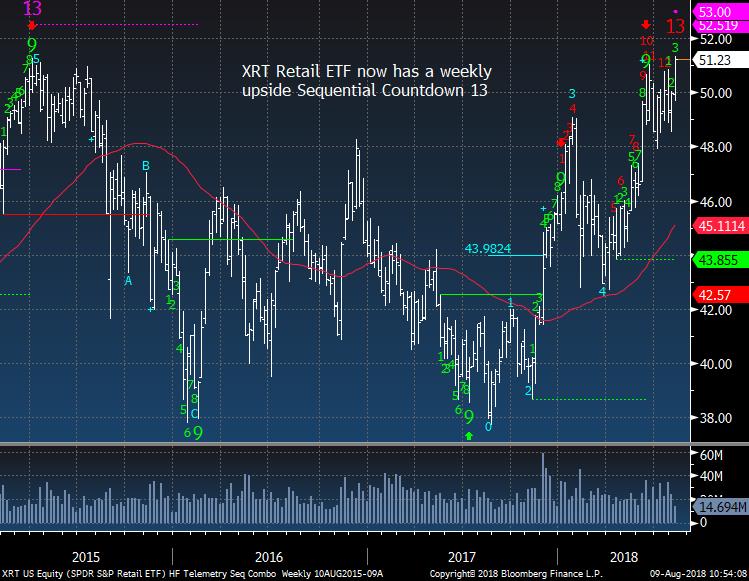
XRT Weekly with a 13 the last on was at the peak in 2015. Could be a tough holiday season with tough comps.
|
|
|
|
|
|
|
|
|
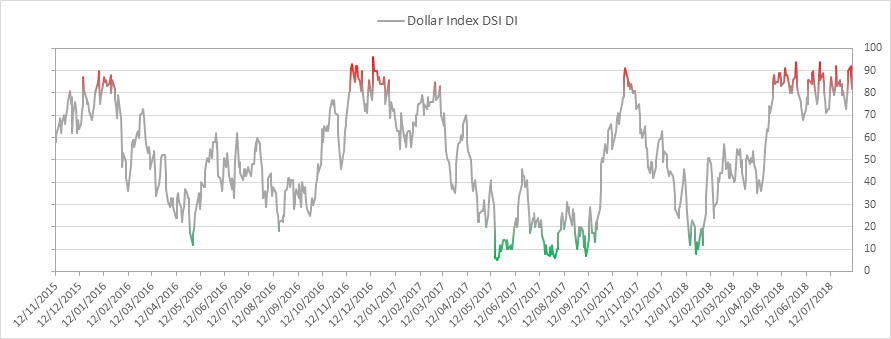
US Dollar bullish sentiment is at 82% and still extreme
|
|
|
|
|
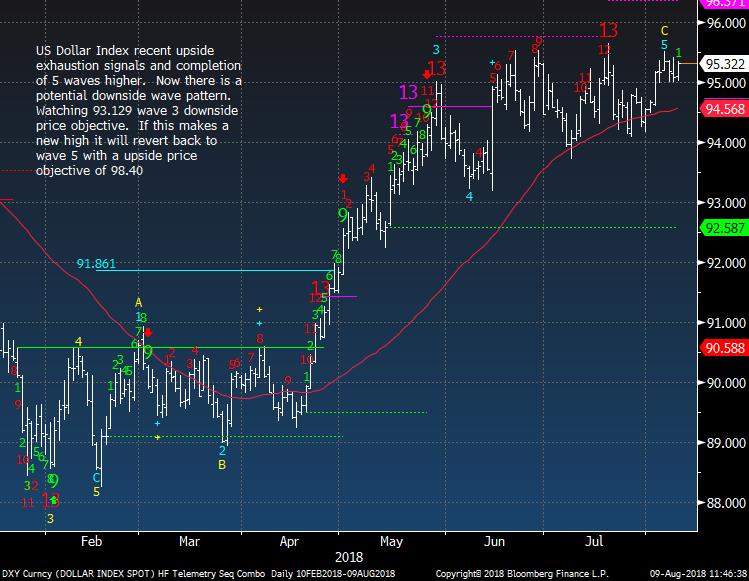
US Dollar Index with the new closing high the other day reverting back to wave 5. This is somewhat positive for the USD as there was an upside wave 5 price objective at 98
|
|
|
|
|
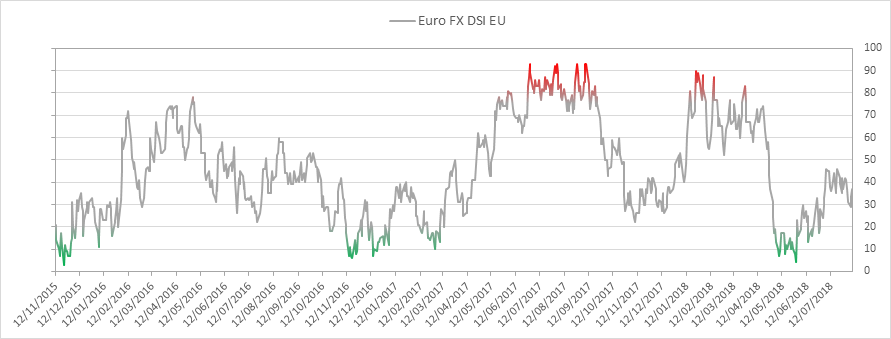
Euro bullish sentiment is at 37%
|
|
|
|
|
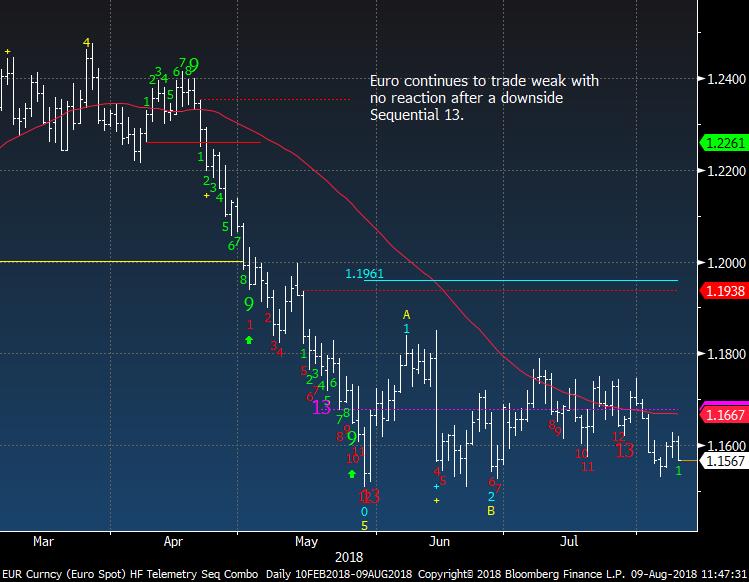
Euro Spot trades poorly and if the May low breaks then this will revert to wave 5 on the downside
|
|
|
|
|
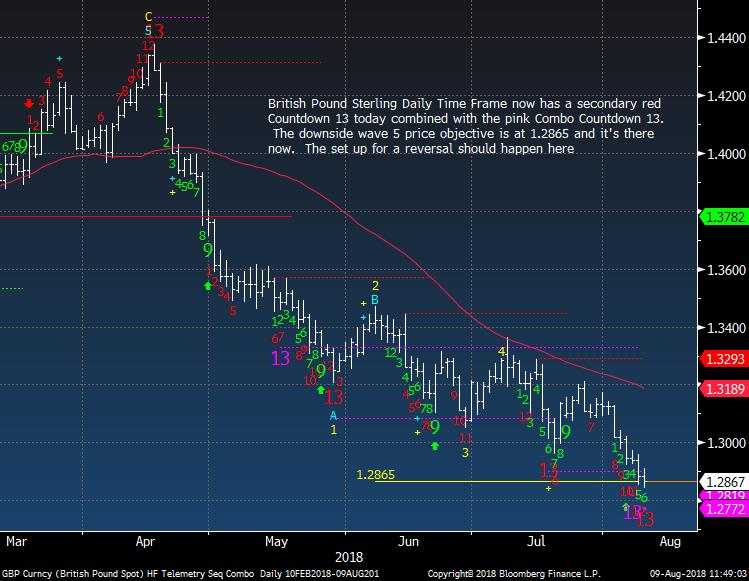
Sterling at important level today with downside exhaustion at wave 5 price objective
|
|
|
|
|
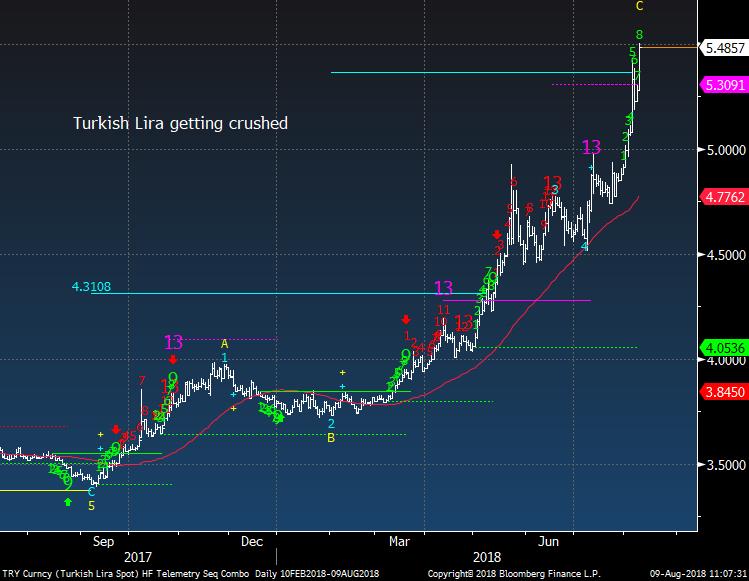
Turkish Lira on day 8 of 9 with a green Setup but I'm not sure that will stop this decline
|
|
|
|
|
|
|
|
|
New Zealand Dollar was crushed and is on day 12 of 13
|
|
|
|
|
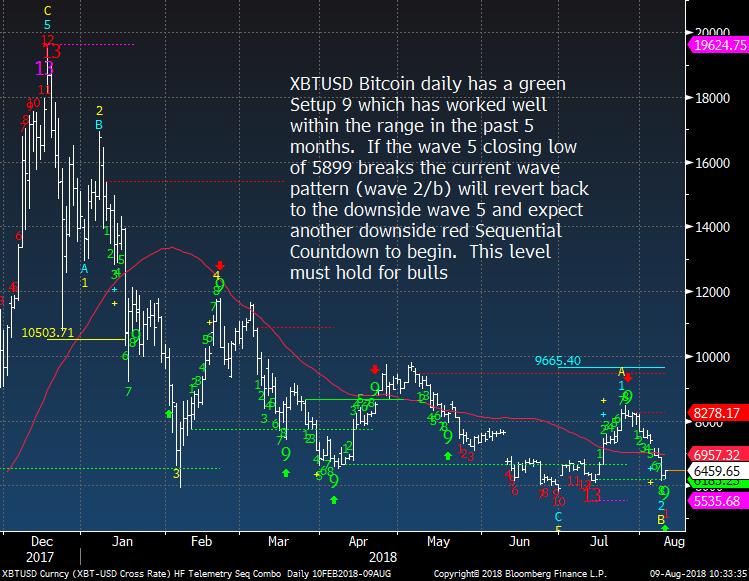
Bitcoin better hold these levels of else CNBC's Fast Money show will go off the air as they talk Bitcoin everyday ad nauseum
|
|
|
|
|
|
|
|
|
Euro Stoxx 50 trying to temp me into buying
|
|
|
|
|
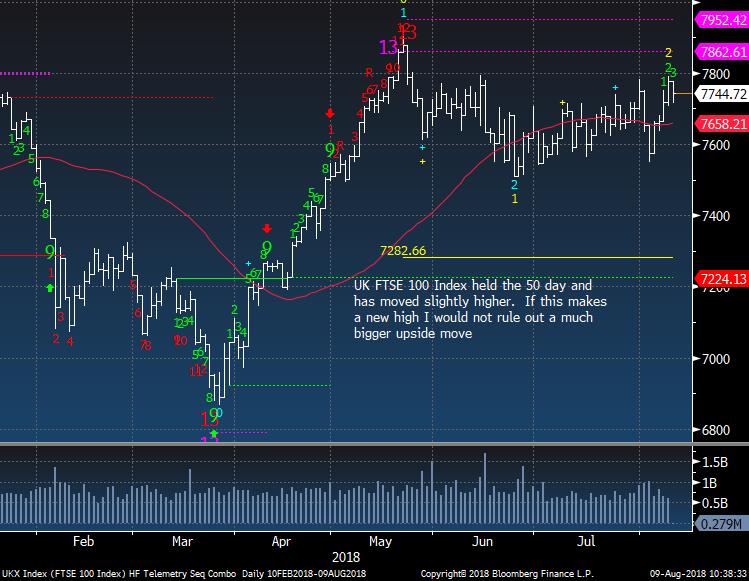
UK FTSE back above the 50 day
|
|
|
|
|
|
|
|
|
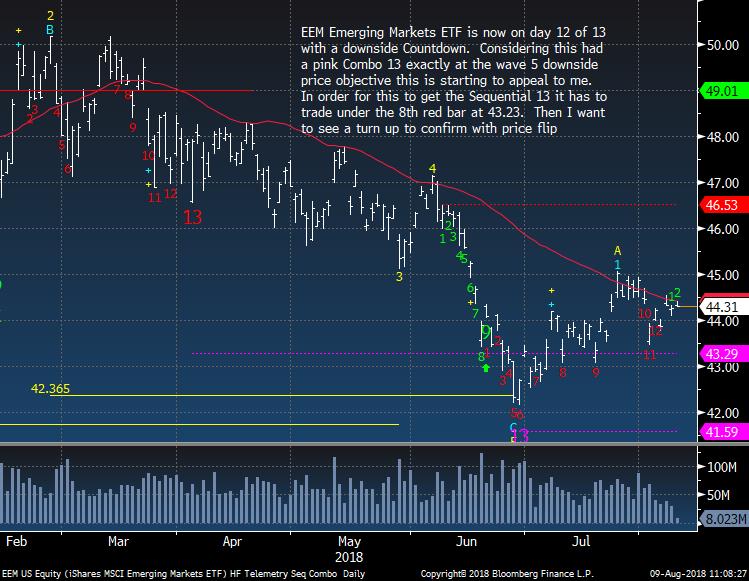
EEM Emerging Markets ETF stuck at the 50 day
|
|
|
|
|
|
|
|
|
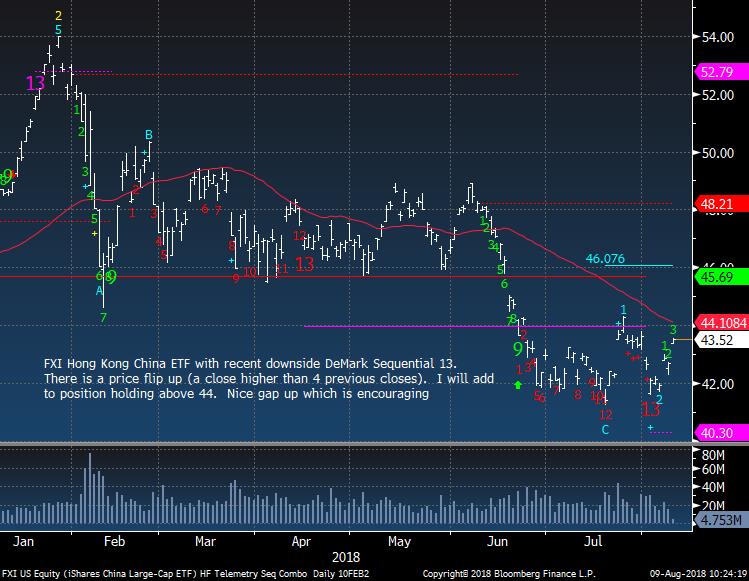
FXI Hong Kong China ETF trades pretty well but needs to keep moving. I'm staying long
|
|
|
|
|
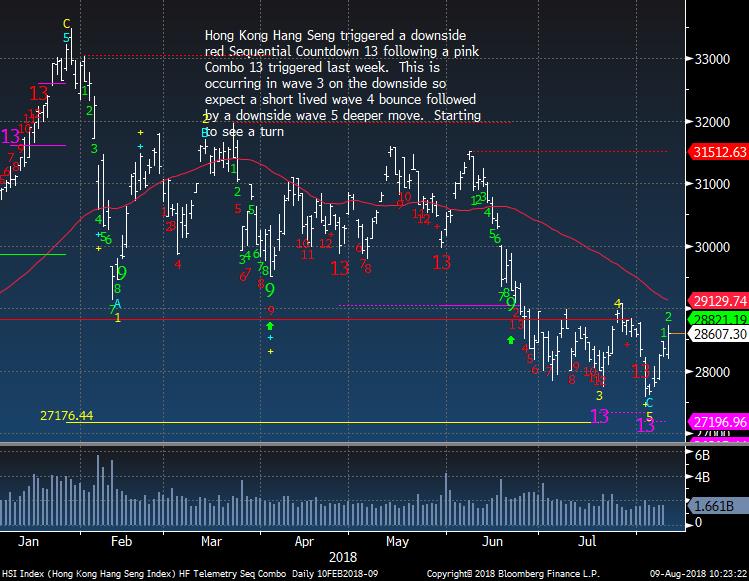
Hong Kong had a good cluster of downside exhaustion signals and traded well yesterday. A move over 29,00 could get people's attention. I like this long
|
|
|
|
|
|
|
|
|
India's Nifty Fifty Index with upside exhaustion with both Sequential and Combo. Good record with the indicators on upside and downside
|
|
|
|
|
|
|
|
|
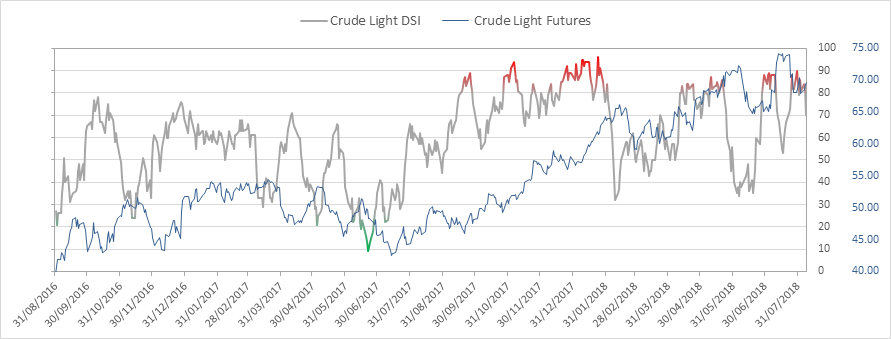
Crude bullish sentiment is at 70% down hard from 81% the previous day
|
|
|
|
|
|
|
|
|
|
|
|
|
Gold bullish sentiment is at 16% and a slight uptick
|
|
|
|
|
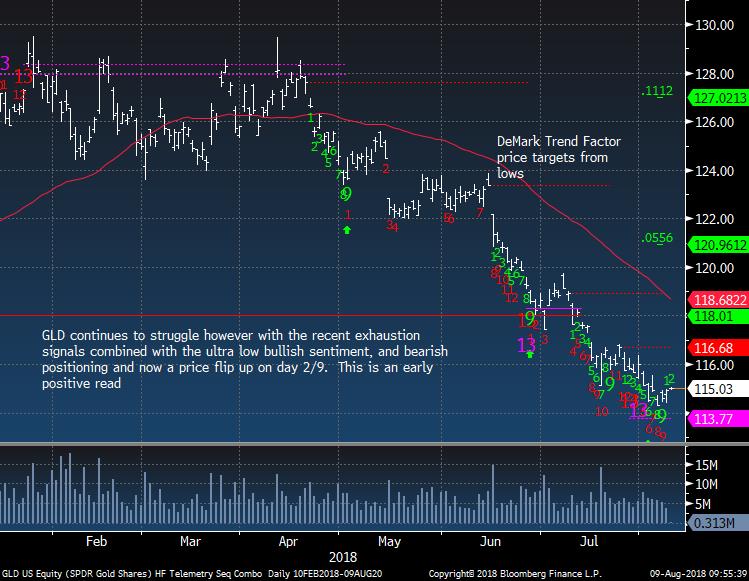
Gold GLD has a price flip up on day 2 of 9 with an upside greet Setup. This is an early positive but not confirmed yet. I ran some Trend Factor targets today too.
|
|
|
|
|
|
|
|
|
Bond bullish sentiment is at 47%
|
|
|
|
|
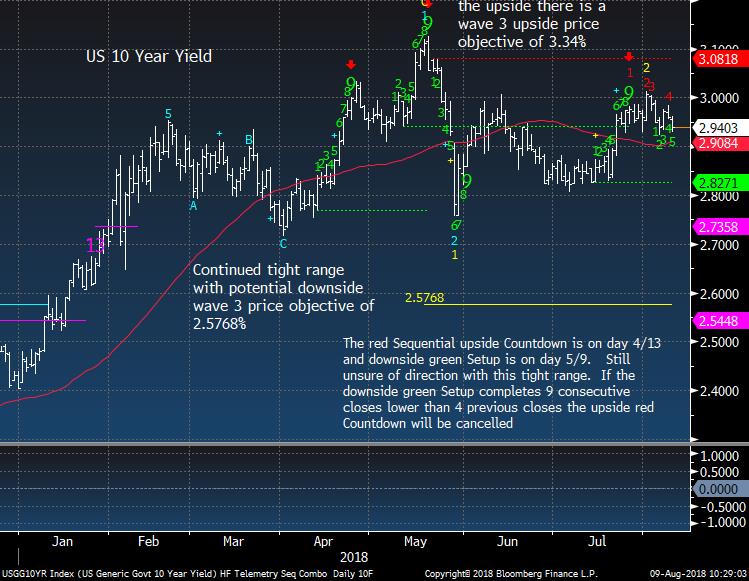
US 10 year yield still in a tight range.
|
|
|
|
|
|
|
DEMARK SCREENS - Daily, Weekly, Monthly Upside/Downside Exhaustion Signals
|
|
|
Daily/Weekly DeMark upside/downside exhaustion signals (Sequential) weekly updated on Monday's and monthly on the first day of the new month. Price flips occur when a stock closes higher/lower than four previous closes and increases conviction of a price turn.
The upside 13's are sell signals and downside 13's are buy signals. Price flip's are confirmation signals that increases potential for a price trend change. For example, if you are long a stock and there is an upside 13, you will want to take cautious action by selling down or out of a position. If initiating a short sale with the upside 13's, we tend to start with a 1/2 size and add with the downside price flip. The opposite is true for when there are downside 13's. Take a 1/2 size position
and add with the upside price flip. The DeMark Indicators are designed to assist the user with buying into weakness and selling into strength to anticipate trend exhaustion. Selling into a rally and buying into a decline often afford the opportunity to exit a trade without too serious a loss if wrong.
S&P 1500 Universe:
DAILY UPSIDE 13: AAN, BDX, CVS, DDD, HPQ, KR, MSFT, OFC, TSCO
DAILY DOWNSIDE 13: DLPH, OXY, TUP
DAILY UPSIDE WITH PRICE FLIP REVERSAL DOWN: AVB, AWR, CL, CXW, EGP, KMB, PEP, PPL, RMD, SO, TTMI
DAILY DOWNSIDE WITH PRICE FLIP REVERSAL UP: KOP, SCHW
Updated: 8/06/18
WEEKLY UPSIDE 13: AEO, CLH, ETN, GOOG, KLAC, NOG, PKI, PSX, ROK, SCI, SIGI, THC, UNP, XLNX
WEEKLY DOWNSIDE 13: HHS, TSN
Updated: 8/1/18
MONTHLY UPSIDE 13: AIZ, ATR, BIO, CBU, CDNS, CMS, CSX, DGX, EE, FCN, FIX, GTY, HAE, HAS, IDXX, IEX, KSU, MA, NI, NPK, PTC, RLI, ROL, WEC
MONTHLY DOWNSIDE 13: CIR, HIBB
Euro Stoxx 600 Universe:
DAILY UPSIDE 13: CAST SS, SHP LN
DAILY DOWNSIDE 13: MAN GR
DAILY UPSIDE WITH PRICE FLIP REVERSAL DOWN: STMN SW
DAILY DOWNSIDE WITH PRICE FLIP REVERSAL UP: BOL SS, DEC FP, EO FP, GAM SW, HMB SS, NOKIA FH, SGO FP
Updated: 8/6/18
WEEKLY UPSIDE 13: DG FP, EDEN FP, HEXAB SS, ZAL, GR
WEEKLY DOWNSIDE 13: RYA ID
Updated: 8/1/18
MONTHLY UPSIDE 13: TEMN SW
MONTHLY DOWNSIDE 13: CO FP, GETIB SS, RXL FP, TALK LN
|
|
|
Unsubscribe me from Hedge Fund Telemetry
Hedge Fund Telemetry LLC, P.O. Box 4675, Greenwich, CT 06861, United States
CONFIDENTIALITY NOTE and DISCLAIMER: This message is for the named person's use only. It may contain confidential, proprietary or legally privileged material. No confidentiality or privilege is waived by any accidental or unintentional transmission. If you receive this message in error, please immediately delete it and all copies of it from your system, destroy any hard copies and notify the sender. You must not, directly or indirectly, use, disclose,
distribute, print or copy any part of this message if you are not the intended recipient. Hedge Fund Telemetry LLC. cannot guarantee the confidentiality of the material transmitted; therefore, information of a sensitive or confidential nature should not be transmitted. There is risk in trading markets. Hedge Fund Telemetry LLC reports are based on information gathered from various sources and believed to be reliable, but are not guaranteed as to accuracy and completeness. The information is subject to change without notice and Hedge Fund Telemetry LLC has no obligation to provide any updates or changes. Hedge Fund Telemetry LLC is providing this data for informational and educational purposes and does not believe that it is sufficient to base an investment decision on. This information should not be regarded as a solicitation or recommendation of any particular security or to engage in any trading strategy. One should always check with your licensed financial
advisor to determine suitability of any investments.
|
|
|
|
|