|
|
|
|
|
|
|
|
I'm starting to question what is normal in this market. It wasn't normal that the CEO of a $65 billion market cap public company tweets out he's considering going private and that funding was secured. These are strong statements that should have had an 8k (SEC filing) following the tweets. That would be normal. No 8k yet and this tweet came within 24 hours of when they filed their 10k (filing following earnings with ALL the financial details) and there was no mention from the
board that this was even considered. Elon Musk is not normal. He's either the greatest visionary or a fraudster running a ponzi scheme. I believe he is a visionary and he does get credit for developing the EV market forcing other auto manufacturers to follow and that's not normal in a good way. If you look at the financials of the business combined with the manufacturing problems and then the wave of new EV's coming from every manufacturer you know this $65 billion market cap company should not be at this level because this is not normal. I do believe this will be continue to the biggest stock story in 2018 with now the best risk reward for short sellers. If this private deal happens it will go up ~10% to $420, but if this does not happen the stock will fall a lot more as Elon's credibility will long holders will be damaged.
The important market news is that the US equity markets are getting closer to new daily upside DeMark exhaustion
signals. I have a bunch of charts below to go over including US indexes, VIX Index, US long bond vs SPX. Add S&P bullish sentiment is at 85% and that's extreme. Weaker seasonality is another concern as August and September typically are the toughest months.
- US Markets - Sentiment is extreme, Upside exhaustion signals on a lot of things at or near, Nasdaq Summation still going lower, Cumulative breadth upside exhaustion
- Hedge Fund Telemetry Trade Ideas - Added back TSLA which was stopped automatically
- Things that make me go hmmmm (thanks Grant Williams)
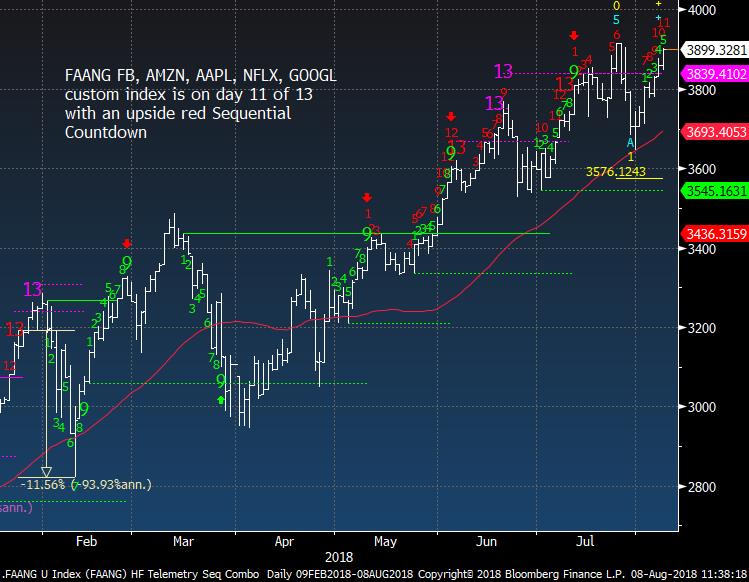
- FAANG - Custom Index also near upside exhaustion
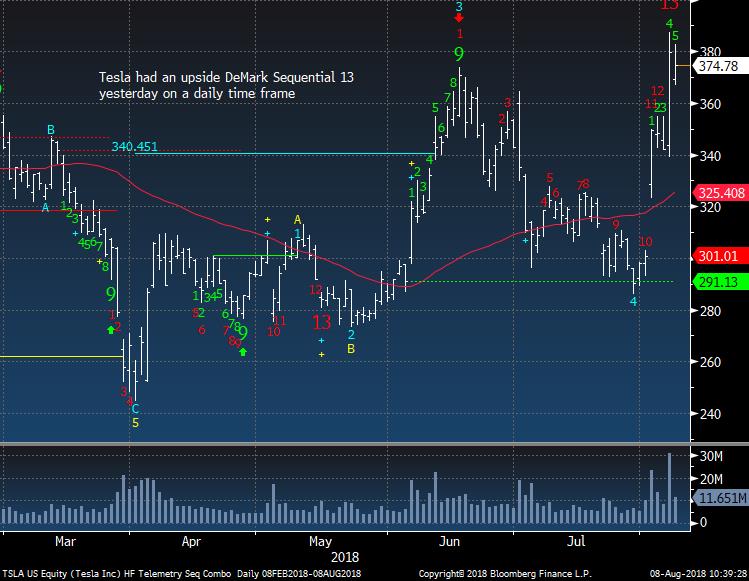
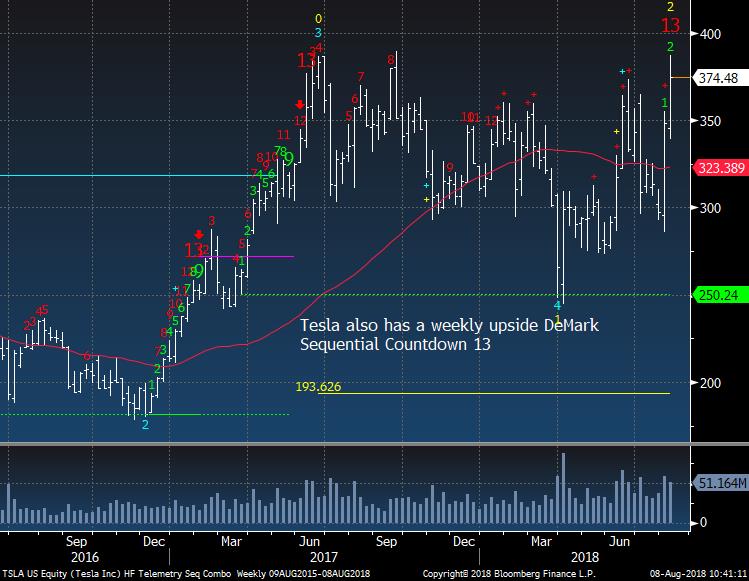
- Tesla - Daily and Weekly upside exhaustion signals
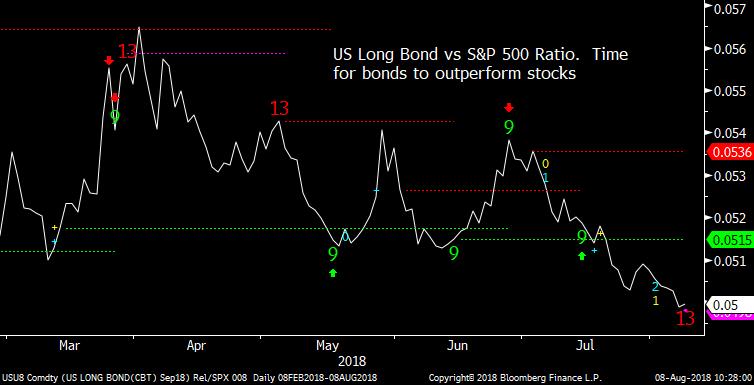
- US Long Bond vs SPX Ratio - Suggest bonds might start to outperform stocks soon
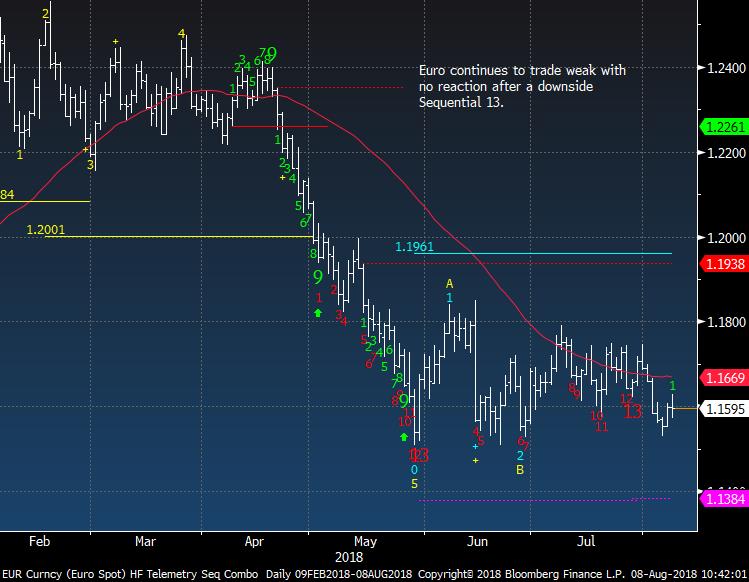
- Currency Update - Quiet night with everything still in a range
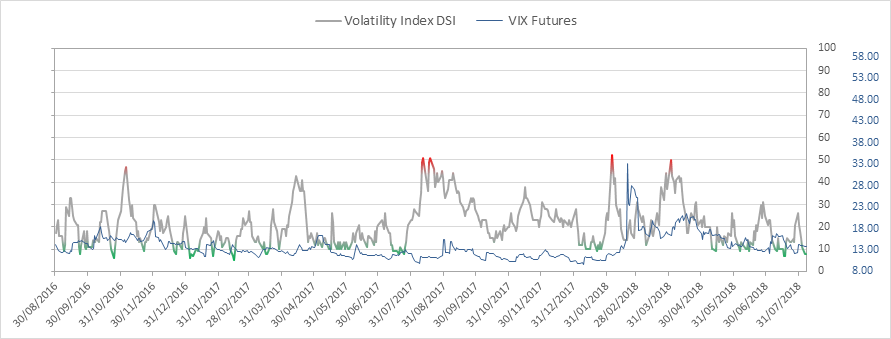
- Volatility Update - Could see the VIX start to rise soon
- Global Market Update - EEM stuck at 50 day
- Asian Market Update - Sloppy night in Asia after a good gain the previous day
- Crude Update - My concerns of the wave pattern came true
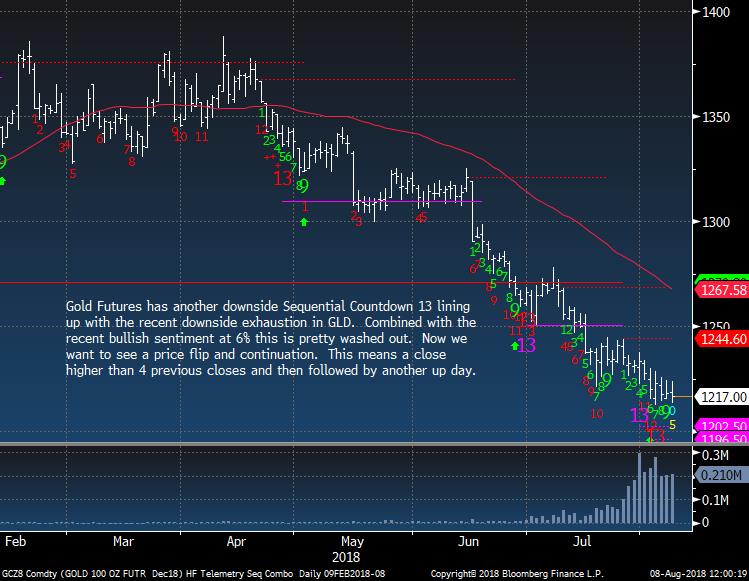
- Gold Update - No changes
- Bond Update - Very tight range still
- DeMark Screens - Daily, Weekly, Monthly upside/downside exhaustion signals within the S&P 1500 and Euro Stoxx 600
|
|
|
|
|
Here's a link to the Hedge Fund Telemetry market sentiment page with 40 charts of sentiment including equities, bonds, currencies, and commodities updated each day.
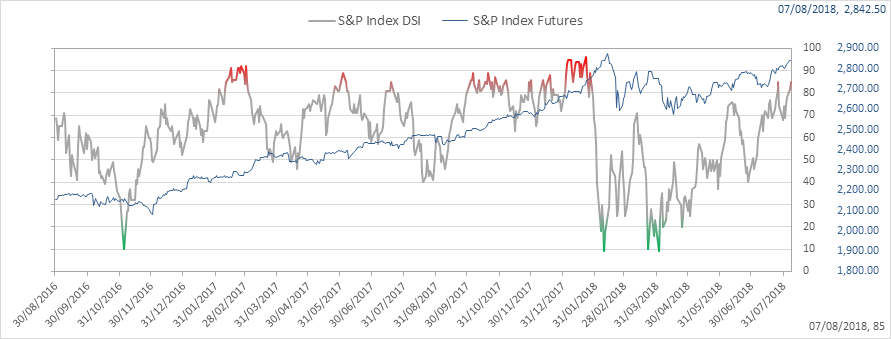
SPX bullish sentiment is at 85%
|
|
|
|
|
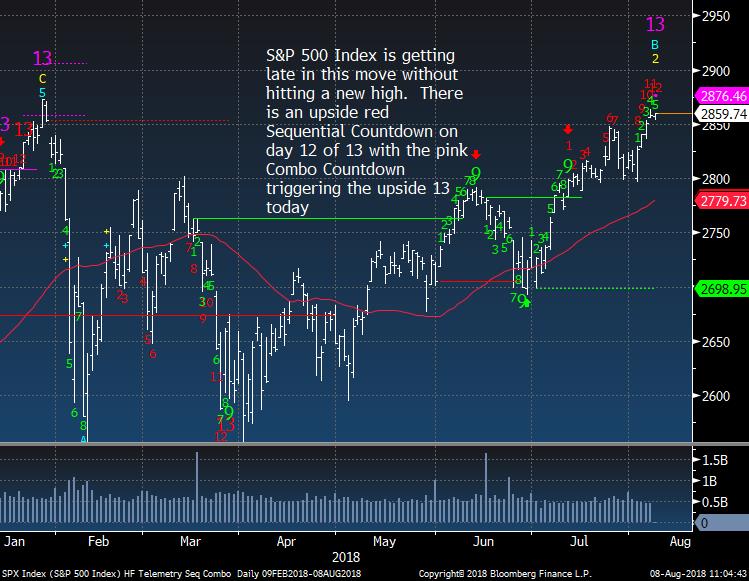
SPX daily has the Combo 13 today and the last one happened on the day of the all time high
|
|
|
|
|
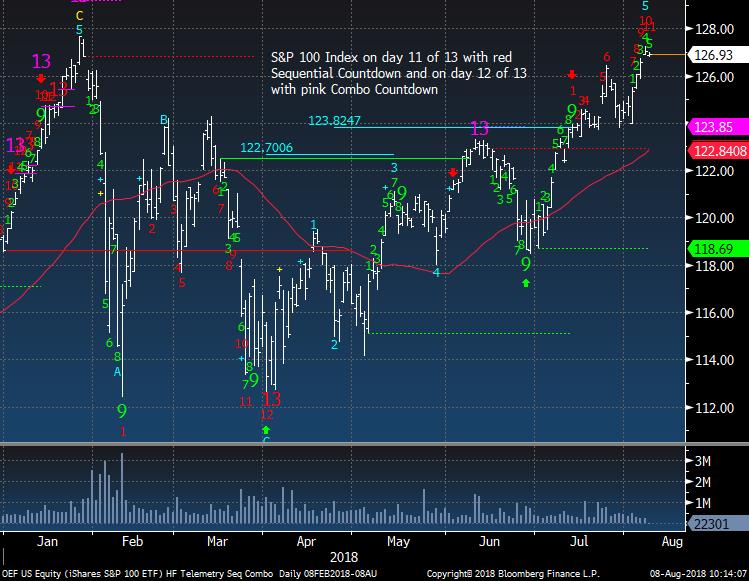
SPX 100 on day 11 of 13 with upside Countdown
|
|
|
|
|
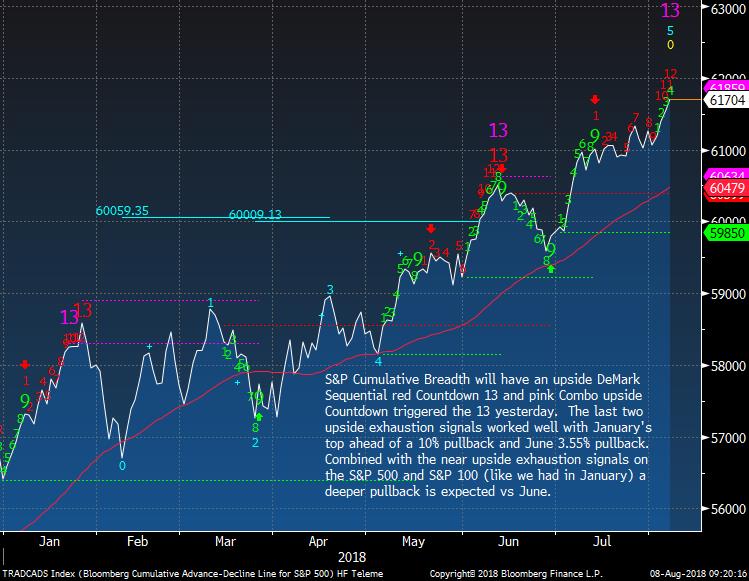
S&P Cumulative breadth with new upside exhaustion today
|
|
|
|
|
Nasdaq bullish sentiment is at 83%
|
|
|
|
|
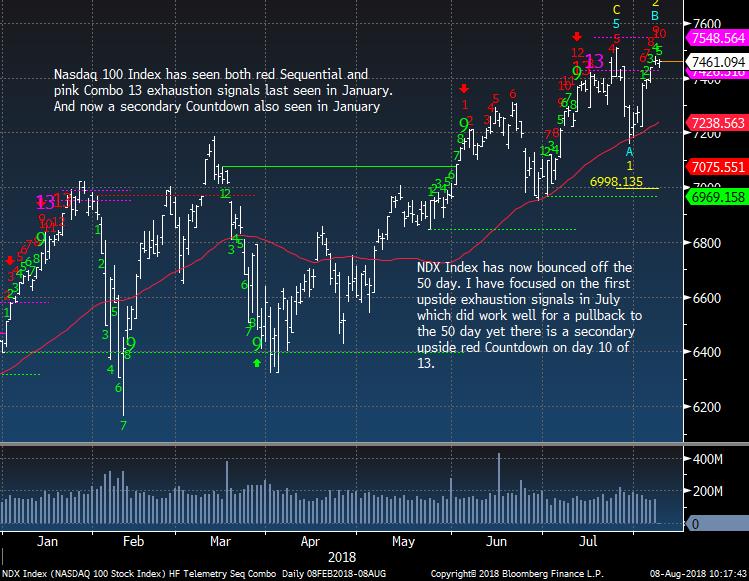
NDX Index on day 10 of 13 with the Sequential Countdown
|
|
|
|
|
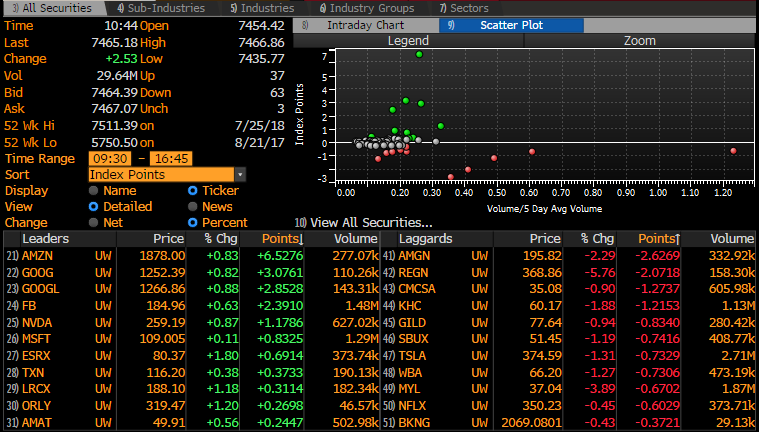
The NDX has negative breadth today yet is up today with the help of the mega cap stocks. This is the new normal
|
|
|
|
|
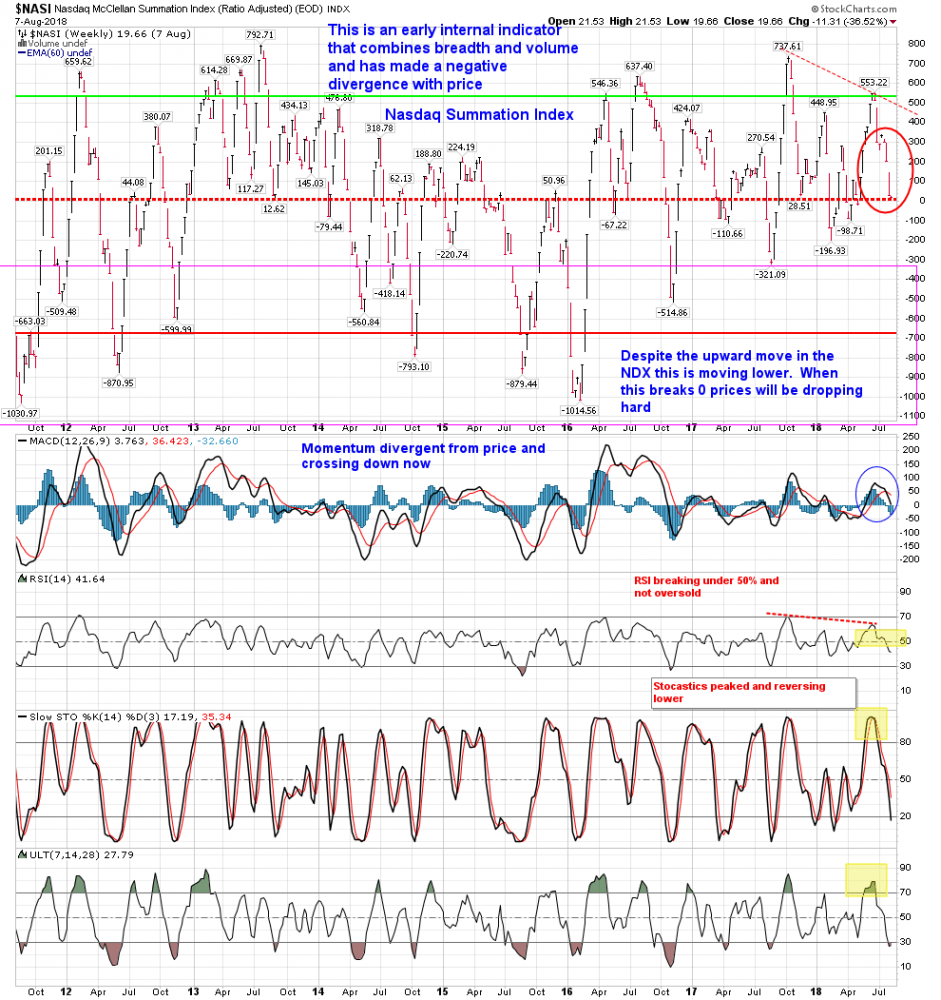
Nasdaq Summation Index is barely above zero despite the market at near highs. This is an early warning indicator
|
|
|
|
|
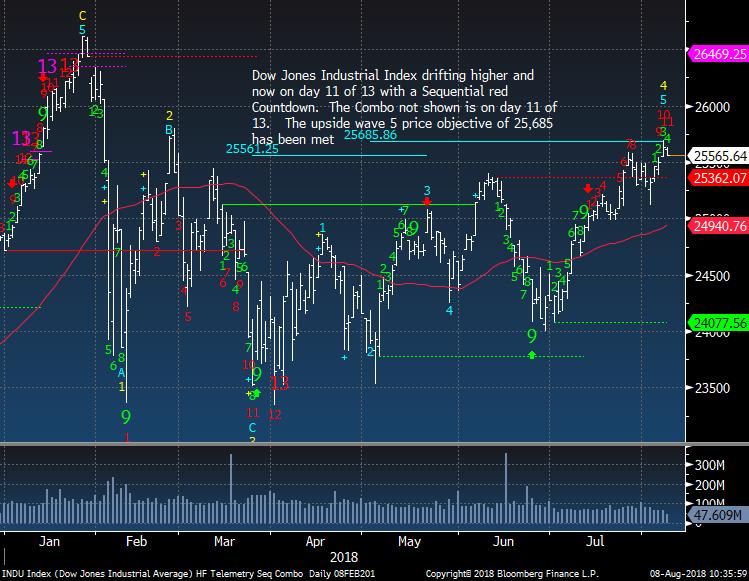
Dow Jones Industrial Average is on day 11 of 13 too
|
|
|
|
|
|
|
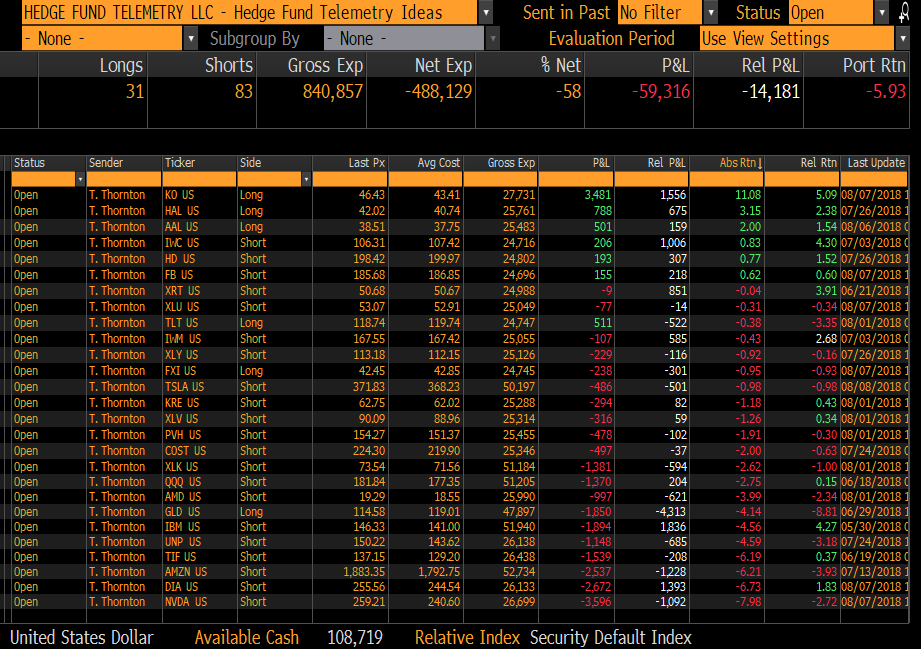
Hedge Fund Telemetry Trade Ideas
|
|
|
Trade Ideas - Considering I started the TMSG page at the start of Q2 in April after Q1 was huge is just frustrating. Short, cover, rinse repeat. I'm working on a long only and short only separate trade ideas pages. Added back TSLA short with 5% today. I tried to lift my stop but this software didn't make the change in time. With a buyout price at 420 I now have a ceiling on this short.
|
|
|
|
|
|
|
Things that make me go hmmmm
|
|
|
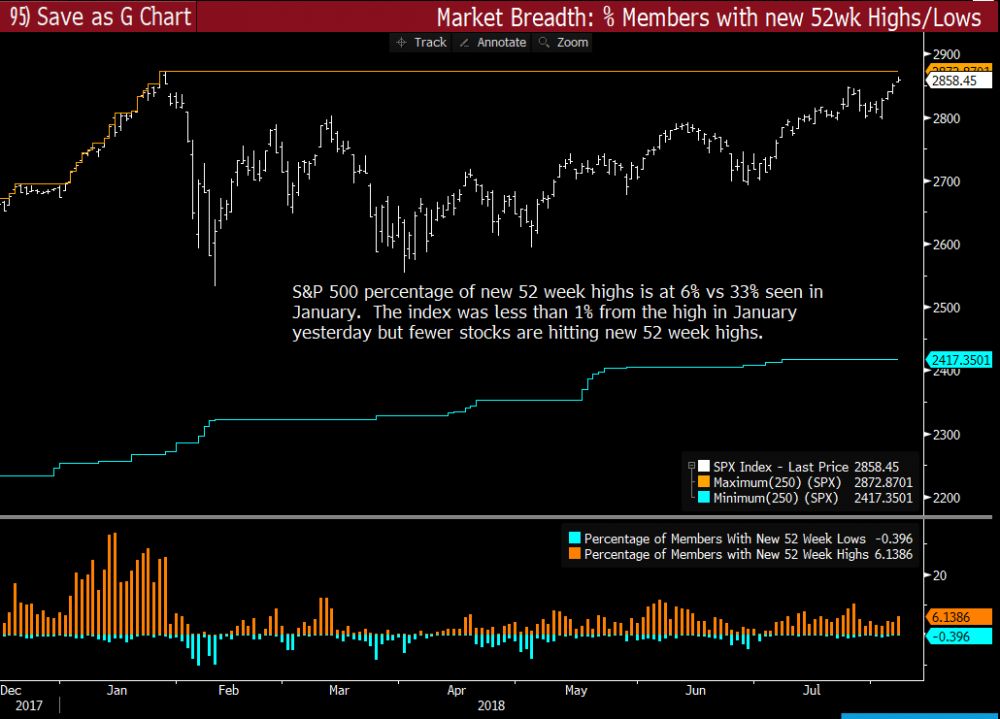
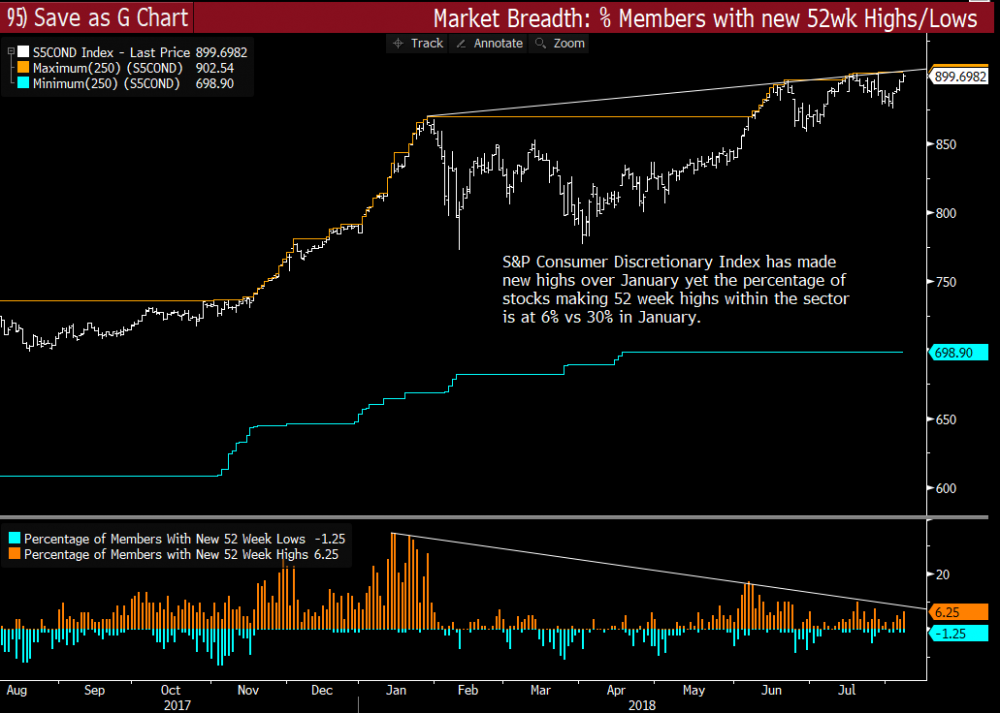
The S&P is within 1% of a new all time high but the percentage of new 52 week highs is way off the January levels
|
|
|
|
|
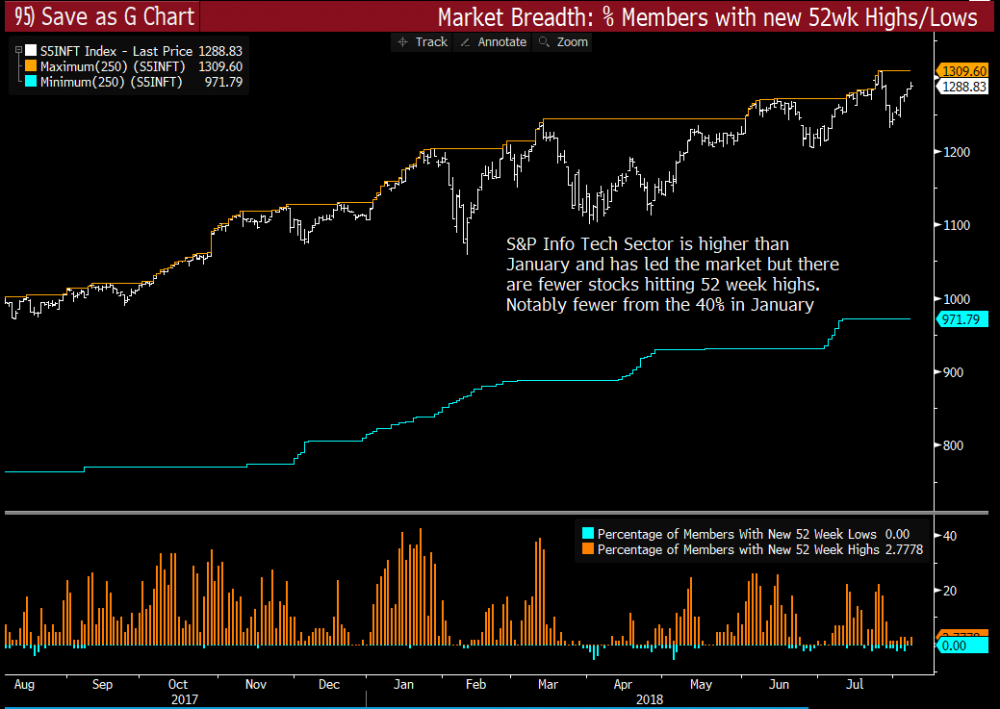
Tech sector is a lot higher than January but fewer stocks within the index are hitting new 52 week highs. Hmmmm
|
|
|
|
|
Consumer Discretionary much higher than January but very few stocks making new highs
|
|
|
|
|
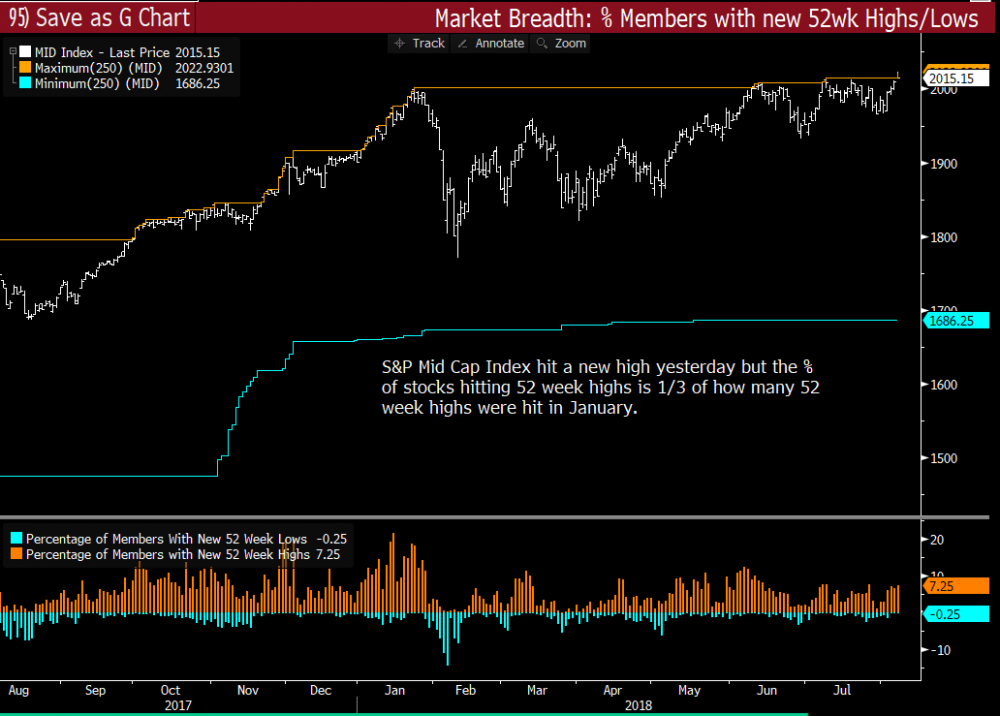
Even Mid Cap hits a new high but fewer stocks making new highs. This makes me go hmmmm since this is almost an equal weighted index
|
|
|
|
|
|
|
|
|
FAANG Index is on day 11 of 13
|
|
|
|
|
|
|
Tesla - Daily and Weekly Upside Exhaustion
|
|
|
|
|
|
|
|
|
|
|
|
|
US Long Bond vs S&P 500 Ratio
|
|
|
Downside exhaustion suggests bonds could start to outperform stocks
|
|
|
|
|
|
|
|
|
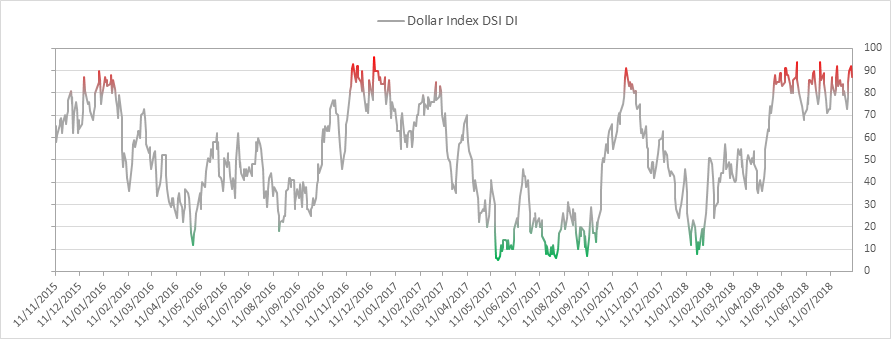
US Dollar bullish sentiment is at 87% and down from the previous day of 92%. Very extreme
|
|
|
|
|
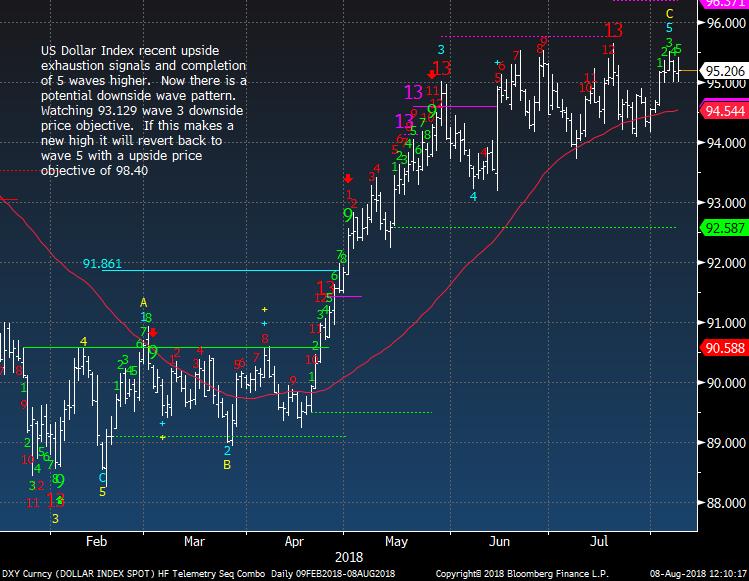
US Dollar Index still is in the range
|
|
|
|
|
|
|
|
|
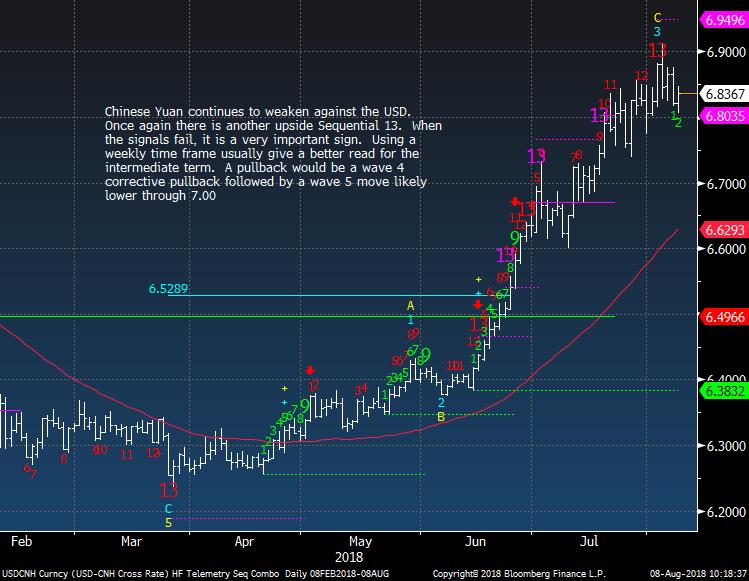
Calmer night with the Yuan
|
|
|
|
|
|
|
|
|
VIX Futures bullish sentiment is at 8% bulls
|
|
|
|
|
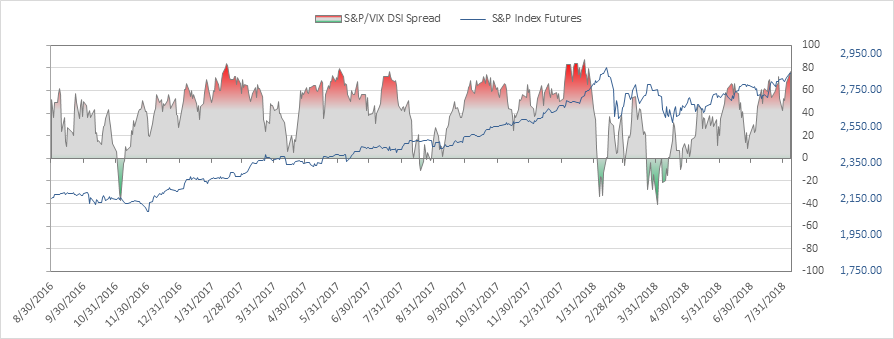
Ratio of SPX bullish sentiment vs VIX bullish sentiment is at 77% and a new recent high. It reached 84% in January. Keep in mind previous to 2016 this ratio did move lower into the green zone.
|
|
|
|
|
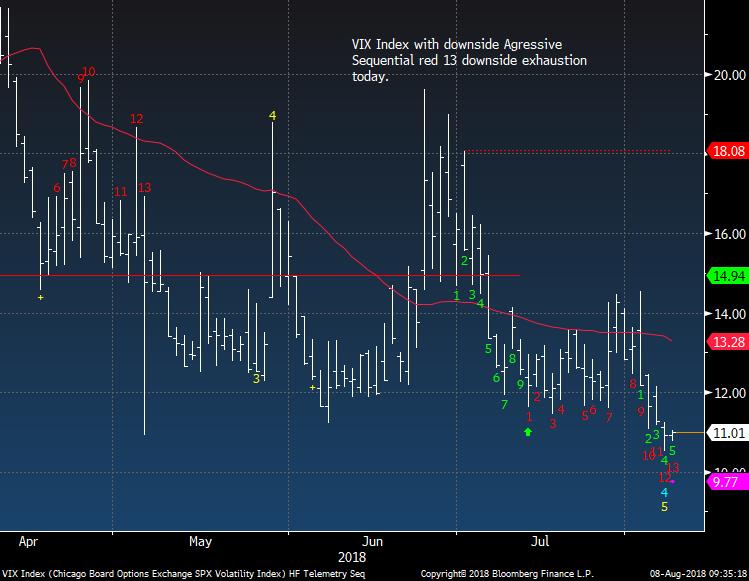
VIX Index has a downside Aggressive Sequential red 13 Countdown. This is another DeMark Indicator that is designed to trigger a little faster
|
|
|
|
|
|
|
|
|
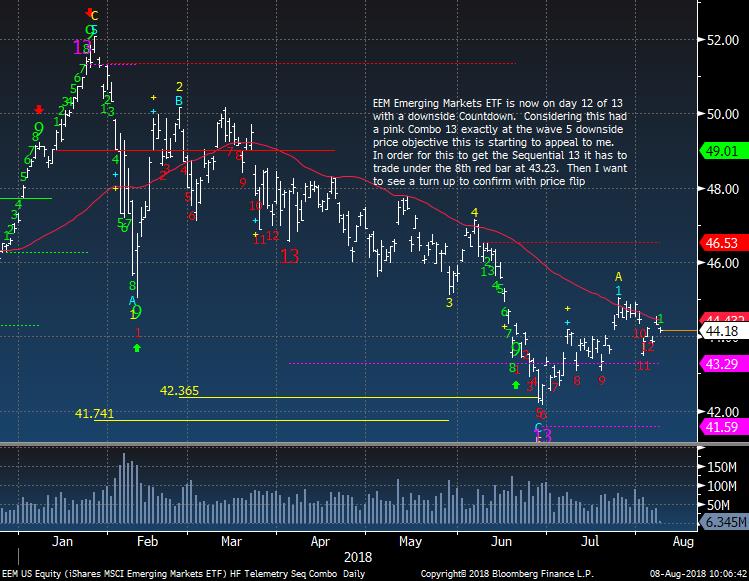
EEM Emerging Markets ETF stuck right at the 50 day
|
|
|
|
|
|
|
|
|
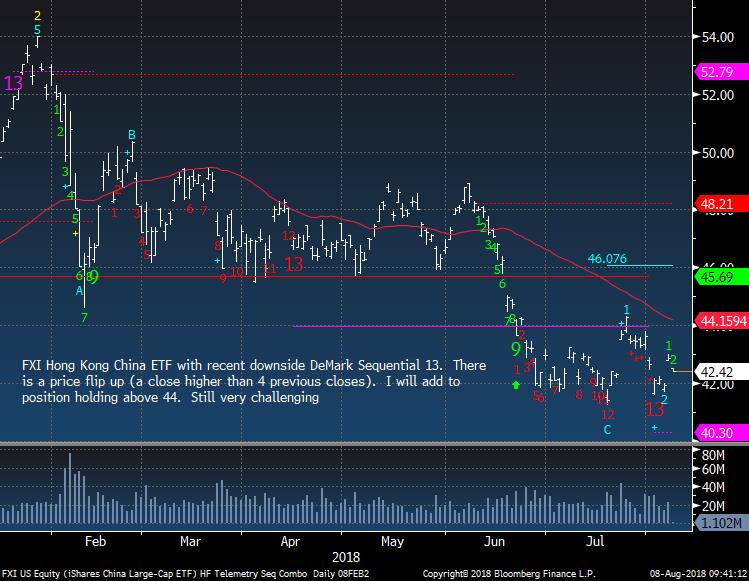
FXI Hong Kong China ETF down today after China pullback yet Hang Seng was up small.
|
|
|
|
|
|
|
|
|
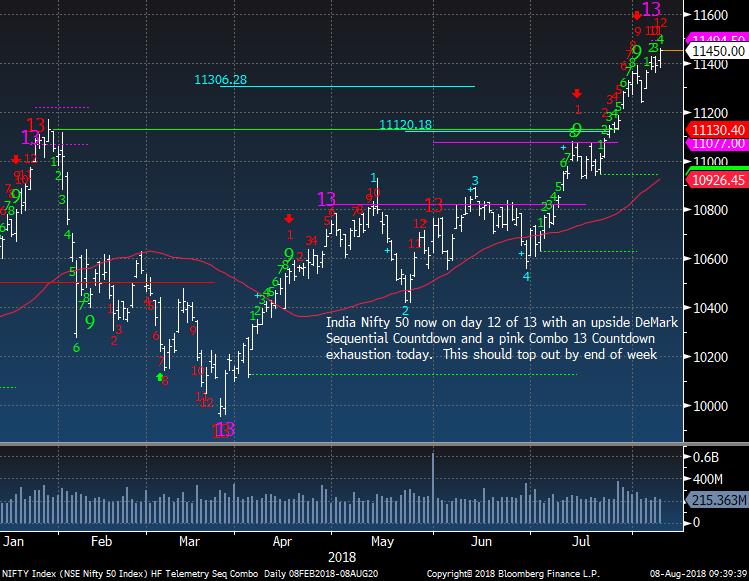
India's Nifty Fifty is now on day 12 of 13.
|
|
|
|
|
|
|
|
|
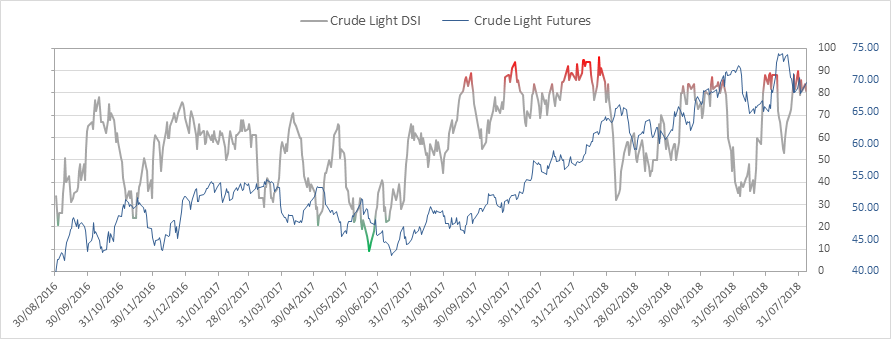
Crude bullish sentiment is at 81% and has been extreme
|
|
|
|
|
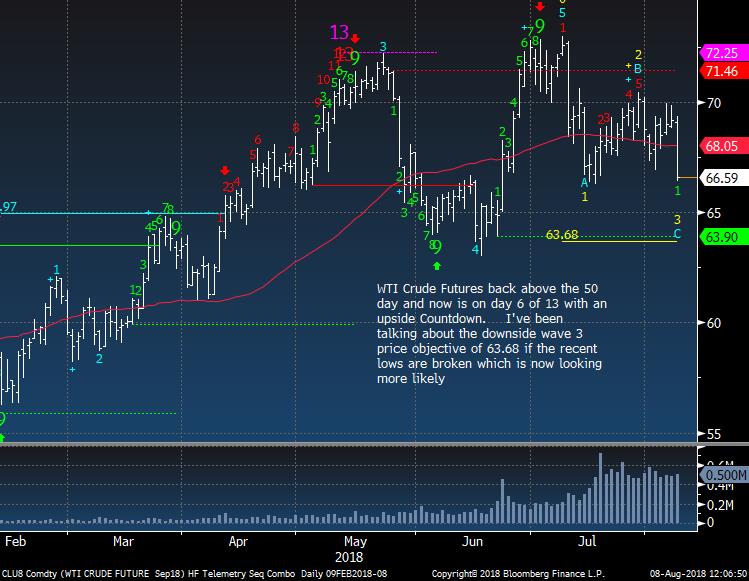
Crude getting hit today and my concerns over the high sentiment and wave pattern were warranted even with the upside red Countdown
|
|
|
|
|
|
|
|
|
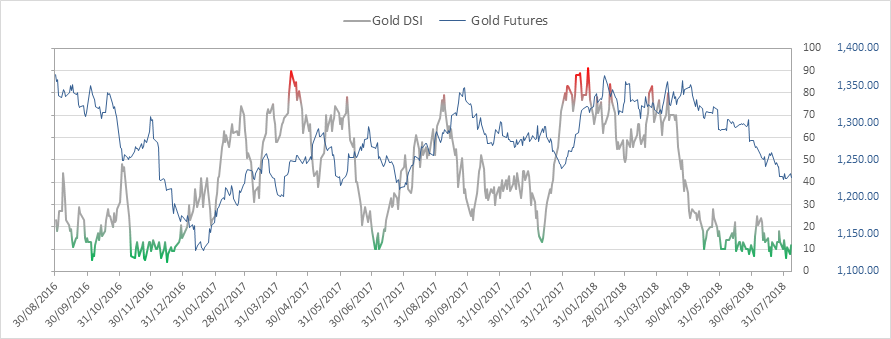
Gold bullish sentiment is at 12%
|
|
|
|
|
Gold no turn yet despite the exhaustions this week.
|
|
|
|
|
|
|
|
|
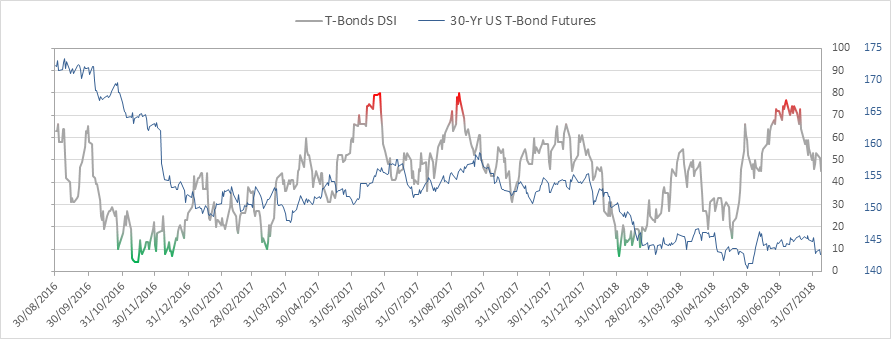
Bond bullish sentiment is at 45%
|
|
|
|
|
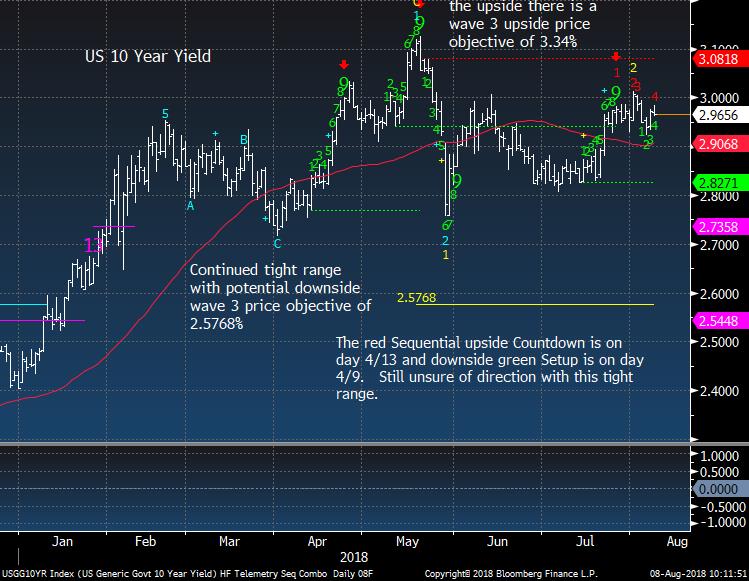
US 10 year yield still very tight
|
|
|
|
|
|
|
DEMARK SCREENS - Daily, Weekly, Monthly Upside/Downside Exhaustion Signals
|
|
|
Daily/Weekly DeMark upside/downside exhaustion signals (Sequential) weekly updated on Monday's and monthly on the first day of the new month. Price flips occur when a stock closes higher/lower than four previous closes and increases conviction of a price turn.
The upside 13's are sell signals and downside 13's are buy signals. Price flip's are confirmation signals that increases potential for a price trend change. For example, if you are long a stock and there is an upside 13, you will want to take cautious action by selling down or out of a position. If initiating a short sale with the upside 13's, we tend to start with a 1/2 size and add with the downside price flip. The opposite is true for when there are downside 13's. Take a 1/2 size position
and add with the upside price flip. The DeMark Indicators are designed to assist the user with buying into weakness and selling into strength to anticipate trend exhaustion. Selling into a rally and buying into a decline often afford the opportunity to exit a trade without too serious a loss if wrong.
S&P 1500 Universe:
DAILY UPSIDE 13: ENDP, IRBT, LLY, LSTR, LXP, MRK, PPL, RHI, SMTC, UGI, UBRN
DAILY DOWNSIDE 13: CPWR, PCTI, SNV
DAILY UPSIDE WITH PRICE FLIP REVERSAL DOWN: BDC, BMY, CBT, DRE, FMBI MAA, MAC, NUVA, RAX, VSI
DAILY DOWNSIDE WITH PRICE FLIP REVERSAL UP: DLX, EZPW, FII, NX, SNX, SPN, SWC
Updated: 8/06/18
WEEKLY UPSIDE 13: AEO, CLH, ETN, GOOG, KLAC, NOG, PKI, PSX, ROK, SCI, SIGI, THC, UNP, XLNX
WEEKLY DOWNSIDE 13: HHS, TSN
Updated: 8/1/18
MONTHLY UPSIDE 13: AIZ, ATR, BIO, CBU, CDNS, CMS, CSX, DGX, EE, FCN, FIX, GTY, HAE, HAS, IDXX, IEX, KSU, MA, NI, NPK, PTC, RLI, ROL, WEC
MONTHLY DOWNSIDE 13: CIR, HIBB
Euro Stoxx 600 Universe:
DAILY UPSIDE 13: REE SM
DAILY DOWNSIDE 13: DEC FP, EO FP
DAILY UPSIDE WITH PRICE FLIP REVERSAL DOWN: CRDA LN
DAILY DOWNSIDE WITH PRICE FLIP REVERSAL UP: FR FP, HEI GR, WEIR LN
Updated: 8/6/18
WEEKLY UPSIDE 13: DG FP, EDEN FP, HEXAB SS, ZAL, GR
WEEKLY DOWNSIDE 13: RYA ID
Updated: 8/1/18
MONTHLY UPSIDE 13: TEMN SW
MONTHLY DOWNSIDE 13: CO FP, GETIB SS, RXL FP, TALK LN
|
|
|
Unsubscribe me from Hedge Fund Telemetry
Hedge Fund Telemetry LLC, P.O. Box 4675, Greenwich, CT 06861, United States
CONFIDENTIALITY NOTE and DISCLAIMER: This message is for the named person's use only. It may contain confidential, proprietary or legally privileged material. No confidentiality or privilege is waived by any accidental or unintentional transmission. If you receive this message in error, please immediately delete it and all copies of it from your system, destroy any hard copies and notify the sender. You must not, directly or indirectly, use, disclose,
distribute, print or copy any part of this message if you are not the intended recipient. Hedge Fund Telemetry LLC. cannot guarantee the confidentiality of the material transmitted; therefore, information of a sensitive or confidential nature should not be transmitted. There is risk in trading markets. Hedge Fund Telemetry LLC reports are based on information gathered from various sources and believed to be reliable, but are not guaranteed as to accuracy and completeness. The information is subject to change without notice and Hedge Fund Telemetry LLC has no obligation to provide any updates or changes. Hedge Fund Telemetry LLC is providing this data for informational and educational purposes and does not believe that it is sufficient to base an investment decision on. This information should not be regarded as a solicitation or recommendation of any particular security or to engage in any trading strategy. One should always check with your licensed financial
advisor to determine suitability of any investments.
|
|
|
|
|