|
|
|
|
|
|
|
|
Been working on the new website (launching later this month) all day with developers and watching the latest tweets from good old Elon Musk. Never seen anything more bizarre in the markets in my entire career.
Below I take a look at the recent debate on "Growth vs Value" with several ratio
charts. And of course I have some of the usual stuff too. Let's get to it...
- US Markets - Sentiment, Daily and 60 minute tactical views. Sentiment in the extreme zone and upside daily exhaustion signals are within a few days on many indexes.
- Hedge Fund Telemetry Trade Ideas - Sent an earlier email
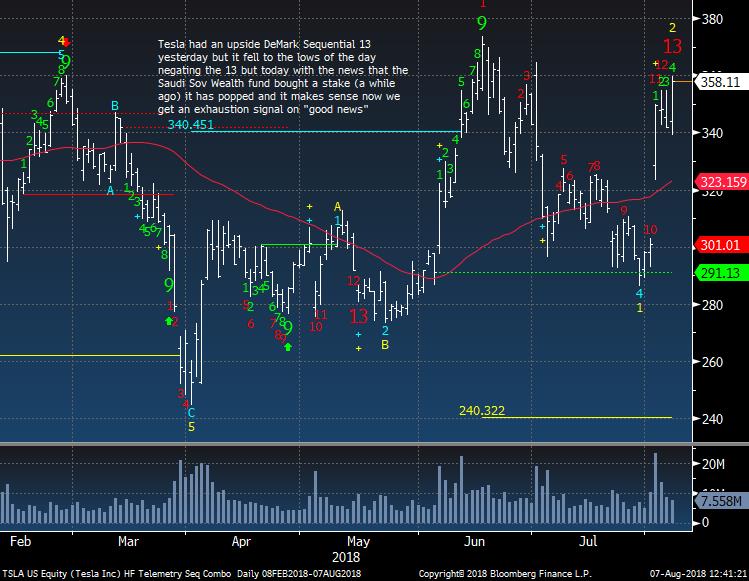
- Tesla - Crazy Town
- Growth vs Value - A few ratio charts
- European Market Update - Longer term Euro Stoxx vs SPX looks like it can turn soon
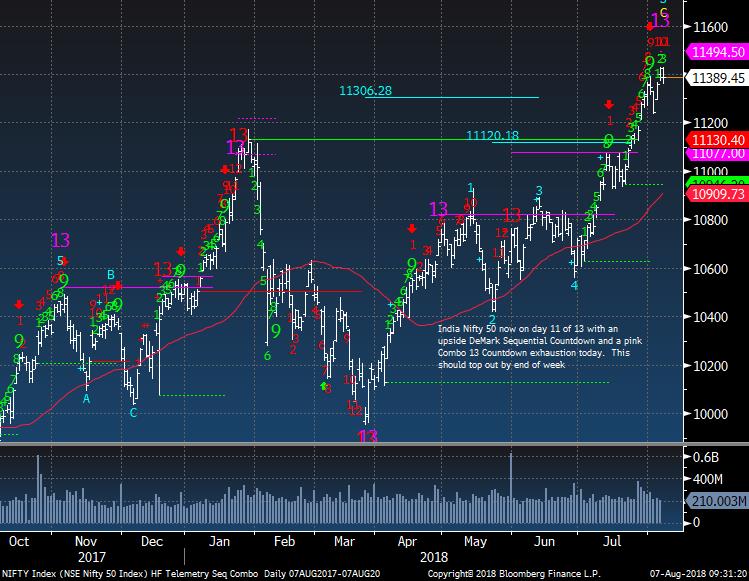
- Asian Markets - China finally bounced. India getting closer to a top
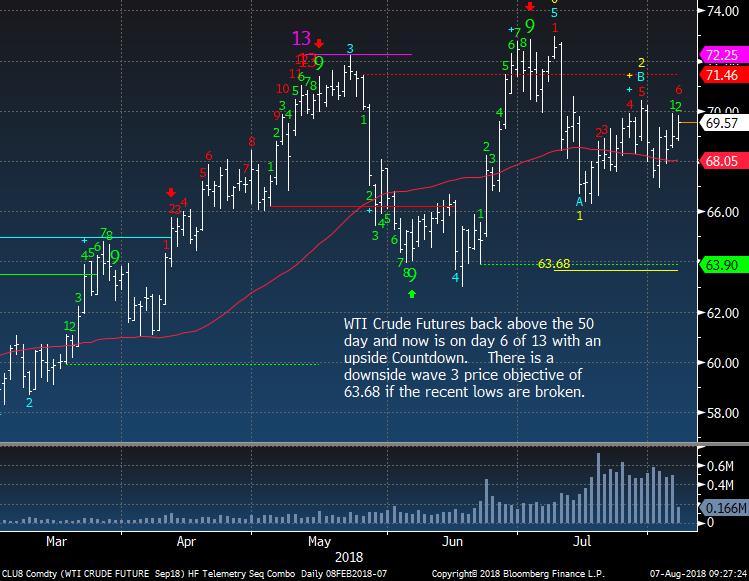
- Crude Update - Still moving up
- Gold Update - Good look at COT data
- Bond Update
- DeMark Screens - Daily, Weekly, Monthly upside/downside exhaustion signals within the S&P 1500 and Euro Stoxx 600
|
|
|
|
|
Here's a link to the Hedge Fund Telemetry market sentiment page with 40 charts of sentiment including equities, bonds, currencies, and commodities updated each day.
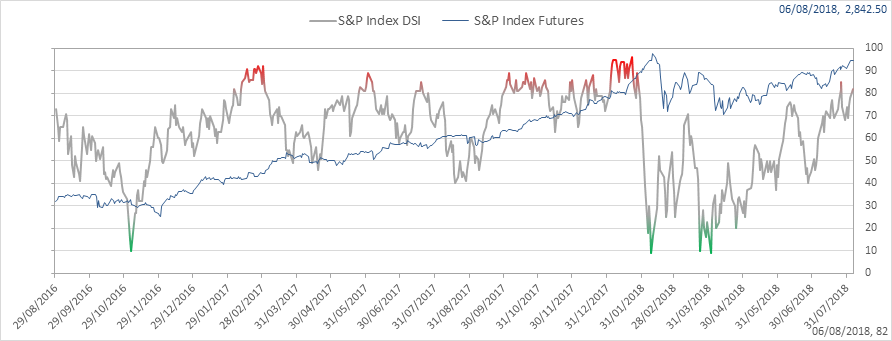
SPX bullish sentiment is at 82% and is back in the extreme zone over 80%
|
|
|
|
|
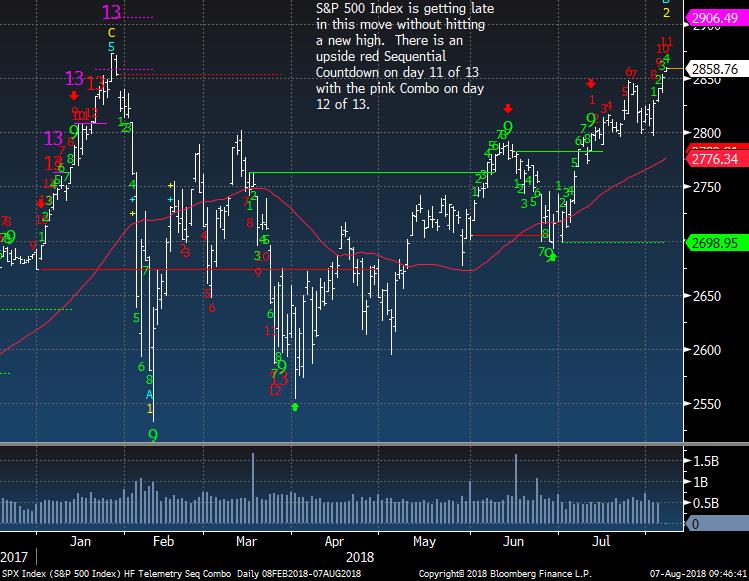
SPX daily on day 11 of 13 with recent upside Countdown
|
|
|
|
|
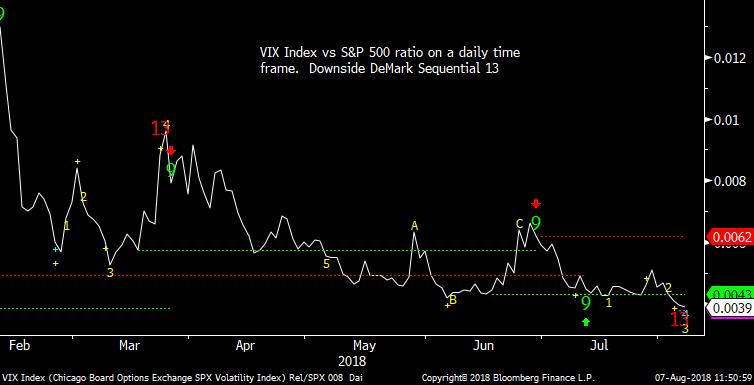
VIX Index vs SPX ratio did get a downside exhaustion signal today. This hasn't been the best with timing but adds up on the technical liability side of the ledger with the other upside exhaustion signals
|
|
|
|
|
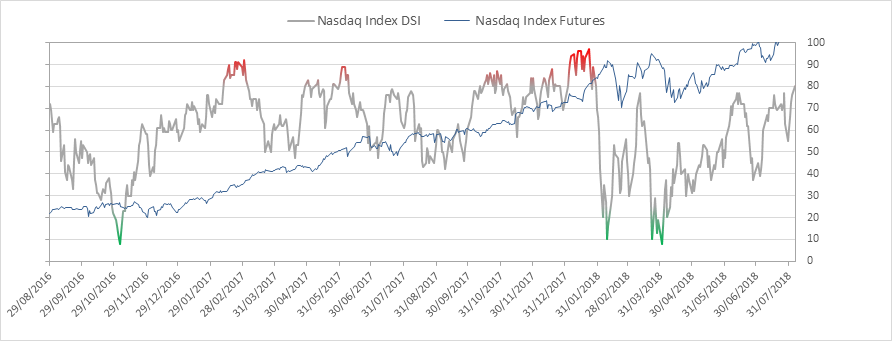
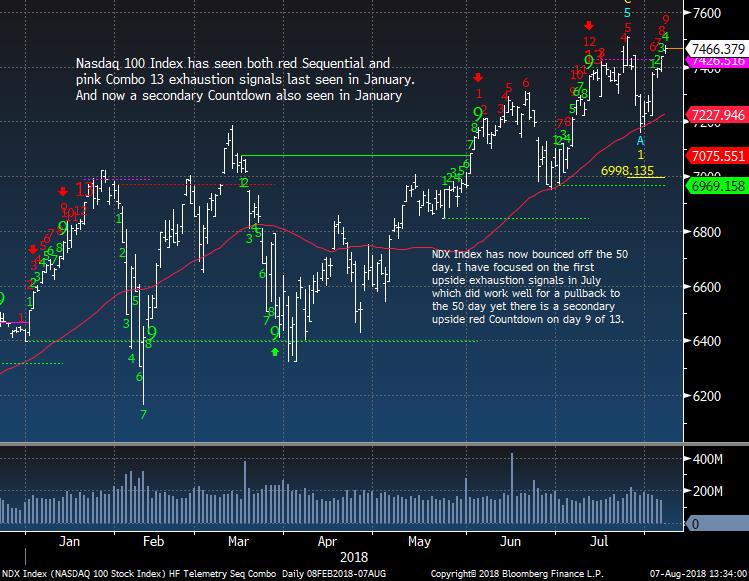
Nasdaq bullish sentiment is at 80%
|
|
|
|
|
NDX Index on day 9 of 13 with its upside Countdown
|
|
|
|
|
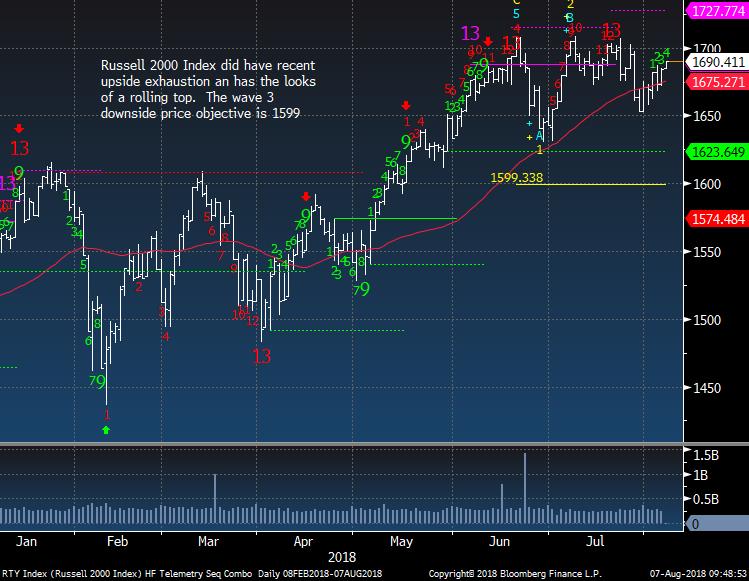
Russell 2000 hanging in there for now
|
|
|
|
|
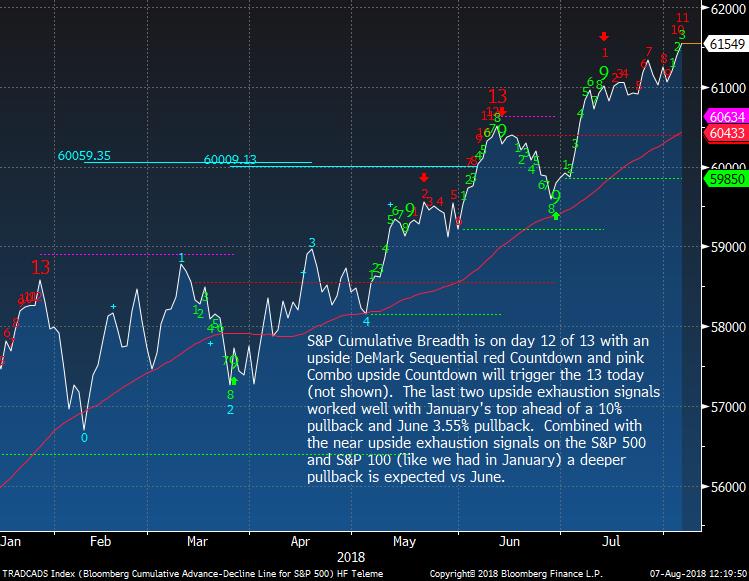
S&P 500 Cumulative Breadth is on day 12 of 13 (today gets updated but I am assuming it's up today)
|
|
|
|
|
|
|
Hedge Fund Telemetry Trade Ideas
|
|
|
Trade Ideas - See earlier email
|
|
|
|
|
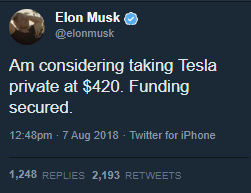
Elon Musk tweeted this out today. Either this is true and it happens or the SEC will put him in jail. For a CEO to manipulate this stock like this is just crazy on Twitter!! Who on earth would buy this company for $75 billion and add on $10 billion assuming the debt too?
|
|
|
|
|
Tesla did have an upside DeMark exhaustion yesterday but since the 8k came out and people caught on to the facts on the balance sheet how they are saying they burned less cash but also had owed money to suppliers spike higher. Today with the crazy action there is an upside 13 and it will stick. I bought more out of the money puts in this to define my risk.
|
|
|
|
|
|
|
|
|
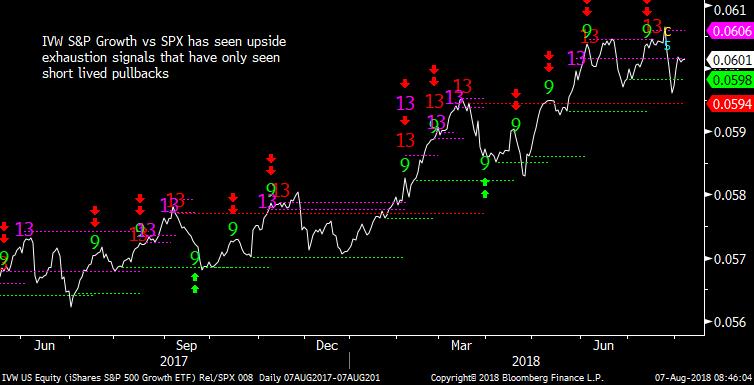
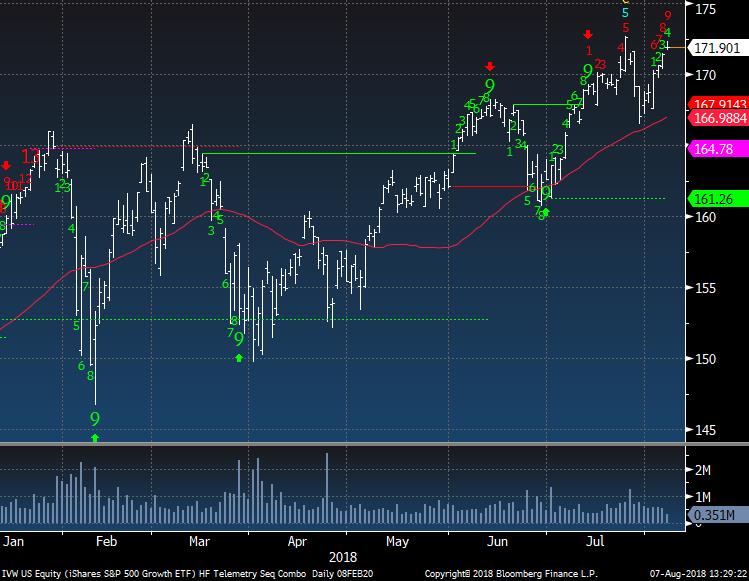
IVW Growth vs the SPX ratio. IVW Growth has 45% of the portfolio in internet, software, computers, and semiconductors
|
|
|
|
|
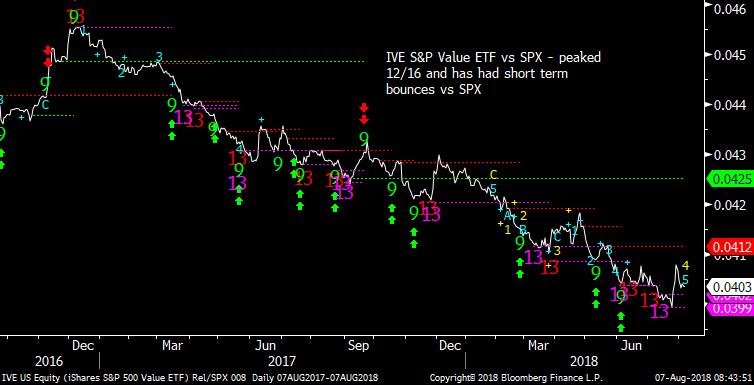
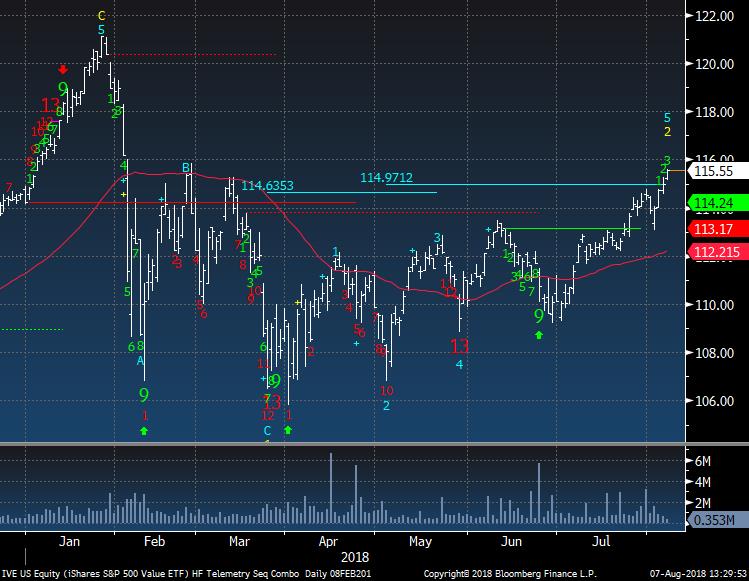
IVE Value vs SPX ratio. IVW has 40% in banks, oil and gas, insurance, and pharma
|
|
|
|
|
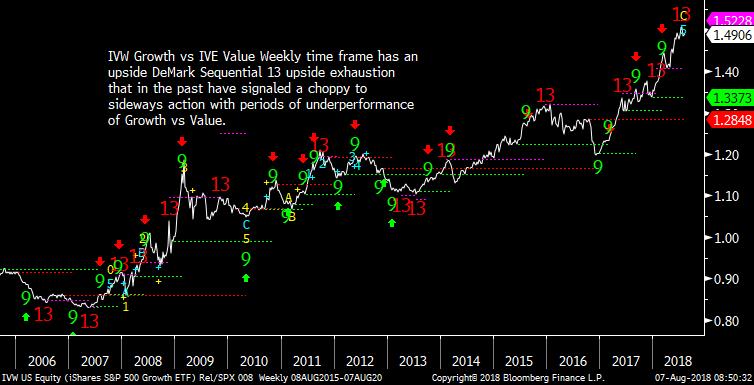
The weekly of the growth vs value is very extended with an upside exhaustion signal.
|
|
|
|
|
Growth on day 9 of 13 with an upside Countdown. It topped in January with one too
|
|
|
|
|
Value looks better as a long and could continue to break out
|
|
|
|
|
|
|
|
|
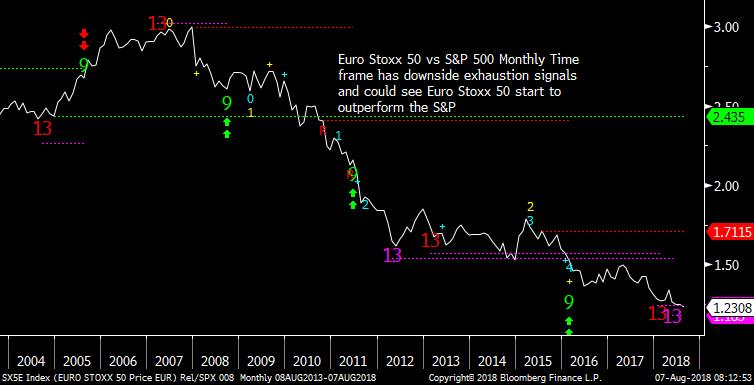
Euro Stoxx 50 vs S&P ration on a monthly time frame suggests Europe could start to outperform the US again soon.
|
|
|
|
|
|
|
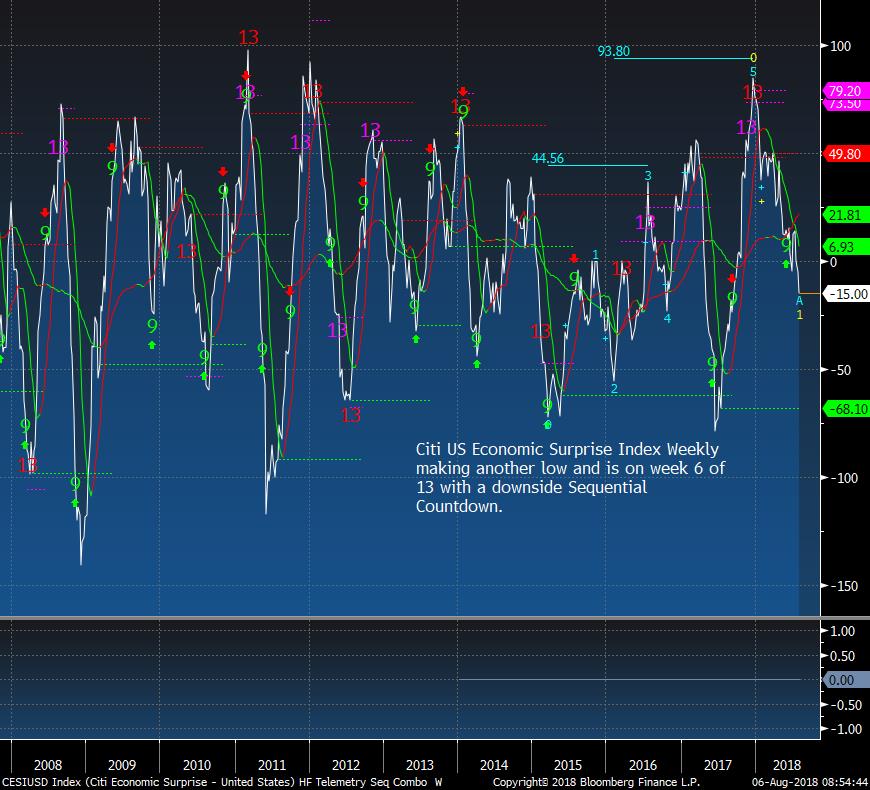
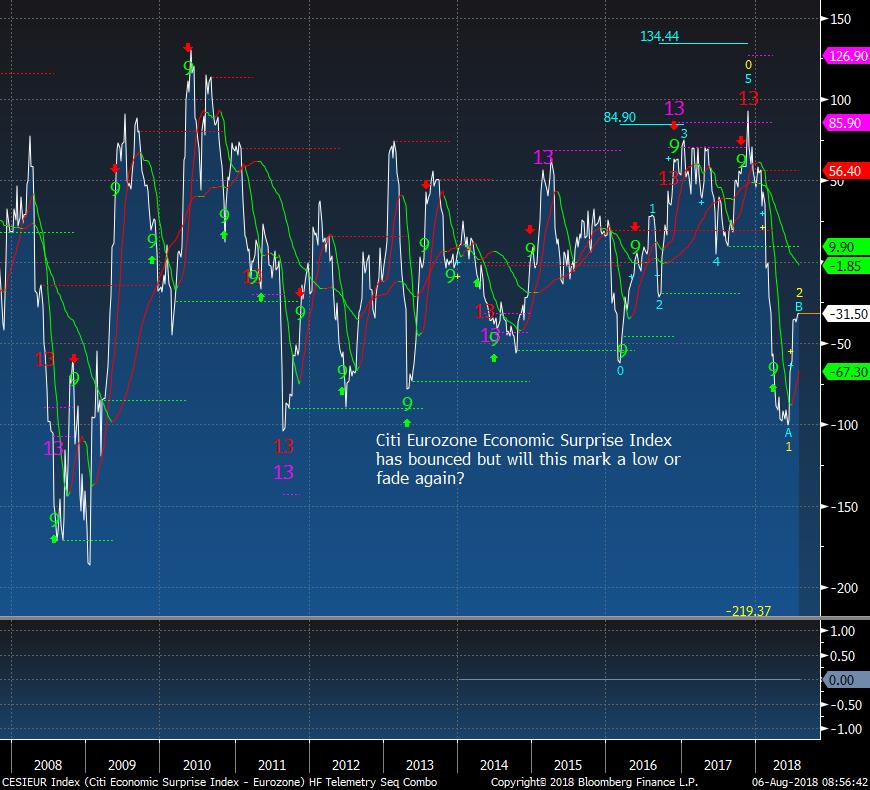
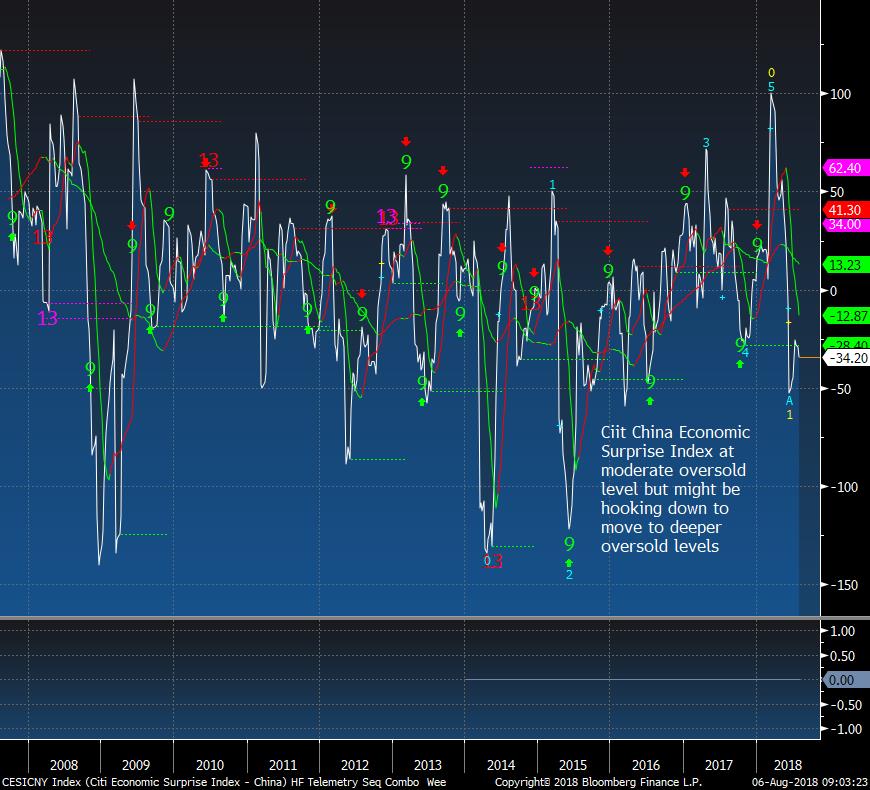
Citi Economic Surprise Indexes
|
|
|
|
|
|
|
|
|
|
|
China bounced but did not get to the very oversold levels in the past
|
|
|
|
|
|
|
|
|
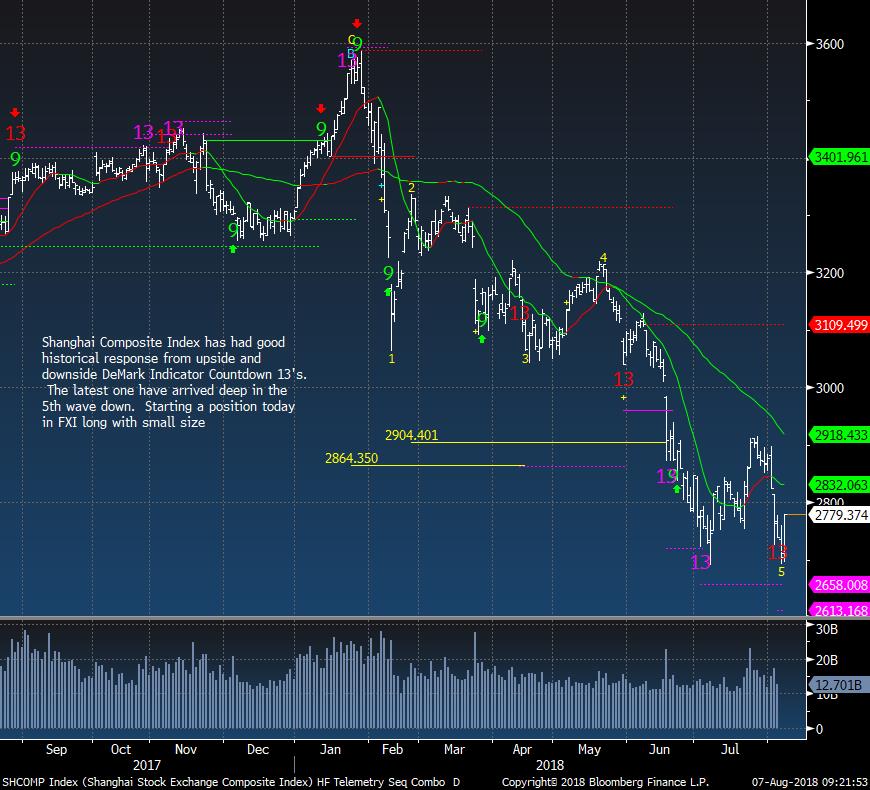
Shanghai bouncing after the recent downside exhaustion signal
|
|
|
|
|
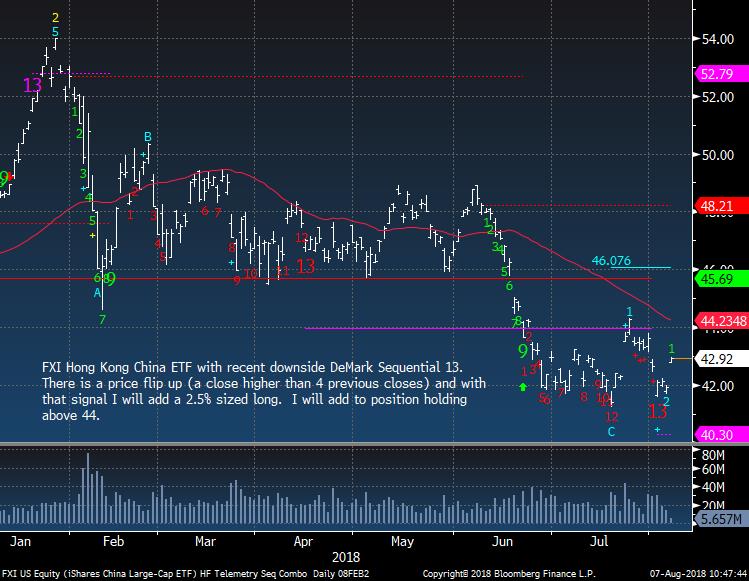
FXI Hong Kong China ETF price flip up with the green 1
|
|
|
|
|
India Nifty Fifty Inde on day 11 of 13 with the red Sequential although there is a pink Combo 13 in play
|
|
|
|
|
|
|
|
|
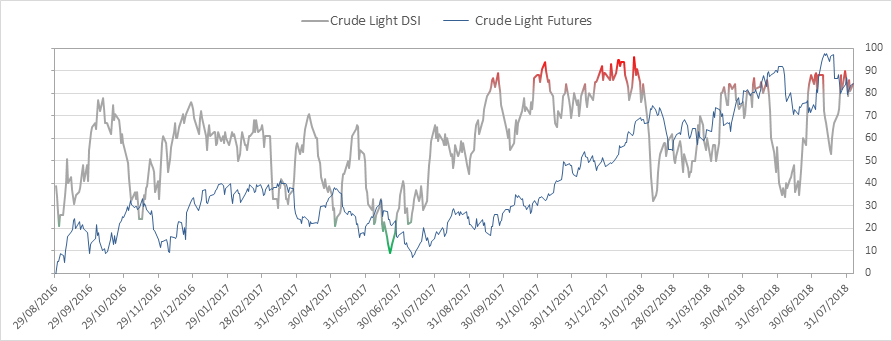
Crude bullish sentiment is at 84% and remains in the extreme zone
|
|
|
|
|
Crude still looks higher but not sure this will make a new high before the upside exhaustion
|
|
|
|
|
|
|
|
|
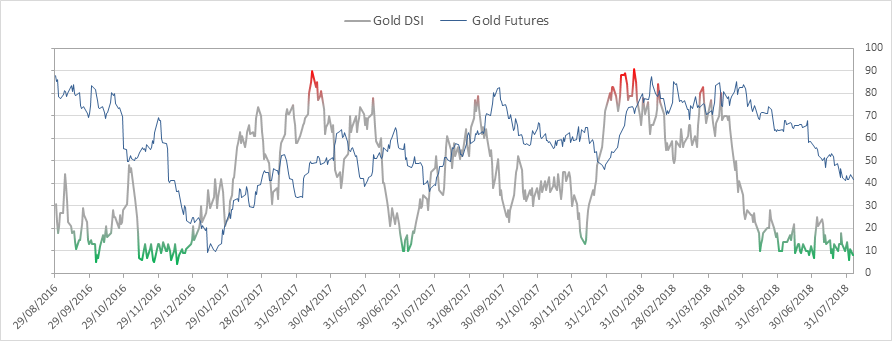
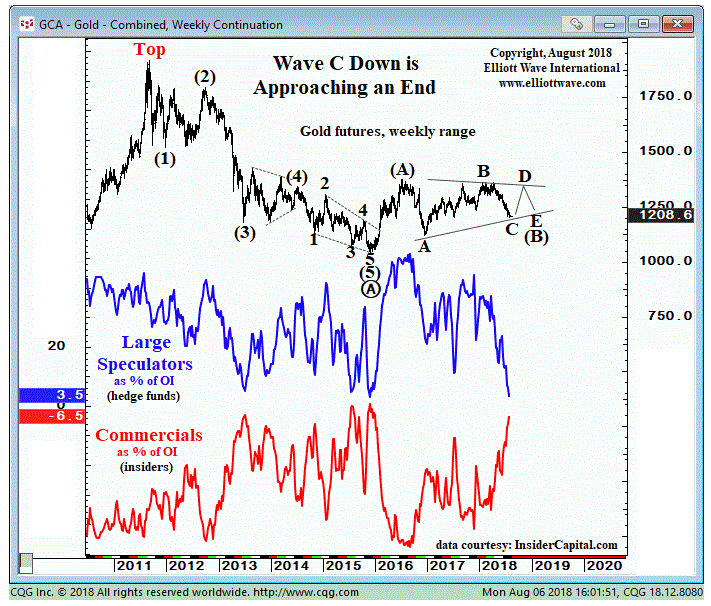
Gold bullish sentiment is at 8% and still is horrible
|
|
|
|
|
Here is a good chart from the Elliott Wave peeps showing the COT data with speculators and commercials. When speculators are set up very bullish or bearish like now, it pays to go against them
|
|
|
|
|
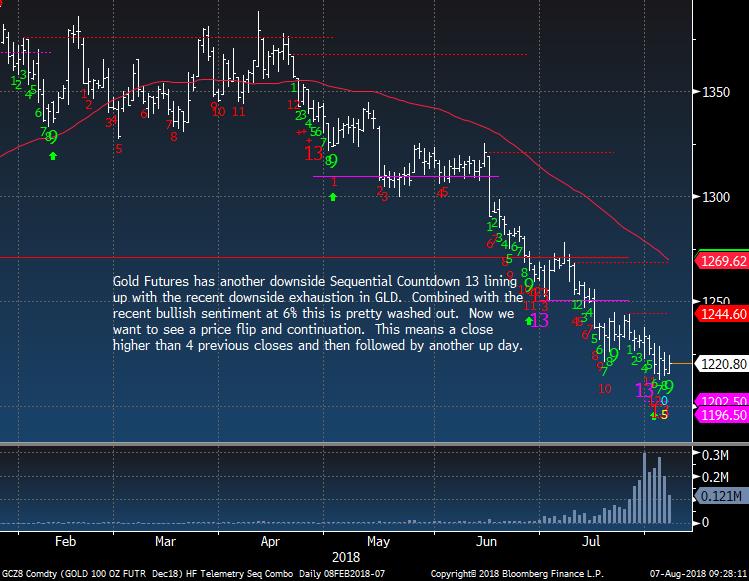
Gold futures still holding in here and must get moving up tomorrow
|
|
|
|
|
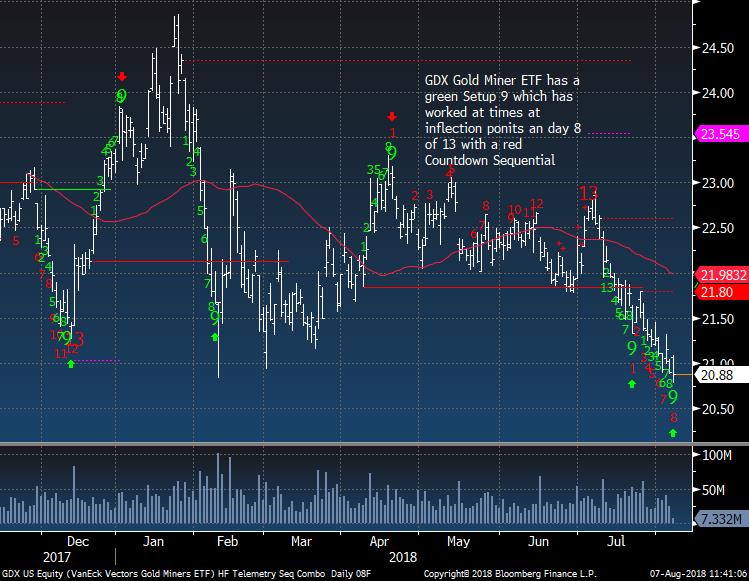
GDX Gold Miners has a green Setup 9 but still has a downside red Sequential Countdown
|
|
|
|
|
|
|
|
|
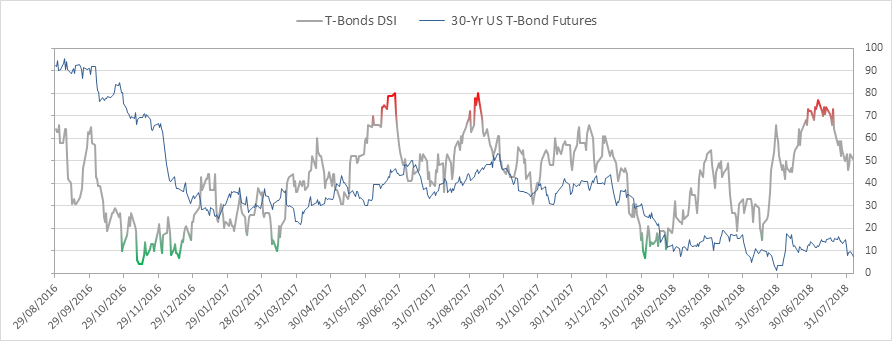
Bond bullish sentiment is at 51%
|
|
|
|
|
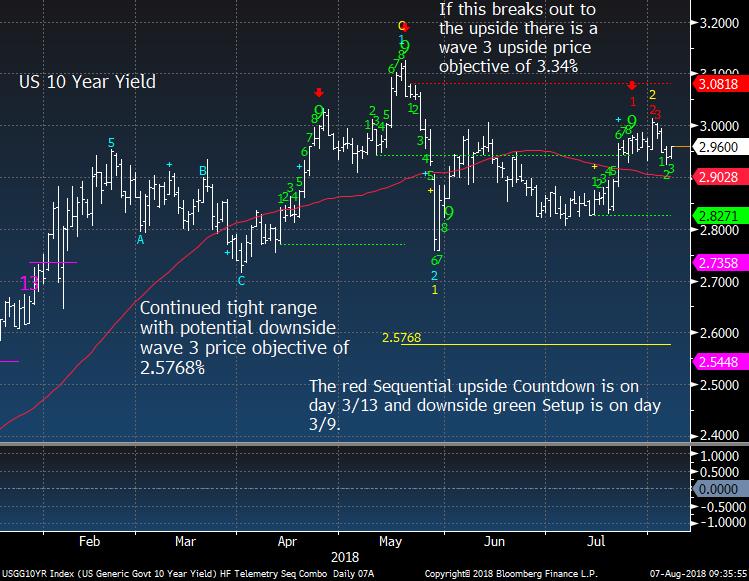
US 10 Year Yield still in a tight range.
|
|
|
|
|
|
|
DEMARK SCREENS - Daily, Weekly, Monthly Upside/Downside Exhaustion Signals
|
|
|
Daily/Weekly DeMark upside/downside exhaustion signals (Sequential) weekly updated on Monday's and monthly on the first day of the new month. Price flips occur when a stock closes higher/lower than four previous closes and increases conviction of a price turn.
The upside 13's are sell signals and downside 13's are buy signals. Price flip's are confirmation signals that increases potential for a price trend change. For example, if you are long a stock and there is an upside 13, you will want to take cautious action by selling down or out of a position. If initiating a short sale with the upside 13's, we tend to start with a 1/2 size and add with the downside price flip. The opposite is true for when there are downside 13's. Take a 1/2 size position
and add with the upside price flip. The DeMark Indicators are designed to assist the user with buying into weakness and selling into strength to anticipate trend exhaustion. Selling into a rally and buying into a decline often afford the opportunity to exit a trade without too serious a loss if wrong.
S&P 1500 Universe:
DAILY UPSIDE 13: ADM, AEE, AVB, BBY, CBT, CL, CMG, CMS, DUK, EGP, HR, KMB, LUV, NI, NSP, POST, SNA, VFC, WCN,
ZTS
DAILY DOWNSIDE 13: CBOE, CMC, KOP, NX, SGMS, PCH
DAILY UPSIDE WITH PRICE FLIP REVERSAL DOWN: CBM, CMS, DUK, HE, KRG, LQDT, MLI, NWN, SNA, UNP
DAILY DOWNSIDE WITH PRICE FLIP REVERSAL UP: NONE
Updated: 8/06/18
WEEKLY UPSIDE 13: AEO, CLH, ETN, GOOG, KLAC, NOG, PKI, PSX, ROK, SCI, SIGI, THC, UNP, XLNX
WEEKLY DOWNSIDE 13: HHS, TSN
Updated: 8/1/18
MONTHLY UPSIDE 13: AIZ, ATR, BIO, CBU, CDNS, CMS, CSX, DGX, EE, FCN, FIX, GTY, HAE, HAS, IDXX, IEX, KSU, MA, NI, NPK, PTC, RLI, ROL, WEC
MONTHLY DOWNSIDE 13: CIR, HIBB
Euro Stoxx 600 Universe:
DAILY UPSIDE 13: ETL FP, GFC FP, HEN3GR, SCHA NO, SRT3 GR, STMN SW
DAILY DOWNSIDE 13: DEC FP, EO FP
DAILY UPSIDE WITH PRICE FLIP REVERSAL DOWN: GPOR LN, IMB LN, ROR LN, TSCO LN
DAILY DOWNSIDE WITH PRICE FLIP REVERSAL UP: UTDI GR
Updated: 8/6/18
WEEKLY UPSIDE 13: DG FP, EDEN FP, HEXAB SS, ZAL, GR
WEEKLY DOWNSIDE 13: RYA ID
Updated: 8/1/18
MONTHLY UPSIDE 13: TEMN SW
MONTHLY DOWNSIDE 13: CO FP, GETIB SS, RXL FP, TALK LN
|
|
|
Unsubscribe me from Hedge Fund Telemetry
Hedge Fund Telemetry LLC, P.O. Box 4675, Greenwich, CT 06861, United States
CONFIDENTIALITY NOTE and DISCLAIMER: This message is for the named person's use only. It may contain confidential, proprietary or legally privileged material. No confidentiality or privilege is waived by any accidental or unintentional transmission. If you receive this message in error, please immediately delete it and all copies of it from your system, destroy any hard copies and notify the sender. You must not, directly or indirectly, use, disclose,
distribute, print or copy any part of this message if you are not the intended recipient. Hedge Fund Telemetry LLC. cannot guarantee the confidentiality of the material transmitted; therefore, information of a sensitive or confidential nature should not be transmitted. There is risk in trading markets. Hedge Fund Telemetry LLC reports are based on information gathered from various sources and believed to be reliable, but are not guaranteed as to accuracy and completeness. The information is subject to change without notice and Hedge Fund Telemetry LLC has no obligation to provide any updates or changes. Hedge Fund Telemetry LLC is providing this data for informational and educational purposes and does not believe that it is sufficient to base an investment decision on. This information should not be regarded as a solicitation or recommendation of any particular security or to engage in any trading strategy. One should always check with your licensed financial
advisor to determine suitability of any investments.
|
|
|
|
|
|
|